|
|
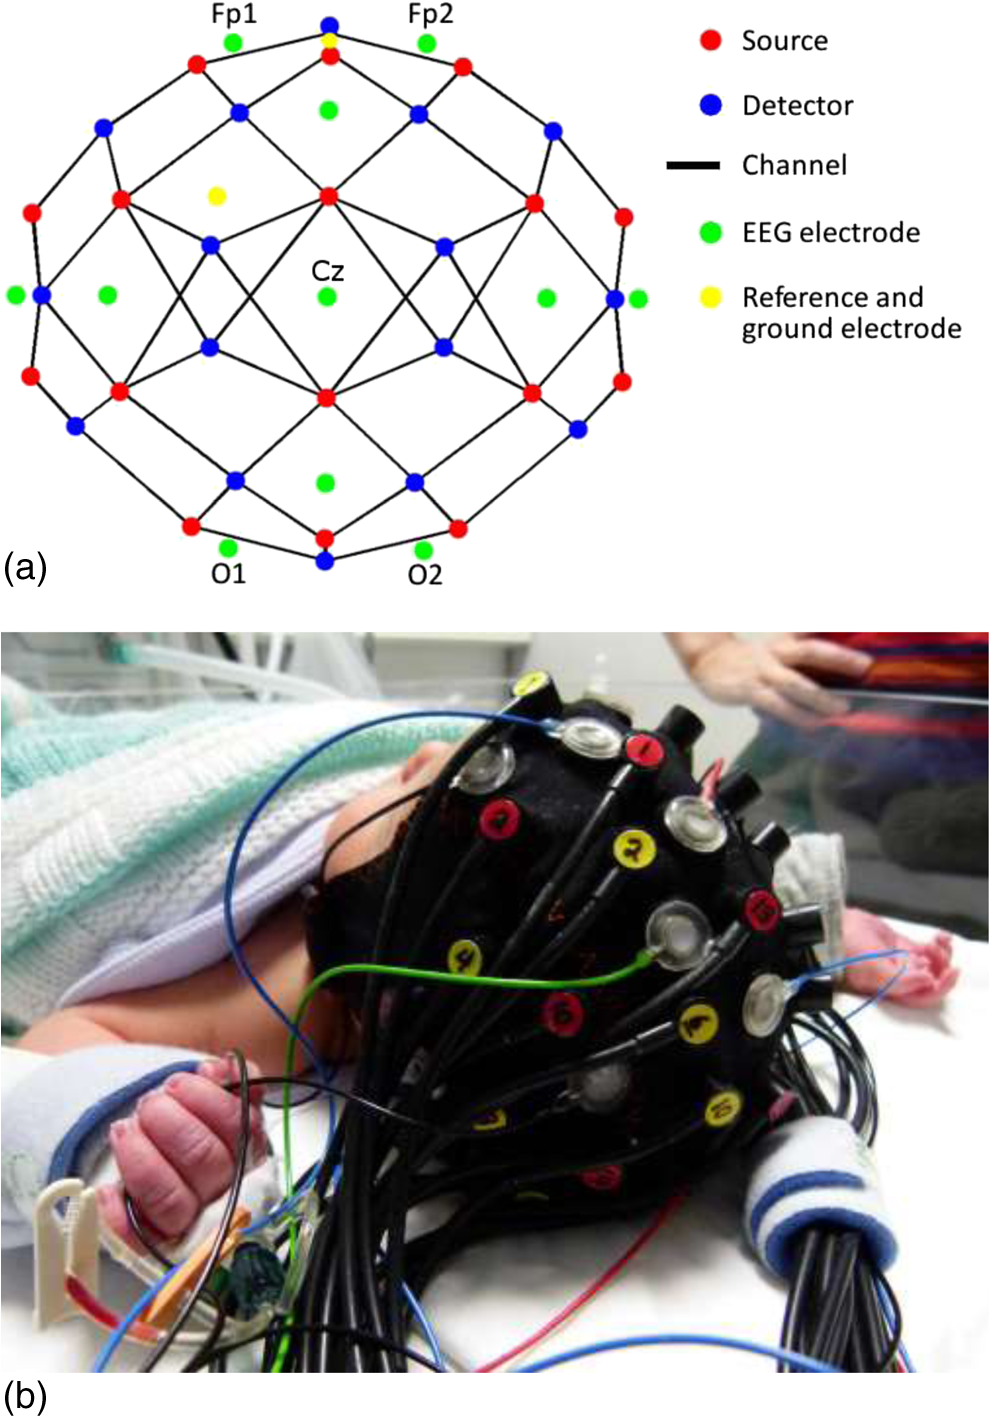
1.IntroductionBurst suppression (BS) is an electroencephalographic pattern defined as a periodic alternation between high-voltage slow, occasionally sharp waves (bursts), and depressed or suppressed low-voltage activity [interburst intervals (IBIs)].1 It is considered to be indicative of global brain inactivation and can be secondary to a variety of factors, including infant encephalopathies,2 deep anesthesia,3 hypoxic ischemic trauma,4 coma,4 and hypothermia.5,6 It is strongly associated with adverse prognosis and impaired neurodevelopmental outcome.7–9 BS is also often observed in the term and near-term infant population secondary to hypoxic ischemic encephalopathy (HIE). HIE is the result of a severe perinatal deficit in cerebral blood flow and oxygen delivery, leading to the disruption of cerebral energy metabolism.10 Despite recent advances in the care and management of such infants, HIE remains the leading cause of acquired neurodisability in the term neonatal population.11 The precise definition of what constitutes BS in neonatal electroencephalography (EEG) remains an issue of debate. The standard neonatal EEG texts define BS as when the IBI activity presents with amplitude of .12 When the IBI amplitude is above this threshold, but remains , the EEG is referred to as “discontinuous” (tracé discontinu).12 However, other sources have used different upper thresholds of IBI amplitude to define BS, including 10,13 20,14 or .15 It is also important to note that in preterm infants of weeks gestational age (GA), a discontinuous EEG trace is expected and is considered as a normal developmental phenomenon.12 Discontinuous EEG is also apparent during different sleep states in infants between 34 and 38 weeks GA and it is referred to as tracé alternant.12 Conversely, a discontinuous EEG pattern in the term-age infant, with no variability over the sleep-wake cycle is representative of neuropathology. In term infants with HIE, the severity and persistence of discontinuous or burst-suppressed EEG has traditionally been used as a key factor to predict prognosis and neurodevelopmental outcome.16–18 Numerous studies have shown that the rate of recovery of electrocortical activity to a continuous state is closely related to outcome, and that the longer the EEG remains discontinuous, the higher the risk that an infant will develop neurodisability. For example, van Rooij et al.18 demonstrated that 61% of term infants that recovered to a continuous EEG trace within 24 h survived with either mild disability or no disability. Menache et al.19 showed that the presence of IBIs with a predominant duration of over 30 s in term infants was always associated with severe disability or death. Recent investigations of BS in HIE infants have focused on developing more objective EEG markers of neurodevelopmental outcome. It has been demonstrated that certain parameters of the burst-suppressed EEG, including the distributions of the area under the curve of the burst (burst area) and burst duration predict clinical outcome with a comparable power to structural neuroimaging and neurodevelopmental assessment tools.13 A recent study applied a coherence mapping approach to identify neuronal networks within the burst and suppression phases of neonatal EEG, suggesting a spatial distribution of BS electrocortical activity that is likely related to the underlying hypoxic ischemic injury and potentially to the functional and developmental state of the brain.15 Several animal studies have combined EEG with functional neuroimaging techniques [such as blood-oxygen-level-dependent functional magnetic resonance imaging (MRI), (BOLD fMRI)] to investigate cerebral hemodynamics and neurovascular coupling during BS induced via anesthesia.20–21 In 2014, Sutin et al.22 used a simultaneous near-infrared spectroscopy (NIRS) and EEG methodology to investigate the hemodynamic responses associated with isoflurane-induced BS in the rat. Such multimodality imaging approaches have the potential to elucidate the fundamental physiological, neurovascular and neuroenergetic characteristics of the BS and discontinuous EEG state, but can also allow the spatial characteristics of these states to be investigated. There is currently a paucity of functional imaging studies of critically ill human infants with pathological EEG, primarily because of the logistic and clinical challenges of such experiments. Simultaneous diffuse optical tomography (DOT) and EEG (DOT–EEG) provides a safe and noninvasive methodology for studying vulnerable infants at the cot-side during the acute phase of their hospital admission. Previous investigations by our group have applied DOT–EEG to identify abnormal, transient hemodynamic features in severe HIE infants that present no electrographic correlate23 and to examine the hemodynamic response to neonatal seizures.24 The principle aim of this study is to investigate (for the first time) whether burst-suppressed and discontinuous EEG states in HIE infants are associated with an observable hemodynamic response. Such a response is likely to provide new information about the spatial and neurophysiological characteristics of these states. 2.MethodsThis study was approved by the National Research Ethics Service Committee East of England (REC Reference 09/H0308/125). The work presented here is part of a larger study of neurovascular coupling in acquired brain injury in preterm and term neonates using DOT and video EEG. 2.1.PatientsFollowing informed parental consent, infants were recruited to the study upon their admission to the neonatal intensive care unit (NICU) at the Rosie Hospital of Cambridge University Hospitals NHS Foundation Trust. Eligibility was determined on the basis of clinical evaluation, a GA at birth of weeks and the diagnosis of HIE. Diagnosis of HIE was made according to clinical presentation and severity according to the Sarnat classification.25 The patients were assessed for eligibility for therapeutic hypothermia (TH) based on the total body (TOBY, whole body hypothermia for the treatment of perinatal asphyxial encephalopathy) cooling criteria.26,27 Infants with antenatally diagnosed congenital abnormalities, or those with a strong clinical suspicion of skull fracture or a neurosurgical diagnosis (i.e., subgaleal haemorrhage and subdural haemorrhage) were not eligible for inclusion in this study. All infants received 72 h of whole-body TH as part of the clinical treatment for HIE. Passive cooling was commenced from the referring hospital within 6 h postbirth and active cooling was initiated by the transport services and continued upon arrival to the Rosie Hospital NICU. The study was conducted during TH or the rewarming phase. One infant was studied after the rewarming phase. 2.2.Data AcquisitionThe infants were studied at the cot-side in the NICU while receiving intensive clinical care and treatment. Continuous-wave DOT data were acquired using the UCL Optical Imaging System.28 This device employs 16 dual-wavelength laser-diode sources operating at 780 and 850 nm, and 16 avalanche photodiode detectors with a sampling frequency of 10 Hz. Video-EEG data were obtained using either a Micromed SystemPlus clinical EEG system (Micromed S.p.A., Italy) or (latterly) a BrainVision V-Amp system (Brain Products GmbH, Germany). The sampling frequency of both systems was 250 Hz. To allow simultaneous DOT–EEG with full scalp coverage, an integrated infant head-cap was employed that incorporates 32 optical fiber bundles (Loptek GmbH & Co. KG) and 13 annular Ag/AgCl EEG electrodes (EasyCap GmbH, Germany). Both the optical fiber bundles and EEG electrodes are coupled into a flexible head-cap (EasyCap GmbH, Germany) that was chosen on the basis of head-size prior to each study [see Fig. 1(b)]. The positions of the optical fibers are based on the 10-5 system29 and provide a total of 58 channels across the infant scalp [Fig. 1(a)]. The source–detector distances in the array range from a minimum of 20 to a maximum of 40 mm. The positions of the EEG electrodes conformed to the standard neonatal EEG montage (Fp1, Fp2, Fz, T3, T4, C3, Cz, C4, Pz, O1, and O2) with reference and ground electrodes at AFpz and FC1, respectively. Abrasion gel and conductive paste were applied to ensure EEG electrode impedances were kept below . ECG monitoring was also performed to facilitate artifact recognition in the EEG trace. The DOT and EEG systems were synchronized using a custom-made external trigger generator. 2.3.Electroencephalography Analysis and Burst IdentificationThe EEG recordings were assessed by using the BrainVision Analyser (Brain Products GmbH) and EEGLAB30 software packages. Standard filtering was applied with a high-pass filter at 0.5 Hz and low-pass filter at 70 Hz, with an added notch filter at 50 Hz. The EEG traces were then reviewed by a clinical neurophysiologist (author A.M.) who reported on the quality of the recording, the background state (i.e., continuous, discontinuous, or burst suppressed), the presence of any asymmetry between the two hemispheres, cyclicity (between awake and sleep state) and also the presence of abnormal rhythmic activity or seizures. EEG traces that were identified as discontinuous or burst suppressed, but without the presence of seizures, were selected for further analysis. The IBI amplitude of these EEG traces was . Subsequently, the EEG data sets were subject to a manual burst-identification process (performed by author M.C.). After motion and ECG artifacts were excluded, the onset and offset of each burst were identified based on the strict criterion that prior to each burst there should be an IBI of in duration. Both discrete bursts and IBIs themselves were marked. Bursts were independently identified in a subset of EEGs by a second observer (author C.W.L.) in order to support the objectivity of the burst-identification process. 2.4.Diffuse Optical Tomography Processing and the Hemodynamic ResponseAfter the EEG and DOT data sets had been synchronized, and the burst onset and offset markers were transformed to the DOT time base, the DOT data were preprocessed using modified versions of functions from the Homer2 NIRS processing toolbox.31 First, channels were excluded from each data set on the basis of a simple intensity threshold, and on visual inspection of their frequency content (this was necessary due to the impact of high-frequency oscillatory ventilation, in infants that required this for ventilatory support). If more than 15 channels were excluded from any one DOT data set, that infant was removed from the study. The raw intensity data were then converted to optical density, and periods of motion artifact were identified using a combination of visual inspection and Homer2 motion artifact detection approaches32 prior to bandpass filtering in the range of 0.01 to 1 Hz. To extract the hemodynamic response to the EEG bursts in each data set, the bursts were first subdivided on the basis of duration into 2-s wide bins over the range of 0 to 30 s. Bins containing bursts were neglected. The burst onset markers associated with each bin were then treated as separate conditions in an event-related general linear model of the DOT data (such that the model contained a 0- to 2-s burst condition, a 2- to 4-s burst condition, etc.). The general linear model was constructed using a series of Gaussian basis functions (with a standard deviation of 2 s and separated by 1 s), to model the hemodynamic response function (HRF) associated with each burst duration. The model also included zeroth- to third-order polynomial drift regressors. The time range of the modeled HRF was set to to 40 s relative to the burst onset markers. This approach resulted in an HRF for each accepted DOT channel, burst duration bin and infant. To provide an objective representation of the morphology of the spatially varying hemodynamic response to bursts in each infant (as opposed to arbitrarily selecting a channel to display or taking an average), we used a principal component analysis (PCA) approach. A PCA was performed across the accepted channels in each data set. An HRF was then produced for each infant by combining the components required to account for 80% of the signal variance. To ensure that any extracted HRF was not an artifact of the data processing procedure, and was directly temporally correlated with the EEG bursts, additional HRFs were computed using 10 randomly generated dummy onset vectors in place of the burst onset markers for each data set. These dummy vectors contained the same number of “events” as the largest number of bursts in any one bin for each infant. A one-tailed, Bonferroni-corrected -test was then performed to identify channels in which the hemodynamic response to EEG bursts is statistically distinguishable from a vector produced by concatenating the 10 dummy HRFs. 2.5.Image ReconstructionThe last step in the DOT processing stream was to reconstruct images of the hemodynamic response to EEG bursts of a given duration. Using the 10-5 positions of the DOT fiber bundles and the TOAST++ finite element photon transport modeling package,33 a forward model was computed in an age-matched, 5-layer volumetric finite element mesh selected from the UCL 4D neonatal head model.34 Images of changes in oxyhemoglobin concentration (HbO) and de-oxyhemoglobin concentration (HbR) were reconstructed for every 1 s of data, relative to the mean of the first 10 s of data in each HRF. Images were reconstructed in the volumetric mesh, using a multispectral linear reconstruction and zeroth-order Tikhonov regularization. Each image was then projected to the associate gray-matter surface mesh for visualization using a 5-mm spherical blurring kernel. 3.Results3.1.Clinical DataBetween March 2013 and September 2015, 23 infants fulfilled the eligibility criteria and were recruited to the study. Of these, nine presented with either BS or a discontinuous EEG trace with IBI amplitude of and no variability due to sleep state during the recording. Three infants were then excluded because more than 15 DOT channels were rejected, leaving a total of six data sets suitable for analysis. The clinical information pertaining to these six infants is provided in Table 1. The median GA at birth was weeks (range from to weeks). The median age of the infants at the time of the study was 3.5 days (with a range from birth to 7 days of life). The length of the DOT–EEG recording ranged from 47 to 115 min with a median of 59 min. Table 1The clinical details of each patient. The respiratory and cardiovascular status of each infant reflects their condition during the study. The neurological status reports the clinical presentation of the infants prior to recording. The MRI findings summarize standard clinical reports on T1- and T2-weighted MRI images obtained after day 7 of life.
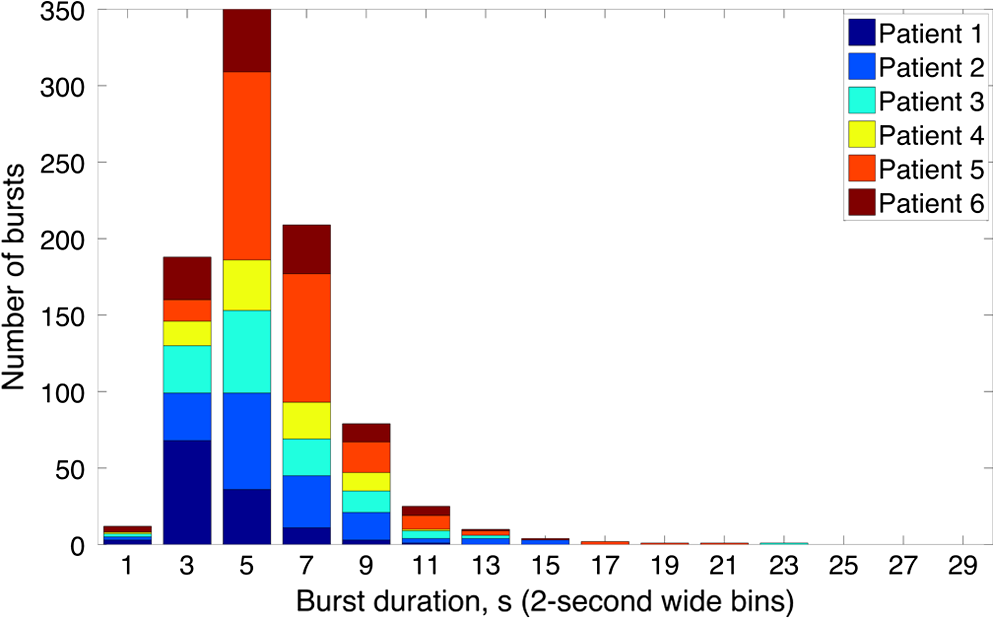
Note: SVIA, self-ventilating in air; HFOV, high-frequency oscillation mode of ventilation; SIMV Vg, synchronized intermittent mandatory ventilation; CVS, cardiovascular system; WM, white matter; BG, basal ganglia; TS, transverse sinus; SSs, sagittal sinuses; and PLIC, posterior limb of the internal capsule. All infants presented with seizures in the first 48 h of life and received either one or three types of anticonvulsant treatment prior to (or in one case during), the DOT–EEG study. All infants had stable levels of carbon dioxide partial tension () within the normal range (4.7 to 6.0 kPa)35 throughout the study. Two of the infants were receiving inotropic support during the study to maintain a stable systemic arterial blood pressure. Each infant underwent a structural MRI between 7 and 10 days of life as per the standard clinical care protocol and all received a final diagnosis of HIE. All six infants survived and were either discharged back to the referring hospital or to home. 3.2.Electroencephalography DataThe total number of bursts identified in each infant ranged from 87 to 257, with a median of 129. An example of an identified burst is provided in Fig. 2. The vast majority of bursts had duration of between 1 and 7 s. The single most common burst duration across the group was 4 to 6 s. A histogram of burst durations by infant, binned as per the DOT analysis, is provided in Fig. 3. A simple interobserver comparison performed in a subset of infant EEGs indicated that for every burst onset identified (by author M.C.), a burst onset was independently identified (by author C.W.L.) within an error of 1.5 s in 84% of cases. 3.3.Diffuse Optical Tomography Data and the Hemodynamic Response to Electroencephalography BurstsThe number of DOT channels rejected across the six infants ranged from 2 to 9, with median of 4 (from a total of 58 channels). HRFs were successfully extracted for burst durations in the range of 2 to 4, 4 to 6, 6 to 8, 8 to 10, and 10 to 12 s across the group of six infants, but only the ranges 2 to 4, 4 to 6, and 6 to 8 s contained enough bursts to produce HRFs for all six infants. The proportion of DOT channels exhibiting a statistically significant HbO response to bursts with duration 4 to 6 s ranged from 30% in patient 2 to 100% in patient 5. Figure 4 shows the channel-wise hemodynamic response to EEG bursts of 4- to 6-s durations in infant 1. A pronounced response is clearly apparent on the majority of channels, with clear spatial variation in amplitude and morphology. Figure 5 shows the PCA-extracted representative hemodynamic response to 4- to 6-s duration bursts in all six infants. Note that the number of components required to account for 80% of the channel-wise variance varied from 1 to 3 components across the six infants. A marked response is apparent in each patient, and there is notable consistency in the shape of that response across the group. There is typically a pronounced decrease in HbO slightly prior to, or during the burst activity, followed by a large increase that reaches a peak after the burst onset before returning toward the baseline and exhibiting an undershoot. Only in infant 5 does the HbO response shape differ, the initial dip is not apparent during the burst activity, but the peak increase in HbO occurs at a similar time to that of the other infants. The HbR response is more variable, but in all cases shows a notable increase that reaches a peak between 10- and 20-s postburst onset. Fig. 4A schematic representation of the deconvolved HRFs to bursts lasting from 4 to 6 s in infant 2. The arrangement of the channels is based on the DOT channel layout [see Fig. 1(a)]. Note some channels are not displayed either due to rejection or for visualization purposes. 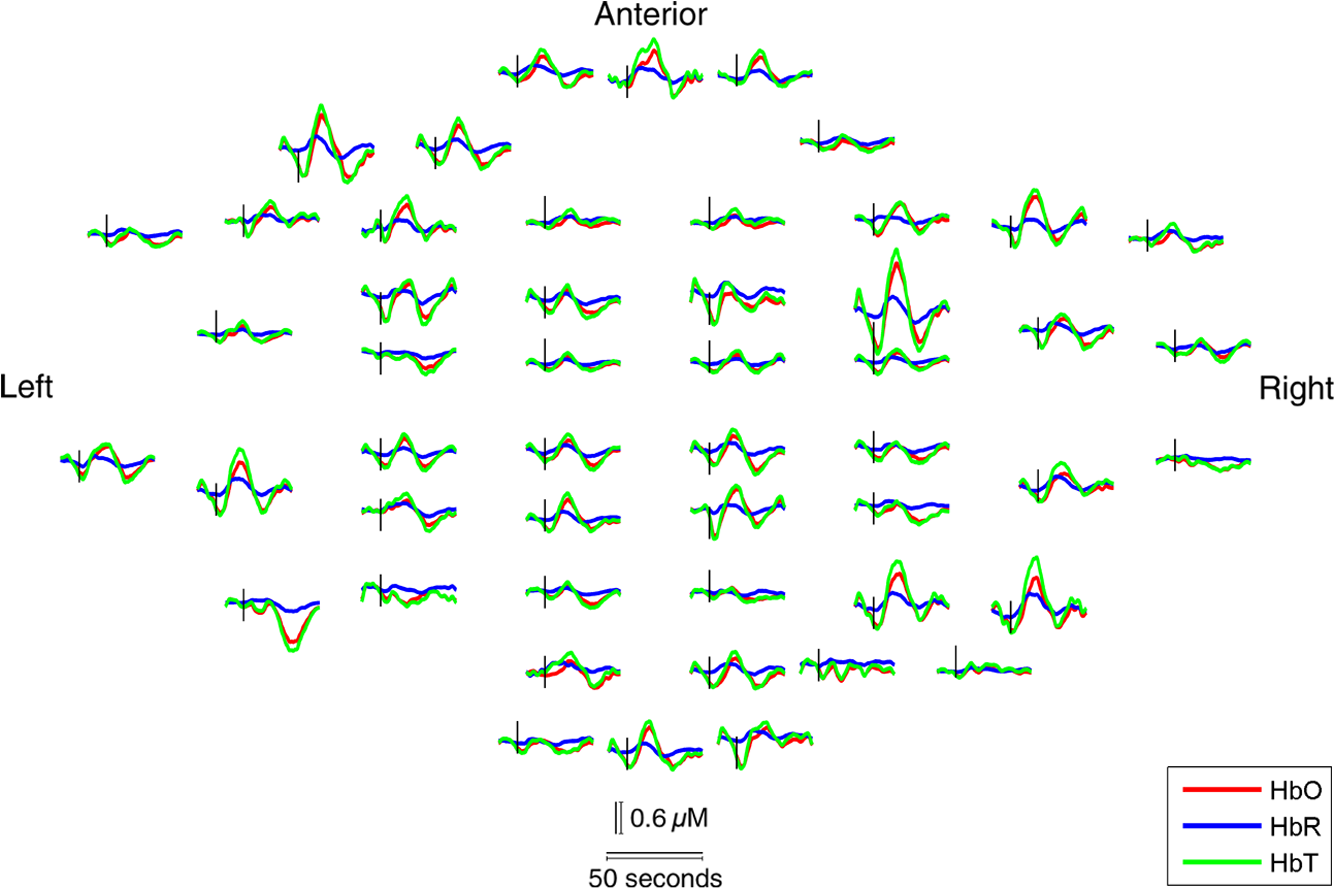 Fig. 5This figure depicts the PCA-extracted representative hemodynamic response to bursts lasting between 4 and 6 s in each infant. The gray-shaded area indicates the period of the average duration burst. The value of “” in each case indicates the number of bursts between 4 and 6 s identified in each infant. 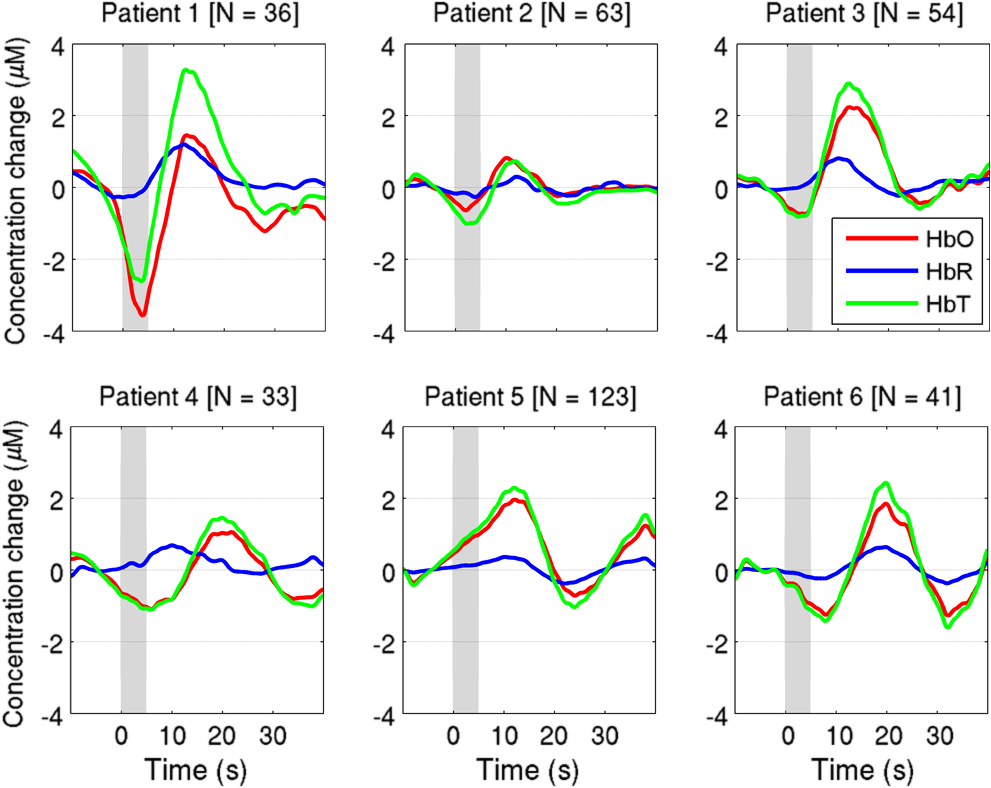 3.4.Diffuse Optical Tomography Images of the Hemodynamic ResponseFigure 6 shows three views of the reconstructed cortical image of changes in HbT for patient 3 at the minima of the initial dip (as defined from the PCA-extracted representative response, Fig. 5). A small decrease in HbT is apparent across most of the cortex, but the most marked changes occur in the bilateral temporal and temporal–parietal regions. Figure 7 shows data from the same infant specifically at the peak of the increase in HbT, which occurs at postburst onset. The frontal poles, right temporal, and left parietal regions exhibit the largest increases in HbT, while the occipital cortex displays a slight decrease. Note that the combination of regions that show a pronounced increase in HbT during the peak phase (see Fig. 7) are not completely consistent with those exhibiting the largest decreases in HbT during the initial-dip phase of the hemodynamic response (see Fig. 6). Fig. 6The reconstructed HbT image associated with the initial dip in the response to 4- to 6-s duration EEG bursts for infant 3. These images represent the change in HbT at the time point indicated by the black vertical line in the lower panel, which shows the PCA-extracted representative response for this infant. Note that the most significant decrease in HbT is localized to the bilateral temporal–parietal boundary. See Video 1 (MOV, 7.49 MB) [URL: http://dx.doi.org/10.1117/1.NPH.3.3.031408.1]. 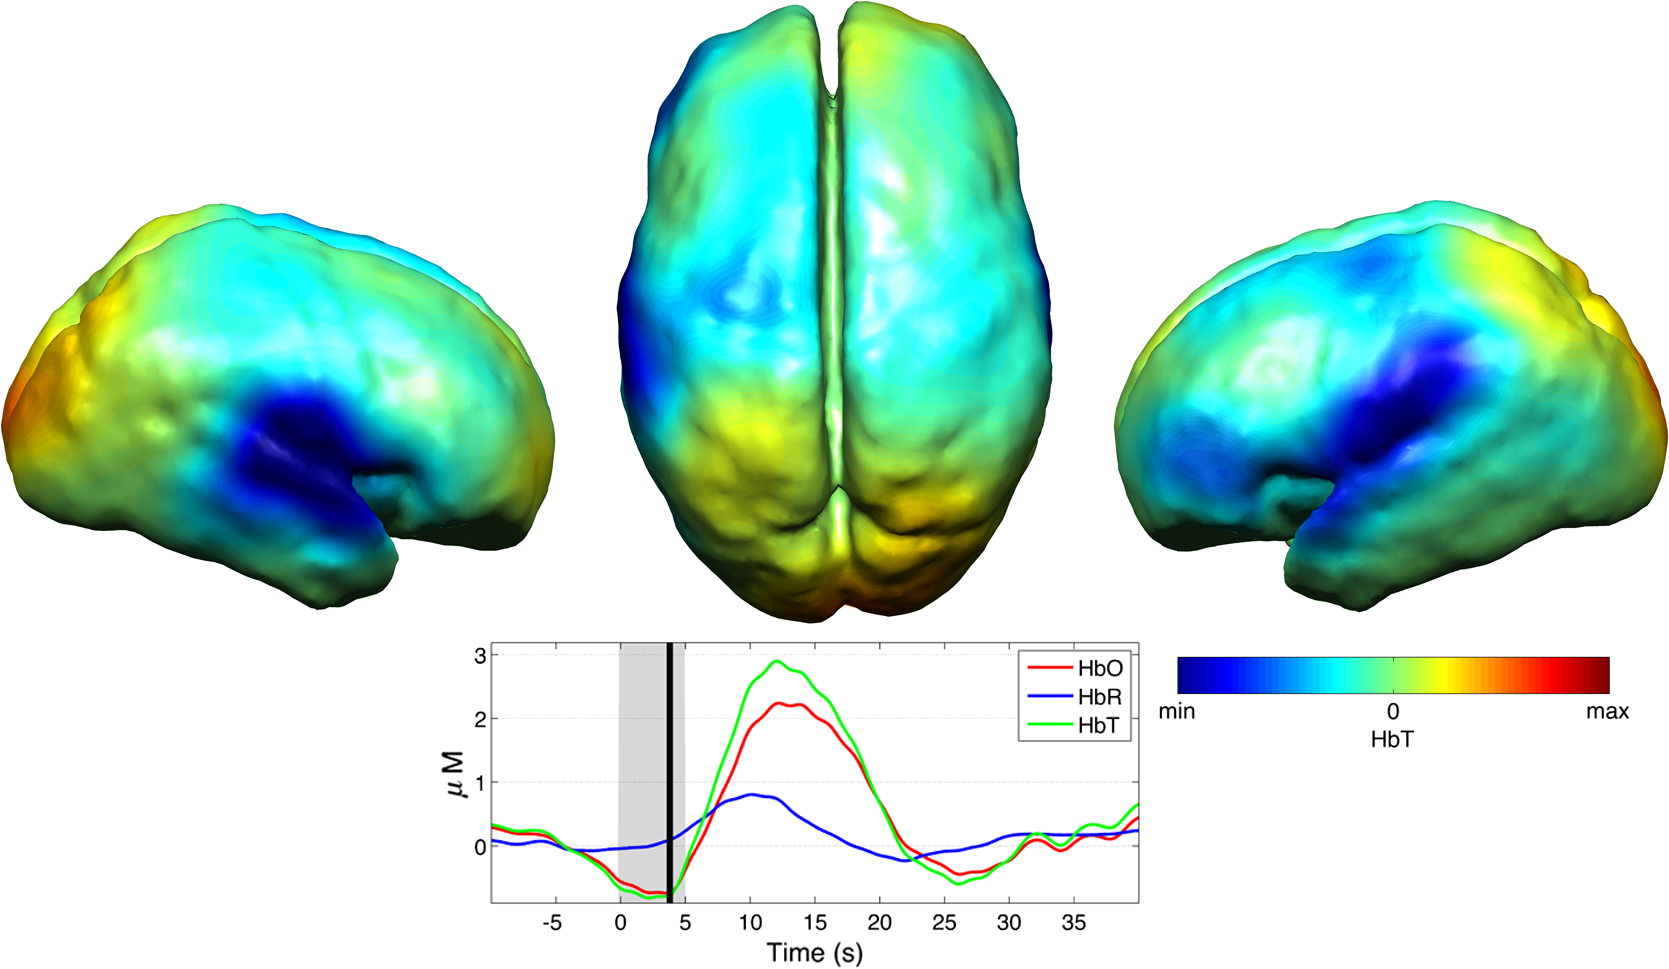 Fig. 7The reconstructed HbT image associated with the peak increase in the response to 4- to 6-s duration EEG bursts for infant 3. These images represent the change in HbT at the time point indicated by the black vertical line in the lower panel, which shows the PCA-extracted representative response for this infant. Note the marked increase in HbT in the prefrontal cortex (see also Video 1). 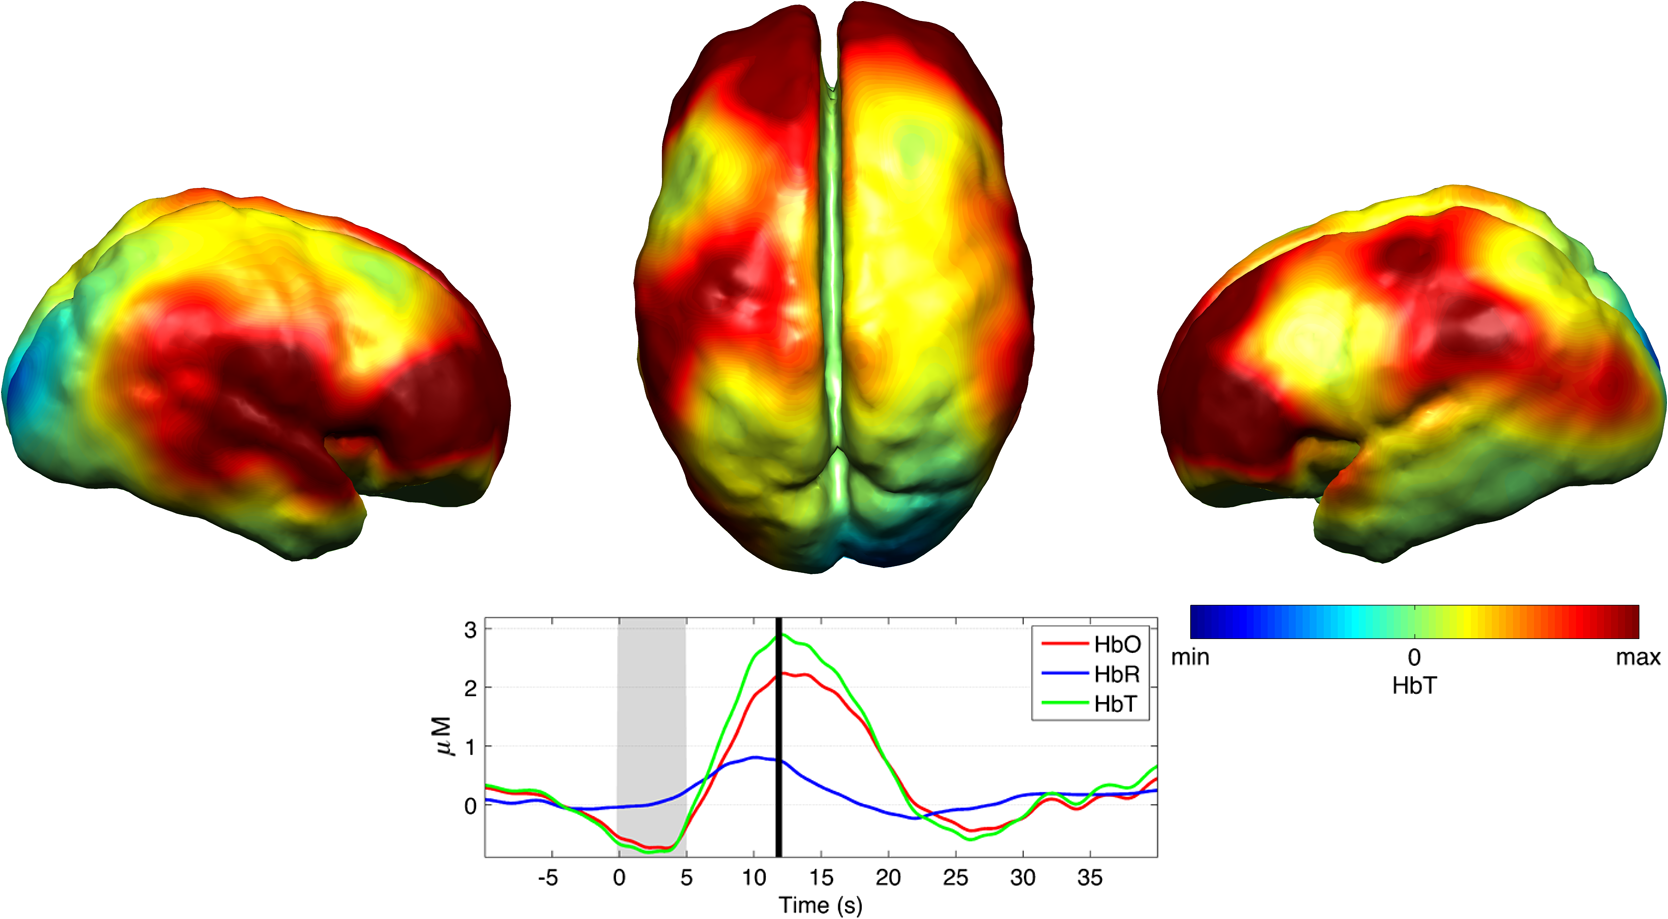 Figure 8 shows the reconstructed cortical image of HbT at the peak of the postburst increase in patient 5. The increase is broadly global, but with the largest increases occurring in both temporal lobes. Note also the apparent lack of a response over the right parietal lobe. Lastly, Fig. 9 shows the HbT image associated with the undershoot phase in patient 5, which shows the largest decreases occurring in the bilateral frontal cortices. Fig. 8The reconstructed HbT image associated with the peak increase in the response to 4- to 6-s duration EEG bursts for infant 5. These images represent the change in HbT at the time point indicated by the black vertical line in the lower panel, which shows the PCA-extracted representative response for this infant. Note the marked increases in HbT in the bilateral temporal regions and the absence over the right superior parietal area. See Video 2 (MOV, 8.19 MB) [URL: http://dx.doi.org/10.1117/1.NPH.3.3.031408.2]. 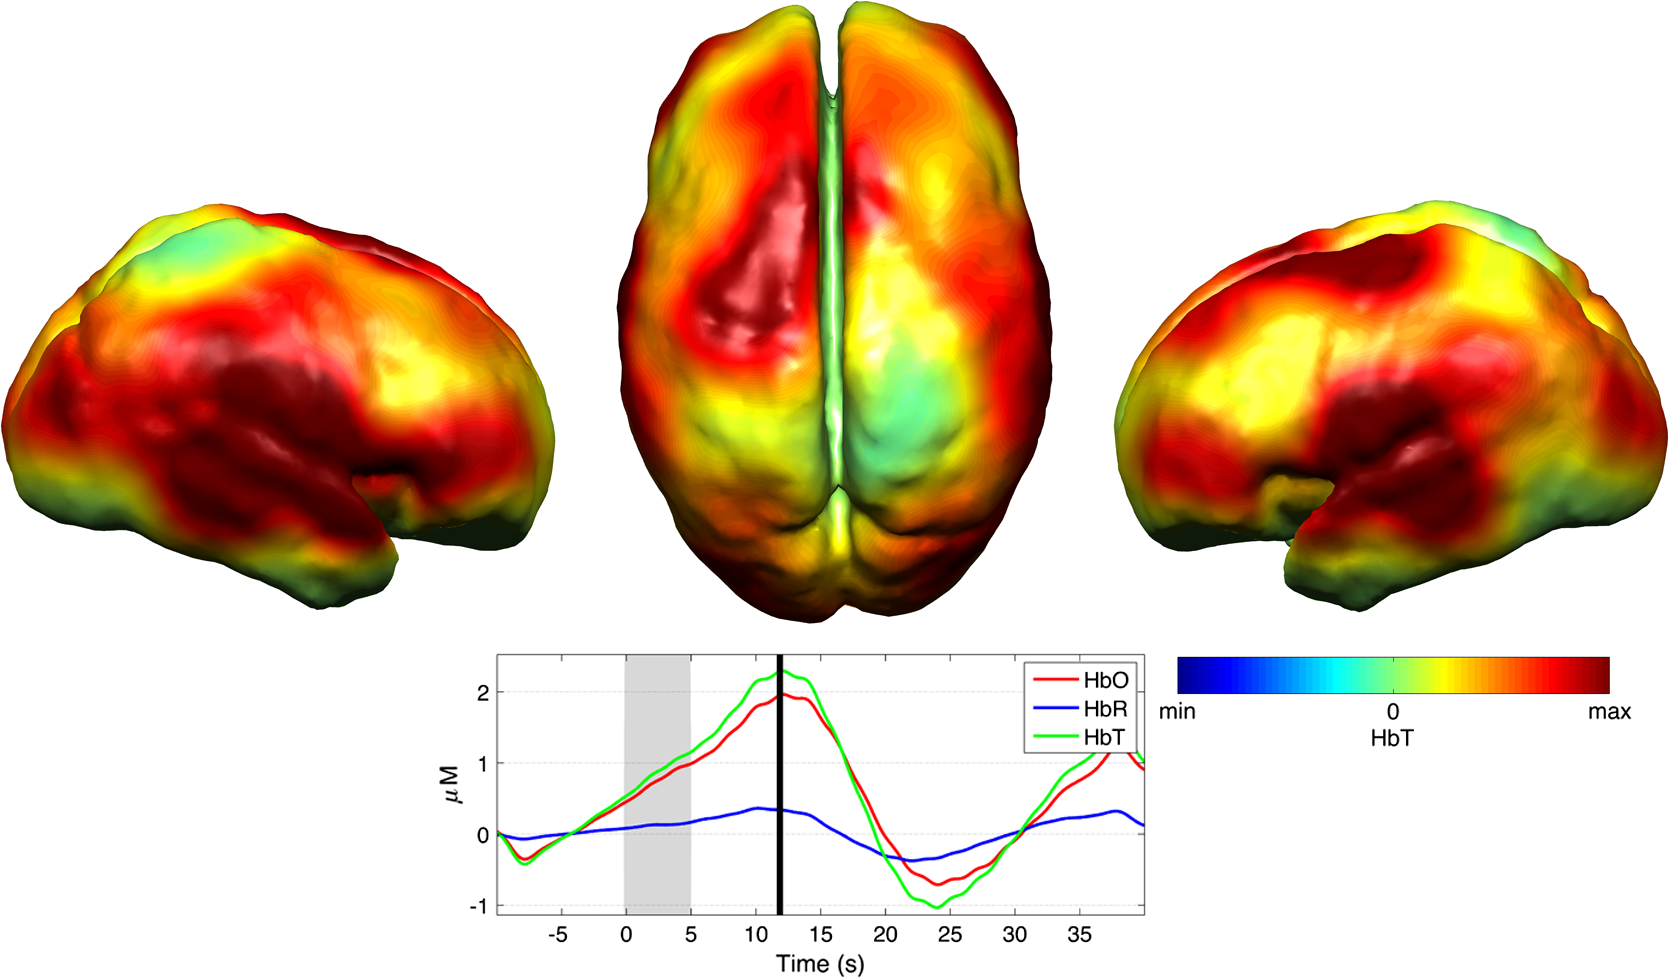 Fig. 9The reconstructed HbT image associated with an undershoot in the response to 4- to 6-s duration EEG bursts for infant 5. These images represent the change in HbT at the time point indicated by the black vertical line in the lower panel, which shows the PCA-extracted representative response for this infant. Note that the undershoot is most apparent in the frontal cortices (see also Video 2).  Videos showing the hemodynamic response to 4- to 6-s duration bursts in patients 3 and 5 are provided in Videos 1 and 2, respectively. 4.DiscussionBS has traditionally been considered to be a uniform and global brain state. Regardless of the cause, the burst-suppressed EEG typically appears consistent and essentially synchronous across the EEG channels distributed over the scalp. This has contributed to the use of induced-BS as a therapy in cases of head injury36 or status epilepticus,37 as a means of minimizing cortical activity. However, questions remain as to whether BS truly represents a global suppression of brain function and whether with deepening coma there is a complete suppression of the neuronal activity. Recent studies have provided evidence that, contrary to the traditional perception, during BS there can be increased activity in subcortical structures that may elicit activity in the hyperexcitable cortex and potentially give rise to the observed EEG bursts. This activity has been described as a novel neurophysiological parameter, known as “Nu-complexes” that arise from the hippocampus in different states of coma and in particular in BS.38 A recent study of propofol-induced coma in human adults using high-density intracranial electrocorticography demonstrated that, contrary to what is often observed using scalp EEG, BS can be localized to specific cortical areas. Bursts can occur asynchronously in different regions and BS can be observed at one location while continuous activity is apparent at others.39 These findings contradict the traditional model of BS and support the use of neuroimaging methodologies with better spatial specificity than scalp EEG to investigate BS and discontinuous EEG phenomena. To date, there have been only a small number of studies of the hemodynamic correlates of BS and discontinuous electrocortical activity in the animal model22 and fewer still in human infants.40 Simultaneous DOT–EEG approaches have the advantage of allowing the investigation of both the temporal and spatial features of the hemodynamic correlate of BS, which may prove essential to understand the relationship between discontinuous EEG states and cerebral function. In this paper, we have demonstrated that a significant hemodynamic response to burst EEG activity can be identified in infants with HIE. To our knowledge, we are the first group to specifically examine this phenomenon in this patient group. The hemodynamic correlate of burst activity in the HIE infant is best characterized by an initial decrease in HbO that reaches a minima during or soon after the burst, followed by a pronounced increase in HbO (see Fig. 5) that reaches a peak 10 to 12 s after the burst onset. The changes in HbR are more variable, but it is clear that the response is not consistent with the typical functional hemodynamic response observed in adults.41 The nature of the healthy neonatal functional hemodynamic response is still an issue of some debate. While several studies suggest the neonatal (and even early preterm) hemodynamic response is consistent with that observed in the mature brain,42,43 a recent study in the rat model suggests that the hemodynamic response to an external stimulus varies significantly with postnatal age.44 In the infant rat, the hemodynamic response was found to consist of a small increase in HbO, followed by increase in HbR, while the response in the adult rat was consistent with the typical adult human response, i.e., an increase in HbO with a concomitant decrease in HbR.44 One possible explanation for the shape of the hemodynamic response to EEG bursts found in our data is that bursts induce an increase in perfusion and therefore blood volume. The oxygen extraction is either abnormally low or the oxygen supply exceeds the regional metabolic demands. Hence, the increase in perfusion results in little change in oxygen saturation and thus no decrease in HbR is apparent. However, any interpretation of the observed responses must take into account the effects of maturation and the effects of hypoxic ischemic injury, specifically the biochemical changes associated with reperfusion injury.45–47 Any interpretation of the identified hemodynamic responses in these infants is clearly subject to multiple confounding factors. In addition to HIE itself, TH and anticonvulsant treatments also contribute to the presence of a pathological EEG trace, and are also likely to affect neurovascular coupling mechanisms. Anticonvulsant treatment is known to depress the EEG background activity and its effects are dependent on the type of medication, the dosage and the timing of administration, and the GA of the infant.48 Standard phenobarbitone loading doses (10 to only moderately affect the EEG background activity in full term infants. However, evidence suggests that the more severe the hypoxic ischemic insult, the more easily phenobarbitone can induce EEG discontinuity or BS.49 Midazolam is another medication frequently used in cases of HIE and it appears that when administered in moderate doses, midazolam does not affect EEG activity.49 It has also been shown that the median time-to-recovery of electrocortical background activity following the administration of anesthetic or antiepileptic medication in term infants, is 2.5 h, with a range of 2 to 15 h.50 A previous investigation of the effects of anesthetic drugs on neurovascular coupling mechanisms showed, in general, that the effects are similar across different medications.51 A recent study of the influence of TH on cortico-vascular activity examined cerebral oxygen metabolism, cerebral blood flow, and blood volume in HIE infants during TH, using frequency domain NIRS and diffuse correlation spectroscopy.52 When compared to the post-TH phase, the cerebral oxygen metabolism and cerebral blood flow were found to be lower during TH, while cerebral blood volume was found to be higher during TH. Two of the infants enrolled in our study were also receiving inotropic support, which primarily act on the systemic blood circulation. Different inotropes act on different vaso-receptors to ultimately improve cardiac output and increase cerebral perfusion. While all six infants included in this study were diagnosed with HIE and were undergoing TH, the severity of their conditions varied and they had received a range of anticonvulsants at different times relative to the period of recording (see Table 1). Despite these many confounding factors, the shape of the principal hemodynamic response to burst events is remarkably consistent across our cohort (see Fig. 5). In four out of six infants, the peak increase in HbT occurs between 11 and 12.5 s after the burst onset. It is possible that the specific selection of infants on the basis of their EEG state acts to control for the many other experimental variables, i.e., the hemodynamic correlate of BS may be consistent despite the various factors that have led to that neurological state. However, as is apparent from Figs. 4 and 6Fig. 7Fig. 8–9 the spatial distribution of the hemodynamic response to EEG bursts is highly variable across infants. Furthermore, the dominant features of the representative responses shown in Fig. 5 are not necessarily at their most pronounced in the same cortical area; while the initial dip of one infant may be most pronounced at the bilateral temporal–parietal boundaries (see Fig. 6), the peak increase in HbT in the same infant can be most pronounced in the prefrontal cortex (see Fig. 7). These results constitute evidence that EEG bursts in HIE infants invoke variable hemodynamic responses in different cortical regions. Whether this is a reflection of localized neuronal activity, which otherwise is grossly seen as BS on scalp EEG must be explored further. So far, there is limited scientific evidence to show that the phenomenon of BS can be dependent on local dynamics rather than a global state.39 Future studies on animal models of neonatal asphyxia combining cortical EEG and DOT measures could potentially elucidate this further. It is also of interest that the MRI of patient 5 revealed swelling of the bilateral medial temporal cortices and a possible hemorrhagic lesion over the right parietal lobe. These findings, to some extent, appear to correlate with the distribution of peak HbT changes shown in Fig. 8. The largest response is apparent in the temporal lobes, while a distinct absence of a response can be seen in the right parietal region. 5.ConclusionsIn this paper, we have identified the hemodynamic correlate of bursts of EEG activity in the burst-suppressed and discontinuous EEG traces in human infants with HIE. These responses exhibit a consistent morphology but highly variable spatial distributions across different infants. This observation is consistent with the emerging picture of BS as a representation of a complex and variable functional brain state, rather than simply an indication of globally suppressed neuronal activity. DOT–EEG approaches are likely to play a significant part in future investigations of the neurophysiological and clinical implications of burst-suppressed and discontinuous EEG states. AcknowledgmentsWe would like to thank our funders, the Evelyn Trust and Action Medical Research (AMR-1945) and the EPSRC (EP/J021318/1). A special thanks goes to all the families and infants that took part in this study and the NICU staff for facilitating the project. No conflicts of interest are declared. ReferencesF. Amzica,
“What does burst suppression really mean?,”
Epilepsy Behav., 49 234
–237
(2015). http://dx.doi.org/10.1016/j.yebeh.2015.06.012 Google Scholar
S. Ohtahara and Y. Yamatogi,
“Epileptic encephalopathies in early infancy with suppression-burst,”
J. Clin. Neurophysiol., 20
(6), 398
–407
(2003). http://dx.doi.org/10.1097/00004691-200311000-00003 0736-0258 Google Scholar
W. P. Akrawi et al.,
“A comparison of the electrophysiological characteristics of EEG burst-suppression as produced by isoflurane, thiopental, etomidate, and propofol,”
J. Neurosurg. Anesthesiol., 8
(1), 40
–46
(1996). http://dx.doi.org/10.1097/00008506-199601000-00010 JNANEV 0898-4921 Google Scholar
G. B. Young,
“The EEG in coma,”
J. Clin. Neurophys., 17
(5), 473
–485
(2000). http://dx.doi.org/10.1097/00004691-200009000-00006 0736-0258 Google Scholar
M. M. Stecker et al.,
“Deep hypothermic circulatory arrest: II. Changes in electroencephalogram and evoked potentials during rewarming,”
Ann. Thorac. Surg., 71
(1), 22
–28
(2001). http://dx.doi.org/10.1016/S0003-4975(00)02021-X Google Scholar
M. Thoresen et al.,
“Effect of hypothermia on amplitude-integrated electroencephalogram in infants with asphyxia,”
Pediatrics, 126
(1), e131
–e139
(2010). http://dx.doi.org/10.1542/peds.2009-2938 PEDIAU 0031-4005 Google Scholar
N. Monod, N. Pajot and S. Guidasci,
“The neonatal EEG: statistical studies and prognostic value in full-term and pre-term babies,”
Electroencephalogr. Clin. Neurophysiol., 32
(5), 529
–544
(1972). http://dx.doi.org/10.1016/0013-4694(72)90063-6 ECNEAZ 0013-4694 Google Scholar
D. Wertheim et al.,
“Prognostic value of continuous electroencephalographic recording in full term infants with hypoxic–ischaemic encephalopathy,”
Arch. Dis. Child., 71
(2), F97
–F102
(1994). http://dx.doi.org/10.1136/fn.71.2.F97 ADCHAK 0003-9888 Google Scholar
L. Hellström-Westas, I. Rosén and N. W. Svenningsen,
“Predictive value of early continuous amplitude integrated EEG recordings on outcome after severe birth asphyxia in full term infants,”
Arch. Dis. Child. Fetal Neonatal Ed., 72
(1), F34
–F38
(1995). http://dx.doi.org/10.1136/fn.72.1.F34 Google Scholar
J. J. Volpe,
“Predictive value of early continuous amplitude integrated EEG recordings on outcome after severe birth asphyxia in full term infants,”
Neurology of the Newborn, 347
–399 W. B. Saunders, Philadelphia, Pennsylvania
(2008). Google Scholar
S. L. Bonifacio et al.,
“A new neurological focus in neonatal intensive care,”
Nat. Rev. Neurol., 7
(9), 485
–494
(2011). http://dx.doi.org/10.1038/nrneurol.2011.119 Google Scholar
P. Laoprasert, Atlas of Paediatric EEG, 202
–203 McGraw Hill Companies Inc., Aurora, Colorado
(2011). Google Scholar
K. K. Iyer et al.,
“Novel features of early burst suppression predict outcome after birth asphyxia,”
Ann. Clin. Transl. Neurol., 1
(3), 209
–214
(2014). http://dx.doi.org/10.1002/acn3.3210.1002/acn3.32 Google Scholar
R. M. Pressler et al., Neonatal and Paediatric Clinical Neurophysiology, 59
–60 Elsevier Limited, Philadelphia
(2007). Google Scholar
N. Japaridze et al.,
“Neuronal networks during burst suppression as revealed by source analysis,”
PLoS One, 10
(4), e0123807
(2015). http://dx.doi.org/10.1371/journal.pone.0123807 POLNCL 1932-6203 Google Scholar
P. Eken et al.,
“Predictive value of early neuroimaging, pulsed Doppler and neurophysiology in full term infants with hypoxic–ischaemic encephalopathy,”
Arch. Dis. Child. Fetal Neonatal Ed., 73
(2), F75
–F80
(1995). http://dx.doi.org/10.1136/fn.73.2.F75 Google Scholar
M. C. Toet et al.,
“Amplitude integrated EEG 3 and 6 hours after birth in full term neonates with hypoxic–ischaemic encephalopathy,”
Arch. Dis. Child. Fetal Neonatal Ed., 81
(1), F19
–F23
(1999). http://dx.doi.org/10.1136/fn.81.1.F19 Google Scholar
L. G. van Rooij et al.,
“Recovery of amplitude integrated electroencephalographic background patterns within 24 hours of perinatal asphyxia,”
Arch. Dis. Child. Fetal Neonatal Ed., 90
(3), F245
–F251
(2005). http://dx.doi.org/10.1136/adc.2004.064964 Google Scholar
C. C. Menache, B. F. Bourgeois and J. J Volpe,
“Prognostic value of neonatal discontinuous EEG,”
Pediatr. Neurol., 27
(2), 93
–101
(2002). http://dx.doi.org/10.1016/S0887-8994(02)00396-X Google Scholar
M. J. Mäkiranta et al.,
“Functional magnetic resonance imaging of swine brain during change in thiopental anesthesia into EEG burst-suppression level—a preliminary study,”
Magn. Reson. Mater. Phys. Biol. Med., 15
(1–3), 27
–35
(2002). http://dx.doi.org/10.1007/BF02693841 Google Scholar
X. Liu et al.,
“Neural origin of spontaneous hemodynamic fluctuations in rats under burst-suppression anesthesia condition,”
Cereb. Cortex, 21
(2), 374
–384
(2011). http://dx.doi.org/10.1093/cercor/bhq105 53OPAV 1047-3211 Google Scholar
J. Sutin et al.,
“Diffuse optical spectroscopy measurement of cerebral hemodynamics and oxygen metabolism during anesthesia-induced burst suppression in rats,”
(2014). http://dx.doi.org/10.1364/BIOMED.2014.BT5B.3 Google Scholar
R. J. Cooper et al.,
“Transient haemodynamic events in neurologically compromised infants: a simultaneous EEG and diffuse optical imaging study,”
NeuroImage, 55
(4), 1610
–1616
(2011). http://dx.doi.org/10.1016/j.neuroimage.2011.01.022 NEIMEF 1053-8119 Google Scholar
H. Singh et al.,
“Mapping cortical haemodynamics during neonatal seizures using diffuse optical tomography: a case study,”
Neuroimage Clin., 5 256
–265
(2014). http://dx.doi.org/10.1016/j.neuroimage.2011.01.022 Google Scholar
H. B. Sarnat and M. S. Sarnat,
“Neonatal encephalopathy following fetal distress. A clinical and electroencephalographic study,”
Arch. Neurol., 33
(10), 696
–705
(1976). http://dx.doi.org/10.1001/archneur.1976.00500100030012 Google Scholar
A. D. Edwards et al.,
“Neurological outcomes at 18 months of age after moderate hypothermia for perinatal hypoxic–ischaemic encephalopathy: synthesis and meta-analysis of trial data,”
BMJ, 340 c363
(2010). http://dx.doi.org/10.1136/bmj.c36310.1136/bmj.c363 Google Scholar
“National Institute for Health and Care Excellence (NICE) interventional procedure guidance [IPG347],”
(2010). Google Scholar
N. L. Everdell et al.,
“A frequency multiplexed near-infrared topography system for imaging functional activation in the brain,”
Rev. Sci. Instrum., 76
(9), 093705
(2005). http://dx.doi.org/10.1063/1.2038567 RSINAK 0034-6748 Google Scholar
R. Oostenveld and P. Praamstra,
“The five percent electrode system for high-resolution EEG and ERP measurements,”
Clin. Neurophys., 112
(4), 713
–719
(2001). http://dx.doi.org/10.1016/S1388-2457(00)00527-7 CNEUFU 1388-2457 Google Scholar
C. Brunner, A. Delorme and S. Makeig,
“EEGLAB—an open source Matlab toolbox for electrophysiological research,”
Biomed. Tech. (Berl.),
(2013). http://dx.doi.org/10.1515/bmt-2013-4182 Google Scholar
R. J. Cooper et al.,
“A systematic comparison of motion artifact correction techniques for functional near-infrared spectroscopy,”
Front. Neurosci., 6 147
(2012). http://dx.doi.org/10.3389/fnins.2012.00147 1662-453X Google Scholar
M. Schweiger and P. Arridge,
“The Toast++ software suite for forward and inverse modeling in optical tomography,”
J. Biomed. Opt., 19
(4), 040801
(2014). http://dx.doi.org/10.1117/1.JBO.19.4.040801 JBOPFO 1083-3668 Google Scholar
S. Brigadoi et al.,
“A 4D neonatal head model for diffuse optical imaging of pre-term to term infants,”
NeuroImage, 100 385
–394
(2014). https://doi.org/http://www.ucl.ac.uk/medphys/4dneonatalmodel NEIMEF 1053-8119 Google Scholar
T. C Gomella, M. Douglas Cunningham and F. G. Eyal, Neonatology: Management, Procedures, On-Call Problems, Diseases, and Drugs, 46 325
–333 McGraw Hill Education, New York
(2013). Google Scholar
R. Hall and J. Murdoch,
“Brain protection: physiological and pharmacological considerations. Part II: the pharmacology of brain protection,”
Can. J. Anaesth., 37 762
–777
(1990). http://dx.doi.org/10.1007/BF03006535 CJOAEP Google Scholar
J. Claassen et al.,
“Treatment of refractory status epilepticus with pentobarbital, propofol, or midazolam: a systematic review,”
Epilepsia, 43 146
–153
(2002). http://dx.doi.org/10.1046/j.1528-1157.2002.28501.x EPILAK 0013-9580 Google Scholar
D. Kroeger, B. Florea and F. Amzica,
“Human brain activity patterns beyond the isoelectric line of extreme deep coma,”
PLoS One, 8
(9), e75257
(2013). http://dx.doi.org/10.1371/journal.pone.0075257 POLNCL 1932-6203 Google Scholar
L. D. Lewis et al.,
“Local cortical dynamics of burst suppression in the anaesthetized brain,”
Brain, 136
(Pt. 9), 2727
–2737
(2013). http://dx.doi.org/10.1093/brain/awt174 Google Scholar
N. Roche-Labarbe et al.,
“Coupled oxygenation oscillation measured by NIRS and intermittent cerebral activation on EEG in premature infants,”
NeuroImage, 36
(3), 718
–727
(2007). http://dx.doi.org/10.1016/j.neuroimage.2007.04.002 NEIMEF 1053-8119 Google Scholar
B. M. Mackert et al.,
“Neurovascular coupling analyzed non-invasively in the human brain,”
Neuroreport, 15
(1), 63
–66
(2004). http://dx.doi.org/10.1097/00001756-200401190-00013 NERPEZ 0959-4965 Google Scholar
T. Arichi et al.,
“Development of BOLD signal hemodynamic responses in the human brain,”
NeuroImage, 63
(2), 663
–673
(2012). http://dx.doi.org/10.1016/j.neuroimage.2012.06.054 NEIMEF 1053-8119 Google Scholar
N. Roche-Labarbe et al.,
“Noninvasive optical measures of CBV, StO(2), CBF index, and rCMRO(2) in human premature neonates brains in the first six weeks of life,”
Hum. Brain Mapp., 31
(3), 341
–352
(2010). http://dx.doi.org/10.1002/hbm.v31:3 HBRME7 1065-9471 Google Scholar
M. G. Kozberg et al.,
“Resolving the transition from negative to positive blood oxygen level-dependent responses in the developing brain,”
Proc. Natl. Acad. Sci. U. S. A., 110
(11), 4380
–4385
(2013). http://dx.doi.org/10.1073/pnas.1212785110 Google Scholar
H. Hagberg et al.,
“Extracellular overflow of glutamate, asparate, GABA and taurine in the cortex and basal ganglia of fetal lambs during hypoxia–ischaemia,”
Neurosci. Lett., 78
(3), 311
–317
(1987). http://dx.doi.org/10.1016/0304-3940(87)90379-X NELED5 0304-3940 Google Scholar
D. T. Stein and R. C. Vannucci,
“Calcium accumulation during the evolution of hypoxic–ischaemic brain damage in the immature rat,”
J. Cereb. Blood Flow Metab., 8
(6), 834
–842
(1988). http://dx.doi.org/10.1038/jcbfm.1988.140 Google Scholar
J. Szaflarski, D. Burtrum and F. S. Silverstein,
“Cerebral hypoxia–ischemia stimulates cytokine gene expression in perinatal rats,”
Stroke, 26
(6), 1093
–1100
(1995). http://dx.doi.org/10.1161/01.STR.26.6.1093 SJCCA7 0039-2499 Google Scholar
A. H. Bell, G. Greisen and O. Pryds,
“Comparison of the effects of phenobarbitone and morphine administration on EEG activity in preterm babies,”
Acta Paediatr., 82
(1), 35
–39
(1993). http://dx.doi.org/10.1111/apa.1993.82.issue-1 Google Scholar
H. Lagercrantz et al., The Newborn Brain, 14 220
–221 Cambridge University Press, New York
(2010). Google Scholar
E. Shany et al.,
“Influence of antiepileptic drugs on amplitude-integrated electroencephalography,”
Pediatr. Neurol., 39
(6), 387
–391
(2008). http://dx.doi.org/10.1016/j.pediatrneurol.2008.08.005 Google Scholar
M. A. Franceschini et al.,
“The effect of different anesthetics on neurovascular coupling,”
NeuroImage, 51
(4), 1367
–1377
(2010). http://dx.doi.org/10.1016/j.neuroimage.2010.03.060 NEIMEF 1053-8119 Google Scholar
M. Dehaes et al.,
“Cerebral oxygen metabolism in neonatal hypoxic–ischemic encephalopathy during and after therapeutic hypothermia,”
J. Cereb. Blood Flow Metab., 34
(1), 87
–94
(2014). http://dx.doi.org/10.1038/jcbfm.2013.165 Google Scholar
BiographyMaria Chalia qualified in medicine in 2004 and is currently training as a specialist in pediatrics and neonates. She is a member of the Royal College of Pediatrics and Child Health. Since 2014, she has been working as a member of the neoLAB, an infant functional imaging collaborative group between Cambridge and UCL, and is studying for an MD research degree from the University of Cambridge investigating the neurovascular coupling in neonatal brain injury. |