
|
|
1.IntroductionInfrared radiation (IR) has been proposed as an alternative method for neural stimulation.1–7 The common underlying mechanism of infrared neural stimulation (INS) is the local heating of the target structures in the beam path.8–10 Experimental results show that the temperature changes result in a depolarizing capacitive current or the activation of heat-sensitive transient receptor potential vallinioid (TRPV) channels.11,12 Other experiments demonstrated that IR increases the intracellular calcium concentration.13–18 Recently, it has been demonstrated that the increase in intracellular calcium concentration results from a direct interaction of the radiation with intracellular calcium stores.15 Pulse lengths for INS are typically for cochlear stimulation and about 1 ms for peripheral nerve or cortical stimulation. With a heat relaxation time of 35 ms in water, the heat delivery is thermally confined and stress relaxation waves are generated. The value for was calculated with Equations 6 and 8 from van Gemert and Welch.19 The equations consider both the axial and the radial heat diffusion times to calculate the heat conduction. The calculated value considers the following laser parameters: radiation wavelength , optical penetration length , temperature conductivity of water , pulse length, and a laser spot size of as determined and published in previous experiments.20 In addition to the calculation, we confirmed the time experimentally by measuring the temperature in front of the optical fiber in water with a patch pipette. The method has been previously described in detail.9 While for peripheral nerves and cortical stimulation, no evidence could be found that a mechanical event plays a crucial role in INS,8 this is different for the auditory system.21,22 Both direct neural stimulation and stimulation via an acoustical (optophonic) event have been discussed as possible mechanisms.7,21,22 Valid criticism on the notion that the neural stimulation in the cochlea results from the direct interaction between the optical radiation and the auditory neurons comes from experiments conducted in guinea pigs. For the latter experiments, optical stimulation was only possible in animals with residual hearing. Following the extensive perfusion of an ototoxic and neurotoxic drug, neomycin, into scala tympani, responses to pure tones and to IR disappeared while responses to monopolar electrical stimulation were only slightly decreased.21 For the development of optically based cochlear implants, it would be crucially important to determine the chain of events resulting in the generation of action potentials. In this paper, we follow up on the question of whether cochlear INS is a direct interaction between the auditory neurons and the IR or solely an optophonic response by studying the effects of simultaneous presentation of a laser and acoustical stimulus. When two similar signals are presented to the cochlea at the same time, a masking effect occurs, resulting in a decrease of the response to a probe stimulus. This masking effect has been observed between acoustic and acoustic, acoustic and electrical, and acoustic and INS stimulation.23–25 Based on these previous findings, INS should be able to be masked by a white noise acoustic stimulus in a normal-hearing cochlea. After damaging hair cells, the acoustic masking of INS should be affected if INS is mainly a result of neural stimulation. Furthermore, if INS is dominated by an optophonic response, then damaging the hair cells should have similar effects on masking as well as a decrease in both acoustic and INS responses. However, if INS results from a direct interaction of the target structure(s) with the radiation, the neuronal response to IR should be little affected by the deafening of the animal. The present study investigates the ability of a broadband acoustic masker on masking the responses to INS. 2.MethodsAdult guinea pigs of either sex were used in the experiments. Care and use of the animals were carried out within the guidelines of the NIH Guide for the Care and Use of Laboratory Animals and were approved by the Animal Care and Use Committee of Northwestern University. 2.1.Deafening of the AnimalsAfter animals with normal cochlear function were anesthetized with isoflurane in oxygen (5% for induction and 1% to 3% for maintenance), they were transtympanically injected with 25 mM neomycin in 0.9% saline solution. Animals were recovered from anesthesia and survived a minimum of 4 weeks until further studies were preformed. Based on the sound pressure level (SPL) to evoke an auditory response by acoustic clicks, animals were categorized as partially deaf (thresholds to acoustic clicks were above 65 dB SPL) or severely deaf (thresholds to acoustic clicks were above 80 dB SPL). 2.2.Animal SurgeryThe method is the same as has been described previously.2 Animals were anesthetized with urethane. The level of anesthesia was maintained throughout the procedure with 40 to ketamine combined with 5 to xylazine in the initial injection diluted 1:10 in saline solution. The depth of anesthesia was assessed every 15 min with a paw withdrawal reflex. Core body temperature was maintained with a heating pad. Temperature, heart rate, and blood oxygen were monitored with a Bionet BM3 vet (Tustin, California) monitoring system. After the animals were anesthetized, a tracheotomy was made and a plastic tube was secured into the trachea to facilitate breathing. The animals were ventilated on oxygen throughout the length of the experiment using a Hallowell EMC Anesthesia WorkStation (Pittsfield, Massachusetts). Next, the animals’ heads were fixed in a stereotactic head holder (Stoelting, Kiel, Wisconsin) using ear bars for placement. The skin was removed from the medial part of the skull, slightly caudal of the eyes. Three holes were made in the skull with a motorized drill, about 4 to 8 mm apart, where 1.5 mm stainless steel self-tapping cortex screws (Veterinary Orthopedic Implants, St. Augustine, Florida) were fastened. A custom-made arm was attached to the head holder and fixed to the skull with dental acrylic, using the cortex screws as anchors. After the acrylic had cured, the ear bars were removed to create a more open surgical field. The left cochlea was accessed through a “C”-shaped skin incision behind the pinna. Cervicoauricular muscles were removed by blunt dissection and the outer ear canal was exposed for easier acoustic stimulus placement and better surgical access. The bulla was exposed and opened approximately , directly caudal of the ear canal, using a motorized drill. A silver ball electrode was placed on the round window for compound action potential (CAP) recordings. A cochleostomy was made into the basal turn approximately 0.5 mm from the bony rim of the round window using a hand drill. A flat-polished optical fiber (P200-5-VIS-NIR, Ocean Optics, Dunedin, Florida) was connected to a Narishige 3D micromanipulator (MHW103, Narishige, Tokyo, Japan) and was inserted through the opening (Fig. 1). The optical fiber was oriented toward the spiral ganglion cell bodies located in Rosenthal’s canal. Fig. 1(a)–(d) shows the access to the cochlea and placement of the optical fiber. The silver ball compound action potential (CAP) electrode is not in place in order to clear the field of view. Surgical access to the bulla with bullotomy completed is seen in (a). The optical fiber is seen on the left of the panel. With higher magnification of the surgical site provided in (b), the cochlea can be visualized through the bullotomy. Further magnification on the cochlea in (c) provides clear viewing of the base of the cochlea with the round window (arrow) easily identified. The circle shows where the cochleostomy will be drilled. In (d), the cochleostomy is drilled and laser fiber is in place for infrared neural stimulation (INS). 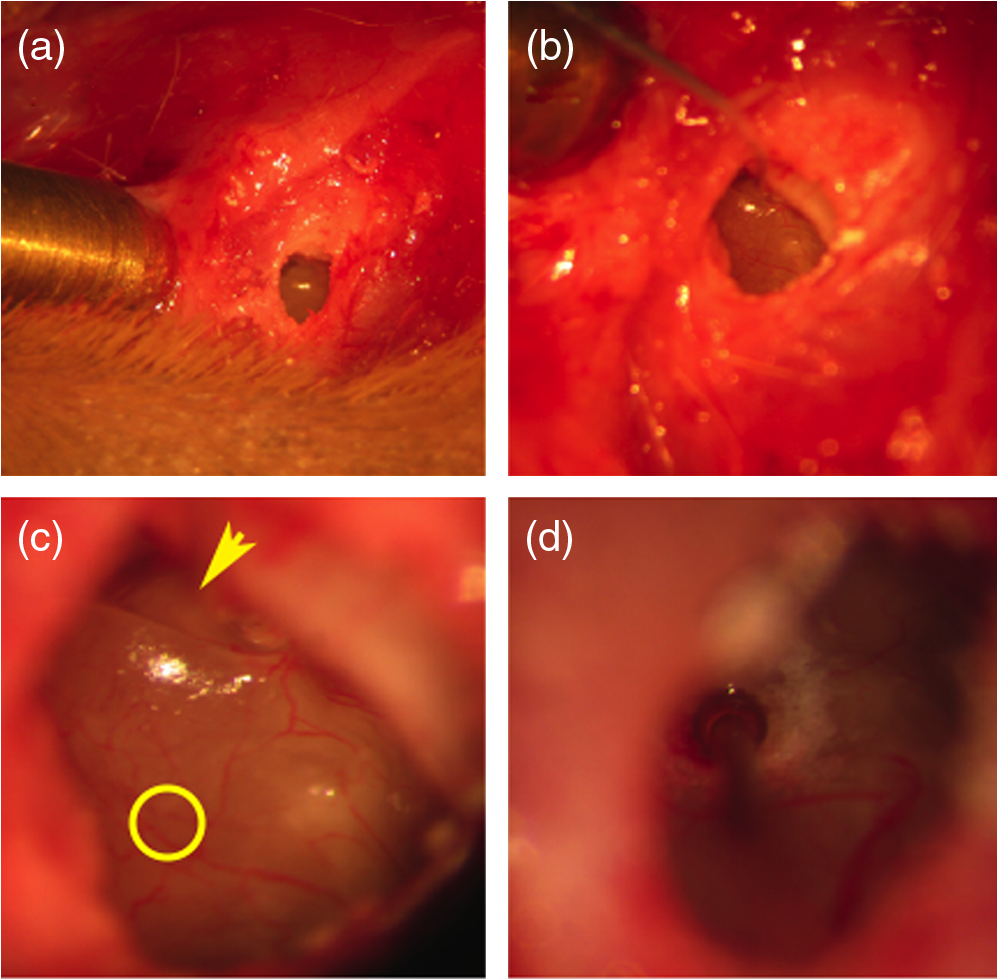 2.3.Laser StimulationAs described in previously published experiments, optical stimulation was achieved with a diode laser (Capella, Lockheed Martin Aculight Corp., Bothell, Washington). The wavelength was 1862 nm, the pulse duration , and the pulse repetition rate 10 Hz. An optical fiber with a core diameter of was coupled to the laser and was used to irradiate the target structures. The value for the optical spot was taken from previous experiments.20 At the tip of the optical fiber, the spot was in diameter. The diameter of the spot was determined from the Gaussian energy distribution as the full-width at half the maximum (FWHM). The FWHM value was determined previously using the knife-edge technique.26 The radiant energy per pulse at the tip of the optical fiber was measured in air as 0 to using the J50LP-1A energy sensor (Coherent, Santa Clara, California). Note that the energy measured at the tip of the optical fiber will not be the same as the energy delivered to the neurons. Fluids, soft tissue, and the modiolar bone absorb and scatter the radiation. Assuming primarily water absorption, e.g., Ref. 27, the incident radiant energy decreases in water by for each traveled along the optical path. It is a fair assumption that the energy at the spiral ganglion cells is about one third of the energy measured at the tip of the optical fiber. 2.4.Acoustic StimulationCochlear function was screened using CAPs recorded at the round window of the cochlea with a silver ball electrode. Acoustic thresholds were determined in response to acoustic clicks and pure tone bursts. The frequency for the pure tone bursts started at 32 kHz and decreased in 2 steps per octave over 5 octaves to 1.4 kHz. Sound levels at each frequency began at the loudest speaker output and attenuated in steps of 5 dB. The maximum possible sound level of the speaker output is added to the plot of CAP thresholds as a light gray line. Acoustic stimuli were generated by a voltage command presented at a rate of 4 Hz to a Beyer DT770-Pro headphone, which had been previously calibrated with a Brüel and Kjær 1/8-in. microphone. The speculum of the speaker was placed directly in front of the ear canal (quasifree field). The CAP electrodes were connected to a differential amplifier (ISO-80, WPI, Sarasota, Florida) with high-input impedance (). Filter settings of the ISO-80 were 0.3 to 3 kHz. CAP threshold was defined as a response that was visible above the noise floor of the recordings, typically between 5 and . 2.5.Masking Optical StimulationMasking was accomplished by presenting an optical pulse and an acoustic noise stimulus simultaneously. Two experimental paradigms were used: varying the masker level and keeping the radiant energy per pulse constant (variable masker) and varying radiant energy and keeping the masker level constant (variable INS). Before presenting the acoustic masker, a radiant energy-versus-CAP response amplitude contour (I/O-curve) was assessed to determine correct optical fiber orientation as well as the best radiant energy level to use for the variable masker experiment. The energy level for the variable masker experiment was determined by choosing the laser power for which the input-output curve was steepest. In case no saturation of the laser I/O-curve was reached, the highest radiant energy was used. In addition to the laser pulse, an acoustic noise stimulus masker was presented. The reduction of the optically evoked response served as a measure for the masking of the laser stimulus by the acoustic masker. The voltage command for the noise stimulus was generated with a Hewlett Packard waveform generator (model 33120A). The acoustic noise stimulus was attenuated in steps of 5 dB. For the variable INS experiment, an I/O-curve was recorded using increasing laser power settings with no acoustical masker present. A second I/O-curve was recorded in the same manner in the presence of the acoustic masker set to 80 dB SPL. 2.6.HistologyIn addition to using CAPs as an indicator of deafness, histological sections were evaluated for the presence of hair cells. After the animal was sacrificed, the cochleae were harvested and fixed in a solution of 2.5% glutaraldehyde and 1.5% paraformaldehyde in phosphate buffered saline solution (PBS) for at least 24 h. The cochleae were then placed in 10% ethylenediaminetetraacedic acid in PBS for at least 2 weeks for decalcification. Following decalcification, the cochleae were fixed with 1% osmium tetroxide (diluted in PBS). The samples were then dehydrated with increasing concentrations of acetone (20%, 50%, 60%, 70%, 80%, and 100%). After dehydration, samples were imbedded with increasing concentrations of Araldite epoxy resin (Electron Microscopy Sciences) (12.5%, 50%, 87.5%, and 100%) dissolved in acetone. Embedded samples were sectioned at using a glass knife microtome (LKB 8800 Ultrotome III, Stockholm-Bromma, Sweden) and each section was transferred to a glass slide. The slides were stained with 1% toluidine blue (Sigma Aldrich, St. Louis, Missouri) and 1% sodium tetraborate solution (1:20) and then covered using glass coverslips and Permount™ (Fisher Scientific Inc., Hanover Park, Illinois). Each turn visible in a cross section was inspected to determine whether inner and outer hair cells were present. At least 10 successive mid-modiolar sections were inspected. The presence of outer and inner hair cells was examined by the presence of a cell nucleus or stereocilia bundle and was noted. Since the sections are smaller than the diameter of the hair cells, it is possible that a single hair cell is present in several sections as well as gaps between hair cells can result with no hair cell in the section despite no hair cell loss having occurred. To account for those limitations, the fraction of sections with a hair cell visible was calculated for control cochleae and cochleae damaged with neomycin. Each visible cut edge from base to apex was examined. The presence and appearance of other soft tissue structures of the organ of Corti were examined but results are not reported. 2.7.Data Acquisition and Analysis2.7.1.PhysiologyCAPs were recorded while presenting the laser stimulus (probe alone) and while adding the acoustic masker. The CAP amplitudes were measured for the different experimental conditions and were plotted versus the stimulus levels, the radiant energy delivered with each laser pulse or the average sound level of the masker. 2.7.2.StatisticsDescriptive statistics were used. Representative examples of the responses from normal hearing, partially deaf, and severely deaf animals are shown. In addition to typical examples, the averages and corresponding standard deviations of all animals used in the study are presented. Differences were tested either with the paired student’s -test or by using the analysis of variance (ANOVA). If the ANOVA indicated differences among the means, a posteriori test was used for making pair-wise comparisons among the means. An honestly significant difference (HSD) test by Tukey was used. The tests are part of a statistical package provided by IGOR® (Wavemetrics). Statistical decisions were made for a probability . 3.Results3.1.Threshold Levels for Compound Action PotentialsHearing (), partially deaf (), and severely deaf () animals were used in this study. All animals were tested for click-, pure tone-, and laser-evoked responses. Typical examples for CAP responses to laser pulses with and without masking as well as acoustic clicks in normal hearing, partial deaf, and severe deaf animals are shown in Fig. 2. The traces show that CAP amplitudes increase with increasing stimulus level. The threshold for acoustical stimulation increases in partially [Fig. 2(e)] and severely [Fig. 2(f)] deaf animals. There is only a small relative change in CAP thresholds for laser stimulation between normal hearing and deaf animals. Corresponding results for pure tones are shown in Fig. 2. For two animals, no response to acoustic tone bursts could be detected for sound levels above 110 dB SPL [Fig. 3(c)]. Fig. 2(a)–(c) shows the CAP responses to acoustic clicks, and (d)–(f) shows the CAP responses to laser pulses. The stimulus level was increased from bottom to top. While the threshold to evoke acoustical CAP is increasing significantly from normal hearing (a) to chronic deaf (b and c) animals, this is not the case for optical stimulation (d and e). Laser responses in normal hearing animals are shown in (d), and responses for deaf animals in (e) and (f). Data shown in each (a) and (d), (b) and (e), and (c) and (f) are from the same animal, respectively. 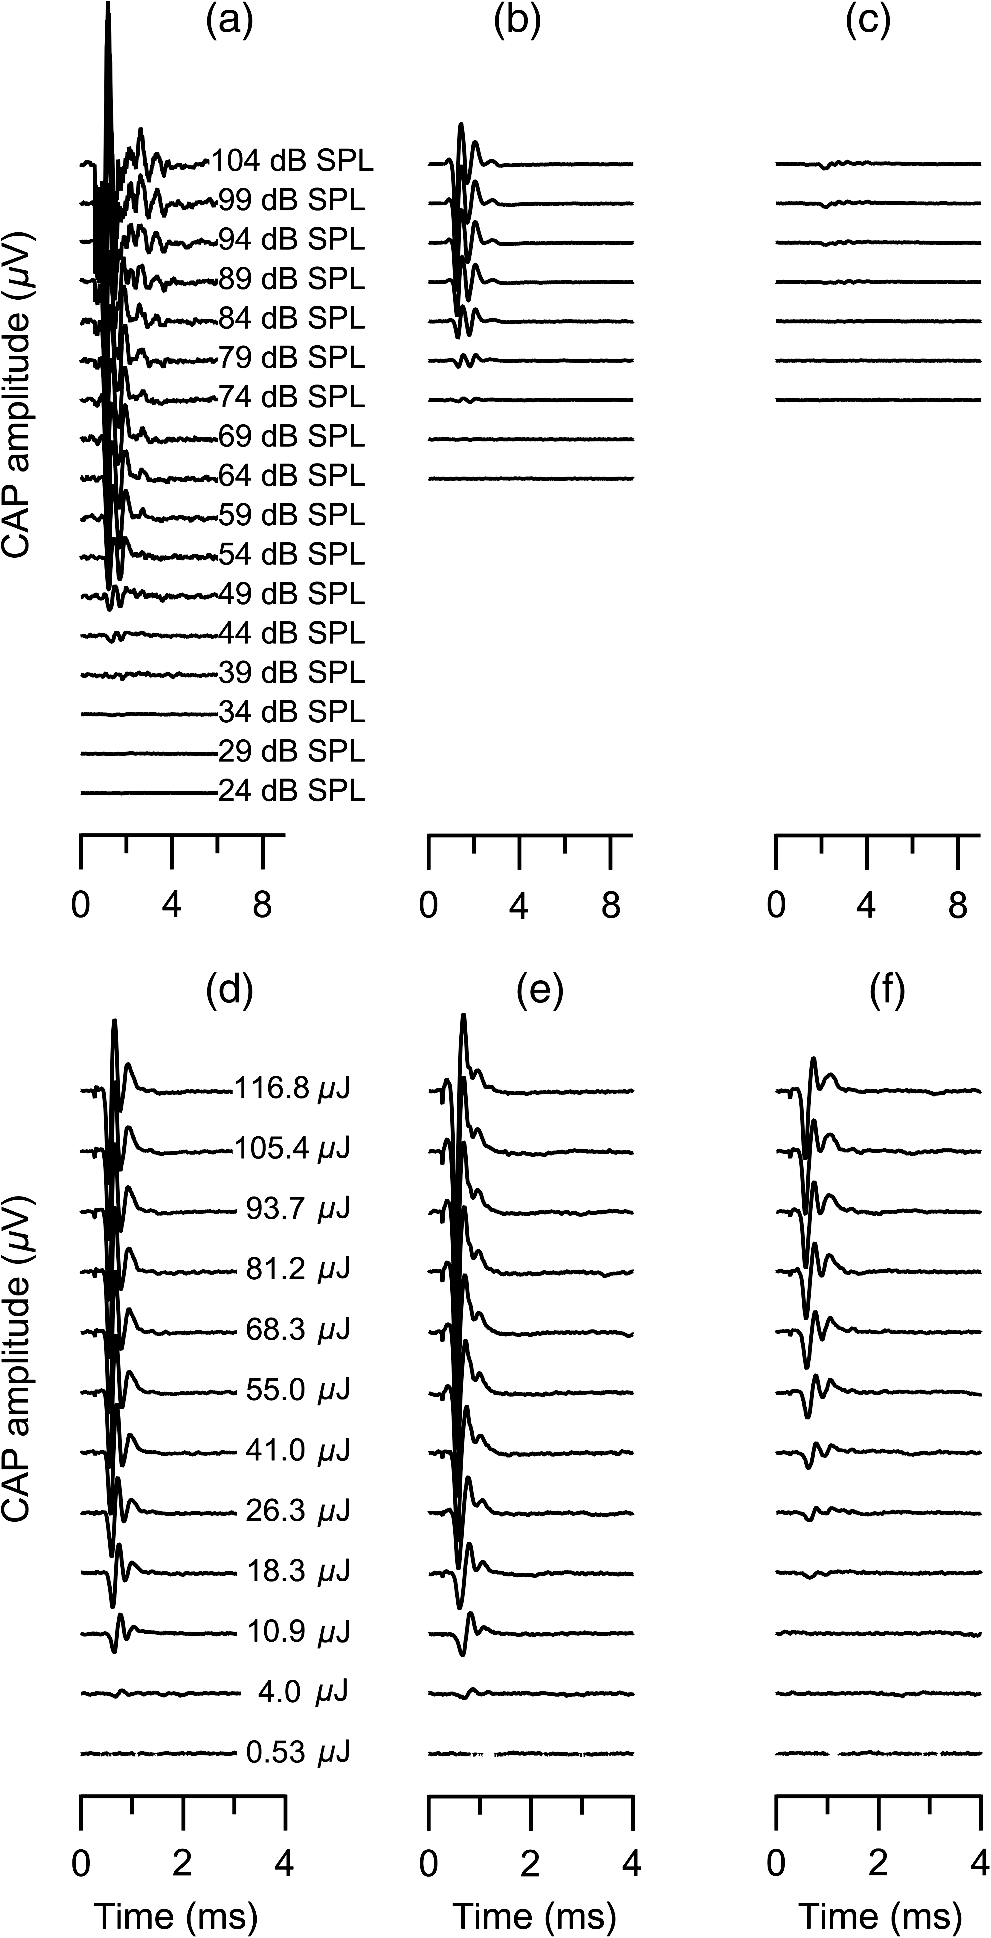 Fig. 3Pure tone CAP frequency tuning curves for each of the animals used in the study: (a) shows the data from the nine untreated (control) animals. Light gray traces are from the individual animals. Thick solid black line shows the average of all animals with the corresponding standard deviations. (b) shows the data from four treated animals. Light gray traces are from the individual animals. Thick solid black line shows the average of all animals with the corresponding standard deviations. Thresholds were below 80 dB sound pressure level (SPL). The animals were classified as partially deaf animals. (c) shows the data from four treated animals. For two of the animals, a response could be evoked with pure tones. The light gray traces are from those two individual animals. Thick solid black line shows the average of the two animals with the corresponding standard deviations. In two additional animals, no response could be evoked at sound levels up to 110 dB SPL. Data are not included in the graph and the average calculations. The animals were classified as severely deaf animals. 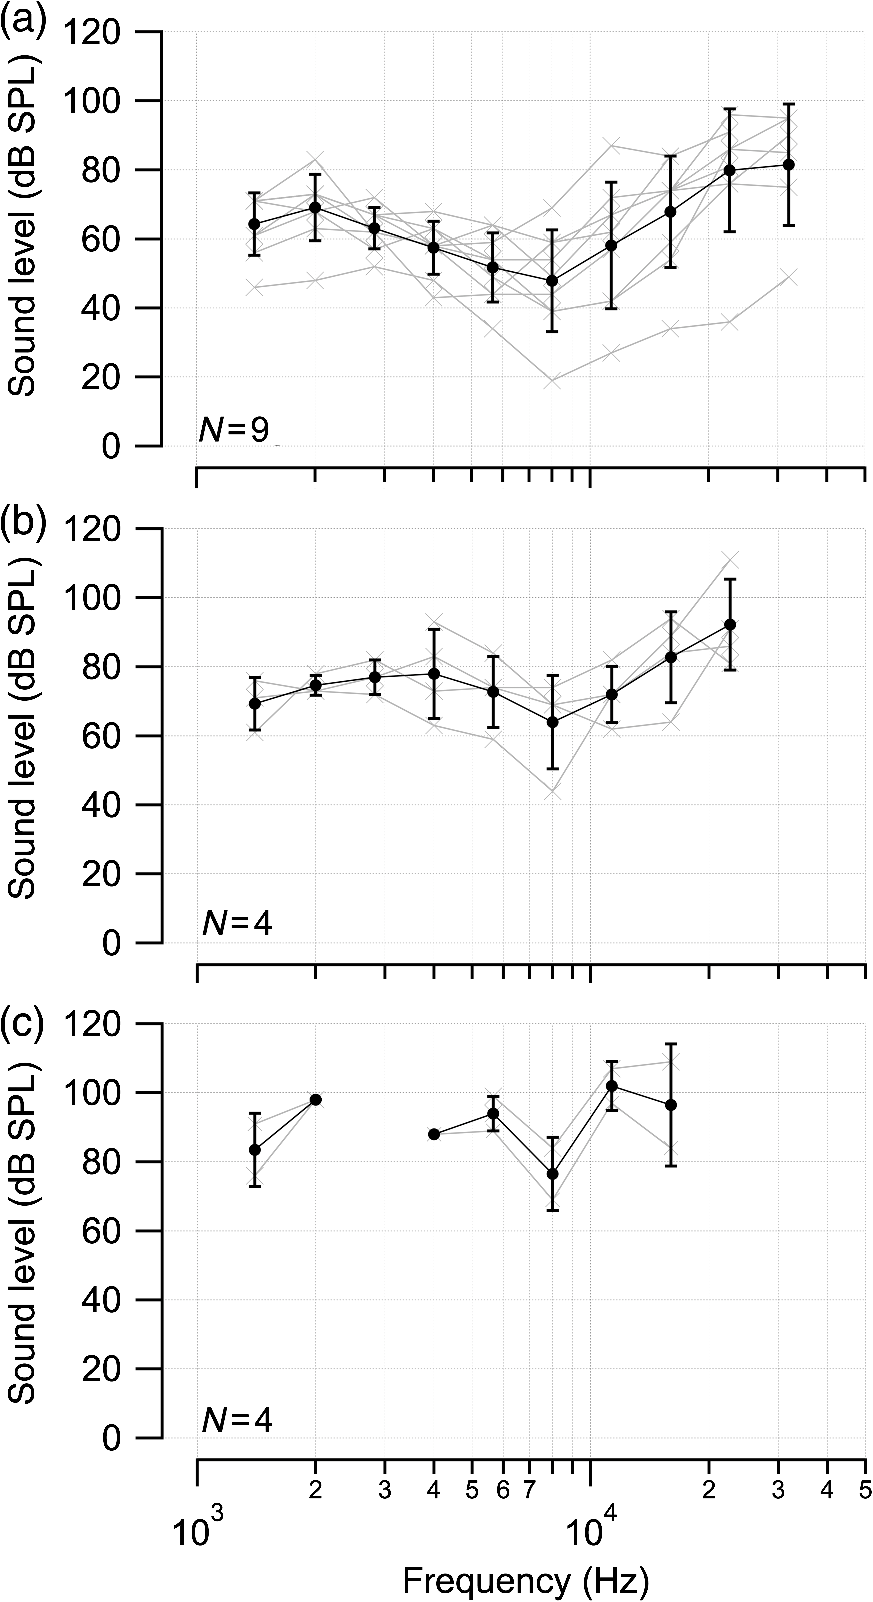 Figure 4 shows various I/O curves for a representative animal from each group. In normal hearing animals, acoustic and laser I/O curves have similar shapes [Fig. 4(a)]. In partially and severely deafened animals [Figs. 4(b) and 4(c)], the I/O curve for acoustic stimulation changes drastically when compared with normal hearing animals. Following cochlear damage, the curves shift to the right (higher stimulus levels are required for a response) for acoustic stimulation but responses to laser stimulation only had small shifts across all animal groups. The values shown in Fig. 4(c) for responses to acoustic clicks are similar to the noise amplitude of the recording. In contrast to the response to acoustic stimuli, the laser I/O curve has the same overall shape at similar energies similar to the curve obtained in normal hearing and partially deaf animals. Fig. 4Shown in each series is an example animal from each of the statuses of cochlear function, untreated, partially deaf, and severely deaf. In (a) and (c), the increase in CAP amplitude with increasing stimulus level is the I/O-contour. For acoustic stimulation, the threshold was elevated (curves shifted to the right) in partial deaf and was not reached in severely deaf animals. For laser stimulation, the stimulation threshold remained fairly constant (no shift to the right). However, the CAP amplitude at maximum stimulus levels was decreased in the deaf animals. (d) through (f) show the interaction between the laser stimulus and the acoustic maker. For the measurement, the radiant energy was held constant. The energy was selected that the response to the laser was just above threshold for stimulation. The stimulus level for the noise stimulus increased from 0 dB SPL to its maximum average sound level of 80 dB SPL. While in normal hearing animals the acoustic masker could mask the laser response (d), in partially deaf animals the level to mask the laser response was clearly higher. In severely deaf animals, the acoustic masker could not reduce the laser-evoked CAP. (g) through (i) show the I/O contours for optical responses with no acoustic masker (red curves) and with the acoustic masker at its maximum level (blue curves). In (g), an example for an untreated control animal is shown. The acoustic stimulus masked completely the laser response. Even at the highest radiant energy levels (80 dB SPL), no response to the laser could be detected. For partially deaf animals, some decrease in CAP amplitude could be seen (h). In severely deaf animals, no effect of the acoustic masker on the laser-evoked CAP response could be detected (i). 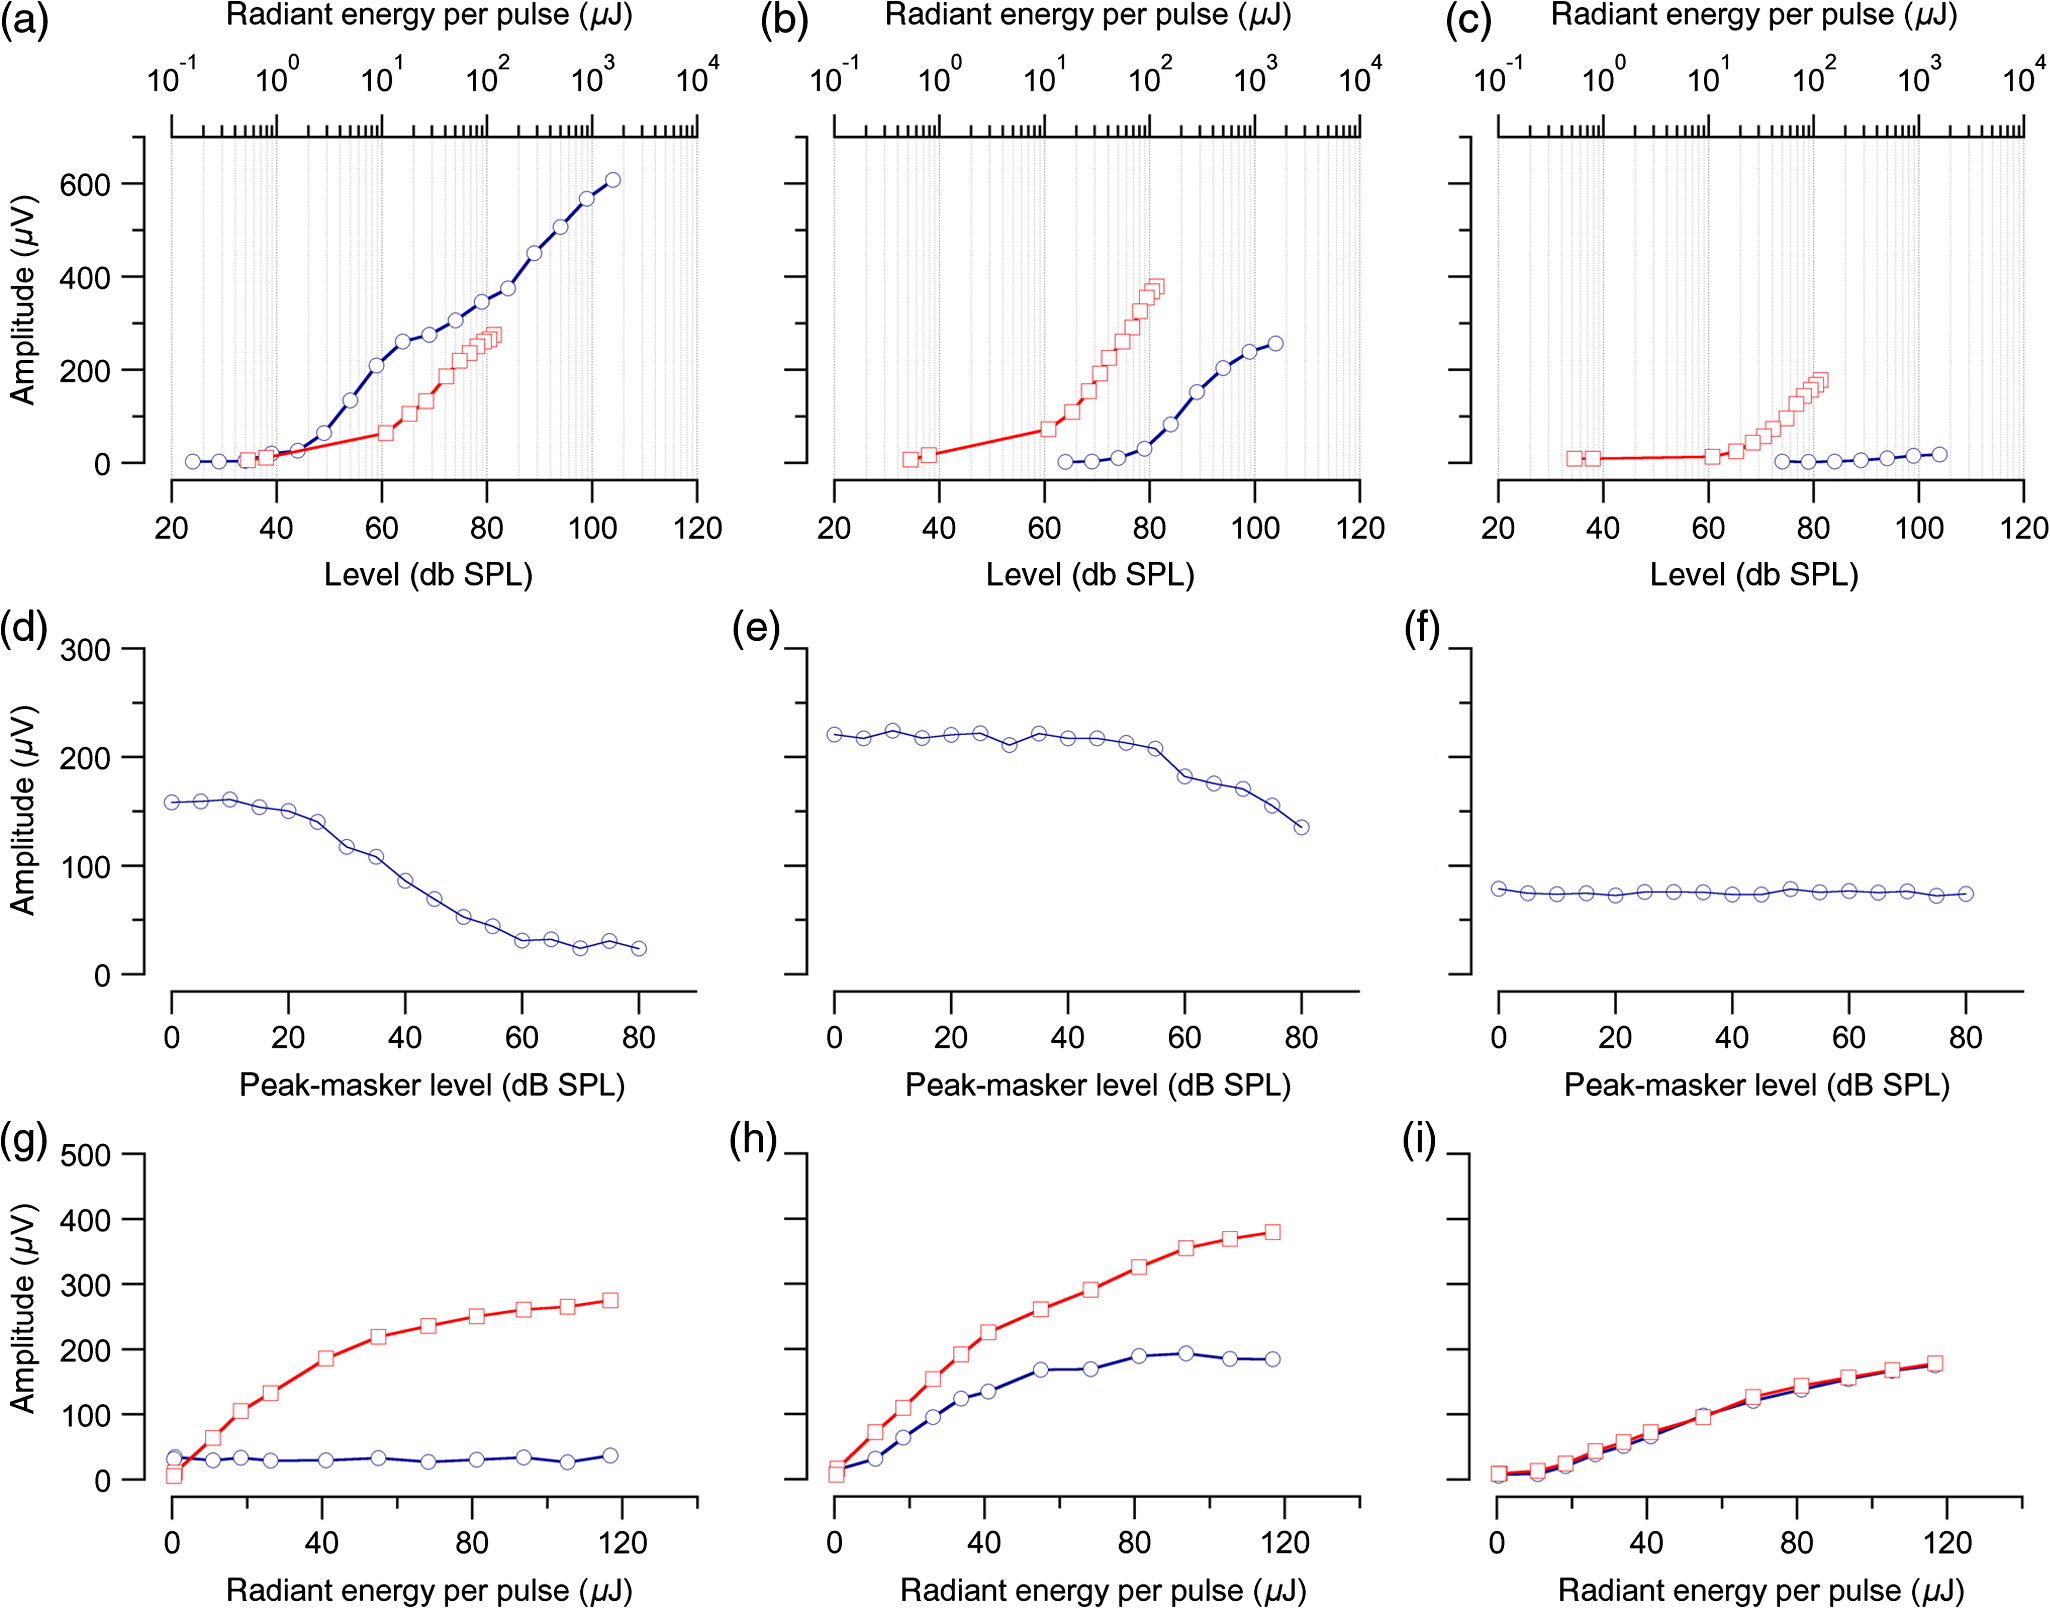 While Fig. 4 shows the examples (single animals) for click- and laser-evoked CAPs, Fig. 5 provides the data from all animals. The gray curves are the values of individual animals, while the black curves are the average values with corresponding standard deviations. On average, the threshold for an acoustic click response was 51 dB SPL in normal hearing animals, 73 dB SPL in partially deaf animals, and 98 dB SPL in severely deaf animals. Statistical testing showed that the differences in threshold are significant; ANOVA (, , ); HSD test by Tukey: normal hearing versus deaf ; normal hearing versus severely deaf ; and deaf versus severely deaf . Fig. 5(a) through (f) show the increase in CAP amplitude with increasing stimulus level, the I/O-contours of all animals. Gray traces give the contours for the individual animals and the black solid traces provide the averages with the corresponding standard deviations. (a) through (c) are obtained while the cochlea was stimulated with acoustic clicks. The threshold had a significant increase from untreated (a) to partially deaf (c) and severely deaf (c) animals. A significant difference was found in the maximum click-evoked amplitude of untreated and severely deaf animals (a) and (c). This was different when stimulation was achieved with the laser. There was no significant threshold change in control animals (d), partially deaf animals (e), and severely deaf animals (f). No significant difference was found for the maximum laser-evoked amplitudes (d) through (f). 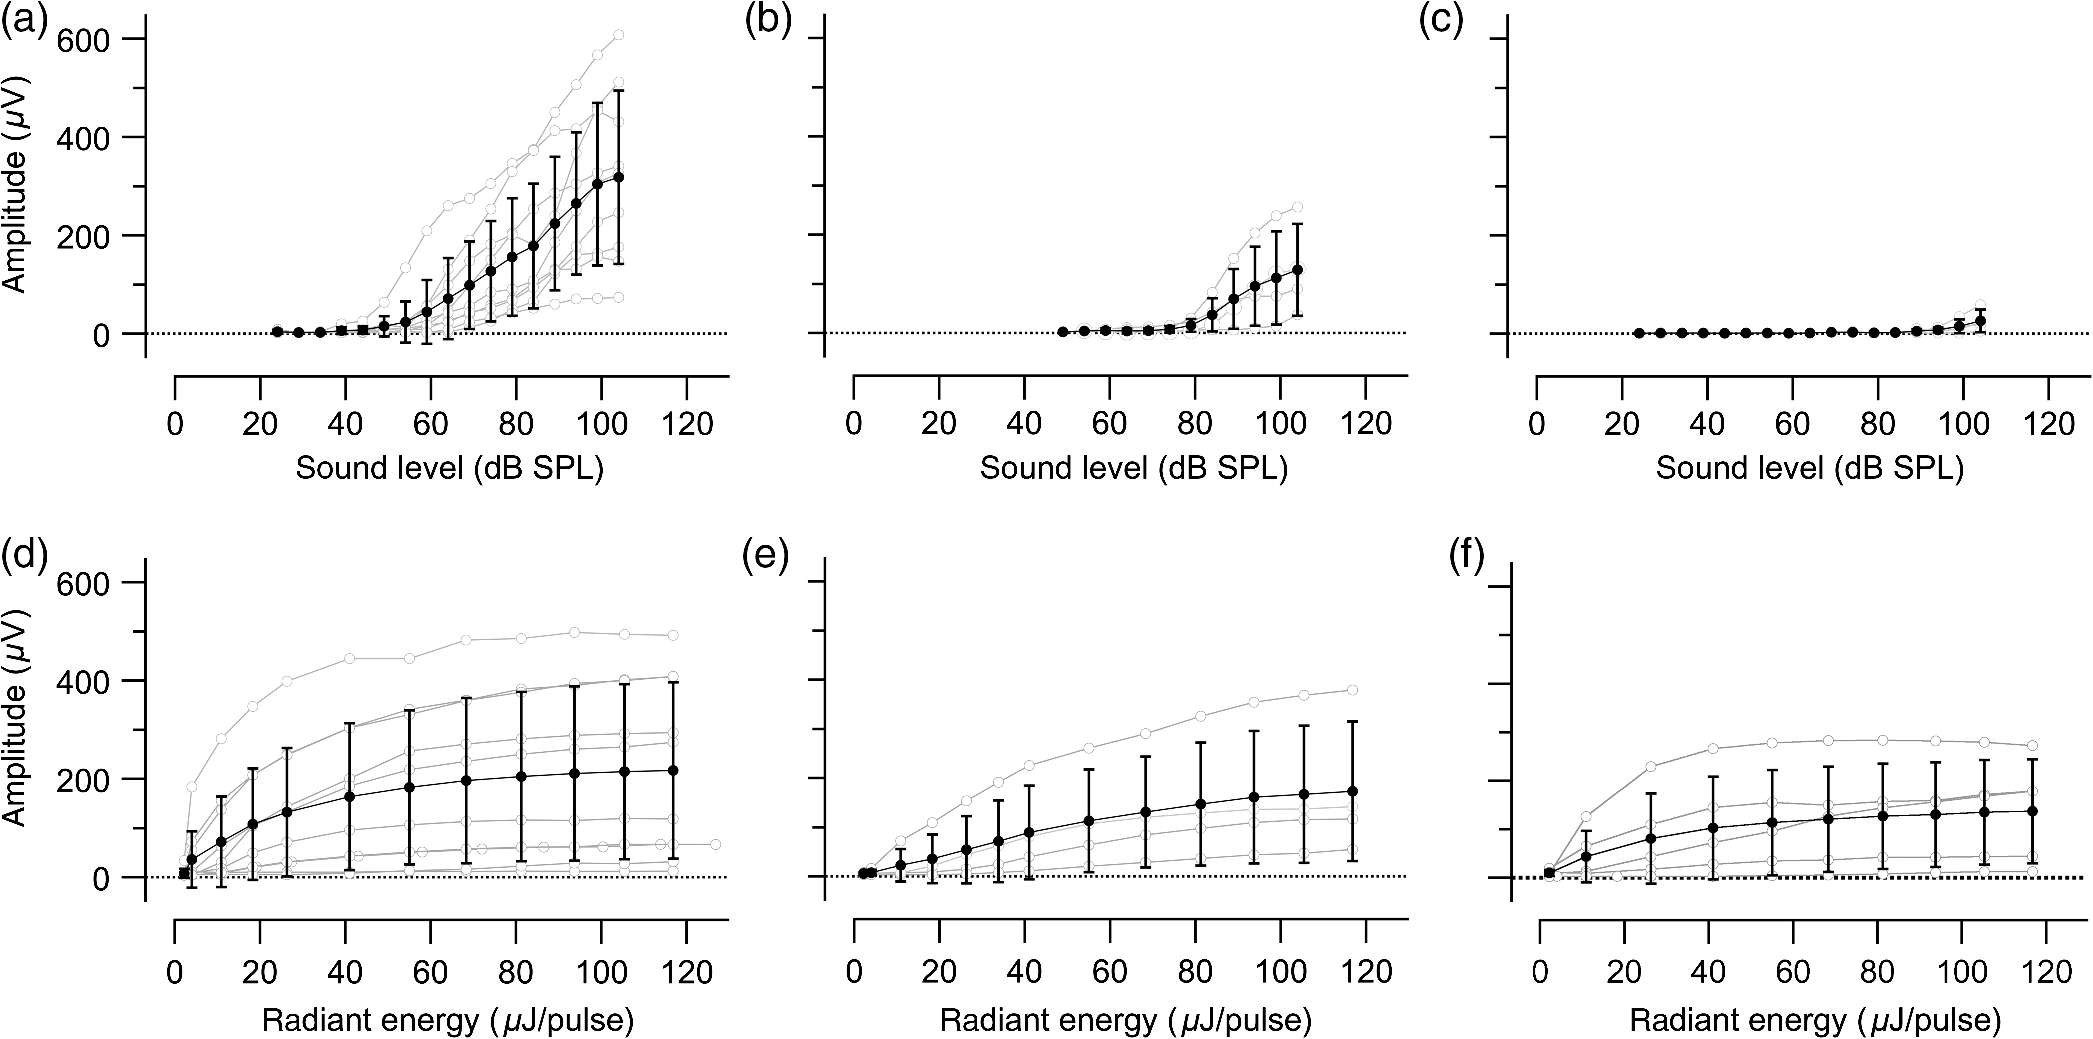 Damaging the cochleae also resulted in a decrease of the maximum amplitude from in normal hearing animals to in partial and in severely deaf animals [Figs. 5(a)–5(c)]. Statistical testing showed that the differences in threshold are significant when normal and severe animals were compared; ANOVA (, , ); HSD test by Tukey: normal hearing versus partially deaf ; normal hearing versus severely deaf ; and partially deaf versus severely deaf . In contrast to acoustic stimuli, the average threshold for a response to laser pulses was in normal hearing animals, in partially deaf animals, and in severely deaf animals. Statistical testing showed that the differences in threshold are not significant; ANOVA (, , ). The average maximum amplitude evoked with the highest radiant energies delivered by the laser, decreased from in hearing animals to and in partially and severely deaf animals, respectively [Figs. 5(d) and 5(e)]. Statistical testing showed that the differences in threshold are not significant; ANOVA (, , ). 3.2.Compound Action Potential Masking RecordingsTo evaluate the effect of an acoustic masker on CAP amplitudes, two series of experiments were performed to determine (1) the effect of a variable level acoustic stimulus on a fixed radiant energy exposure [variable masker, Figs. 4(d)–4(f)] and (2) the effect of a fixed acoustic stimulus on varied radiant energy exposures [variable INS, Figs. 4(g)–4(i)]. 3.2.1.Variable maskerIn normal hearing and partially deaf animals, the amplitude of laser-evoked CAPs rapidly decreased with increasing masker noise level. The effect of the acoustic masker is first seen at the hearing threshold of the animal. In chronically deaf animals, no masking occurs and the amplitude of the laser response is not reduced [Figs. 4(d), 4(e), and 6(a)–6(c)]. Fig. 6(a) through (c) show the effect of the acoustic masker on the optically evoked responses. To compare between different animals, the data were normalized by corresponding individual maximum evoked response under the unmasked condition. Gray traces give the results from each individual animal and the black solid traces provide the averages with the corresponding standard deviations. (a) shows the data obtained from normal hearing animals. The probe’s response rapidly decreases with the increase of masker level. (b) shows the responses from partially deaf animals. The probe’s response decreases once the masker reaches the threshold for acoustic stimulation. (c) shows the results from severely deaf animals. No masking occurs up to the highest sound levels of the masker. 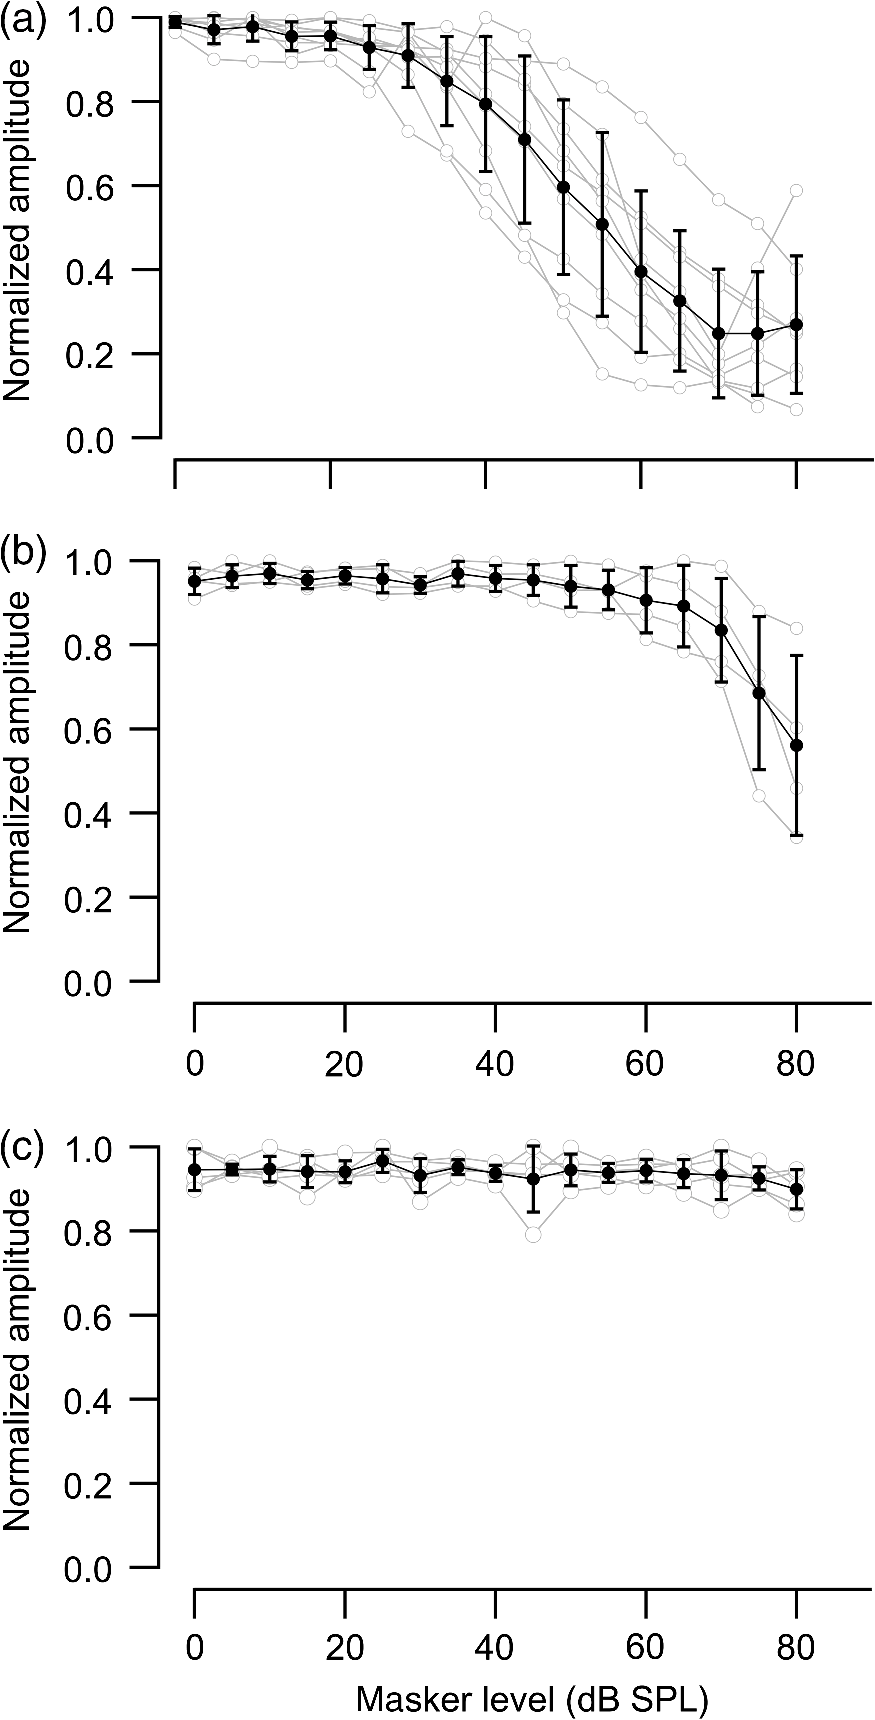 3.2.2.Variable infrared neural stimulationFor the experiments, the sound level for the noise masker was 80 dB SPL [Figs. 4(g)–4(i)]. The noise stimulus effectively masked the laser response at all radiant energies in normal hearing animals [Fig. 4(g)]. In partially deaf animals, the laser response threshold has no change, while the amplitude was reduced [Fig. 4(h)]. In severely deaf animals, the laser response threshold has no change either, and the acoustic masker has no effect on the laser responses [Fig. 4(i)]. 3.3.HistologyHistological analysis was performed on the severely deaf animals. Because the animals were only treated with neomycin on one side, the untreated side was used as a control. In the control, cochleae, on an average of 7 out of 10 sections (67%, Fig. 7), showed hair cells across all turns of all animals. In the severely deaf cochleae, an average of only 3 out of 10 sections (31%, Fig. 7) showed hair cells across all turns of all animals. No significant difference between the turns could be seen. As seen by the inner hair cell counts, the damaging of the cochleae was not complete. Some hair cells remained in the damaged cochleae. Despite the presence of some hair cells, no auditory responses could be evoked at stimulus frequencies above 16 kHz in two animals, and no responses could be evoked for stimulus frequencies between 2 and 32 kHz in another two animals. In all cases, the threshold for acoustic stimulation was significantly elevated. Detailed results for hair cell probability across the different turns of the cochlea are shown in Fig. 7. Fig. 7The average probability of an inner (a) and outer (b) hair cell nucleus being present in a section of the cochlea from severely deaf animals, using the untreated side of the same animal as control. The labels on the -axis represent different sites along the cochlea, as seen from a mid-modiolar plane: B1: basal turn, basal cut edge; B2 basal turn, apical cut edge; LM1: lower middle turn, basal cut edge; LM2: lower middle turn, apical cut edge; UM1: upper middle turn, basal cut edge; UM2: upper middle turn, apical cut edge; A1: apical turn, basal cut edge; and A2: apical turn, helicotrema. After the cochleae were sectioned, at least 10 of the most mid-modiolar sections were screened for the presence of a hair cell nucleus. A “1” was assigned to slices with a nucleus and a “0” was assigned to slices without a nucleus. Data from the treated and untreated cochleae were averaged and displayed with their respective standard deviation. 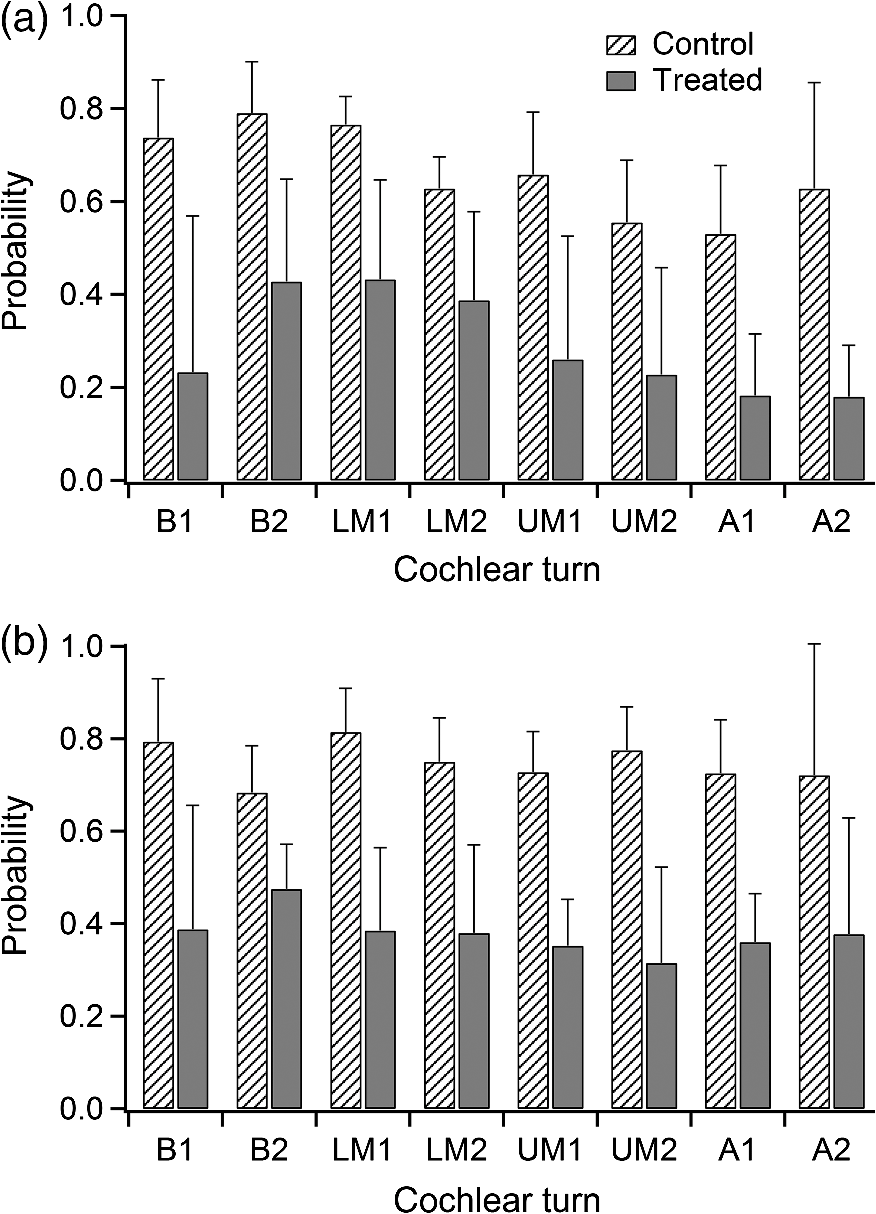 It is seen that there are still outer and inner hair cells remaining in the severely deaf animals, as well as a large standard deviation (Fig. 7). Although all cochleae had some remaining hair cells, the large variation in hair cell probability is due to the difference between the animals that had response to pure tones and those that did not [Fig. 3(c)]. The animals with pure tone responses showed a higher probability for finding inner and outer hair cells than the animals with no pure tone response. Although there are still hair cells in the severely deaf animals, the physiological data suggest that the majority of the remaining hair cells can no longer be acoustically stimulated [Figs. 5(c) and 6(c)]. 4.DiscussionINS results from complex interactions of the photons and the target tissue. At present, consensus exists that the first step of INS involves the heating of the tissue.7,8,28 For the next steps, several possibilities have been discussed and some may occur in sequence. Steps include the generation of a depolarizing capacitive current,9,29–31 the activation of temperature-sensitive ion channels such as the TRP channels,11,32–34 increase of intracellular calcium concentration,13–15 and the generation of a stress relaxation wave that mechanically stimulate hair cells.21,22,35 4.1.Capacitive CurrentExperimental results and modeling have shown that the resulting depolarization for the selected laser parameters is in the order of 10 mV.9,29–31 This change in membrane potential might not be sufficient to evoke an action potential if the resting potential of the neuron is close to . However, if the resting potential of the neuron is more positive, closer to the activation potential of sodium channels, the laser pulse can evoke a response. In other words, if it is possible to change the resting potential of the neuron toward the activation threshold for sodium channels, the neuron becomes more sensitive to optical stimulation. It has been shown in oocytes,9 in Aplysia californica and in rat sciatic nerves,36,37 that the threshold for INS can be lowered by electrical-optical costimulation. The electrical stimulus is thought to depolarize the cell without evoking an action potential. The action potential is then initiated by the irradiation with the laser. 4.2.Temperature-Sensitive ChannelsThe existence of TRPV1 and TRPV4 channels in the membrane of auditory, vestibular, and vagal neurons has been shown by immunohistochemical staining.11,32,34,38 Direct experimental evidence that TRPV1 and TRPV4 channels are activated by the irradiation comes from in vitro and in vivo experiments. In a patch clamp experiment, the direct irradiation of the membrane and the increase of the temperature above 43°C resulted in the activation of the channels.39 Similarly, auditory, vestibular, and vagal neurons were cultured and could be stimulated by direct irradiation. The use of specific channel blockers and immunohistochemistry confirmed the presence of the channels in the target structures.32–34 In vivo experiments on mice that lack the TRPV1 channel showed reduced ability to evoke an action potential with the laser in the cochlea.11 While in vitro experiments suggest that the activation of TRPV channels provides a mechanism by which INS generates action potentials, two other independent sets of data would argue against TRPV channels as the main contributing factor. In frogs8 and in fish,13 cooling of the animal did not decrease the response to INS. The authors concluded from the experiments that a temporal and spatial temperature gradient is required for INS. The absolute temperature is not the key factor for INS and temperatures can be shifted away from the activation temperature of selected TRP channels without affecting the ability to evoke a response with INS. 4.3.Affecting the Calcium HomeostasisINS results in an intracellular calcium increase and the subsequent depolarization of the cell. The increase in free calcium caused by infrared irradiation was found in the vestibular system13,15 in cardiomyocytes14 and the cortex.16,17 While it has been well documented that the intracellular calcium concentration increases upon irradiation, it is not clear how the increased calcium results in an action potential. 4.4.Deafening of the AnimalsDeafening of the guinea pigs with a transtympanic neomycin injection ( of Ringer’s lactate containing 25 mM of neomycin) elevated significantly acoustically evoked CAP responses by 40 to 60 dB, but had little effect on the optically evoked CAP thresholds. In contrast to CAP thresholds, the maximum CAP amplitude decreased after deafening, while the changes were not statistically significant. For acoustic stimulation, it has been established that the CAP amplitude depends on the number of auditory neurons stimulated simultaneously.40,41 We assume that, similar to acoustical stimulation, the number of spiral ganglion neurons that are simultaneously depolarized in response to optical stimuli determines the CAP amplitude. Consequently, factors that determine the CAP amplitude include the spiral ganglion cell population and the synchronous firing of neurons in response to the optical radiation. On the other hand, it has been reported for the vestibular system that hair cells might be stimulated directly, but not by mechanically stimulating the streocilia bundles.13 4.5.Contributions of Hair CellsIt has been argued for the vestibular system that hair cells are the target for the radiation.13 The input is not via the hair cell stereocilia bundles but via a direct interaction between the radiation and the cell membrane. Some hair cells are present in all the cochleae (Fig. 7), therefore, a mechanism of stimulation as seen in the vestibular system cannot be ruled out. In other words, this hypothesis assumes that while the remaining hair cells are no longer mechanically excitable, they can still generate action potentials. 4.6.Mechanical EventA mechanical event as the mechanism for INS was not supported for stimulation of the rat sciatic nerve.8 The authors used optical coherence tomography to measure the displacement of an isolated rat sciatic nerve during irradiation with a Ho:YAG laser at a resolution of 20 nm. They also used a microindenter to model the effect of irradiating the nerve. None of the two approaches gave evidence that a mechanical event is responsible for INS, rather the spatially and temporally confined heating of the target volume result in the generation of an action potential. In contrast to cortical or peripheral nerve stimulation, cochlear INS has been explained by both a mechanical stimulation of the basilar membrane and hair cells22,42 and a direct stimulation of the neurons.43 The results from experiments have been published which can be explained by either mechanical stimulation of the cochlea or by direct stimulation of auditory neurons. The pressure caused by the stress relaxation wave during irradiation with IR was measured in air and in a swimming pool using a hydrophone.22 The peak equivalent value for a radiant exposure of in air was 62 dB (re ) and was 31 mPa or 63.8 dB (re ) in a swimming pool. Radiant exposure for stimulation is typically and does not change significantly from normal hearing to acutely deafened animals. Deafness does not rule out the possibility of stimulation with pure tones. However, in deaf animals, pure tone thresholds for acoustical stimulation are typically above 80 dB SPL, which is about 20 dB above the expected pressure created by the laser at its maximum possible output. Moreover, the reported pressure values for stress relaxation waves are obtained at the radiant energies, which are 20 times the radiation energy required to reach threshold for INS. The present experiments were designed to further determine whether an acoustic effect is sufficient to explain INS-evoked response in the cochlea. The interactions of two stimuli in the cochlea have been used to address this question. In general, two acoustic, two electrical, or two optical stimuli, or the combination thereof interact in the cochlea. If one of the stimuli is used as the probe and the other as the masker, the masker will decrease the response to the probe stimulus. The amount of the reduction that can be achieved by the masker stimulus serves as a measure to determine the degree of interaction. For our experiments, the probe was the optical stimulus and the masker was a broadband acoustic noise stimulus. The photons were delivered via an optical fiber inserted into scala tympani, and the acoustic stimulus was delivered via a speaker at the outer ear canal of the same ear. In normal hearing animals, the acoustic stimulus masked the response to the optical stimulus. The masking was less in partially deaf animals and was absent in severely deaf animals [Figs. 3(d) and 3(e)]. Assuming that the optical and the acoustical stimuli both result in a mechanical event stimulating hair cells, masking would be the interaction between the two acoustic stimuli. The masking effect decreased in partially deaf animals and was absent in severely deaf animals. Since the deafening is not complete and some hair cells are still found along the entire cochlea, one may argue that the acoustic and the optical stimuli are both mechanical but stimulate the cochlea at different sites along the cochlea. In other words, the laser stimulation occurs at low frequencies (below 10 kHz) and the acoustic masker vibrates the basilar membrane at high frequencies (above 10 kHz). If this is the case, once acoustically evoked CAP thresholds for frequencies above 10 kHz are drastically elevated, stimulation with the acoustic noise stimulus will not be possible. However, laser-evoked responses could still be feasible for frequencies below 10 kHz and no masking should be seen. The latter scenario is unlikely as it has been demonstrated in the literature on tone-on-tone masking that a masker is inefficient for frequencies above the best frequency of the probe, here the laser.23,24 In summary, our findings do not support the view that both the acoustic noise stimulus and the optical stimulus evoke a mechanical event. Rather, the finding supports the notion that the acoustic stimulus evokes a mechanical event and the laser stimulation is achieved through a direct interaction between the radiation and cochlear structures. The findings from this study, however, do not explain the results obtained after successive perfusion of the cochlea with neomycin.21,42 Following the perfusion, responses to laser and auditory stimulation disappeared, while monopolar electrical stimulation was only slightly changed. While it can be argued that the perfusion with neomycin did not alter the response properties of the neurons, two sets of data question this notion: it has been shown that in neomycin-deafened gerbils, both optical and bipolar electrical stimulations disappeared in some animals if large amounts of neomycin were applied.44 Furthermore, we have shown in the guinea pig that large fractions of the cochlea can be removed without greatly affecting responses to electrical monopolar stimulation in the guinea pig.45 Unfortunately, the discussion above does not provide irrefutable proof on the issue of whether cochlear INS is dominated by direct neuronal interaction or a pressure wave. The ideal experiment has not yet been conducted to prove the mechanism of cochlear INS. To judge whether mechanical events are the cause of neural stimulation in the cochlea, one has to conduct behavioral experiments in a damaged cochlea. Current efforts are underway to develop small light sources which can be chronically implanted for behavioral testing. 4.7.SummaryThe goal of this study was to determine whether the mechanism of INS in the cochlea can be explained by direct neural stimulation. Amplitude and threshold for acoustic click-evoked responses are different between normal hearing and deaf animals; CAP threshold increases and the maximum response amplitude decreases in deaf animals. This is different for the laser responses. The threshold for laser stimulation remains almost unchanged in deaf animals; only a reduction of the maximum response amplitude is observed. We conclude from the experiments that the responses to laser pulses are not dominated by an acoustic event but rather reflect the direct interaction of the radiation and the neural tissue. AcknowledgmentsThis project has been funded with federal funds from the NIDCD, R01-DC011855 and by Lockheed Martin Aculight. The authors thank S. Kadakia for the data processing of some of the experiments. ReferencesA. D. Izzo et al.,
“Optical parameter variability in laser nerve stimulation: a study of pulse duration, repetition rate, and wavelength,”
IEEE Trans. Biomed. Eng., 54
(6 Pt 1), 1108
–1114
(2007). http://dx.doi.org/10.1109/TBME.2007.892925 IEBEAX 0018-9294 Google Scholar
C.-P. Richter et al.,
“Spread of cochlear excitation during stimulation with optical radiation: inferior colliculus measurements,”
J. Neural Eng., 8
(5), 056006
(2011). http://dx.doi.org/10.1088/1741-2560/8/5/056006 1741-2560 Google Scholar
J. Wells et al.,
“Biophysical mechanisms of transient optical stimulation of peripheral nerve,”
Biophys. J., 93
(7), 2567
–2580
(2007). http://dx.doi.org/10.1529/biophysj.107.104786 BIOJAU 0006-3495 Google Scholar
J. Wells et al.,
“Optical stimulation of neural tissue in vivo,”
Opt. Lett., 30
(5), 504
–506
(2005). http://dx.doi.org/10.1364/OL.30.000504 OPLEDP 0146-9592 Google Scholar
L. E. Moreno et al.,
“Infrared neural stimulation: beam path in the guinea pig cochlea,”
Hear. Res., 282
(1–2), 289
–302
(2011). http://dx.doi.org/10.1016/j.heares.2011.06.006 HERED3 0378-5955 Google Scholar
P. Littlefield et al.,
“Laser stimulation of single auditory nerve fibers,”
Laryngoscope, 120
(10), 2071
–2082
(2010). http://dx.doi.org/10.1002/lary.21102 Google Scholar
C. P. Richter and X. Tan,
“Photons and neurons,”
Hear. Res., 311C 72
–88
(2014). http://dx.doi.org/10.1016/j.heares.2014.03.008 HERED3 0378-5955 Google Scholar
J. Wells et al.,
“Biophysical mechanisms of transient optical stimulation of peripheral nerve,”
Biophys. J., 93
(7), 2567
–2580
(2007). http://dx.doi.org/10.1529/biophysj.107.104786 BIOJAU 0006-3495 Google Scholar
M. G. Shapiro et al.,
“Infrared light excites cells by changing their electrical capacitance,”
Nat. Commun., 3 736
(2012). http://dx.doi.org/10.1038/ncomms1742 NCAOBW 2041-1723 Google Scholar
J. Yong et al.,
“Gold-nanorod-assisted near-infrared stimulation of primary auditory neurons,”
Adv. Healthcare Mater., 3
(11), 1862
–1868
(2014). http://dx.doi.org/10.1002/adhm.201400027 AHMDBJ 2192-2640 Google Scholar
E. Suh et al.,
“Optical stimulation in mice which lack the TRPV1 channel.,”
Proc. SPIE, 7180 71800S
(2009). http://dx.doi.org/10.1117/12.816891 PSISDG 0277-786X Google Scholar
E. S. Albert et al.,
“TRPV4 channels mediate the infrared laser evoked response in sensory neurons,”
J. Neurophysiol.,
(2011). http://dx.doi.org/10.1152/jn.00424.2011 JONEA4 0022-3077 Google Scholar
S. M. Rajguru et al.,
“Infrared photostimulation of the crista ampullaris,”
J. Physiol., 589
(6), 1283
–1294
(2011). http://dx.doi.org/10.1113/jphysiol.2010.198333 JPHYA7 0022-3751 Google Scholar
G. M. Dittami et al.,
“Intracellular calcium transients evoked by pulsed infrared radiation in neonatal cardiomyocytes,”
J. Physiol., 589
(6), 1295
–1306
(2011). http://dx.doi.org/10.1113/jphysiol.2010.198804 JPHYA7 0022-3751 Google Scholar
V. Lumbreras et al.,
“Pulsed infrared radiation excites cultured neonatal spiral and vestibular ganglion neurons by modulating mitochondrial calcium cycling,”
J. Neurophysiol., 112
(6), 1246
–1255
(2014). http://dx.doi.org/10.1152/jn.00253.2014 JONEA4 0022-3077 Google Scholar
J. M. Cayce et al.,
“Calcium imaging of infrared-stimulated activity in rodent brain,”
Cell Calcium, 55
(4), 183
–190
(2014). http://dx.doi.org/10.1016/j.ceca.2014.01.004 CECADV 0143-4160 Google Scholar
J. M. Cayce et al.,
“Infrared neural stimulation of primary visual cortex in non-human primates,”
Neuroimage, 84 181
–190
(2014). http://dx.doi.org/10.1016/j.neuroimage.2013.08.040 NEIMEF 1053-8119 Google Scholar
J. M. Cayce et al.,
“Pulsed infrared light alters neural activity in rat somatosensory cortex in vivo,”
Neuroimage, 57
(1), 155
–166
(2011). http://dx.doi.org/10.1016/j.neuroimage.2011.03.084 NEIMEF 1053-8119 Google Scholar
M. J. van Gemert and A. J. Welch,
“Time constants in thermal laser medicine,”
Lasers Surg. Med., 9
(4), 405
–421
(1989). http://dx.doi.org/10.1002/(ISSN)1096-9101 LSMEDI 0196-8092 Google Scholar
C. P. Richter et al.,
“Spread of cochlear excitation during stimulation with pulsed infrared radiation: inferior colliculus measurements,”
J. Neural Eng., 8
(5), 056006
(2011). http://dx.doi.org/10.1088/1741-2560/8/5/056006 1741-2560 Google Scholar
M. Schultz et al.,
“Nanosecond laser pulse stimulation of the inner ear-a wavelength study,”
Biomed. Opt. Express, 3
(12), 3332
–3345
(2012). http://dx.doi.org/10.1364/BOE.3.003332 BOEICL 2156-7085 Google Scholar
I. U. Teudt et al.,
“Acoustic events and “optophonic” cochlear responses induced by pulsed near-infrared laser,”
IEEE Trans. Biomed. Eng., 58
(6), 1648
–1655
(2011). http://dx.doi.org/10.1109/TBME.2011.2108297 IEBEAX 0018-9294 Google Scholar
A. I. Matic, J. T WalshJr. and C. P. Richter,
“Spatial extent of cochlear infrared neural stimulation determined by tone-on-light masking,”
J. Biomed. Opt., 16
(11), 118002
(2011). http://dx.doi.org/10.1117/1.3655590 JBOPFO 1083-3668 Google Scholar
P. Dallos and M. A. Cheatham,
“Compound action potential (AP) tuning curves,”
J. Acoust. Soc. Am., 59
(3), 591
–597
(1976). http://dx.doi.org/10.1121/1.380903 JASMAN 0001-4966 Google Scholar
P. Lin et al.,
“Ipsilateral masking between acoustic and electric stimulations,”
J. Acoust. Soc. Am., 130
(2), 858
–865
(2011). http://dx.doi.org/10.1121/1.3605294 JASMAN 0001-4966 Google Scholar
I. U. Teudt et al.,
“Optical stimulation of the facial nerve: a new monitoring technique?,”
Laryngoscope, 117
(9), 1641
–1647
(2007). http://dx.doi.org/10.1097/MLG.0b013e318074ec00 LARYA8 0023-852X Google Scholar
G. M. Hale and M. R. Querry,
“Optical constants of water in the 200 nm to region,”
Appl. Opt., 12 555
–563
(1973). http://dx.doi.org/10.1364/AO.12.000555 APOPAI 0003-6935 Google Scholar
A. D. Izzo et al.,
“Optical parameter variability in laser nerve stimulation: a study of pulse duration, repetition rate, and wavelength,”
IEEE Trans. Biomed. Eng., 54
(6 Pt 1), 1108
–1114
(2007). http://dx.doi.org/10.1109/TBME.2007.892925 IEBEAX 0018-9294 Google Scholar
Q. Liu et al.,
“Exciting cell membranes with a blustering heat shock,”
Biophys. J., 106
(8), 1570
–1577
(2014). http://dx.doi.org/10.1016/j.bpj.2014.03.008 BIOJAU 0006-3495 Google Scholar
E. J. Peterson and D. J. Tyler,
“Activation using infrared light in a mammalian axon model,”
Conf. Proc. IEEE Eng. Med. Biol. Soc., 2012 1896
–1899
(2012). http://dx.doi.org/10.1109/EMBC.2012.6346323 Google Scholar
O. Okunade and J. Santos-Sacchi,
“IR laser-induced perturbations of the voltage-dependent solute carrier protein SLC26a5,”
Biophys. J., 105
(8), 1822
–1828
(2013). http://dx.doi.org/10.1016/j.bpj.2013.09.008 BIOJAU 0006-3495 Google Scholar
A. Y. Rhee et al.,
“Photostimulation of sensory neurons of the rat vagus nerve,”
Proc. SPIE, 6854 68540E
(2008). http://dx.doi.org/10.1117/12.772037 PSISDG 0277-786X Google Scholar
J. M. Bec et al.,
“Characteristics of laser stimulation by near infrared pulses of retinal and vestibular primary neurons,”
Lasers Surg. Med., 44
(9), 736
–745
(2012). http://dx.doi.org/10.1002/lsm.v44.9 LSMEDI 0196-8092 Google Scholar
E. S. Albert et al.,
“TRPV4 channels mediate the infrared laser-evoked response in sensory neurons,”
J. Neurophysiol., 107
(12), 3227
–3234
(2012). http://dx.doi.org/10.1152/jn.00424.2011 JONEA4 0022-3077 Google Scholar
R. U. Verma et al.,
“Auditory responses to electric and infrared neural stimulation of the rat cochlear nucleus,”
Hear. Res., 310 69
–75
(2014). http://dx.doi.org/10.1016/j.heares.2014.01.008 HERED3 0378-5955 Google Scholar
A. R. Duke et al.,
“Hybrid electro-optical stimulation of the rat sciatic nerve induces force generation in the plantarflexor muscles,”
J. Neural Eng., 9
(6), 066006
(2012). http://dx.doi.org/10.1088/1741-2560/9/6/066006 1741-2560 Google Scholar
A. R. Duke et al.,
“Combined optical and electrical stimulation of neural tissue in vivo,”
J. Biomed. Opt., 14
(6), 060501
(2009). http://dx.doi.org/10.1117/1.3257230 JBOPFO 1083-3668 Google Scholar
C. D. Balaban, J. Zhou and H. S. Li,
“Type 1 vanilloid receptor expression by mammalian inner ear ganglion cells,”
Hear. Res., 175
(1–2), 165
–170
(2003). http://dx.doi.org/10.1016/S0378-5955(02)00734-7 HERED3 0378-5955 Google Scholar
J. Yao, B. Liu and F. Qin,
“Rapid temperature jump by infrared diode laser irradiation for patch-clamp studies,”
Biophys. J., 96
(9), 3611
–3619
(2009). http://dx.doi.org/10.1016/j.bpj.2009.02.016 BIOJAU 0006-3495 Google Scholar
A. J. Derbyshire and H. Davis,
“The action potential of the auditory nerve,”
Am. J. Physiol., 113 476
–504
(1935). AJPHAP 0002-9513 Google Scholar
H. Davis et al.,
“The electric response of the cochlea,”
Am. J. Physiol., 107 311
–332
(1934). AJPHAP 0002-9513 Google Scholar
M. Schultz et al.,
“Pulsed wavelength-dependent laser stimulation of the inner ear,”
Biomed. Tech. (Berl)., 57
(Suppl 1), 833
(2012). http://dx.doi.org/10.1515/bmt-2012-4339 Google Scholar
A. D. Izzo et al.,
“Laser stimulation of the auditory nerve,”
Lasers Surg. Med., 38
(8), 745
–753
(2006). http://dx.doi.org/10.1002/(ISSN)1096-9101 LSMEDI 0196-8092 Google Scholar
C. P. Richter et al.,
“Optical stimulation of auditory neurons: effects of acute and chronic deafening,”
Hear. Res., 242
(1–2), 42
–51
(2008). http://dx.doi.org/10.1016/j.heares.2008.01.011 HERED3 0378-5955 Google Scholar
H. K. Young, X. Tan and C.-P. Richter,
“Mechanical contributions of cochlear infrared neural stimulation (INS),”
Abstr. Assoc. Res. Otolaryngol., 37
(37), 319
(2014). Google Scholar
BiographyHunter K. Young is the lead laboratory staff member of Dr. Richter’s laboratory in the Department of Otolaryngology at Northwestern University in Chicago, Illinois. He received his BS degree in biology from the University of Denver in 2008. Along with standard laboratory upkeep and collaborating on a variety of projects, he pursues his own research topics. His research interests include cochlear optical stimulation and neuron regeneration. Xiaodong Tan received his PhD in biomedical sciences from Creighton University, Omaha, Nebraska, in 2010. He studied the structure and function relationship of the motor protein prestin, cochlear hair cell function, and infrared neural stimulation in his graduate program and postdoctorate training. Currently, he is a research assistant professor in Department of Otolaryngology, Northwestern University in Chicago, Illinois. Nan Xia received her bachelor’s degree in biomedical engineering from Henan University of Science and Technology, Henan, China, in 2008. Since 2009, she has been a PhD candidate in Department of Bioengineering, Chongqing University, Chongqing, China and now she is a joint-PhD student in Department of Otolaryngology, Northwestern University, Chicago, Illinois. Her current research interests include the development and improvement of cochlear implant optrodes and new strategies for cochlear stimulation using infrared laser. Claus-Peter Richter received his medical degree from the Johann Wolfgang Goethe University in Frankfurt and his master’s degree in physics at the Max Planck Institute for Biophysics, and completed his habilitation in the Department of Physiology. His primary interests are the development and improvement of cochlear implant electrodes, and the micromechanics of the cochlea. Recently, his research focused on developing cochlear implants that use optical radiation from pulsed lasers to stimulate auditory neurons. |


