
|
|
1.IntroductionA central challenge in studying circuit function within the somatosensory (barrel) cortex and other brain regions is to understand the spatial and temporal patterns of information flow between different columns and layers. In the case of the barrel cortex, measurements of single-neuron responses are of limited value when studying a circuit composed of many neurons of multiple cell types.1 A more powerful approach comes by considering circuit function at the population level, while monitoring the contributions of individual neuron types. For example, it would be useful to activate specific neuronal subtypes in different columns or layers, while simultaneously recording the activity of populations of neurons from all regions. Here, we adopt such an approach. For detecting the activity of populations of neurons, voltage-sensitive dyes (VSDs) have enabled reliable and fast reporting of neuronal membrane potential. Unlike calcium imaging, which mainly detects action potential firing, VSD imaging provides an unbiased measure of all electrical signals, including postsynaptic potentials and other subthreshold responses. The high spatial and temporal resolution of VSDs permits the tracking of circuit activity and establishing connectivity within and between all columns and layers of the barrel cortex, both in vivo2–4 and in vivo as well.1,5–7 Over the past few decades, many types of VSDs have been synthesized, including dyes based on absorption or birefringence and fluorescence.8,9 Among these, the fluorescence-based styryl dyes have been most successful for imaging activity in the mouse or rat brain.10–13 These dyes are useful because their vastly enhanced fluorescence in lipid membranes, in comparison to aqueous environments,14 improves signal-to-noise when imaging neuronal membrane potential changes. Furthermore, these dyes allow imaging of neural activity with relatively low photobleaching and minimal toxicity.10 In particular, the synthesis of improved long-wavelength styryl dyes15,16 has greatly enhanced the application of VSD imaging to cortex.17,18 To probe circuit function, VSD imaging is often combined with electrical stimulation of circuit elements. However, such experiments are limited because extracellular electrode stimulation is unspecific: it is usually difficult to define the neurons that are being stimulated and this makes it difficult to interpret circuit responses. Hence, there is a need for improved techniques that combine selective activation of neuronal populations with VSD imaging of circuit activity. Here, we have combined VSD imaging with channelrhodopsin-mediated photostimulation to probe circuit function in the barrel cortex. Our experiments are based on a recent report that red-shifted styryl VSDs are spectrally compatible with the light-activated cation channel, channelrhodopsin-2 (ChR2).19 The ability to use this channel to photostimulate makes ChR2 a very powerful tool for temporal control of neuronal membrane potential.20–22 Most importantly, ChR2 expression can be genetically targeted to specific subtypes of neurons via transgenic lines, viral delivery, or electroporation.23 In this way, it is possible to use light to both activate defined neuronal populations and to image responses of their downstream partners. Here we show that ChR2, in conjunction with a digital micromirror array system, can be used to specifically photostimulate layer 5 neurons across different cortical columns. In addition, all-optical mapping can be done by using VSDs to image responses of various layers and columns while sequentially activating different regions of the somatosensory cortex. By mapping out the contributions of both excitatory and inhibitory circuits in whisker-deprived mice, we found that sensory deprivation during early development does not significantly alter feedforward inhibition mediated by layer 5 pyramidal cells. This all-optical mapping approach provides an important high-throughput technology for determining interactions between somatosensory cortex circuit elements. 2.Materials and MethodsWe used VSD imaging and optogenetic photostimulation to characterize synaptic transmission and connectivity within somatosensory cortical circuits. 2.1.AnimalsAll procedures were approved by the Biological Resource Centre Institutional Animal Care and Use Committee. To photostimulate layer 5 pyramidal neurons, homozygous mice expressing ChR2 under the Thy1 promoter were used (line 18; JAX stock number 007612).24 P32 to 113 mice were used in the course of the study. For the whisker deprivation experiments, P36 to 44 mice were used. 2.2.HistologyTo characterize the expression of enhanced yellow fluorescent protein (eYFP)-tagged ChR2 in the brains of these transgenic mice, adult mice were anesthetized and euthanized with an overdose of ketamine/xylazine ( body weight) and transcardially perfused with 0.1 M phosphate buffer saline (PBS, pH 7.4) followed by 4% paraformaldehyde. The brain was removed and subsequently postfixed in 4% paraformaldehyde for an hour before it was transferred to 30% sucrose in 0.1 M PBS and stored at 4°C overnight in the fixative. The brain was then frozen and sectioned into thick slices on a cryostat. Fluorescent images were obtained with a confocal microscope (Nikon AR1-A1). 2.3.Whisker DeprivationFor sensory deprivation, all large mystacial whiskers (from rows A to E25 and arcs 0 to 6, and including , , , and whiskers) were removed. At P0, whiskers from the right cheek were first trimmed with tweezers by applying slow, steady tension to the base of the whiskers, followed by the light cauterization of whisker follicles using a hot wire tip of a custom-made cautery device. The neonates were anesthetized by rapid cooling via indirect contact with ice, to avoid frost burns during the deprivation procedure. To simulate any stimulation from whisker trimming, whiskers on the left cheek of pups were sham trimmed by stroking with tweezers as a control. After cauterization, pups were monitored throughout postop recovery in a warm cage until they recovered from the anesthesia and then were returned to the nursing mother. 2.4.Slice Preparationthick brain slices from P28-P33 mice were prepared in ice-cold cutting solution containing (in mM); 240 Sucrose, 10 Glucose, 25 , 1.25 , 2.5 KCl, 0.5 , and 7 , at 320 to 325 mOsm. Slices were then incubated in artificial cerebral spinal fluid solution containing (in mM); 10 Glucose, 126 NaCl, 24 , 1 , 2.5 KCl, 2.5 , and 2 (300 to 310 mOsm). The brain was sectioned at 50 deg to the midline in order to obtain across-column slices similar to the procedures detailed in Finnerty et al.26 Slices were incubated at 32°C for 30 min, and subsequently kept at room temperature (25°C) for another 30 min prior to slice imaging. For VSD imaging, slices were incubated as above before they were extracellularly stained with the VSD di-2-ANBDQPQ16 (0.9 mM) in a humidified air–liquid interface chamber for an hour at room temperature as detailed in Kee et al.11 This VSD was obtained from Prof. Les Loew at the University of Connecticut Health Center, United States. Barrels were visualized by transillumination of the slice. All recordings were done at room temperature. 2.5.Voltage-Sensitive Dye ImagingThe VSD was excited with 602 to 625 nm light from a halogen light source and fluorescence emission greater than 650 nm was captured by a high-speed charge-coupled device (CCD) camera (Micam02, Brainvision, Japan). At the beginning of the experiment, excitation light intensity was adjusted so that sample fluorescence emission was at 30% pixel saturation to prevent saturating the CCD camera and also to maintain similar levels of fluorescence emission across experiments. The exposure time was minimized to yield minimal bleaching during the course of an entire experiment. images were acquired at 2.2 ms sampling intervals and were subjected to spatial averaging. In some experiments, optical responses were evoked by electrical stimulation via a bipolar concentric electrode (outer diameter , inner diameter ; FHC, Bowdoin, Maine). Current pulses (0.5 ms duration) were generated by a Grass S88 stimulator (Grass Products). In other experiments, optical responses were evoked by photostimulating pyramidal neurons in slices from line 18 Thy1-ChR2 mice.24 When characterizing light-evoked responses in multiple cell types with whole-cell patch clamp recordings (Fig. 2), slices were excited with wide-field illumination (465 to 495 nm, 1.05 mW) from a mercury arc lamp under a objective. In these experiments, a potassium gluconate intracellular solution was used, containing (in mM); 130 K-Gluconate, 10 KOH, 10 4-(2-hydroxyethyl)piperazine-1-ethanesulfonic acid, 4 , 0.4 , 5 EGTA, 5 Disodium Phosphocreatine, 2.5 (290 to 295 mOsm, pH 7.25). Patch clamp recordings were made with pipettes (5 to 6 MΩ) pulled with a vertical puller (Narishige, Japan). For all-optical mapping experiments, photostimulation was done with a 460 nm light-emitting diode (LED) (Photonics) and a micromirror array system.19 For mapping experiments, 460 nm LED light power was under the 4×/0.2 NA objective. In all cases, images were averaged from four trials and repeated three times. To isolate contributions of compound excitatory postsynaptic potentials and inhibitory postsynaptic potentials (IPSPs) to VSD population responses,27 we used 6-cyano-7-nitroquinoxaline-2,3-dione (CNQX; ) or picrotoxin (PTX; ). The stimulus-induced change in VSD signal was calculated for each pixel as follows: where is the resting fluorescence and is the VSD fluorescence at time . Depolarization decreases dye fluorescence, therefore, will be positive for a membrane potential depolarization. For determination of VSD signals from layers , 4, or 5 within a column, responses from were typically averaged because this covers most of the area of a layer within a column.Data analyses were done with custom-made MATLAB® programs. For some analyses, a Savitzky–Golay filter was applied to reduce high-frequency noise and smooth optical traces. The Savitzky–Golay smoothing filter is a least-squares smoothing filter which is optimal for removing noise without distorting the waveform of fast signals.28–30 In particular, the Savitzky–Golay filters preserve the amplitude and shape of signal peaks, which is desirable for analyzing VSD signals. This is unlike more standard filters such as adjacent-averaging filters, which tend to distort higher frequency features such as action potentials. This property makes Savitzky–Golay filters useful for signal processing applications that require preservation of high-frequency components of a signal. In addition, it is an effective, fast, and simple-to-implement filter which can be adapted for image signal processing in even three dimensions.31 Pixels from the electrode and non-slice regions beyond the pia were masked out because they were not fluorescent. The Student’s t test was used to test for the level of statistical significance for changes in VSD responses. 3.Results3.1.Combining Photostimulation with Voltage-Sensitive Dye Imaging in the Somatosensory CortexIn order to photostimulate specific circuit elements within the barrel cortex, we used mice expressing ChR2 under the Thy1 promoter.24 These mice (line 18) were bred to homozygosity to enhance the sensitivity of ChR2-expressing neurons to light. In these mice, ChR2 was expressed in many brain regions [Fig. 1(a)]. Histological characterization of ChR2 expression indicated that ChR2 was expressed in pyramidal neurons and other cells in layer 5 of the somatosensory cortex, with some expression in layers and 4 neurons as well [Fig. 1(b)]. Fig. 1Expression of channelrhodopsin-2 (ChR2) in layer 5 pyramidal neurons in the barrel cortex of Thy1-ChR2 mice. (a) Expression of eYFP-tagged ChR2 (in green) in the cortex of homozygous Thy1-ChR2 line 18 mice. (b) Preferential expression of eYFP-tagged ChR2 in layer 5 pyramidal neurons in the cortex. 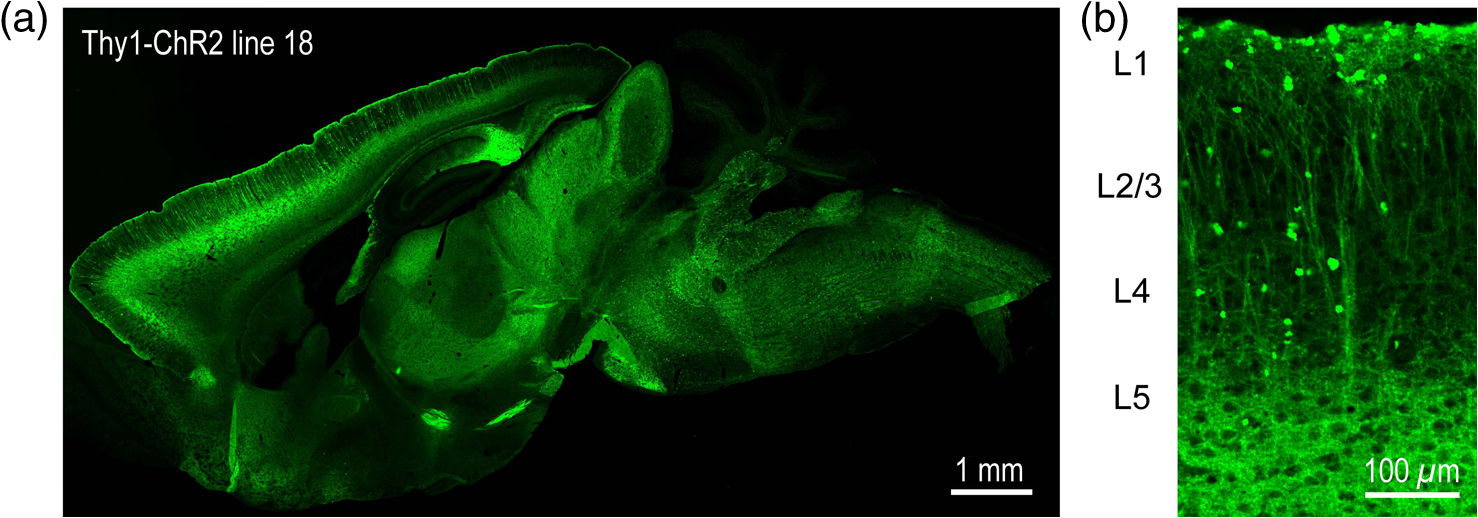 To precisely define which neuron types expressed ChR2, we made whole-cell patch clamp recordings from several different types of neurons and examined the responses of these cells to light. We first focused on layer 5 pyramidal cells, which have previously been reported to express ChR2 in this mouse line.24 Recordings were obtained from 12 pyramidal cells in layer 5; these cells could be identified by their distinctive pyramidal shape as well as their low-frequency firing of action potential trains with frequency adaptation32 in response to long (1 s duration) depolarizing current pulses [Fig. 2(a)]. To isolate direct responses to light, excitatory postsynaptic responses were blocked with the 2-amino-3-(5-methyl-3-oxo-1,2- oxazol-4-yl) propanoic acid (AMPA) receptor blocker, CNQX (). Under these conditions, brief (3 ms duration) light flashes evoked depolarizations in all 12 cells; in nine of these cells, the depolarization was sufficiently large to evoke action potentials [Fig. 2(b)]. Next, basket cells were examined. These gamma-aminobutyric acidergic (GABAergic) interneurons could be distinguished by their fast-spiking properties33 in response to depolarizing current pulses [Fig. 2(c)]. Of the 10 basket cells examined, eight of these showed short latency, direct depolarizing responses to light flashes. Six of these eight cells had light-evoked depolarizations sufficiently large to generate action potentials [Fig. 2(d)]. Fig. 2Light-evoked responses of multiple neuron types in barrel cortex slices from Thy1-ChR2 mice. (a) Action potential firing pattern (top trace) elicited in a layer 5 pyramidal cell in response to a 1 s duration depolarizing current pulse (lower trace). (b) Light-evoked responses produced by photostimulation (3 ms duration, at arrow). (c) Action potential firing pattern (top trace) elicited in a fast-spiking basket cell in response to a 1 s duration depolarizing current pulse (lower trace). (d) Light-evoked response produced by photostimulation (3 ms duration, at arrow). (e) Action potential firing pattern elicited in a nonfast-spiking interneuron in response to a 1 s duration depolarizing current pulse (lower trace). (f) Light-evoked depolarizing inhibitory postsynaptic potential (IPSP) produced by photostimulation (3 ms duration, at arrow). 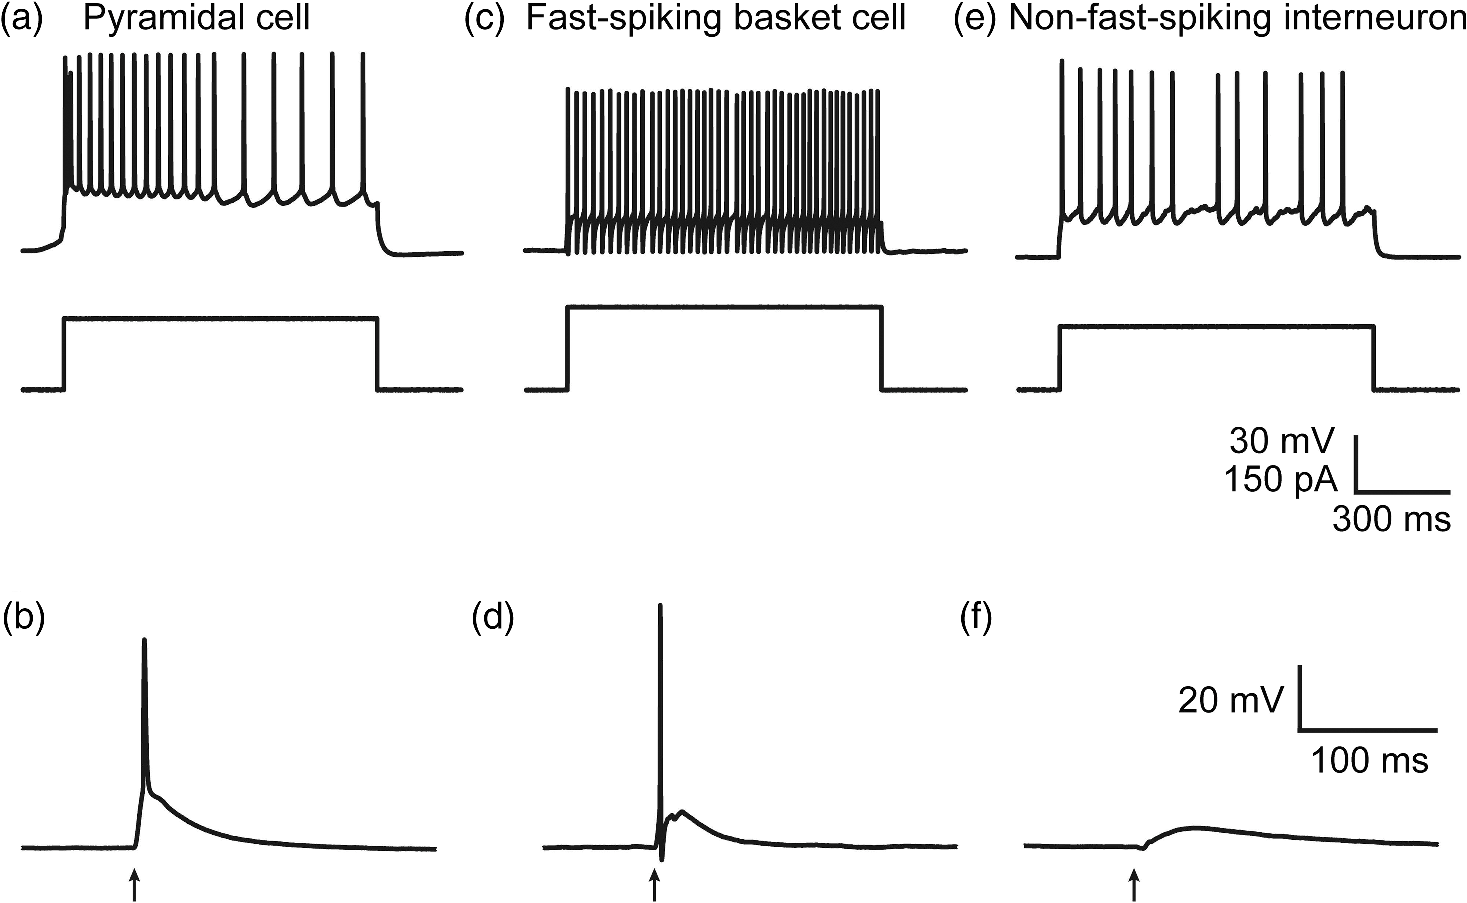 In addition, we recorded from two other interneurons that did not evince fast-spiking properties [Fig. 2(e)].33 Neither of these cells had direct (short latency) photoresponses, indicting the absence of ChR2 expression. However, light did evoke depolarizing IPSPs in these cells [Fig. 2(f)], presumably originating from photostimulation of presynaptic basket cells. Finally, we recorded from four pyramidal cells in layer ; all of these produced direct depolarizations in response to light but the depolarization was sufficiently large to evoke an action potential in only one of these four cells. In summary, photostimulation was most effective in evoking action potentials in layer 5 pyramidal cells and less capable of evoking action potentials in pyramidal cells in other layers. With regard to interneurons, roughly half of the basket cells could be photostimulated while other interneurons seemed not to express ChR2. 3.2.Mapping Responses Evoked by Stimulation of Layer 5 NeuronsTo produce spatially structured photostimulation of ChR2-expressing neurons, we used a digital micromirror array system that could produce spatial patterns of illumination of any shape or size within the microscope field of view. By focusing an image of the micromirror array on the slice, we could photostimulate defined areas [Fig. 3(a); see also Ref. 19]. This made it possible to map responses to inputs coming from different regions of the barrel cortex, specifically by sequentially photostimulating individual layers of columns A, B, C, and D in a grid. Such photostimulation was done in a pseudorandom pattern to avoid consecutive photostimulation of adjacent regions. Brief light pulses (3 ms duration, 460 nm) were used to evoke action potential firing [as in Figs. 2(b) and 2(d)]. These brief flashes allowed us to minimize stimulation artifacts that could interfere with VSD imaging.19 The stimulation artifacts during the brief light flash obscured direct responses to light, but allowed imaging of longer latency synaptic responses. Fig. 3Photostimulation of layer 5 neurons elicits postsynaptic responses in layer 2/3. (a) All-optical stimulation of neurons with 460 nm light-emitting diode (LED) light and recording of excitation by voltage-sensitive dye (VSD) fluorescence. The mosaic micromirror array was used to photostimulate specific regions of the slice. (b) Diagram depicting photostimulation of layer 5 pyramidal neurons in columns A to E is shown in the top-left panel. Other panels are VSD images showing the time-dependent spread of circuit activity from layers 5 to in the somatosensory cortex. A 460 nm light flash (5 ms) was used to photostimulate layer 5 pyramidal neurons and images taken at respective durations after starting photostimulation are shown. Barrels are indicated in white to indicate the location of columns A to E. (c) VSD image taken at 17.6 ms after the onset of a 5 ms 460 nm light flash to stimulate layer 5 pyramidal neurons (indicated by the dotted area at location 2). (d) Postsynaptic responses measured in layer were blocked with bath application of 6-cyano-7-nitroquinoxaline-2,3-dione (CNQX) (). In these and all other traces, horizontal bars indicate the timing of photostimulation. Transient fluorescence increases caused by excitation of the VSD during photostimulation have been blanked out. 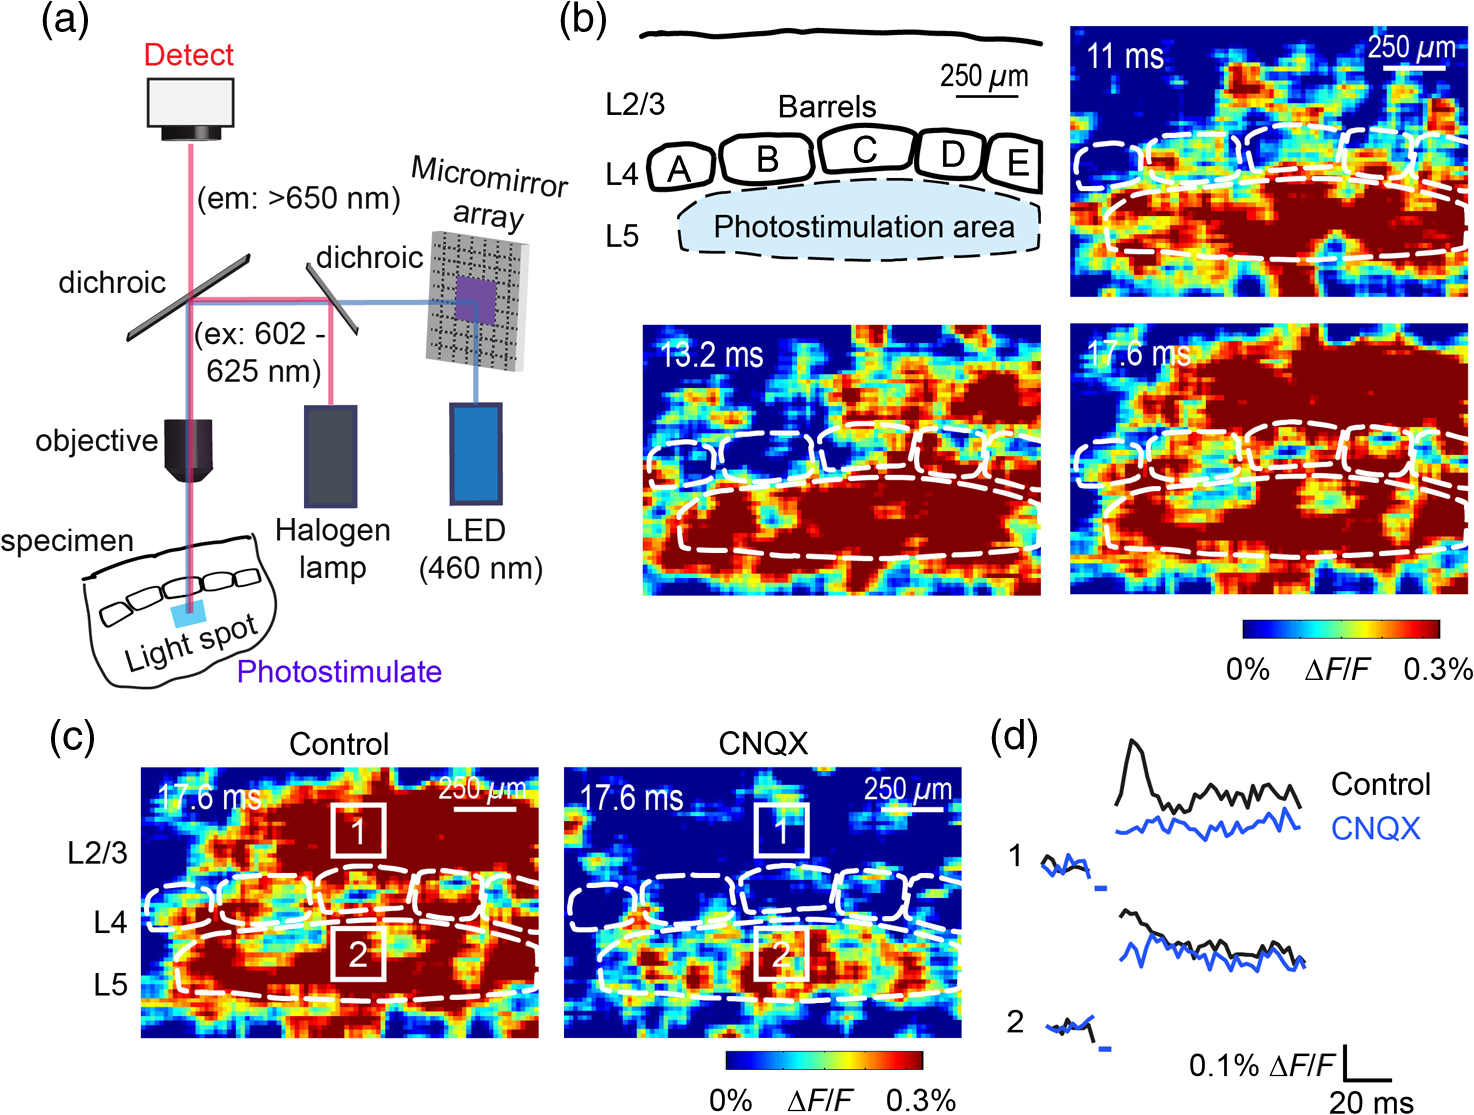 With this experimental arrangement, we could use ChR2 to photostimulate specific regions, while using VSD imaging to detect resulting responses throughout the barrel cortex. Photostimulation of the entire layer 5 [460 nm; Fig. 3(b), top left] initially evoked excitatory responses in layer 5 that peaked within 11 ms from the start of photostimulation [Fig. 3(b), top right]. Excitatory responses subsequently spread up along the column into layer by 13.2 ms [Fig. 3(b), bottom left] and along layer 17.6 ms after starting photostimulation [Fig. 3(b), bottom right]. Although photostimulation was also likely to activate some ChR2-expressing basket cells [Fig. 2(d)], net light-evoked responses were excitatory. This indicates smaller contributions of synaptic inhibition relative to the strong excitation of layer 5 pyramidal neurons. This also indicates that any inhibition caused by photostimulation of ChR2-expressing basket cells was insufficient to prevent activation of excitatory circuits involving layer 5 pyramidal cells. The excitatory responses occurring in layer over the first 20 ms were postsynaptic in nature because they were largely blocked by bath application of the AMPA-type glutamate receptor antagonist, CNQX [Figs. 3(c) and 3(d)1]. Likewise, CNQX blocked part of the response detected in layer 5, indicating local synaptic excitation in response to photostimulation of layer 5 pyramidal cells [Figs. 3(c) and 3(d)2]. The blockade of layer responses by CNQX indicates that we could block excitatory synaptic transmission elicited by layer 5 photostimulation. Further, we could simultaneously activate layer 5 pyramidal cells in many columns. The depolarizing response remaining in the presence of CNQX was long lasting (up to several s) and is of unknown origin; this might represent glial responses [Fig. 3(d)].34,35 Restricting photostimulation to only layer 5 neurons of column C [Fig. 4(a)] resulted in a similar pattern: excitatory responses were first evoked in layer 5, which in turn caused a delayed (presumably synaptic) excitation of cells in layer [Figs. 4(b) and 4(c)]. Layer activation in response to photostimulation of layer 5 of a single column [Fig. 4(b)] was reduced in comparison to photostimulation of the entire layer 5 [Fig. 3(b)]. Photostimulation of the entire layer 5 recruits more layer 5 pyramidal neurons, presumably yielding stronger synaptic excitation of layer neurons.36 Following photostimulation of layer 5 neurons in column C, excitatory responses spread outward into columns B and D within layer 5 as well [Figs. 4(b) and 4(c)]. This pattern of activity showed that layer 5 pyramidal neurons innervate and excite both layer pyramidal neurons as well as other layer 5 pyramidal neurons in neighboring columns, and is consistent with the known connectivity pathways of layer 5 pyramidal neurons.37,38 Fig. 4Photostimulation of layer 5 pyramidal neurons lead to intercolumnal spread of postsynaptic activity. (a) Diagram depicting arrangement for photostimulation of layer 5 pyramidal neurons in column C. (b) VSD image taken at 13.2 ms after the onset of a 3 ms 460 nm light flash to stimulate layer 5 pyramidal neurons (indicated by the dotted box at location 2), showing the spread of excitatory responses up to layer and along layer 5. Barrels are indicated in white and lettered accordingly, showing the location of A to E columns. (c) Different peak latencies in layers and 5 responses show that responses initiated in layer 5 spread toward layer . (d) VSD image taken at 13.2 ms after a electrical pulse was delivered to layer 5. Strong responses tended to spread upwards along the column. (e) Electrically stimulated slices show a similar pattern of peak latencies in layers and 5, indicating that responses initiated in layer 5 spread toward layer . 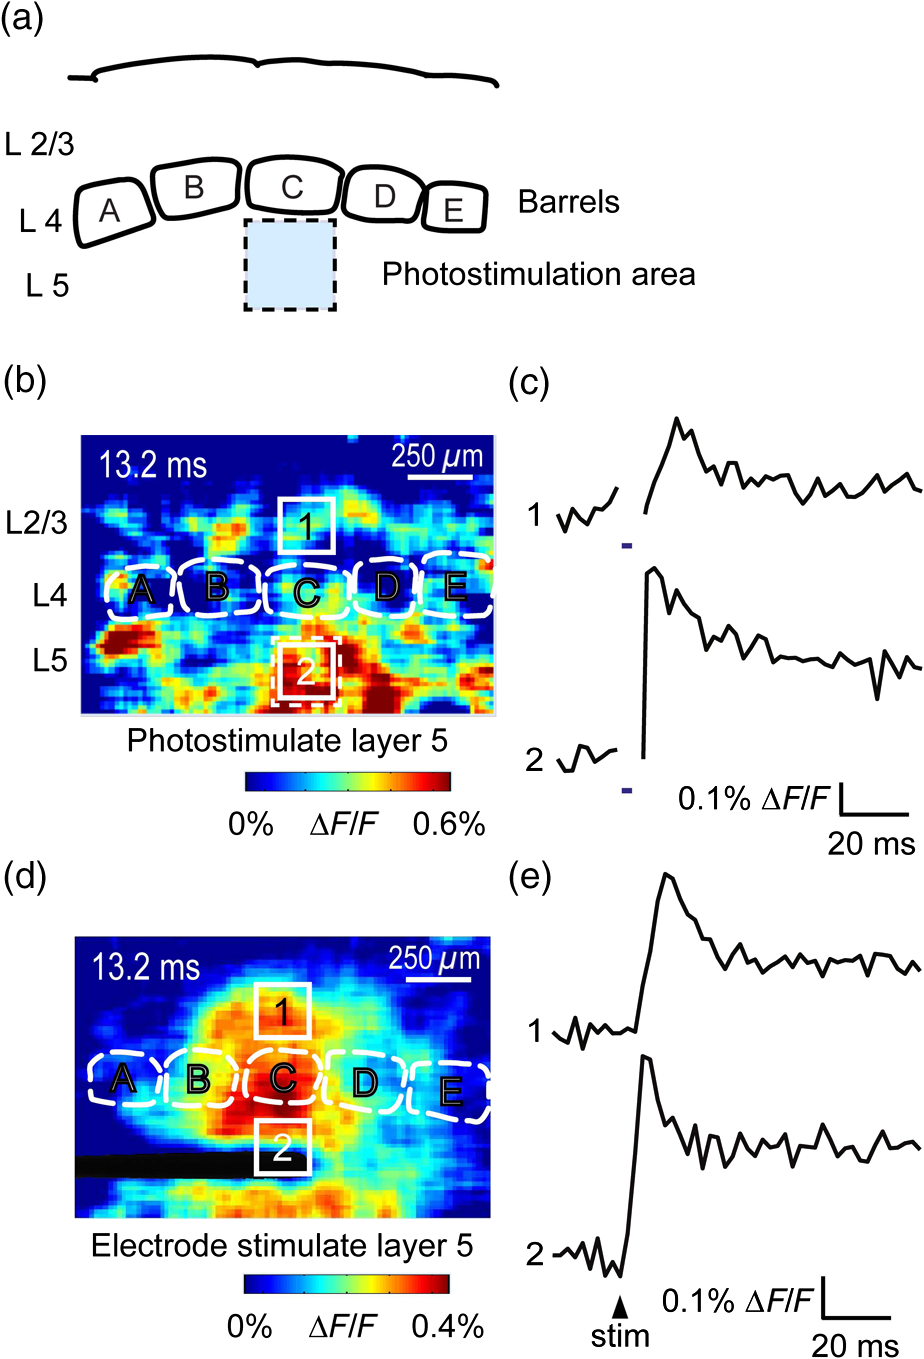 In contrast, electrical stimulation of layer 5 neurons evoked strong responses which spread primarily up the column, with relatively little spread into layers 4 and 5 of neighboring columns [Figs. 4(d) and 4(e)]. The lack of spread presumably is due to the electrode more effectively stimulating multiple types of interneurons, in comparison to photostimulation of only a fraction of basket cells, thereby limiting the spread of excitation between columns.2,39,40 In particular, disynaptic inhibition between layer 5 pyramidal cells is known to be mediated by Martinotti cells40 and this could limit lateral spread. Responses recorded within layer 5 of column C were relatively similar to responses to photostimulation of this layer [lower traces in Figs. 4(c) and 4(e)]. Furthermore, while upward spread of responses within column C was similar for responses to both photostimulation and electrical stimulation, stronger postsynaptic activity was detected in layer following electrical stimulation. This is likely to be caused by antidromic activation of layer 4 neurons by electrical stimulation; these excite layer 5 pyramidal cells, which in turn would excite layer cells. Responses in columns A and E in layer are lower in comparison to responses in column C [Fig. 4(d)]. There is evidence of surround inhibition mediated by somatostatin interneurons in layer ,41 which is consistent with pyramidal cells activating somatostatin interneurons, which, in turn, inhibit neighboring layer pyramidal neurons. These results demonstrate our ability to use focal photostimulation to selectively stimulate a genetically defined population of neurons in layer 5 and not those in layers or 4. 3.3.All-Optical Circuit Mapping in the Somatosensory CortexHaving demonstrated that our approach can visualize responses within the entire somatosensory cortex resulting from photostimulation of layer 5 neurons within column C [Fig. 4(b)], we could next do the converse experiment by measuring responses in layer 5 of column C while photostimulating many other parts of the slice. By dividing the somatosensory cortex into 12 subregions, each consisting of one layer in one column, we could map the strength and spatial range of input signals that were evoked in layer 5 in responses to photostimulation of each subregion [Fig. 5(a), top]. To obtain such input maps, excitatory responses evoked in layer 5 cells of column C were measured between 4.4 and 22 ms after a light flash. These signals were integrated to provide a measure of total excitatory drive and improve the signal/noise ratio for the responses, and the amplitude of these integrated signals was mapped (pseudocolor scale) according to the location of the photostimulus that elicited them [Fig. 5(a), top]. Fig. 5All-optical mapping can be done at a higher resolution. (a) Input response map for layer 5 of column C of slices from a P113 mouse done at lower (12 photoactivation areas, top) and higher (54 photoactivation areas, bottom) resolution. Integrated responses elicited at the region denoted by an asterisk following photostimulation of various areas on the slice were color-coded accordingly. Input map responses were integrated from 7.4 to 25 ms after the onset of the light flash. (b) and (c) Averaged optical traces show responses measured in layer 5 (indicated by asterisk) when photostimulating in layer 5. A more refined response map can be obtained at higher resolution of photostimulation, showing differential amounts of light-evoked responses within a region that would otherwise be masked at a lower resolution. Traces are numbered as indicated on the map. 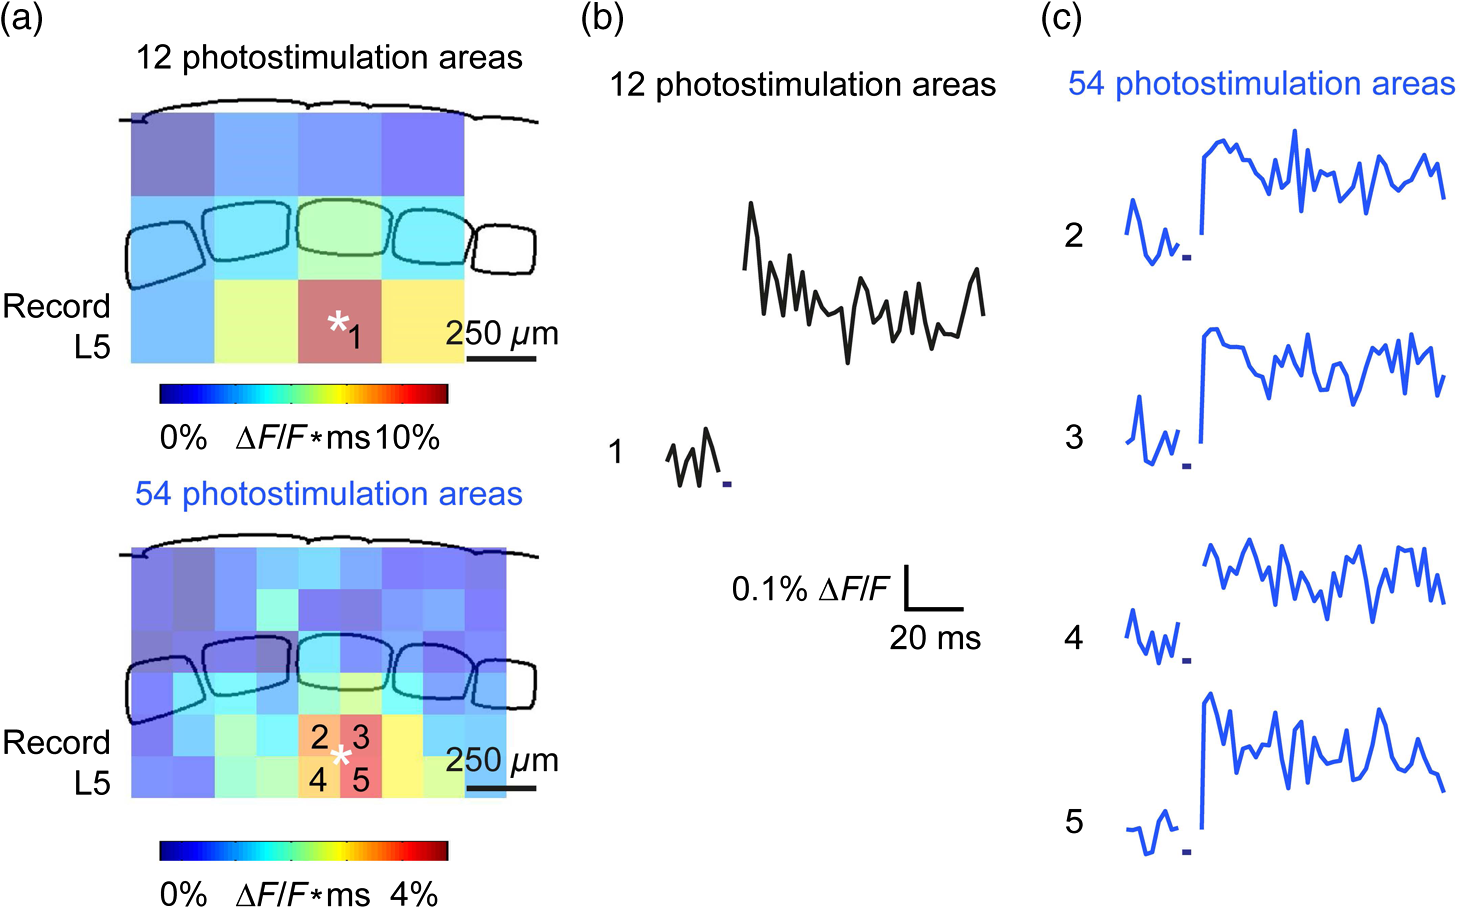 These input maps revealed that the largest responses were evoked within layer 5 of column C, with less input coming from neighboring columns in layer 5 or other layers along column C [Fig. 5(a), top]. Responses elicited when photostimulating column C reached their peak amplitude at 9.6 ms after initiation of the light flash [Fig. 5(b)], while photostimulation of layer 5 in the neighboring columns (B and D) resulted in responses with a somewhat longer time to peak (9.6 to 14 ms). These responses are consistent with the anatomy of layer 5 pyramidal cells,42,43 which have processes extending up within the column and along layer 5 to innervate neighboring columns. Given that a few layer pyramidal neurons expressed ChR2 [Fig. 1(b)], it is also possible that excitatory responses originated from photostimulated layer pyramidal neurons. We thus conclude that the responses arose at least partly from monosynaptic connections between presynaptic layer 5 pyramidal neurons and their postsynaptic targets. The amount of light power provided by our LED light source, as well as inefficient coupling between the LED and the micromirror array, limited the amount of light per micromirror element. As a result, we had to bin light output from a number of micromirrors to generate sufficient depolarization to photostimulate individual neurons. Although this limited the spatial resolution of photostimulation, we were able to further refine the input maps by subdividing the barrel cortex into 54 photostimulation regions [Fig. 5(a), bottom]. In this case, more spatial structure was evident: the range of inputs to layer 5 neurons could more clearly be seen to span all layers and columns. Further, the responses elicited by photostimulating each subregion of a larger element were not similar [Fig. 5(a), bottom]. For example, activating the four subregions within layer 5 of column C yielded a range of responses that could not be detected in the lower resolution map where all of these regions were photostimulated together [Figs. 5(b) and 5(c)]. Photostimulating the larger area resulted in responses that were larger than the average of the responses to photostimulating the individual subregions (Fig. 5). This probably indicates that synergistic effects occur when more neurons are simultaneously active, for example due to reciprocal excitatory synaptic interactions. In addition, the higher resolution input map indicated much lower connectivity from layer 4 of neighboring columns to layer 5 [Fig. 5(a)], which is in line with the known synaptic connections between neurons in these regions. 3.4.Effects of Sensory Deprivation on Cortical CircuitsTo demonstrate the utility of our all-optical mapping approach for the study of barrel cortex circuits, we next used this approach to define the role of activity in the development of these circuits. For this purpose, we removed whiskers from mice and then waited 30 days to prepare somatosensory cortex slices. To investigate the effect of sensory deprivation in isolation from potential effects of competition between neighboring deprived and spared barrels on local cortical circuits, we removed all whiskers from the right cheek and left the other side intact as controls. Light cauterization resulted in whisker loss for approximately 1 month, ensuring that no whisker-related activity occurred during the first 2 weeks of postnatal development. At P36 to 44, slight regrowth of a few short and misshapen whiskers was sometimes observed. To determine whether such whisker deprivation affected our ability to photostimulate pyramidal cells, we measured layer responses evoked by photostimulation of layer 5 with light stimuli of varying intensity [Fig. 6(a)]. The relationship between light intensity and layer responses measured in control slices was saturable, with maximal responses evoked in control slices by LED light of 4 to . This relationship was very similar in slices from deprived mice [Fig. 6(b)]. Thus, chronic whisker deprivation caused no apparent change in the ability to photostimulate layer 5 neurons in these ChR2 transgenic mice. Fig. 6Chronic whisker deprivation did not significantly affect layer 5 pyramidal neuron-driven excitatory responses and feedback inhibition. (a) Diagram showing the photostimulation of layer 5 neurons in column C. The blue dotted box indicates the photostimulation area while the solid box indicates the area of interest where responses from (c) and (e) are taken from. (b) Similar input–output curves of layer responses following photostimulation of layer 5 pyramidal neurons for control (black) and deprived (red) slices. Maximum LED power was used for photostimulation experiments in the rest of the study. Integrated layer responses were integrated from 7.4 to 25 ms after the onset of the light flash. (c) Averaged optical traces of layer 5 responses following photostimulation of layer 5 pyramidal neurons for control (black) and deprived (red) slices. 3 ms photostimulation indicated by the black bar below the trace. Deprived responses were slightly larger than controls but not significantly so. (d) Histogram of excitatory responses at layers , 4, and 5 of column C following photostimulation of layer 5 in (a). Excitatory responses were not significantly different across all layers. Integrated responses at various layers were integrated from 7.4 to 25 ms after the onset of the light flash. (e) Averaged optical responses elicited at layer 5 following photostimulation of L5 pyramidal neurons in column C for control (black) and deprived (red) slices. 3 ms photostimulation indicated by the black bar below the trace. Subtracted compound IPSPs were similar between control and deprived slices. (f) Histogram of compound IPSP responses at layers , 4, and 5 following photostimulation of L5 pyramidal neurons in column C as in (a). Compound IPSP responses were not significantly different across all layers, suggesting that experience-dependent plasticity involves interneurons not driven by layer 5 pyramidal cells. Integrated compound IPSP responses at various layers were integrated from 11.8 to 51.4 ms after the onset of the light flash. 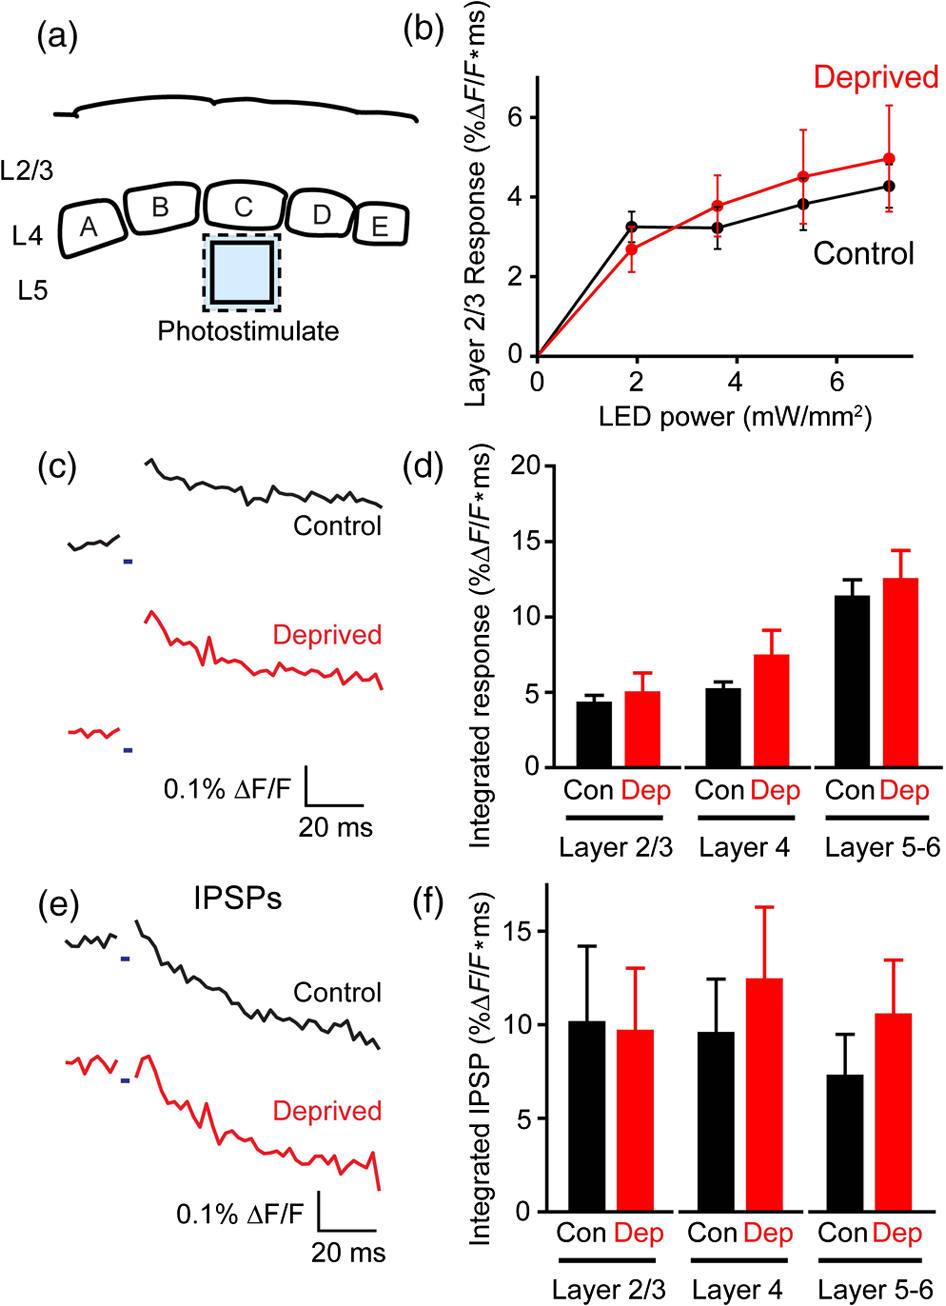 To examine the effects of whisker deprivation on cortical circuitry, we prepared slices from whisker-deprived mice and photostimulated layer 5 of column C [Fig. 6(a)]. When comparing deprived and control slices, although deprived slices exhibited a trend of slightly increased excitatory responses compared to controls [Fig. 6(c)] there were no significant differences in excitatory responses in layer 5 [, unpaired test, for each side; Fig. 6(d)]. Excitatory responses in other layers in response to layer 5 photostimulation also were not significantly different [layer : ; layer 4: , unpaired test, for each side; Fig. 6(d)]. To consider disynaptic inhibition driven by layer 5 pyramidal neurons, as well as monosynaptic responses evoked by direct photostimulation of basket cells, we used a pharmacological isolation approach to examine IPSPs.27 We treated slices with PTX, which blocked inhibitory input to GABAA receptors and eliminated IPSPs. By subtracting responses measured in the presence of PTX from those measured prior to drug treatment, we could calculate PTX-sensitive IPSPs as a measure of inhibitory network responses. We called these responses compound IPSPs to indicate that they may reflect both monosynaptic and polysynaptic components. They had a slower latency to peak than excitatory responses [Figs. 6(c) and 6(e)], presumably due to both the slower kinetics of inhibitory postsynaptic responses relative to excitatory responses as well as possible polysynaptic components, which would have a longer latency due to the summation of multiple synaptic delays. Compound IPSP responses were similar between deprived and control slices for all layers [layer : ; layer 4: ; layer 5–6: ; for each side; Figs. 6(e) and 6(f)]. Given that whisker deprivation late in adulthood is known to transiently decrease ascending inhibition from layers 5 to ,44 this result suggests that early experience-dependent plasticity involves interneuron circuits not driven by layer 5 pyramidal cells. Our all-optical approach allowed us to map the organization of inhibitory circuits by measuring compound IPSPs evoked in different layers of column C (asterisks) in response to photostimulation of surrounding layers and columns (Fig. 7). In control slices, local photostimulation of layer 5 provided the strongest inhibitory inputs to layer 5, both within the column and in neighboring columns [Fig. 7(a)]. This is consistent with the disynaptic inhibition occurring between layer 5 pyramidal cells mediated by Martinotti interneurons,40 and is likely to be mediated by that circuit. Most of the compound IPSPs input to layers [Fig. 7(b)] and 4 [Fig. 7(c)] came in response to photostimulation of layers 4 and 5 [Figs. 7(b) and 7(c); average maps of ]. The large compound IPSPs evoked by photostimulation of layer 4 are likely to be caused by photostimulation of both ChR2-expressing layer 4 interneurons and ChR2-expressing processes of layer 5 neurons residing in more than one column. It is also possible that photostimulation of the processes of the sparse ChR2-expressing neurons in layer might have occurred when photostimulating in layer 4. Small compound IPSPs were recorded in layer when stimulating locally in this layer [Fig. 7(b)]. In contrast, there was little inhibition recorded from layers 4 [Fig. 7(c)] and 5 [Fig. 7(d)] when photostimulating layer . Whisker removal had little effect on these inhibitory circuits: compound IPSP maps for column C for many different regions were relatively similar between control and deprived slices [Figs. 7(b)–7(d)], with similar patterns of input from the layers of neighboring columns. Fig. 7All-optical mapping of column C responses with ChR2 photostimulation and VSD imaging. (a) Averaged control input response map (left; ) for layer 5 of column C. Input map responses were integrated from 7.4 to 25 ms after the onset of the light flash. Averaged optical traces (right) showing responses measured in layer 5 (indicated by asterisk) when photostimulating layers and 4 of column C and layer 5 of column B. Traces are numbered as indicated on the map. (b) to (d) Averaged input response maps () for column C, showing the strength of compound IPSP input from surrounding layers and columns of the slice. Position of asterisk indicates layer and column of area from which responses were calculated. Response maps show similar input patterns between controls and deprived slices. 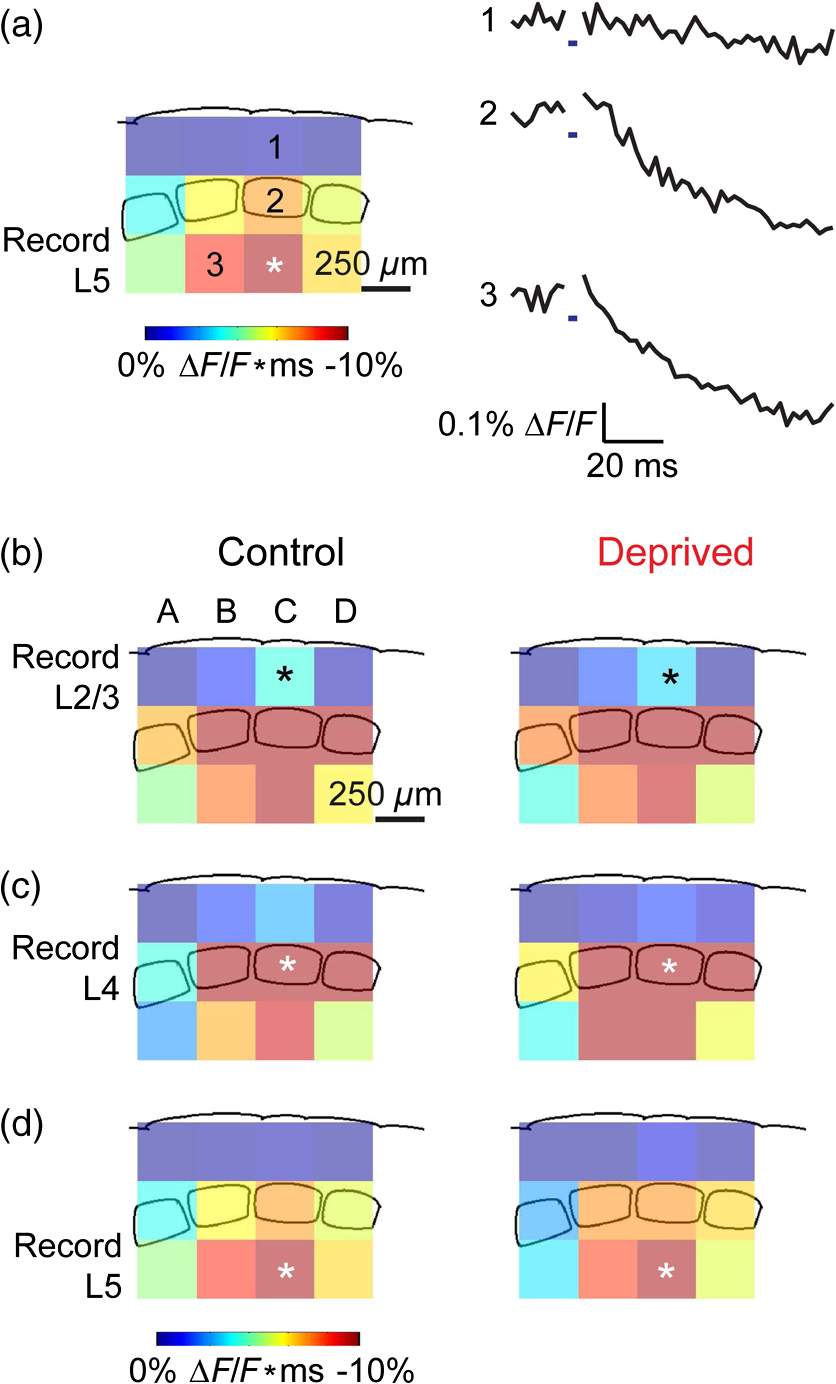 3.5.Functional Connectomes of Barrel CortexBecause VSD imaging allowed us to simultaneously obtain responses from the whole barrel cortex much quicker and more conveniently than is possible with patch clamp recordings or multielectrode recordings of a similar area, our all-optical approach enables rapid and high-content circuit mapping throughout the barrel cortex. In addition, the flexibility of combining a micromirror array system with VSD imaging allows us to photostimulate and record responses from multiple arbitrary areas depending on the organization of the structure of interest, delivering high information content in a single experiment. For example, a response matrix that displayed compound IPSPs elicited in various layers (, 4, or 5) of different columns (A to D) in response to photostimulation of each of these regions is shown in Fig. 8. In this matrix, the gray scale represents the strength of compound IPSP inputs measured in each column and layer in response to photostimulation of each column and layer. Such a two-dimensional comparison of connectivity between all elements in the barrel field is not possible with conventional techniques. The response matrix for control slices (Fig. 8, top) indicates that compound IPSPs are strongest in layers 4 and 5, with relatively small responses evoked in layer irrespective of the region that was photostimulated. This is consistent with the distribution of interneurons in the barrel cortex, where PV and somatostatin interneurons are present at highest density in layers 4 and 5.45 In addition, compound IPSP responses also tended to span approximately two columns on either side of a given column (Fig. 8). Notably, the averaged compound IPSP response matrix for deprived slices was similar to that for controls (Fig. 8, bottom; for all matrix elements, 2 sample test, ). This indicated that whisker deprivation has remarkably little effect on inhibitory circuits activated by our photostimuli. Fig. 8Response matrices from high-throughput all-optical circuit mapping of the barrel cortex. (a) Averaged compound IPSP input responses of control slices (), showing the strength of compound IPSP inputs from all columns and layers for all columns and layers. Responses elicited in various layers (, 4, or 5) of different columns (A to D) were arranged along the -axis and the region of photostimulation arranged along the -axis as a response matrix. The strength of compound IPSP responses are color-coded in grayscale as indicated in the scale bar. (b) Averaged compound IPSP input responses of deprived slices (), showing the strength of compound IPSP inputs from all columns and layers to all columns and layers. The pattern of responses is similar to the controls and responses were not significantly different in each region (two sample t tests, ). 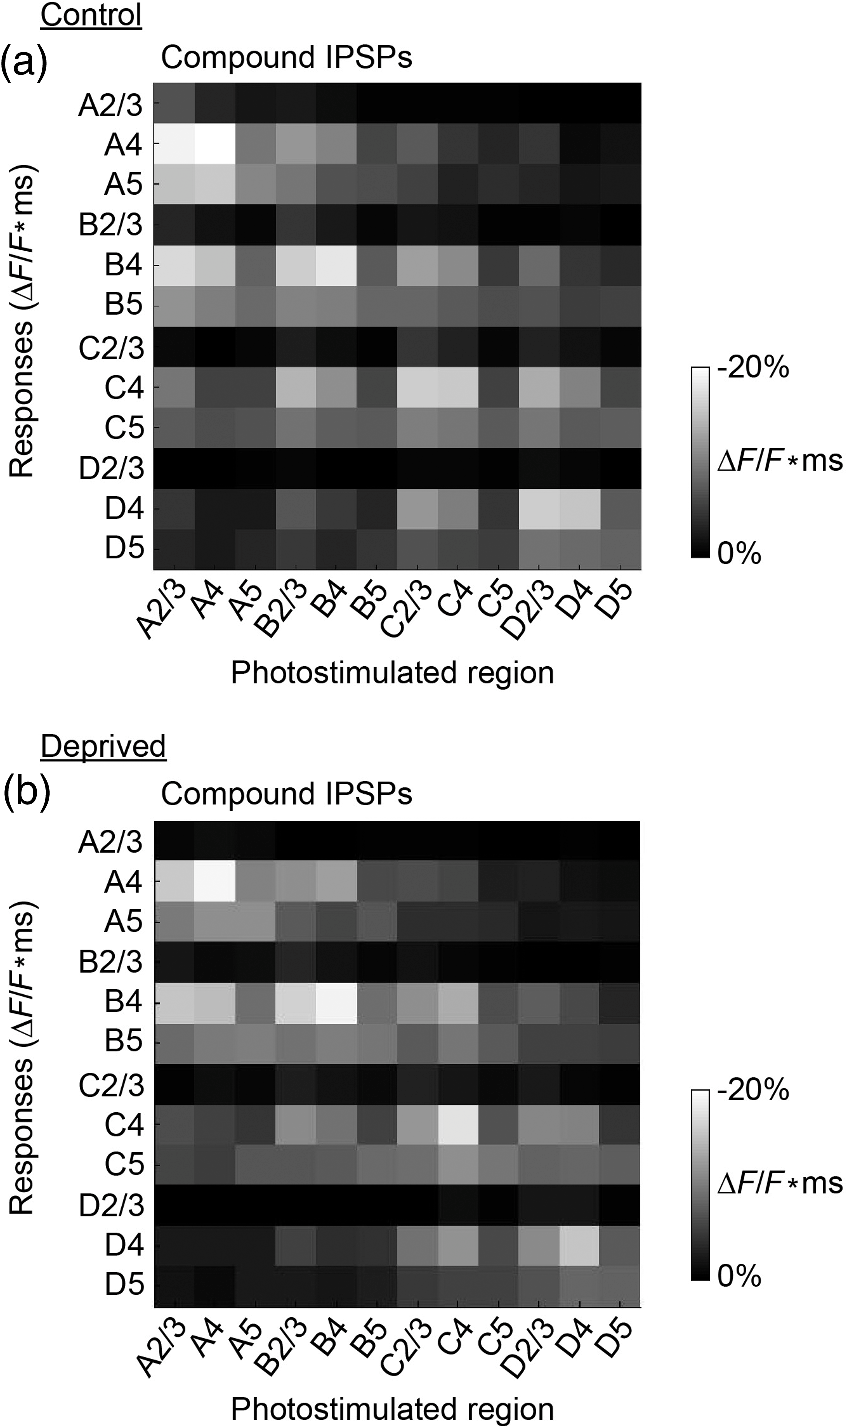 4.DiscussionWe have combined ChR2-mediated photostimulation of pyramidal cells with VSD imaging of resultant responses in somatosensory cortex. Our results provide insights into both optical circuit mapping technology as well as the effects of experience-dependent plasticity on cortical circuits. We will discuss each of these points in turn. 4.1.All-Optical Circuit MappingOur laboratory usually relies on optogenetic circuit mapping based on combining ChR2-mediated photostimulation with whole-cell patch clamp recording.24 This approach provides highly specific targeting of both stimulation and detection, and additionally provides high temporal and spatial resolution. However, the use of an electrophysiological readout limits data throughput. The all-optical circuit mapping described here circumvents this limitation by relying on VSD imaging of neuronal activity, which is technically simpler and can be applied to many neurons and regions in the same experiment. It also facilitates analysis of circuit divergence, which requires monitoring activity in multiple postsynaptic neurons.19 There have been other all-optical mapping efforts based on combining ChR2-mediated photostimulation with VSD imaging, but these have largely focused on photostimulating a single region.19,46,47 We show here that all-optical mapping of both circuit inputs and outputs can be done over many neurons and many regions in a high-throughput manner in the mouse barrel cortex (Fig. 8). The consistent columnar and laminar organization of the mouse barrel cortex48 makes it an ideal target for such a connectomics analysis. The combination of optogenetic mapping and the ability to image neuronal responses throughout the barrel cortex with high temporal and spatial resolution yields a wealth of information about circuit organization and function. The ability to both stimulate defined areas containing potential presynaptic neurons while simultaneously detecting neuronal activity in multiple regions containing potential postsynaptic neurons allows investigation of circuit interactions between neighboring cortical columns. Electrical stimulation is limited because of the difficulty in interpreting responses due to the lack of specificity in stimulating neurons. Here, we specifically photostimulated groups of layer 5 neurons—primarily pyramidal cells and, to a lesser extent, basket cells—across different cortical columns by using ChR2, in conjunction with a digital micromirror array system. We also showed that all-optical mapping can be done at a higher resolution, limited only by the ability to reliably photostimulate neurons (Fig. 5). Light delivery to specific regions via our micromirror array is relatively poor, but this can be improved through the use of brighter light sources, more efficient couplers, and more efficient optogenetic actuators. In our application, all cells were extracellularly stained with VSD, making it difficult to identify the cellular sources of signals. Sensory deprivation is known to increase the excitability of layer 5 pyramidal neuron dendrites and to increase the proportion of burst-firing cells.49 We observed a trend toward slightly increased excitatory responses in deprived slices compared to controls [Fig. 6(c)], but there was not a statistically significant difference. This may be due to VSD imaging integrating responses over many cell types. The all-optical mapping approach described here can be further improved via the use of genetically encoded voltage sensors,50–54 which will allow reporting of electrical activity of defined neuron types. In particular, probes capable of detecting hyperpolarizations associated with inhibitory synaptic activity will be critical for mapping inhibitory circuits. This will be particularly valuable for examining synaptic inhibition, because the pharmacologically subtracted compound IPSPs used in our study are likely an overestimate of synaptic inhibition due to increased network activity following PTX treatment. 4.2.Effects of Activity on Somatosensory Cortex CircuitryBy mapping out the contributions of both excitatory and inhibitory circuits after chronic whisker deprivation, we found that whisker deprivation for 4 to 6 weeks after birth did not significantly alter excitatory responses or feedforward inhibition mediated by layer 5 pyramidal cells. Whisker trimming with spared D2 and D3 whiskers is known to cause fast (within 24 h) depression of layer 5 responses to trimmed D1 whisker stimulation,55 but this depression might not reflect changes in layer 5 pyramidal neuron synapses since the origin of these changes is not clear. Further, it may be caused by competitive effects between spared and deprived columns. Another study using a competitive sensory deprivation paradigm revealed reduced synaptic inputs from layer of the trimmed column to regular spiking layer 5 pyramidal cells.56 Our observation of no significant change in excitatory responses in all layers when photostimulating layer 5 pyramidal cells is consistent with the fact that sensory deprivation of all whiskers does not change the excitability of pyramidal cell somata.49 We also saw no significant changes in PTX-sensitive compound inhibition driven by photostimulation of layer 5 cells after whisker deprivation from P0 to P44 (Fig. 6). This contrasts with the effects of whisker deprivation in older mice (age around 8 to 11 weeks), which is known to transiently decrease ascending inhibition, likely mediated by Martinotti interneurons, from layers 5 to .44 Taken together, it appears that inhibitory circuits driven by layer 5 pyramidal neurons may be stable in early development and express experience-dependent plasticity in late adulthood. The amount of inhibition that layer pyramidal neurons receive from layer Gad2-expressing interneurons remains stable when whisker input is deprived at 8 to 11 weeks.44 As layer 5 pyramidal neurons provide primary excitatory drive for somatostatin-expressing (SOM) Martinotti interneurons,40,57 this suggests that these SOM interneurons serve as targets of transient activity-dependent plasticity in adulthood while experience-dependent plasticity in inhibitory circuits in early development could involve other circuits such as parvalbumin interneuron circuits.58,59 The use of mice expressing ChR2 selectively in either the somatostatin or parvalbumin interneurons could be important to differentiate the effects of experience-dependent plasticity mediated by these neurons. Although no evidence of experience-dependent changes was found in ascending inhibition from layer 5 pyramidal neuron-driven SOM Martinotti interneurons (Fig. 6), other SOM circuits are present throughout all layers of the barrel cortex;45 within layer , these neurons are readily recruited by activity in layer pyramidal neurons.57 In general, the signal-to-noise ratio of VSD imaging makes it difficult to reliably detect small IPSPs in the somatosensory cortex. This is because the distribution of inhibitory neurons in the somatosensory cortex is diffuse, which could result in small IPSPs being masked by strong excitatory responses following stimulation. 4.3.ConclusionsOur high throughput, all-optical mapping approach can be a valuable tool to evaluate the functional interactions between circuit elements in the somatosensory cortex and elsewhere in the brain. Development of improved optogenetic voltage sensors will increase the utility of this approach and will yield even more valuable information about somatosensory circuit function and how this changes during development. AcknowledgmentsKeeping with the theme of this special issue, we acknowledge the important contributions of Larry Cohen to the field of neurophotonics, particularly his prescient insights into the power of optical imaging for monitoring neuronal activity and circuit dynamics. This work was supported by the World Class Institute (WCI) program of the National Research Foundation of Korea (NRF) funded by Ministry of Education, Science and Technology of Korea (MEST) (NRF) Grant No. WCI 2009-003 and by the Competitive Research Programme (CRP) of NRF (Singapore) Grant No. NRF 2008 NRF-CRP 002-082. ReferencesB. R. Lustig et al.,
“Voltage-sensitive dye imaging reveals shifting spatiotemporal spread of whisker-induced activity in rat barrel cortex,”
J. Neurophysiol., 109 2382
–2392
(2013). http://dx.doi.org/10.1152/jn.00430.2012 JONEA4 0022-3077 Google Scholar
C. C. Petersen and B. Sakmann,
“Functionally independent columns of rat somatosensory barrel cortex revealed with voltage-sensitive dye imaging,”
J. Neurosci., 21 8435
–8446
(2001). JNRSDS 0270-6474 Google Scholar
N. Laaris and A. Keller,
“Functional independence of layer IV barrels,”
J. Neurophysiol., 87 1028
–1034
(2002). JONEA4 0022-3077 Google Scholar
N. Laaris, G. C. Carlson and A. Keller,
“Thalamic-evoked synaptic interactions in barrel cortex revealed by optical imaging,”
J. Neurosci., 20 1529
–1537
(2000). JNRSDS 0270-6474 Google Scholar
C. C. Petersen, A. Grinvald and B. Sakmann,
“Spatiotemporal dynamics of sensory responses in layer of rat barrel cortex measured in vivo by voltage-sensitive dye imaging combined with whole-cell voltage recordings and neuron reconstructions,”
J. Neurosci., 23 1298
–1309
(2003). JNRSDS 0270-6474 Google Scholar
C. C. Petersen et al.,
“Interaction of sensory responses with spontaneous depolarization in layer 2/3 barrel cortex,”
Proc. Natl. Acad. Sci. U. S. A., 100 13638
–13643
(2003). http://dx.doi.org/10.1073/pnas.2235811100 PNASA6 0027-8424 Google Scholar
D. H. Lim et al.,
“In vivo large-scale cortical mapping using channelrhodopsin-2 stimulation in transgenic mice reveals asymmetric and reciprocal relationships between cortical areas,”
Front. Neural Circuits, 6 11
(2012). http://dx.doi.org/10.3389/fncir.2012.00011 FNCRA5 1662-5110 Google Scholar
B. J. Baker et al.,
“Imaging brain activity with voltage- and calcium-sensitive dyes,”
Cell. Mol. Neurobiol., 25 245
–282
(2005). http://dx.doi.org/10.1007/s10571-005-3059-6 CMNEDI 0272-4340 Google Scholar
M. Zochowski et al.,
“Imaging membrane potential with voltage-sensitive dyes,”
Biol. Bull., 198 1
–21
(2000). http://dx.doi.org/10.2307/1542798 BIBUBX 0006-3185 Google Scholar
S. Antic, G. Major and D. Zecevic,
“Fast optical recordings of membrane potential changes from dendrites of pyramidal neurons,”
J. Neurophysiol., 82 1615
–1621
(1999). JONEA4 0022-3077 Google Scholar
M. Z. Kee et al.,
“Imaging activity of neuronal populations with new long-wavelength voltage-sensitive dyes,”
Brain Cell Biol., 36 157
–172
(2008). http://dx.doi.org/10.1007/s11068-009-9039-x BCBRCH 1559-7105 Google Scholar
M. Neunlist, S. Peters and M. Schemann,
“Multisite optical recording of excitability in the enteric nervous system,”
Neurogastroenterol. Motil., 11 393
–402
(1999). http://dx.doi.org/10.1046/j.1365-2982.1999.00163.x NMOTEK 1365-2982 Google Scholar
W. L. Zhou et al.,
“Dynamics of action potential backpropagation in basal dendrites of prefrontal cortical pyramidal neurons,”
Eur. J. Neurosci., 27 923
–936
(2008). http://dx.doi.org/10.1111/j.1460-9568.2008.06075.x EJONEI 0953-816X Google Scholar
V. Montana, D. L. Farkas and L. M. Loew,
“Dual-wavelength ratiometric fluorescence measurements of membrane potential,”
Biochemistry, 28 4536
–4539
(1989). http://dx.doi.org/10.1021/bi00437a003 BIORAK 0006-2979 Google Scholar
J. P. Wuskell et al.,
“Synthesis, spectra, delivery and potentiometric responses of new styryl dyes with extended spectral ranges,”
J. Neurosci. Methods, 151 200
–215
(2006). http://dx.doi.org/10.1016/j.jneumeth.2005.07.013 JNMEDT 0165-0270 Google Scholar
W. L. Zhou et al.,
“Intracellular long-wavelength voltage-sensitive dyes for studying the dynamics of action potentials in axons and thin dendrites,”
J. Neurosci. Methods, 164 225
–239
(2007). http://dx.doi.org/10.1016/j.jneumeth.2007.05.002 JNMEDT 0165-0270 Google Scholar
T. H. Grandy, S. A. Greenfield and I. M. Devonshire,
“An evaluation of in vivo voltage-sensitive dyes: pharmacological side effects and signal-to-noise ratios after effective removal of brain-pulsation artifacts,”
J. Neurophysiol., 108 2931
–2945
(2012). http://dx.doi.org/10.1152/jn.00512.2011 JONEA4 0022-3077 Google Scholar
I. M. Devonshire et al.,
“Effects of urethane anaesthesia on sensory processing in the rat barrel cortex revealed by combined optical imaging and electrophysiology,”
Eur. J. Neurosci., 32 786
–797
(2010). http://dx.doi.org/10.1111/j.1460-9568.2010.07322.x EJONEI 0953-816X Google Scholar
S. Tsuda et al.,
“Probing the function of neuronal populations: combining micromirror-based optogenetic photostimulation with voltage-sensitive dye imaging,”
Neurosci. Res., 75 76
–81
(2013). http://dx.doi.org/10.1016/j.neures.2012.11.006 JNREDK 0360-4012 Google Scholar
G. Nagel et al.,
“Channelrhodopsin-2, a directly light-gated cation-selective membrane channel,”
Proc. Natl. Acad. Sci. U. S. A., 100 13940
–13945
(2003). http://dx.doi.org/10.1073/pnas.1936192100 PNASA6 0027-8424 Google Scholar
G. Nagel et al.,
“Light activation of channelrhodopsin-2 in excitable cells of Caenorhabditis elegans triggers rapid behavioral responses,”
Curr. Biol., 15 2279
–2284
(2005). http://dx.doi.org/10.1016/j.cub.2005.11.032 CUBLE2 0960-9822 Google Scholar
E. S. Boyden et al.,
“Millisecond-timescale, genetically targeted optical control of neural activity,”
Nat. Neurosci., 8 1263
–1268
(2005). http://dx.doi.org/10.1038/nn1525 NANEFN 1097-6256 Google Scholar
F. Zhang et al.,
“Channelrhodopsin-2 and optical control of excitable cells,”
Nat. Methods, 3 785
–792
(2006). http://dx.doi.org/10.1038/nmeth936 1548-7091 Google Scholar
H. Wang et al.,
“High-speed mapping of synaptic connectivity using photostimulation in channelrhodopsin-2 transgenic mice,”
Proc. Natl. Acad. Sci. U. S. A., 104 8143
–8148
(2007). http://dx.doi.org/10.1073/pnas.0700384104 PNASA6 0027-8424 Google Scholar
H. Van der Loos and T. A. Woolsey,
“Somatosensory cortex: structural alterations following early injury to sense organs,”
Science, 179 395
–398
(1973). http://dx.doi.org/10.1126/science.179.4071.395 SCIEAS 0036-8075 Google Scholar
G. T. Finnerty, L. S. Roberts and B. W. Connors,
“Sensory experience modifies the short-term dynamics of neocortical synapses,”
Nature, 400 367
–371
(1999). http://dx.doi.org/10.1038/22553 NATUAS 0028-0836 Google Scholar
S. Willadt, M. Nenniger and K. E. Vogt,
“Hippocampal feedforward inhibition focuses excitatory synaptic signals into distinct dendritic compartments,”
PLoS One, 8 e80984
(2013). http://dx.doi.org/10.1371/journal.pone.0080984 1932-6203 Google Scholar
S. J. Orfanidis, Introduction to Signal Processing, Prentice Hall, Inc., Upper Saddle River, NJ
(1995). Google Scholar
A. Savitzky and M. J. E. Golay,
“Smoothing and differentiation of data by simplified least squares procedures,”
Anal. Chem., 36 1627
–1639
(1964). http://dx.doi.org/10.1021/ac60214a047 ANCHAM 0003-2700 Google Scholar
R. W. Schafer,
“What is a Savitzky-Golay filter? [lecture notes],”
IEEE Signal Process. Mag., 28
(4), 111
–117
(2011). http://dx.doi.org/10.1109/MSP.2011.941097 ISPRE6 1053-5888 Google Scholar
S. Rajagopalan and R. A. Robb,
“Image smoothing with Savtizky-Golai filters,”
Proc. SPIE, 5029 773
–781
(2003). http://dx.doi.org/10.1117/12.479596 PSISDG 0277-786X Google Scholar
A. M. Hattox and S. B. Nelson,
“Layer V neurons in mouse cortex projecting to different targets have distinct physiological properties,”
J. Neurophysiol., 98 3330
–3340
(2007). http://dx.doi.org/10.1152/jn.00397.2007 JONEA4 0022-3077 Google Scholar
Y. Kawaguchi and Y. Kubota,
“GABAergic cell subtypes and their synaptic connections in rat frontal cortex,”
Cereb. Cortex, 7 476
–486
(1997). http://dx.doi.org/10.1093/cercor/7.6.476 53OPAV 1047-3211 Google Scholar
S. Kojima et al.,
“Optical detection of synaptically induced glutamate transport in hippocampal slices,”
J. Neurosci., 19 2580
–2588
(1999). JNRSDS 0270-6474 Google Scholar
A. Konnerth, A. L. Obaid and B. M. Salzberg,
“Optical recording of electrical activity from parallel fibres and other cell types in skate cerebellar slices in vitro,”
J. Physiol., 393 681
–702
(1987). http://dx.doi.org/10.1113/jphysiol.1987.sp016848 JPHYA7 0022-3751 Google Scholar
J. F. Staiger et al.,
“A gradual depth-dependent change in connectivity features of supragranular pyramidal cells in rat barrel cortex,”
Brain Struct. Funct.,
(2014). http://dx.doi.org/10.1007/s00429-014-0726-8 Google Scholar
H. Markram et al.,
“Physiology and anatomy of synaptic connections between thick tufted pyramidal neurones in the developing rat neocortex,”
J. Physiol., 500 409
–440
(1997). http://dx.doi.org/10.1113/jphysiol.1997.sp022031 JPHYA7 0022-3751 Google Scholar
D. Schubert et al.,
“Morphology, electrophysiology and functional input connectivity of pyramidal neurons characterizes a genuine layer va in the primary somatosensory cortex,”
Cereb. Cortex, 16 223
–236
(2006). http://dx.doi.org/10.1093/cercor/bhi100 53OPAV 1047-3211 Google Scholar
D. Goldreich, H. T. Kyriazi and D. J. Simons,
“Functional independence of layer IV barrels in rodent somatosensory cortex,”
J. Neurophysiol., 82 1311
–1316
(1999). JONEA4 0022-3077 Google Scholar
G. Silberberg and H. Markram,
“Disynaptic inhibition between neocortical pyramidal cells mediated by Martinotti cells,”
Neuron, 53 735
–746
(2007). http://dx.doi.org/10.1016/j.neuron.2007.02.012 NERNET 0896-6273 Google Scholar
H. Adesnik et al.,
“A neural circuit for spatial summation in visual cortex,”
Nature, 490 226
–231
(2012). http://dx.doi.org/10.1038/nature11526 NATUAS 0028-0836 Google Scholar
M. Ito,
“Simultaneous visualization of cortical barrels and horseradish peroxidase-injected layer 5b vibrissa neurones in the rat,”
J. Physiol., 454 247
–265
(1992). http://dx.doi.org/10.1113/jphysiol.1992.sp019263 JPHYA7 0022-3751 Google Scholar
K. L. Bernardo, J. S. McCasland and T. A. Woolsey,
“Local axonal trajectories in mouse barrel cortex,”
Exp. Brain Res., 82 247
–253
(1990). http://dx.doi.org/10.1007/BF00231244 EXBRAP 0014-4819 Google Scholar
D. Katzel and G. Miesenbock,
“Experience-dependent rewiring of specific inhibitory connections in adult neocortex,”
PLoS Biol., 12 e1001798
(2014). http://dx.doi.org/10.1371/journal.pbio.1001798 1544-9173 Google Scholar
S. Lee et al.,
“The largest group of superficial neocortical GABAergic interneurons expresses ionotropic serotonin receptors,”
J. Neurosci., 30 16796
–16808
(2010). http://dx.doi.org/10.1523/JNEUROSCI.1869-10.2010 JNRSDS 0270-6474 Google Scholar
R. N. Leao et al.,
“OLM interneurons differentially modulate CA3 and entorhinal inputs to hippocampal CA1 neurons,”
Nat. Neurosci., 15 1524
–1530
(2012). http://dx.doi.org/10.1038/nn.3235 NANEFN 1097-6256 Google Scholar
S. Willadt et al.,
“Combined optogenetics and voltage sensitive dye imaging at single cell resolution,”
Front. Cell. Neurosci., 8 311
(2014). http://dx.doi.org/10.3389/fncel.2014.00311 FCNRAH 1662-5102 Google Scholar
T. A. Woolsey and J. R. Wann,
“Areal changes in mouse cortical barrels following vibrissal damage at different postnatal ages,”
J. Comp. Neurol., 170 53
–66
(1976). http://dx.doi.org/10.1002/(ISSN)1096-9861 JCNEAM 0021-9967 Google Scholar
J. D. Breton and G. J. Stuart,
“Loss of sensory input increases the intrinsic excitability of layer 5 pyramidal neurons in rat barrel cortex,”
J. Physiol., 587 5107
–5119
(2009). http://dx.doi.org/10.1113/tjp.2009.587.issue-21 JPHYA7 0022-3751 Google Scholar
L. Jin et al.,
“Single action potentials and subthreshold electrical events imaged in neurons with a fluorescent protein voltage probe,”
Neuron, 75 779
–785
(2012). http://dx.doi.org/10.1016/j.neuron.2012.06.040 NERNET 0896-6273 Google Scholar
Z. Han et al.,
“Fluorescent protein voltage probes derived from ArcLight that respond to membrane voltage changes with fast kinetics,”
PLoS One, 8 e81295
(2013). http://dx.doi.org/10.1371/journal.pone.0081295 1932-6203 Google Scholar
Z. Han et al.,
“Mechanistic studies of the genetically encoded fluorescent protein voltage probe Arclight,”
PLoS One, 9 e113873
(2014). http://dx.doi.org/10.1371/journal.pone.0113873 1932-6203 Google Scholar
F. St-Pierre et al.,
“High-fidelity optical reporting of neuronal electrical activity with an ultrafast fluorescent voltage sensor,”
Nat. Neurosci., 17 884
–889
(2014). http://dx.doi.org/10.1038/nn.3709 NANEFN 1097-6256 Google Scholar
A. Jung et al.,
“Linker length and fusion site composition improve the optical signal of genetically-encoded fluorescent voltage sensors,”
Neurophotonics, 2
(2), 021012 2015). http://dx.doi.org/10.1117/1.NPh.2.2.021012 Google Scholar
M. E. Diamond, W. Huang and F. F. Ebner,
“Laminar comparison of somatosensory cortical plasticity,”
Science, 265 1885
–1888
(1994). http://dx.doi.org/10.1126/science.8091215 SCIEAS 0036-8075 Google Scholar
V. Jacob et al.,
“Regular spiking and intrinsic bursting pyramidal cells show orthogonal forms of experience-dependent plasticity in layer V of barrel cortex,”
Neuron, 73 391
–404
(2012). http://dx.doi.org/10.1016/j.neuron.2011.11.034 NERNET 0896-6273 Google Scholar
C. Kapfer et al.,
“Supralinear increase of recurrent inhibition during sparse activity in the somatosensory cortex,”
Nat. Neurosci., 10 743
–753
(2007). http://dx.doi.org/10.1038/nn1909 NANEFN 1097-6256 Google Scholar
Y. Jiao et al.,
“Major effects of sensory experiences on the neocortical inhibitory circuits,”
J. Neurosci., 26 8691
–8701
(2006). http://dx.doi.org/10.1523/JNEUROSCI.2478-06.2006 JNRSDS 0270-6474 Google Scholar
S. Q. Lo et al.,
“Imaging experience-dependent plasticity in the mouse barrel cortex,”
in Program No. 29.06 Neuroscience 2013 Abstracts,
(2013). Google Scholar
BiographyShun Qiang Lo is a research fellow and former student with Professor George Augustine’s laboratory. He was awarded his PhD in 2015 after receiving the National University of Singapore’s (NUS) Research Scholarship with the Department of Physiology, Yong Loo Lin School of Medicine in 2010. He also received his BSc degree (with Hons) in biomedical sciences from NUS in 2009. His research interests include voltage-sensitive dye imaging, optogenetics, circuitry, experience-dependent plasticity, and neuroscience. Dawn X. P. Koh received the BSc degree in biological sciences from Nanyang Technological University, Singapore, in 2008 and an MSc degree in medicine from Osaka University, Japan, in 2011. In 2012, she was awarded the graduate A*STAR scholarship and joined the National University of Singapore, Singapore, as a PhD student in the Neuroepigenetics lab. Her current research interests include epigenetics, critical periods, and the barrel cortex. Judy C. G. Sng obtained her PhD in molecular pharmacology from Kanazawa University in Japan. She is currently a senior lecturer in the Department of Pharmacology, Yong Loo Lin School of Medicine, National University of Singapore, and an adjunct investigator at Singapore Institute for Clinical Sciences, A*STAR, Singapore. Her interest lies in epigenetic mechanisms underlying experience-dependent plasticity and environment-epigenome interaction. Her animal model is the mouse visual and somatosensory cortices. George J. Augustine is a professor of neuroscience and mental health at the Lee Kong Chian School of Medicine and a research director at the Institute of Molecular and Cell Biology in Singapore. His research focuses on synaptic transmission mechanisms and optogenetic analysis of brain circuitry. He has published nearly 200 scientific articles and is an associate editor of Neurophotonics. He also is co-author of the popular Neuroscience textbook. |


