
|
|
1.IntroductionWhen single electrode-based probing of neocortex was the only available technique to map cortical function, understanding the neocortical functional organization was solely based on the concept of receptive field. In such studies where activity is being recorded from single neurons, the receptive field is defined by the area of the sensory periphery where stimulation can evoke a suprathreshold (spikes) response (area-to-point convergence). Researchers interested in mapping the functional organization of the cortex typically used the location of the strongest (peak) spiking response within the receptive field to define the correspondence between specific sensory stimulation and cortical function of the recorded neuron. Recording peak responses from many neurons following methodical stimulation along the sensory periphery led to the establishment of how sensory periphery is mapped onto the cortex. Such maps highlighted a fundamental principle of cortical functional organization known as topography, where neighboring points in the sensory periphery map to neighboring points in the cortex. The topographical principle has been repeatedly verified in several cortical areas, especially primary sensory ones, such as retinotopy (visual), tonotopy (auditory), and somatotopy (tactile). With the advance of optical imaging techniques that could offer a spatially continuous, high-spatial resolution, wide-field imaging of neocortical function, it became easier to study the cortex at the large neuronal ensemble, or mesoscopic, level by investigating a functional mapping measure known as the cortical point spread (PS). The PS is defined as the spatial extent of evoked cortical activity following delivery of a focused, spatially restricted or point stimulation to the sensory periphery (point-to-area divergence) [reviewed in Ref. 1], also known as “cortical response field.”2 The PS could also be described as the continuous spatial distribution over cortical space of the evoked response amplitudes following a point stimulation defining the cortical PS function. There are several potential reasons why the cortex would not represent a stimulated point in the sensory periphery as a point in cortex, and they are due to optical properties of the imaging system, the optical properties of the interaction between light and cortex, and the nature of the cortex itself. Specifically, (1) the PS of the imaging system is typically not ideal due to imperfections of its optical elements that could inflate the imaged size (optical PS), (2) due to light scattering from the skull and cortical tissue that could also inflate the imaged size, and (3) cortical neurons are heavily interconnected and, therefore, evoked activity could potentially spread in the cortical tissue via these connections from the location of the thalamocortical input into the cortex (functional PS). As will be seen, the optical PS and light scattering cannot account for the large size of the cortical PS. The potential for a large size of the functional PS in cortex was predicted by Nobel Prize Laureate Santiago Ramon y Cajal. Summarizing many years of his classical histological studies of cortex in 1937, Cajal noted the potential for what we call now a large functional cortical PS by establishing the “the law of neuronal avalanche.” The law of neuronal avalanche states that there is a progressive increase (avalanche) in the number of neurons that process information from the periphery to the cortex.3 However, a functional verification of his histological-based prediction had to wait many years until the birth of optical imaging techniques, as described in this review. Until the development of dense microelectrode arrays with considerably improved spatial mapping capabilities, the spatial extent of a PS was difficult to map using single microelectrode recordings. Instead, the primary means to study the PS had been the use of high-resolution wide-field imaging techniques that enabled spatially continuous sampling of the PS, as opposed to only spatially discrete microelectrode samplings. These wide-field imaging techniques contributed to the revival of Cajal’s “law of neuronal avalanche” by imaging the entire spatial extent of the PS and, therefore, helping to refine our understanding of the cortical structure–function relationship. A key assumption underpinning such refinement is that all evoked cortical activity is important, not just peak responses. This assumption entails that weaker evoked spiking responses localized beyond peak activity, as well as evoked subthreshold (synaptic) responses, should also be considered when cortical function is being recorded/imaged and, therefore, contributing to the large size of a cortical PS. This assumption is in line with the growing evidence for the existence of cortical “nonclassical” or “extraclassical” receptive fields. A nonclassical receptive field includes a subthreshold zone surrounding and modulating the classical (spiking) receptive field and, therefore, increasing the receptive field size; for a recent review see Ref. 4. Two high-resolution wide-field functional imaging techniques have been especially successful in imaging and mapping the territory of cortical PSs. Both techniques are based on optical imaging: voltage-sensitive dyes-based optical imaging (VSDOI; also known as VSDI) and intrinsic signal optical imaging (ISOI). VSDOI excels in its temporal resolution (sub-ms) and has an estimated functional resolution of about .5 It is primarily sensitive to the sum of subthreshold activation of the imaged cortex, and as the dye is attached to membranes, this technique is especially sensitive to neuronal elements that have a large surface membrane, such as dendritic and axonal trees, although glial contribution is also possible; see recent review by Ref. 5. This dye-based technique, however, is invasive and requires large craniotomies and long staining periods after dura removal, and like other dye-based techniques, it is limited in its application due to progressive bleaching of the dye by illumination over time. In addition, photodynamic damage and pharmacological side effects could sometimes affect imaging results, although the potential contribution of these effects has been diminished with the production of recent dyes.5 These limitations could become irrelevant in the case of a recently developed promising technique of genetically encoded indicators of voltage, reviewed by Ref. 6. ISOI (reviewed by Frostig and Chen-Bee7 and Grinvald et al.8), on the other hand, has always excelled in the spatial domain (estimated functional resolution of up to )8 and its temporal resolution has been reported to be as fast as 80 ms.9 Measuring only activity-dependent reflectance changes from the cortex also means that, unlike VSDOI, one can employ strong illumination that is only shot-noise limited. ISOI is based on activity-dependent evoked hemodynamic mechanisms following cortical stimulation and when illumination is employed at the orange/red part of the spectrum, the imaged PS has typically three distinct and largely independent phases (initial dip, overshoot, and undershoot) in anesthetized rats10 and alert monkeys11 similar to the fMRI evoked hemodynamic response sequence; therefore, ISOI results offer implications for this popular functional imaging technique—a topic not further discussed in this review. Another major advantage of ISOI, especially in rodents, is that it can functionally image cortical surfaces through the skull (thinned skull in rats, intact, or thinned skull in mice) and, therefore, ISOI is not invasive to the underlying brain. Also, because ISOI is based on measuring light reflectance from the illuminated cortex (no dyes involved), it is not hindered by limitations such as bleaching or pharmacological side effects, and therefore, is not limited in its application. A commonality of both optical imaging methods is that, due to the limitations inherited in the interactions between photons and brain tissue, both VSDOI and ISOI are more sensitive to neuronal activity within the upper layers (supragranular layers 2, 3) of cortex; both, however, offer the advantage of comprehensively assaying the collective population response of the entire evoked neuronal ensemble. Last, while they can be used to map the spatial extent of the imaged PS territory, it should be noted that both imaging techniques are more commonly used to map the territory of preferred responses, such as columns (e.g., orientation or ocular dominance columns in the visual cortex); for a detailed discussion of the differences between PS mapping and preference mapping, see Ref. 7. 2.Early Optical Recordings of the Point SpreadThe early experiments employing wide-field VSDs were considered optical recording rather than optical imaging studies because they were based on recording evoked voltage-sensitive traces [(e.g., see Fig. 1(c)] by a diode array mounted on the top of a fluorescent microscope. The importance of these first optical recording studies is that they provided the first clear wide-field characterization of the cortical PS. Popular cortical targets for the early optical recording experiments were the somatosensory, auditory, and visual cortices of rats and monkeys [Fig. 1(a)]. The first clear example of a cortical PS was provided in the rat posteromedial barrel subfield (PMBSF), the subdivision of the barrel cortex associated with the ordered array of major facial whiskers (mystacial vibrissae) famous for its one-to-one mapping between each whisker and a layer IV “barrel”—a structure that receives the majority of thalamocortical input to the PMBSF. During the period of the first optical recording experiments, it was believed that single whisker stimulation only activates its own associated barrel in a one-to-one fashion.12 By contrast, as characterized by optical recording, the PS evoked by a point tactile stimulation—a whisker on the rat’s snout—was found to be larger than its underlying layer IV associated barrel but was still contained within the PMBSF, although no attempt was made to quantify its spatial extent.13 Findings regarding the large PS evoked by single-whisker stimulation were later replicated by employing the same diode array based set-up. The replication, however, was based on both VSD recordings and the first recordings of evoked intrinsic signal traces (intrinsic signal recording) from the same PMBSF using an identical whisker stimulation regimen. As shown in Figs. 1(b) and 1(c), both recording techniques showed a large PS within the PMBSF, spreading to all directions away from the peak response while progressively and smoothly declining in amplitude over cortical distance;14 for another VSD recording replication, see Ref. 15—yet again, no attempt was made to quantify these PSs. Together, the PMBSF studies have established that the spread evoked by a point (whisker) stimulation is larger than the underlying anatomical barrel of the same whisker as recorded by both optical techniques. Single-unit studies by Armstrong-James, Fox and colleagues (reviewed by Fox16) during the 1980s provided supporting evidence regarding the spread of evoked spiking to neighboring and sometimes second-order neighboring barrels following single-whisker activation. Fig. 1Animal models and early optical recordings using photodiode arrays. (a) Cortical PSs have been mapped in vivo for various species ranging from mice to monkeys. Provided here are schematics of the cortex depicting the approximate size and location of the various primary sensory regions for a rat (left) or macaque monkey (right) brain. SI, somatosensory; AI, auditory; VI, visual. Main sulci are labeled as RS (rhinal), CS (central), LS (lateral), STS (superior temporal), and LuS (lunate). Note differences in the relative size and location of the primary sensory regions across different animal models. (b) and (c) Early optical recordings of a PS evoked by a single whisker in the PMBSF cortex of the anesthetized rat is much larger than its underlying barrel. The recordings of (b) evoked intrinsic signals or (c) VSDs acquired from the same rat PMBSF are illustrated here. A set-up of a photodiode array mounted on a microscope was employed for both techniques. An average of more than 200 trials is shown in (b) and more than 80 trials in (c). The largest 15 signals in (b) and (c) are denoted by black triangles to demonstrate their identical spatial pattern within the PMBSF. Note that the diameter of a layer IV barrel in SI (whisker anatomical representation) is about and that the area of activity evoked by a single whisker is large in proportion to the size of its barrel and the size of SI in general [compare panels (b) and (c) to left panel of (a)]. Panels (b) and (c) from Ref. 14. (d) Early VSD optical recordings of a PS evoked by a point stimulation consisting of small drifting gratings in the VI cortex of the anesthetized monkey. 3-D frames of a spatiotemporal movie of the evoked activity spread from a cortical area, as extrapolated from an array of photodiode traces. The last frame (230 ms) shows that the lateral spread of a PS is also large in the monkey VI cortex, extending beyond the recorded area. From Ref. 18. 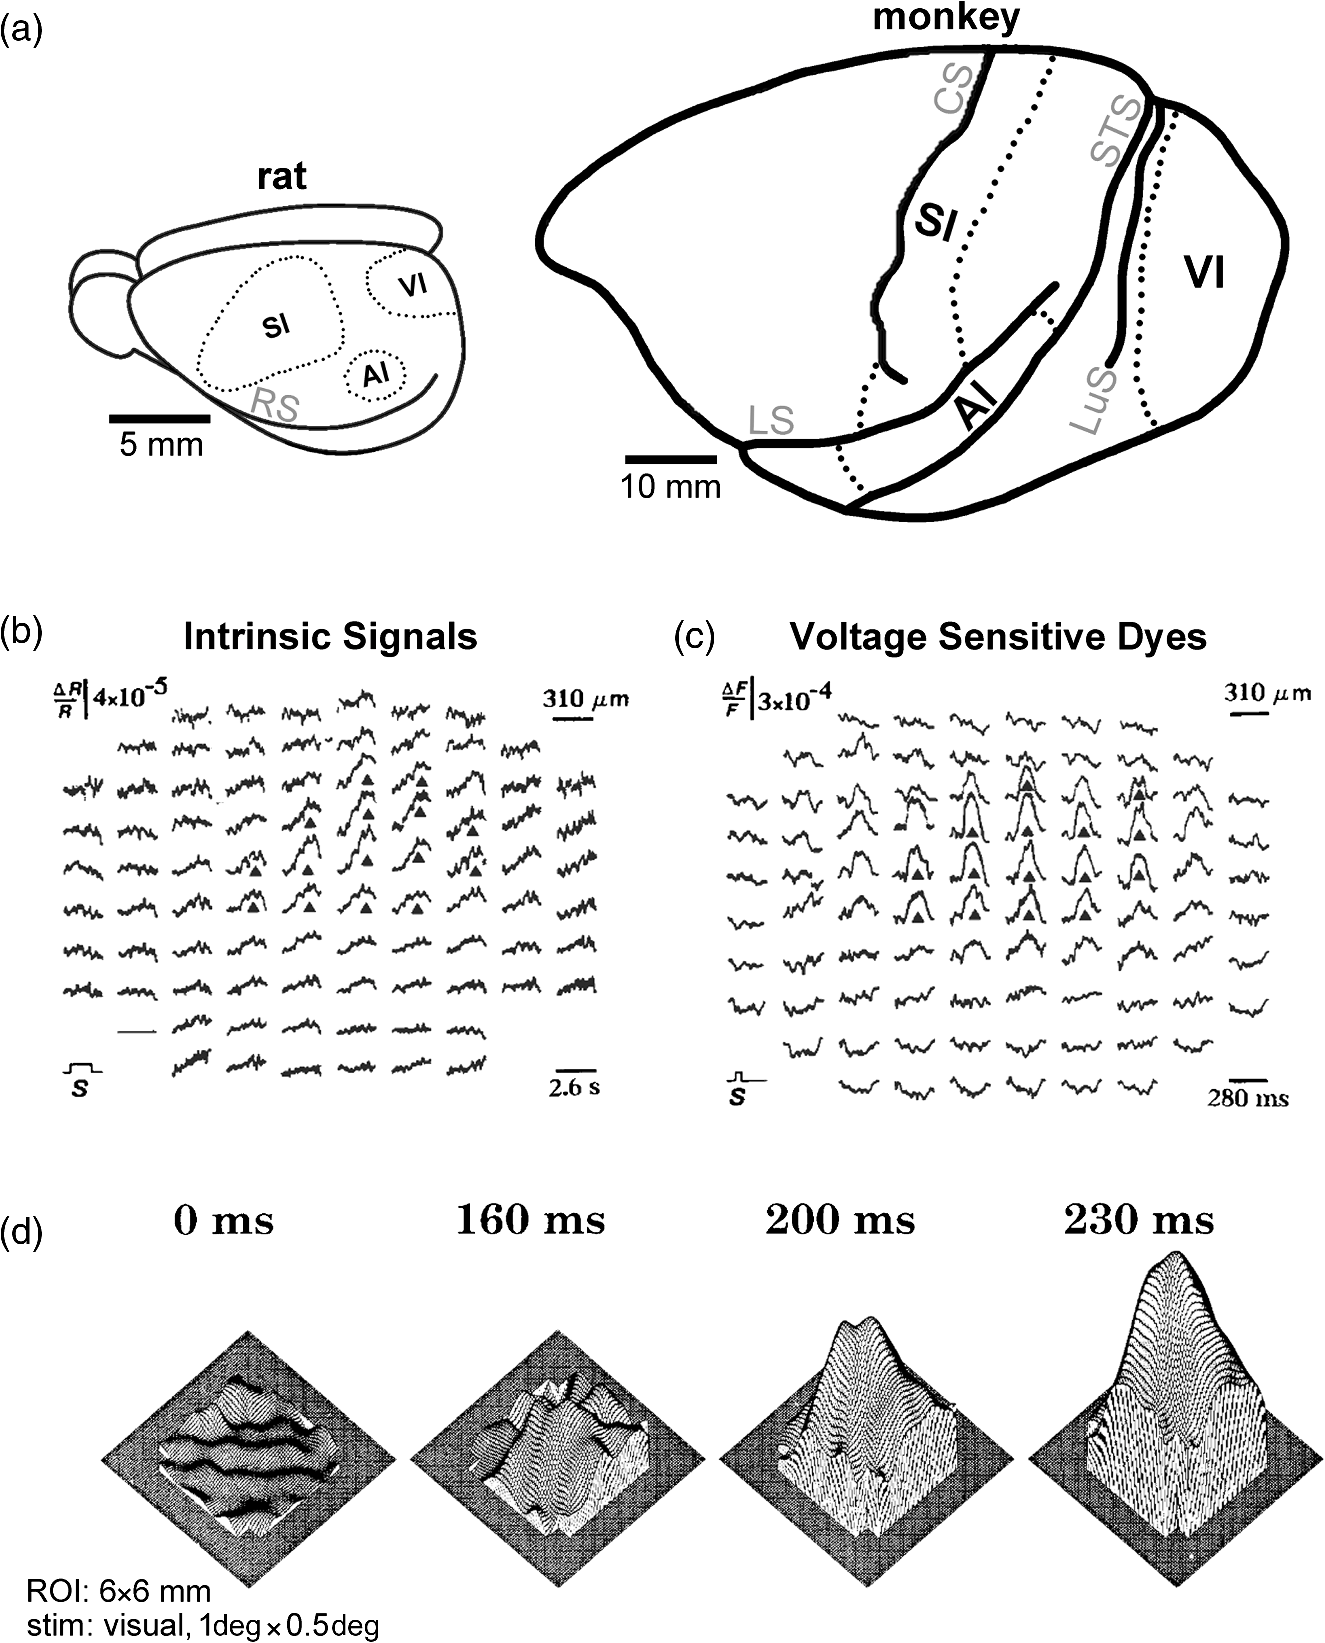 Optical recordings of PSs were also pursued in the auditory cortex. A pure tone is considered the analogous point stimulation for the auditory system as it activates a minimal area of the basilar membrane, equivalent to a whisker or point visual stimulation. Using VSD-based optical recordings in the auditory cortex of the anesthetized guinea pig, the authors obtained a large PS following pure tone stimulation; more specifically, they reported that the VSD signals spread beyond the isofrequency bands obtained by microelectrode recordings, thus indicating that large PSs can also be observed in the auditory cortex.17 In a seminal VSD-based optical recording study that focused on the characterization of the PS in primary visual cortex (V1) of the anesthetized monkey, Grinvald et al.18 clearly demonstrated how surprisingly large was the PS following a very small point () stimulation of moving gratings, as compared to what was known about the location of evoked spiking neurons in V1 following such stimulation. While the peak VSD response in the monkey primary visual cortex was located at the appropriate retinotopic location in VI, the evoked activity beyond the peak was observed to smoothly and progressively reduce its amplitude as it propagated in all directions away from the peak activity, extensively beyond the diode array recording window [Fig. 1(d)]. This study demonstrated that even in monkey V1, one discovers the same cortical PS characteristics as in the rodent: (1) a peak activity at the expected topographic location; (2) a large spatial extent of the PS, far beyond what was known about the location of thalamic input, topographic organization of the cortex, or location of the evoked single-unit recordings; and (3) a typically symmetric or near symmetric progressive and smooth decline in evoked amplitude over cortical distance away from the peak location. These findings including those from the auditory cortex suggested that PSs, while large, were still confined within the borders of their associated primary sensory cortices. 3.Birth of Point Spread Optical ImagingThe modern era of actual imaging of cortical PSs (rather than recording evoked traces of optical activity employing a diode array) by wide-field techniques was ushered in with the introduction of charge-coupled device (CCD)-based camera systems for ISOI and specialized camera systems that offered fast imaging speeds required for VSDOI. For the first time, one could employ these new camera systems to obtain actual high-resolution images of the PS and its spatiotemporal dynamics. The introduction of these camera systems also enabled for the first time to directly obtain wide-field imaging of large areas of the cortex without mounting the CCD camera on a microscope—a major advantage especially for the wide-field imaging of large brains, such as those of cats and monkeys. Thereafter, progressive improvements in camera sensitivity and speed resulted in a significant reduction in the amount of averaging required to acquire PS images. These improvements were also paralleled by progressive improvements in VSDs sensitivity. The early optical recording studies required the averaging of hundreds of trials for VSD [Fig. 1(c)] or intrinsic signal [Fig. 1(b)] recordings, whereas subsequent PS imaging with both optical techniques required only a few trials to obtain a good signal-to-noise quality image of the PS; for ISOI and single-trial VSDOI examples see Refs. 19 and 20. It is important to emphasize that there are many sources of variability that can influence the amplitude, shape, and extent of the evoked PS as characterized by optical imaging techniques. These include potential differences due to different species or strains of a given species; stimulation parameters (amplitude, duration, speed, orientation, direction, and frequency of stimulation); type of dye employed (VSDOI); breathing and heartbeat artifacts; various blood vessel artifacts; wavelength of illumination (ISOI); type of anesthesia; and various movement artifacts in awake animals. Another major source of variability among reports from different labs is the parameter chosen for the image analysis, such as the filtering, smoothing, cropping, thresholding, and choice of statistics applied for the quantification of the imaged data. Finally, differences in sensitivity, signal-to-noise, and speed of different imaging systems could also contribute to the variability. Nevertheless, despite the large variety of variability sources, general conclusions about the PS characteristics can be drawn, as described in the following sections, attesting to PS ubiquity and relevance. 4.Optical Imaging of the Point Spread4.1.Large Spatial Extent of the Point Spread: Further CharacterizationIt is important to note that for the vast majority of optical imaging studies, the PS and, in particular, its entire spatial extent was rarely the intended subject of research. Indeed, it has been fortuitous for researchers interested in the PS that some popular sensory stimuli such as a single whisker or a pure tone also constitute point stimulations. In many functional imaging reports, there was no intention to quantify the spatial extent of the PS. Consequently, in some reports, the information about the spatial extent of the PS could be gleaned only from the scale bar that accompanied the image of the PS. In other reports, the size of the PS spatial extent could be inferred from the superposition of the PS image on the underlying map of cortical architecture, such as cytochrome oxidase maps. Moreover, even if quantified, there was no standard way to compare the spatial extent of PSs across different sensory cortical areas within the same species or across different species [see Fig. 1(a)]; for example, should comparisons be made on an absolute scale in units of millimeters, or on a relative scale in units of percentage relative to either the entire area of a given primary sensory cortex or perhaps the area of the entire cortical hemisphere? Compounding this issue is the difficulty in determining how similar is the stimulus between the different point stimulations being used because: (i) typically, the description of the point stimulation is less than complete (e.g., a single whisker was stimulated, but what was the angle of deflection?) and (ii) there is ambiguity in identifying the equivalent stimulation parameters across the different sensory modalities (e.g., a particular lumens for visual stimulation versus a particular dB for auditory stimulation versus a particular angular displacement for somatosensory stimulation). Finally, it is not clear what criteria should be used to decide where evoked activity is still significant over spontaneous activity, criteria that can strongly influence the size of the reported spatial extent of the PS. Nevertheless, despite all the above-mentioned issues, a picture emerges regarding the large spatial extent of the PS and its ubiquity in different sensory cortices of different species. By employing a CCD camera system that permitted the direct (i.e., without a microscope) wide-field imaging of intrinsic signals in the anesthetized rat primary somatosensory cortex through the thinned skull, Masino et al.21 achieved the first optical imaging of a PS; more specifically, a PS evoked by stimulating a single whisker. In order to create an image of a matrix of neighboring whisker PSs (each stimulated and imaged separately), Masino et al.21 needed to apply a high activity threshold of 2% to 5% of peak evoked optical activity of each whisker PS to exclude areas of overlap with the other single whisker PSs [Fig. 2(a), top right panel]. Without thresholding, however, the total spatial extent of a single whisker PS can be seen and its spatial extent is rather large22 [see Fig. 2(a), left panel], and thus, 2 orders of magnitude larger than the area for a single whisker barrel23 [compare left panel and bottom right panel of Fig. 2(a); see also Fig. 1(a), left panel, for approximate size of rat SI]. The initial imaging studies of single whisker PSs strongly suggested that a single whisker PS has an even larger spatial extent than indicated by prior optical recording experiments, a PS that extends far beyond its own barrel and neighboring barrels22 resulting in highly overlapping whisker PSs.24 Since then, as long as a quantification threshold was employed that permitted a more comprehensive inclusion of the spatial extent25 the Frostig lab continued to find a large PS evoked by a single whisker;10,23,26,27 for mouse, see Ref. 28. Fig. 2Cortical PSs in various primary sensory cortices of the anesthetized rat as imaged with ISOI. (a) The large spatial extent of a PS in SI as evoked by a single whisker. Upper right: nine whiskers (B1, B2, B3, C1, C2, C3, Dl, D2, and D3) were individually stimulated and imaged through the thinned skull. The region of strongest activation was determined for each whisker (plotted in hot colors) and compiled into the composite image as shown here. Lower right: Photomontage of the cytochrome oxidase staining of the anatomical representations in layer IV cortex for the same nine whiskers from the same rat that underwent imaging. Note the similarity in the relative size and location of the whisker representations as determined by imaging versus anatomy. From Ref. 21. Left: ISOI data from a single whisker (C2) is chosen and a transformation from a 2-D view of the data (specifically containing only peak activity) to a 3-D view of the data from the entire recorded area is shown here. The white dotted horizontal line is used to illustrate the level of high thresholding needed in order to isolate only the peak activity, as shown in the top right panel. Note that a high thresholding can lead to an incomplete view of the PS by excluding most of the PS (barrel of C2 , imaged PS ). Also note the large spatial extent of a single whisker PS relative to the size of the entire SI [see Fig. 1(a), left panel]. Modified from Chen-Bee and Frostig.22 (b) The large spatial extent of a PS for other examples of point stimulation. Left: PS in SI evoked by a somatosensory point stimulus delivered to the fur located on the knuckle of the 4th forepaw digit. The stimulus consisted of five pulses delivered at 5 Hz, each . Middle: PS in VI evoked by a visual point stimulus delivered to the eye. The stimulus consisted of a white LED point () delivered in five 10-ms pulses at 5 Hz. The “break” in the smooth decline of the left side of the PS originates from a blood vessel artifact. Right: PS in AI evoked by an auditory point stimulus delivered to the ear. The stimulus consisted of five pure tone pips (8 KHz, 87 dB, 100 ms on 100 ms off) delivered at 5 Hz. Note that large PSs were observed in all three primary sensory regions [compare to Fig. 1(a), left panel] and also note their similarity. Chen-Bee and Frostig unpublished data. 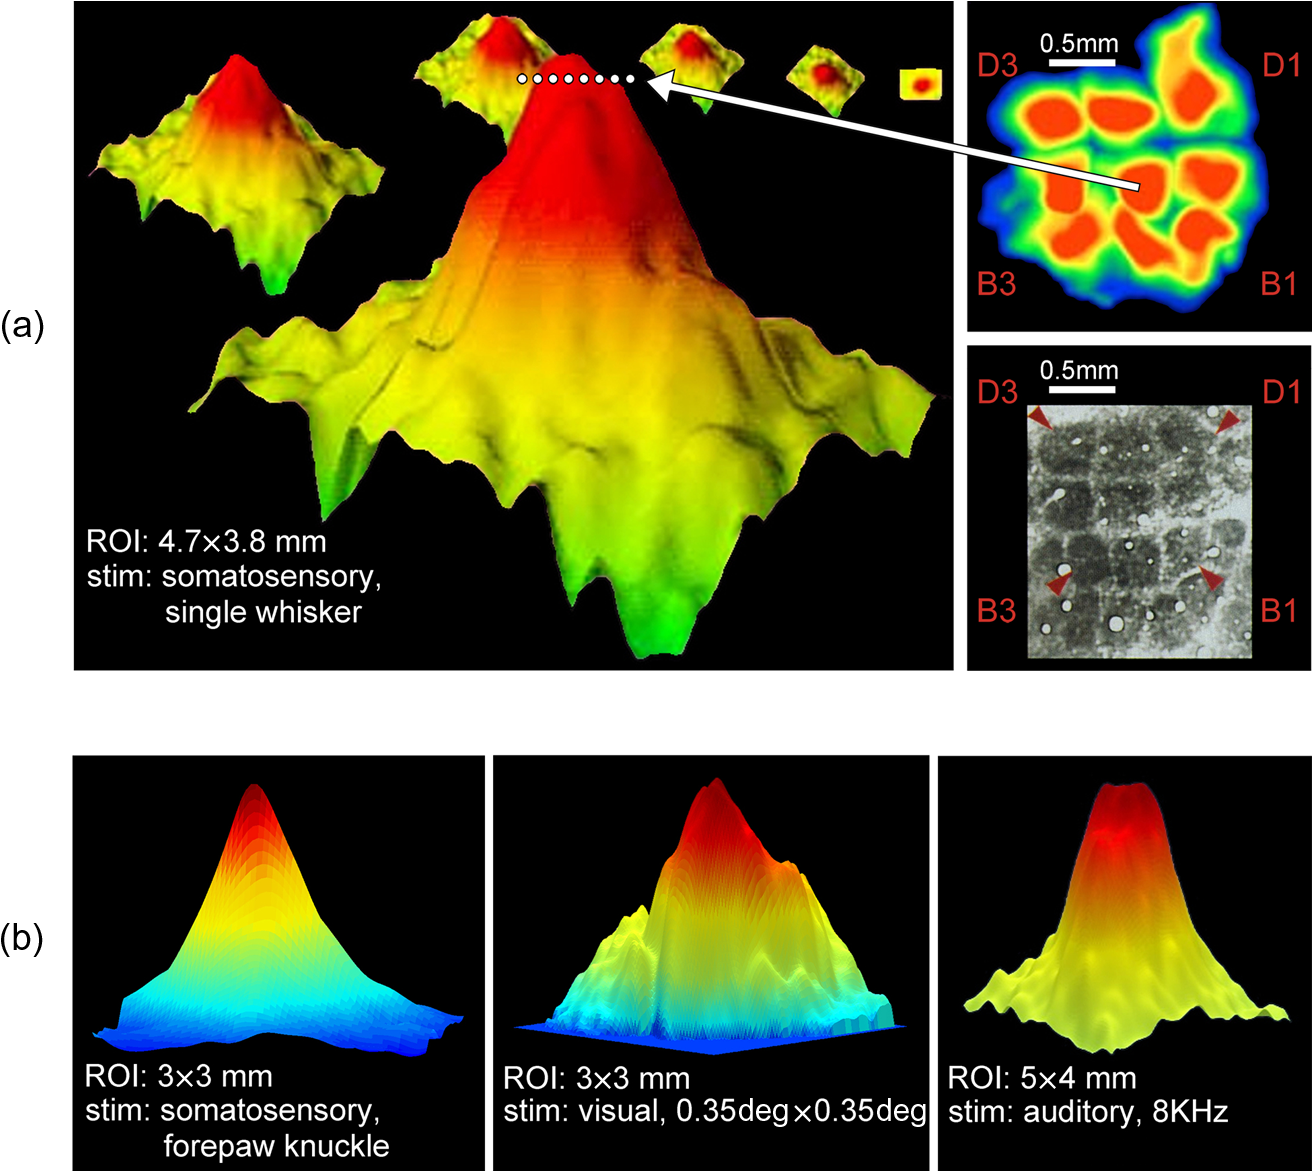 Employing ISOI, Das and Gilbert29 were the first to image a large PS (diameter ranging between 3.2 to 5.2 mm) in the anesthetized cat primary visual cortex following a point stimulus (line segment 0.5 deg). Sharon et al.2 were the first to employ VSDOI to image the PS from the anesthetized cat visual cortex and they also found a large PS ()—following a 4-deg diameter of moving gratings stimulation—peaking over the expected retinotopic cortical area. In the first application of ISOI in the auditory cortex of a rat in response to a pure tone, Bakin et al.30 imaged a large auditory PS () following 45-dB pure tone (23 KHz) stimulation [see Fig. 1(a), left panel for approximate size of rat A1], findings which were later replicated by Tsytsarev and Tanaka.31 Additionally, large PSs were imaged with ISOI or VSDOI from the auditory cortex of ferrets,32 cats,33 and guinea pigs.34 The ferret ISOI study also demonstrated that the PS spatial extent could depend on the magnitude of the stimulation: the stronger the stimulation magnitude of the PS the larger the areal extent of the PS; at 70 and 80 dB, large areas covering the entire auditory cortex could be activated, as also shown in the cat auditory cortex33 and using VSDOI imaging in the guinea pig auditory cortex.34 Areal extent and amplitude of the whisker PS were also progressively dependent on stimulation strength. Petersen et al.35 demonstrated that a very weak (0.6 deg) whisker stimulation evoked a low amplitude PS that lasted for a short duration and spread over a relatively small area of the cortex (just above the appropriate barrel area). Stronger stimulation amplitudes (2 and 6 deg) evoked a progressively stronger amplitude, longer duration, and larger spread, respectively. The 6-deg stimulation—still a relatively weak whisker stimulation for the awake, behaving rodent36—resulted in a large PS over the entire PMBSF;35 see also Berger et al.37 and Deneux and Grinvald38 for similar findings regarding the spatial extent of the PS following different whisker stimulation amplitudes. However, the amplitude of the stimulation is unlikely a major variable that explains the large spatial extent, despite differences in anesthetic agent, stimulus type (e.g., mechanical, air-puffs, magnetic), stimulation parameters and image analysis techniques, similar large-scale (most or the entire PMBSF, or even larger than PMBSF) whisker PSs were reported employing both imaging techniques when the whisker stimulation was at least of a moderate amplitude as can be inferred from rat studies by Blood et al.;39 Jones et al.;40 Derdikman et al.;41 Devor et al.;42 Nemoto et al.;43 Civillico and Contreras;44,45 Lippert et al.;46 Devonshire et al.;47 Lustig et al.;48 and Ollerenshaw et al.;49 and in the mouse Prakash et al.;28 Petersen et al.;35 Ferezou et al.;20,50 Berger et al.;37 Lim et al.;51 and Mohajerani et al.52 In most studies, the PSs were imaged in or near the center of the cortical area of interest and typically, PSs peaking near borders with other cortical areas were rare. Such preferences could bias interpretations regarding general characteristics of different PSs. Case in point are whisker PSs in the PMBSF. In most studies, single-whisker PSs were recorded or imaged following stimulation of whiskers located at the center of the whisker array on the snout and therefore, due to the somatotopic mapping of these whiskers, at the center of the PMBSF [e.g., whisker C2 barrel shown in Fig. 3(a)], whereas whisker PSs whose barrels are localized near the border of the PMBSF (border whisker PSs) remained rarely imaged. For example, whisker A2 barrel is located at the border of PMBSF, which also constitutes the border of SI, whereas whisker E2 barrel is located at the border of PMBSF and the trunk representation that is part of the body representation within SI [see Fig. 3(a) for locations]. Employing ISOI in the anesthetized rat, Brett-Green et al.23 compared the PS for the central whisker C2 and the border whiskers A2 and E2, and found that irrespective of their location within PMBSF, the PSs (which in all cases co-registered with the location of their appropriate barrels) for central versus border whiskers shared a similar large spatial extent and smooth decline of evoked activity in all directions away from the peak. Fig. 3Electrophysiological confirmation of the large spatial extent of the PS in rat SI. Representative case of single units (SU) and LFP responses evoked by whisker A2 stimulation as recorded using an eight-electrode array arranged in a straight line. (a) Schematic of cortical cytoarchitecture based on flattened layer IV CO-stained brain slice. Barrels A2, C2, and E2 are highlighted in colors. MCx, motor cortex; VCx, visual cortex; ACx, auditory cortex; SII, secondary somatosensory cortex; DZ, dysgranular zone cortex; PV, parietal ventral cortex; IC, insular cortex. (b) Lesions produced by the eight-electrode array. Note electrode #1 lesion is located at the A2 barrel while electrodes 2 to 3 are located in the dysgranular zone, and electrodes 4 to 8 span almost the entire auditory cortex (ACx). (c) Evoked SUs (averaged from 128 trials) decay over cortical distance and completely disappear after electrode 4. (d) Evoked LFPs, recorded from the same microelectrodes, also decay over distance but are still present at the last electrode. (e) Evoked LFPs are abolished in electrodes 7 to 8 (red traces) after lidocaine injection between electrodes 7 and 8, with full recovery after 45 min (f). (g) Control saline injection had no effect. Bottom, magnification of traces boxed in (d)–(f). From Ref. 58.  An important development has been the ability to image the PS in awake animals such as awake monkeys trained to fixate on a point stimulus.53,54 Imaging V1, Slovin et al.53 found PS dimensions of following a tiny visual stimulus, and Palmer et al.54 found a PS of . Notably, Palmer et al.54 found that for a given stimulation amplitude, the PS was almost constant (invariant) in spatial extent at different (yet limited range of) eccentricities despite changes in magnification and population receptive fields scatter at those eccentricities. This finding suggests a potential for generalization regarding the spatial extent of PSs at different parts of a cortical area as this finding resembles the similarity in PS spatial extent for center versus border whiskers, as described above.23 Indeed, whisker PSs in the highly magnified PMBSF subarea are similar in their spatial extent to other PSs in nonmagnified subareas of SI [Fig. 2(b), left panel] and in different sensory cortices of the rat [Fig. 2(b), middle and right panels], suggesting further support for similarity of PSs irrespective of differences in cortical mapping characteristics such as magnification. As with the progress of PS mapping in the awake monkey, technological progress enabled whisker PS imaging and mapping in the awake, behaving rodent. Specifically, using fiber optics and VSDOI, this was accomplished in freely moving mice by the Petersen group.50 Notably, these important experiments demonstrated that passive single whisker stimulation evoked a PS that is larger and lasts longer than passive single whisker stimulation in the same mouse when anesthetized, results that were recently reproduced by Mohajerani et al.52 Together, these findings demonstrate that the awake animal PS could exhibit an even larger spatial extent and stronger amplitude as compared to the anesthetized cortex. 4.2.Electrophysiological Studies of the Point SpreadThus far, PS results have been described for wide-field optical recordings and imaging studies. Compared to the findings obtained from the microelectrode studies used to establish topography as a fundamental principle of cortical organization, these imaging PS results were congruent with the expectation that the peak evoked activity should be registered with a specific topographical location but were disparate in that the large spatial extent of the PS contrasted with the expectation for the spread of activity not to radiate too far away from the peak. Possibly, this disparity was due to the differences in what was being recorded by the different techniques: whereas microelectrode recordings measure supra- and subthreshold activity directly from neurons, VSDOI directly images population-evoked activity mostly originating from the membranes of dendritic trees, and ISOI directly measures hemodynamic-based intrinsic signals as an indirect measure of neuronal activity. Therefore, the implications of the functional imaging results obtained from employing either optical technique would benefit from an explicit confirmation by microelectrode recordings. The optimal approach would be to first image the PS and then to perform microelectrode recordings postimaging within the same animal using the same stimulation regimen, with the imaging results guiding the placement of microelectrodes at different locations inside and outside the imaged PS. Already during the early study by Grinvald et al.18 mentioned above, postoptical recordings results were investigated by using a single microelectrode to record sequentially at different locations of the imaged PS in the primary visual cortex of the anesthetized monkey. Using the same stimulation as for their VSDOI imaging, they found that the evoked action potentials comprised only a small area centered with the location of the imaged PS peak activity; in particular, microelectrode recordings located at the periphery of the imaged PS did not detect any evoked action potentials despite a clear presence of evoked VSD activity. These findings introduced the notion that most of the large spread is composed of evoked subthreshold activity. Indeed, microelectrode recordings at the periphery of the optically evoked PS did not detect any evoked spikes despite clear presence of evoked VSD activity. These findings suggested that there exists in primary visual cortex of monkeys a small cortical zone surrounding peak location, where evoked suprathreshold activity can be recorded and a larger zone surrounding that peak zone characterized by evoked subthreshold activity. Further support emerged from subsequent studies in the cat primary visual cortex by Das and Gilbert,29 who followed ISOI imaging of the PS with postimaging microelectrode mapping of spiking neurons and estimated that the spiking PS area represented only 5% of the area of evoked PS, and by Sharon et al.,2 who employed single unit recordings of evoked spiking responses post-VSDOI imaging and found spiking activity to be localized only at a small cortical zone around the peak activity. Together, these findings suggested that a large evoked subthreshold area surrounding peak activity location constitutes most of the imaged PS area in the visual cortex of cats and monkeys. These findings were congruent with direct intracellular electrophysiology recordings in the cat primary visual cortex describing a large subthreshold activation area following a small visual stimulation;55 although a potential contribution of astrocytes to ISOI imaging in the visual cortex has also been suggested.56 In parallel, electrophysiological results in the primary auditory cortex of the rat following pure tone stimulation also demonstrated a large spread of evoked local field potentials (LFPs representing population evoked synaptic activity) in the rat auditory cortex following a pure tone stimulation.57 To better understand and further characterize the relationship between these suprathreshold and subthreshold zones of the PS, Frostig et al.58 conducted a study in which imaging a single whisker PS with ISOI was followed by detailed neuronal recordings utilizing an array of eight independently controlled microelectrodes organized in a straight line to span across different locations of the PS with increasing distances away from peak activity [for example, see Fig. 3(b)] and enabling recordings at different cortical depths. As in the previous study,23 both central (C2) and border whiskers (A2 and E2) neuronal PSs [see Fig. 3(a) for locations] were investigated. The obtained results of Frostig et al. in the rat PMBSF confirmed and extended previous results obtained from the visual cortex, namely by explicitly demonstrating the simultaneous existence of two activity zones comprising the whisker PSs: a suprathreshold and a subthreshold—both of which registered with the peak, with the latter being much larger than and surrounding the former [Figs. 3(c) and 3(d)]. Evoked suprathreshold whisker PS amplitude progressively declined over cortical distance away from peak activity as far as 1.5 mm away in of rats [see PSTHs in Fig. 3(c)], which would be equivalent to a circular areal extent of and as far as 2.5 mm maximal distance, which would be equivalent to a circular areal extent of . The evoked subthreshold (LFP) whisker PS also showed a progressive decline of its amplitude over cortical distance away from peak activity [Fig. 3(d)], but unlike the evoked suprathreshold case, evoked subthreshold PS always reached the last microelectrode (3.5 mm away from peak PS, a radial distance equivalent to a circular areal extent of at the last microelectrode). Notably, the LFP amplitude at the last microelectrode was still, on average, 11% of the peak amplitude, suggesting that the evoked LFP may radiate even farther than 3.5 mm from the peak. These findings on the extent of the subthreshold PS were obtained irrespective of recording array direction away from peak location, its cortical depth, or whether recordings were obtained from central or border whisker PSs. As with previous ISOI results in the PMBSF, both suprathreshold and subthreshold PSs were symmetrically spreading away from peak location, and the only difference among different whisker PSs was the location of their peak. Notably, targeted injections of sodium channel blocker lidocaine into the territory of the last microelectrodes (3.0 to 3.5 mm away from peak) completely flattened evoked LFPs at these distant locations, clearly demonstrating that the large subthreshold PS is not a case of “volume conductance” artifact but rather a case of actual long-range subthreshold neuronal activation [Figs. 3(e)–3(g)]. In addition, thin gray-matter transections between the array’s middle microelectrodes resulted in flattening of the evoked LFP amplitude to noise level for microelectrodes located beyond the transection line, directly demonstrating for the first time that evoked single whisker subthreshold activity spreads horizontally through cortical gray matter (Fig. 4). Fig. 4Evoked LFP following single whisker C2 stimulation spreads horizontally within cortical gray matter. An eight-electrode array is used to record LFPs from the anesthetized rat cortex, with electrode #1 coregistering with whisker C2 barrel. Layers 2 to 3 LFP amplitudes declining over cortical distance (denoted on the -axis as electrode number, with 0.5 mm between electrodes) as evoked by whisker C2 stimulation (black line plot) were almost abolished at electrodes 5 to 8 (green line plot) after thin gray matter transection between electrodes 4 and 5 (black arrows), an effect not observed after an earlier transection parallel to the electrode array (purple line plot). Inset: Nissl-based micrograph of the gray matter transection (arrows); . From Ref. 58. 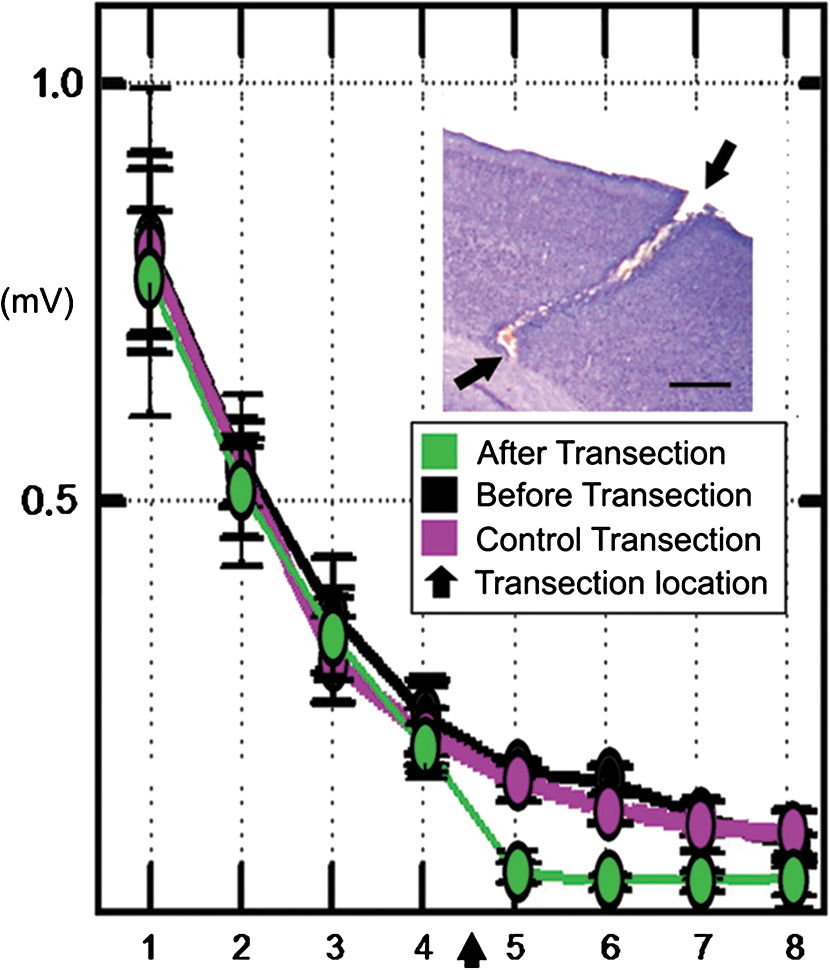 4.3.Point Spread and the Underlying Cortical CytoarchitectureOptical imaging and electrophysiological results summarized in the previous two subsections support the notion that an evoked PS can be very large, with an activity amplitude smoothly decaying to far distances in all directions away from the peak. Because the peak for any given PS is registered at the topographically correct cortical location, the findings of a large and relatively symmetrical spatial extent even for PSs whose peaks are located at the border of a sensory cortical region introduced the possibility of a PS to extend outside its associated sensory cortical region and perhaps even into regions of other sensory modalities. In the Frostig et al. study58 already reviewed in the previous section, it should be noted that immediately following the single unit and LFP recordings acquired from the microelectrode array, the authors performed localized lesions to mark the location of the recording microelectrodes in order to explicitly compare the spread of activity to the underlying cortical cytoarchitecture as stained with cytochrome oxidase (CO). In doing so, they were able to directly demonstrate that stimulating border whisker A2 resulted in an evoked subthreshold PS that not only spanned the dysgranular area surrounding SI but also, and more surprisingly, continued and spanned the entire auditory cortex [Fig. 3(b)]. Indeed, as seen in [Fig. 3(b)], only the first microelectrode of the array was located within the PMBSF (above the A2 barrel) and, therefore, still within the SI territory, whereas the remaining seven microelectrodes in the array were located outside the SI territory. Notably, microelectrodes 2 to 3 were located in the dysgranular zone and microelectrodes 4 to 8 spanned almost the entire auditory cortex. Furthermore, even stimulating the central whisker C2, whose barrel is located at the center of the PMBSF and, therefore, farther away from the SI border, still evoked a large subthreshold PS that crossed dysgranular areas to invade parts of the visual and auditory cortices. Similarly, stimulating whisker E2 on the opposite side of C2 [refer to locations in Fig. 3(a)] resulted in a subthreshold PS that spanned the trunk representation of SI and reached the border of primary motor cortex MI. These findings suggested that in order to keep a single whisker PS relatively symmetric and similar in spatial extent (see previous two subsections) irrespective of which whisker was stimulated, it was necessary for a given PS to cross cytoarchitectural cortical borders. Furthermore, these findings also suggested that as the difference between whisker PSs is only in the location of their evoked peak, the closer the peak activity location of a whisker PS is to a cytoarchitectonic cortical border, the deeper the whisker PS invades into other cortical areas that are located closest to the border. Further supporting evidence was obtained in the mouse PMBSF by the Petersen lab employing VSDOI. When the entire mouse hemisphere was imaged in awake, head-fixed mice, two important aspects were revealed: the whisker PS did not stop at the borders of PMBSF, and a second PS was imaged in the motor cortex that was found to be spreading away from the stimulated whisker anatomical motor representation. Specifically, within 40 ms of active whisker stimulation (hitting an object with single whisker), the entire surface of the imaged hemisphere was activated as a result of the merging of both somatosensory and motor PSs as the evoked activity radiated away from their respective peak activity locations;20 see Fig. 5. Clearly, the whisker PS in this case was spreading far beyond borders of their respective PMBSF and motor cortex and thus, trespassing deeply into other cortical areas, although the authors did not identify the different cortical areas activated by these PSs. Similar VSDOI imaging results supporting the spread beyond the border of PMBSF by a whisker PS were obtained by the Murphy lab52 and recently reproduced by the Petersen lab.59 In addition, similar results about the spread beyond borders can also be seen in the mouse when imaged with genetically encoded indicators of voltage.60 Together, these findings demonstrate that there are two additional characteristics shared between imaged PS and subthreshold PS, which lend further support to the notion that subthreshold activity underlies imaging PS: (1) both types of PSs cross borders and (2) both invade into other cortical areas. Fig. 5The large PS following active whisker C2 stimulation as imaged with VSDOI. A single-trial example of active touch imaged in an awake mouse. The C2 whisker actively touches an object (upper row image sequence), evoking a PS first in the somatosensory cortex and then in the motor cortex (lower row image sequence). Note after 40 ms activity is detected over the entire hemisphere. From Ref. 20; reprinted from Neuron, 56(5), Ferezou et al., Spatiotemporal dynamics of cortical sensorimotor integration in behaving mice, 907-923, Copyright (2007), with permission from Elsevier. 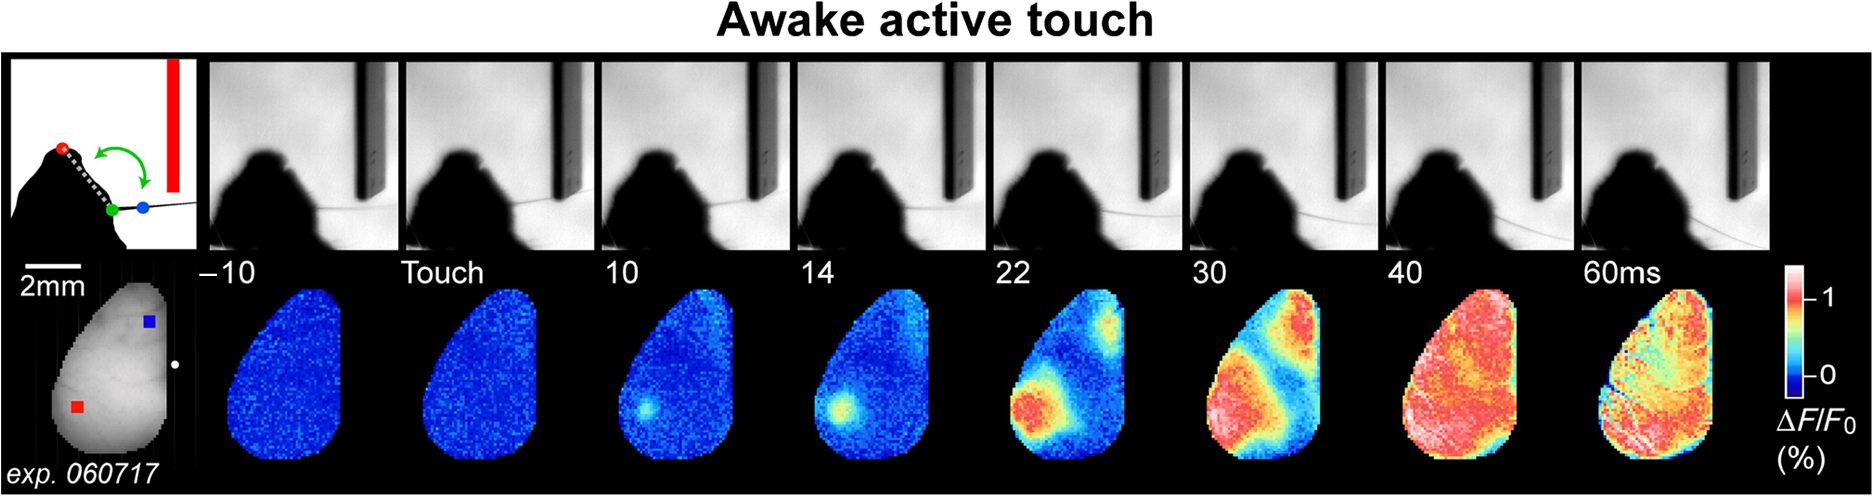 4.4.Relationship between Functional and Anatomical Point SpreadThe functional results obtained with optical imaging and electrophysiology recordings summarized so far raise an important question: what could be the underlying anatomical system responsible for supporting the large horizontal spread of PSs? The earlier imaging and electrophysiological studies by Grinvald et al.18 in the monkey visual cortex and Das and Gilbert29 in the cat visual cortex proposed that cortical long-range horizontal projection within gray matter could constitute the underlying system supporting the PS spread of activity. Several studies were conducted to address this possibility in the PMBSF, but the challenge in this case was the need to demonstrate whether such an anatomical system could support the functional findings, i.e., a case of a system of long-range horizontal projections that are capable of crossing cytoarchitectural borders and, therefore, spatially match with the imaged and electrophysiological PSs, although the option of multisynaptic projections could also be relevant. In the Frostig et al. electrophysiological recording study,58 localized (point) injections of the anterograde tract-tracer biotinylated dextran amine (BDA) were deposited into imaged peak activity locations as a means to characterize the underlying anatomy of the PS for a single whisker. Findings showed clear spread of axons or axon collateral segments diffusely projecting to all directions away from the PMBSF injection site. The point injection and the resulting spread of projections constitute the cortical anatomical PS. The density of the anatomical PS labeled axon segments declined over cortical distance, indicating that the anatomical PS is composed of short, medium, and long-range axonal projections. Congruent with results obtained by optical imaging techniques and microelectrode array recordings, such axonal projections also clearly ignored cytoarchitectonic borders by trespassing into the auditory and visual cortices as identified by layer IV flattened cortex cytochrome oxidase staining of the same rat. After crossing the dysgranular area separating PMBSF and visual cortex, traced axonal projection reached 2.5 mm in length spanning into visual cortex. In addition, the authors found dense staining locations of known area-to-area projections through white matter from the PMBSF into expected targets such as secondary somatosensory cortex (SII), dysgranular cortex (ParP, posterior parietal), motor cortex, and insular cortex. The preliminary anatomical results demonstrating the existence of horizontal long-range, border crossing, diffuse projection system within the gray matter were followed up and extended by a detailed study of this projection system in the PMBSF by Stehberg et al.61 Using anterograde tract-tracer BDA, injections and detailed mappings of axonal projections at different locations within PMBSF, a clear pattern emerged that supported imaging and electrophysiological PS mapping findings. These findings suggested that irrespective of BDA injection location within PMBSF, two major systems can be clearly described: (1) the traditional area-to-areas system, where axons project through white matter into specific areas (e.g., SII, PVT) and (2) a diffuse, apparently nonspecific projection system within gray matter that projects to all directions and includes very long, border crossing horizontal projections, see Figs. 6(a)–6(c) for a schematic view of these systems. Fig. 6Proposed model of anatomical projections for rat PMBSF and comparison between anatomical versus functional PS as imaged with ISOI. (a–c) Schematic of the proposed distinction between a specific versus a diffuse system of anatomical projections for the rat PMBSF. Schematics depict relevant cortical areas (a) to be compared to the proposed diffuse system of long-range border crossing projections (b) and the more familiar, specific system of main outputs projections (c). VI, primary visual cortex; AI, primary auditory cortex; SI, primary somatosensory cortex; SII, secondary somatosensory cortex; dys, dysgranular cortex; PMBSF, posteromedial barrel subfield of SI; PVT, parietoventral cortex. From Ref. 61. (d) and (e) The similarity between functional PS and anatomical PS of a single whisker. (d) Functional PS. Evoked activity spreads horizontally for long distances following single whisker stimulation. The intrinsic signal optical imaging response following stimulation of the C2 whisker (the first 500 ms containing the maximal areal extent of the initial dip activity) was averaged across 37 rats, as described by Chen-Bee et al.66 and was plotted as a false-color image of fractional change relative to prestimulus values. The “outer circle” has a diameter of 7 mm and represents an extrapolation of the farthest electrode used in the recordings of Frostig et al.,58 at which an evoked field potential response could be detected in 100% of animals. Black outlines show locations of whisker barrels and cytoarchitectonic areas that were detected by cytochrome oxidase staining in a representative animal. Trunk, trunk region of primary somatosensory cortex; VCx, visual cortex; ACx, auditory cortex. (e) Anatomical PS. Average density of projection pattern across all brains and section depths for supragranular injections of AAV-CMV-GFP. After averaging across four section depths, data arrays corresponding to the 7.2-mm diameter analysis region were re-expressed for each of the nine brains injected with AAV-CMV-GFP in supragranular layers. The re-expressed arrays were then averaged across the nine brains to reveal a largely symmetrical axonal radiation in which axonal density declines with distance from the injection site. Scale: white denotes no detectable projections, the transition from green to yellow denotes the mean density across the analyzed region, and red denotes the maximum density across the region. From Ref. 63; Brain Structure and Function, Long, intrinsic horizontal axons radiating through and beyond rat barrel cortex have spatial distributions similar to horizontal spreads of activity evoked by whisker stimulation, 221, 2016, 3617-3639, Johnson and Frostig, © Springer-Verlag Berlin Heidelberg 2015, With permission of Springer. 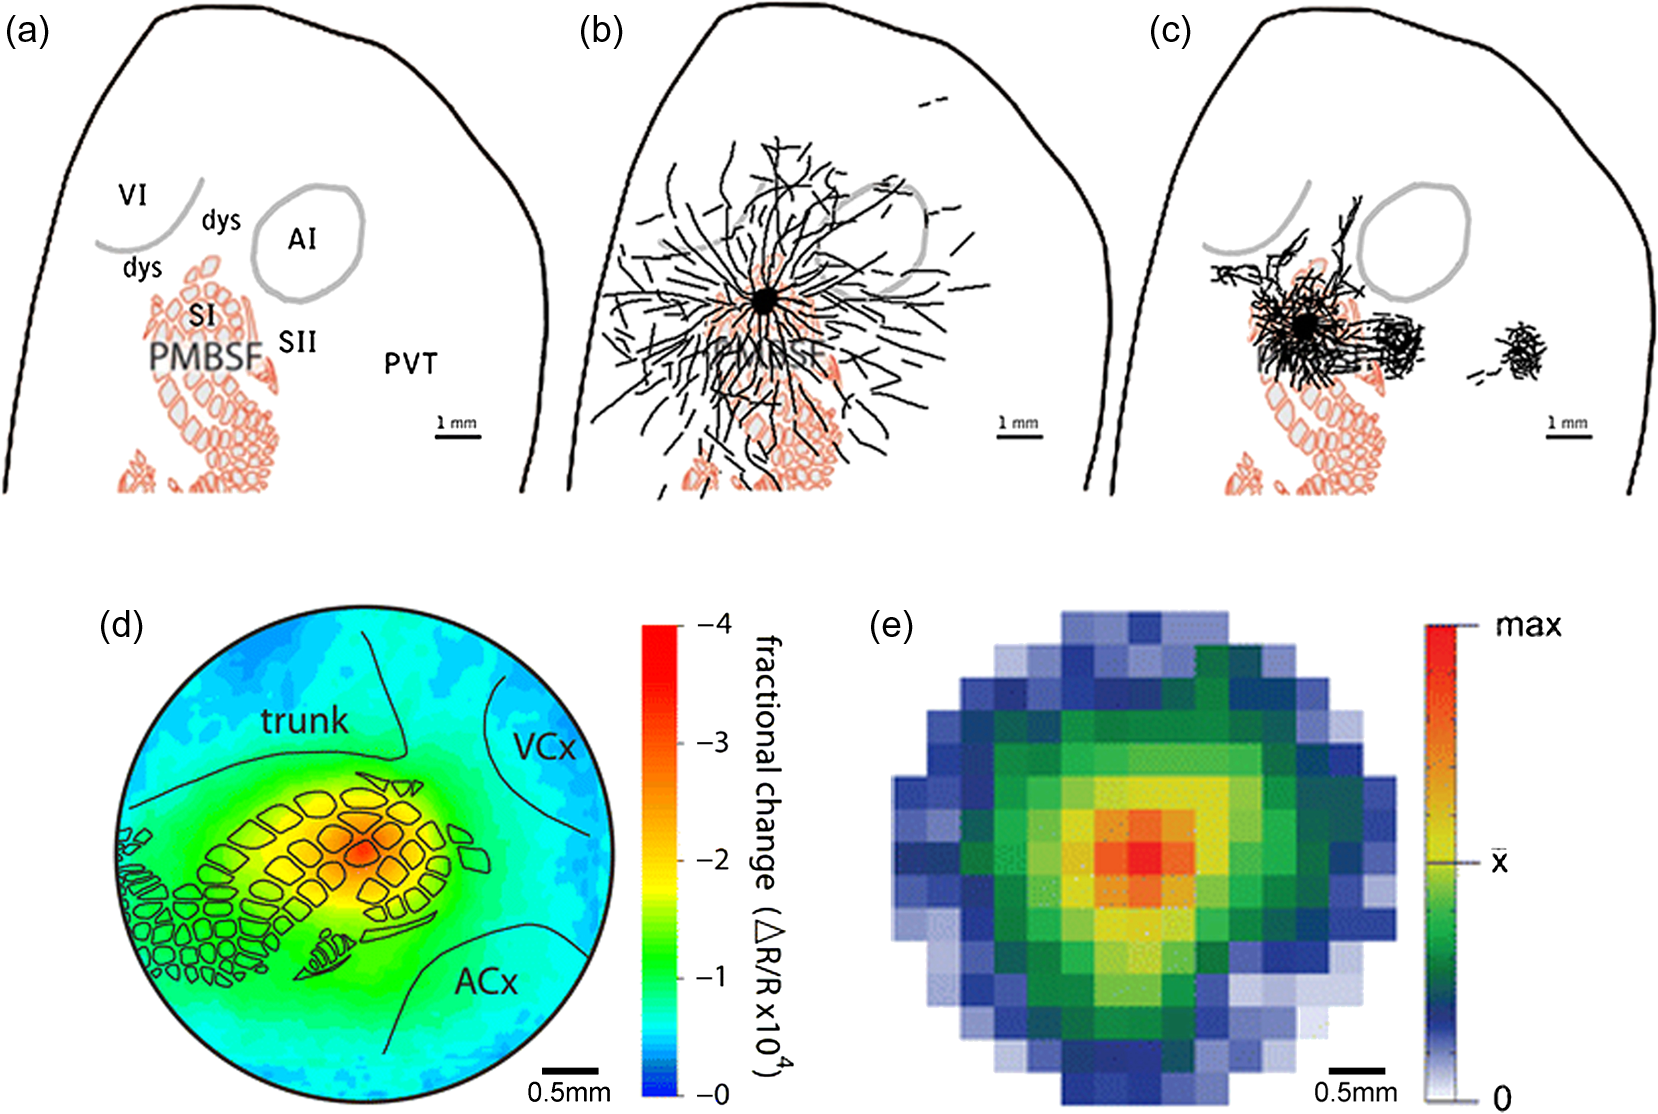 Johnson and Frostig62,63 further extended the BDA findings by employing detailed qualitative and quantitative analysis of the anatomical PS within PMBSF using modern tract-tracing techniques. Specifically, discrete deposits of adeno-associated virus (AAV) were injected into the supragranular or infragranular layers of the PMBSF. The AAV vectors used either the direct expression of enhanced green fluorescent protein (GFP) under cytome-galovitus (CMV) or enhanced yellow fluorescent protein under a calcium/calmodulin-dependent protein kinase IIα (CaMKIIα), with the former labeling all types of neurons and the latter labeling only excitatory neurons. The detailed qualitative and quantitative analysis of the anatomical PS for both types of vectors confirmed and further extended previous results of Frostig et al.58 and Stehberg et al.61 Analysis revealed anatomic PS of labeled axons diffusely radiating in all directions for distances originating both from supragranular and infragranular injections with declining density over cortical distance—patterns that were common to both types of vectors. Detailed reconstruction of single axons originating from each injection site demonstrated how projections radiated away from the injection site and across the PMBSF, branched and sometimes crossed into other sensory cortices as identified by the underlying layer IV cytochrome oxidase staining. The spatial similarity between functional and anatomical PSs is shown in Figs. 6(d) and 6(e). It should be noted that the anatomical mapping results of the diffuse system constitute a conservative estimate of the horizontal projections density, because this mapping was achieved using magnification and while more projections could be seen with magnification, the higher magnification was used only for full-length reconstruction of single axons. Despite the conservative estimate, the anatomical PS was still spatially matching the imaged and electrophysiological PSs by spanning distances in the order of several millimeters. The combined BDA and AAV findings indicated that at least for a single whisker in the rat PMBSF, the anatomical PS [Fig. 6(e)] shared many characteristics with the imaged PS [Fig. 6(d)] or subthreshold electrophysiological recordings (Fig. 3). These include large and relatively symmetrical spatial extent, ability for border crossing and ability for trespassing into other cortical areas, diffuse and smooth decline over cortical distance. The BDA and AAV experiments can be combined together with the transection (Fig. 4) and lidocaine (Fig. 3) electrophysiology experiments of Frostig et al.58 to implicate the diffuse, horizontal system—composed of short, medium, and/or long-range monosynaptic and multiple synaptic projections—as the underlying anatomical PS supporting the functional PS as imaged by optical imaging techniques and confirmed by electrode array recordings. These findings also suggested that a large-scale, structure–function spatial similarity exists involving the functional and anatomical PSs at the mesoscopic level of cortex. 4.5.Point Spread is a Dynamic Entity Capable of Contextual Modulation and PlasticityAs described above, the results from PS imaging and postimaging neuronal recording in the visual cortex and PMBSF of anesthetized and awake animals suggested that the PS spatial extent is relatively constant (invariant) to its location within a given cortical area (i.e., different eccentricities in visual cortex, different barrels in PMBSF) for a given stimulus amplitude. However, the PS is a dynamic entity that can exhibit contextual modulation and plasticity. The dynamic nature of the PS was first demonstrated in the anesthetized monkey in the Grinvald et al. study using VSDOI.18 The visual cortex PS amplitude was always attenuated by various patterns of flanking stimulations irrespective of their size and orientation, although the degree of attenuation was dependent on these variables. Similar findings were observed in the awake monkey using ISOI. The PS amplitude was attenuated following the presentation of identical, two flanking PSs.64 Similar to the monkey, contextual interactions among PSs were observed in the PMBSF of the anesthetized rat using ISOI. The amplitude of response to simultaneously stimulating an entire array of whiskers was attenuated as compared to what might be expected based on a linear summation of single-whisker PSs associated with each of the whiskers in the array. In general, this amplitude attenuation was dependent on the number of whiskers being stimulated: the more whiskers stimulated, the stronger the response attenuation (see more details below in Sec. 5.3).65,66 Similar findings were obtained using VSDOI for pairs of stimulated whiskers in the anesthetized mouse and rat.44,48,67,68 Together, these studies suggested that attenuation by contextual modulation of the PS by flanking stimulations could be a general rule irrespective of cortical area imaged, anesthesia versus awake preparation, and imaging technique, but more data are needed to further substantiate this potential rule. A whisker PS can exhibit use-dependent plasticity of its spatial extent and amplitude when the rat’s environment changes. Repeated imaging supported by single unit recordings demonstrated that a spared whisker PS contracts its spatial extent and its amplitude diminishes when rats have the opportunity for whisker-dependent scanning of an environment outside their cage.27,69 Conversely, its PS expands when the same single spared whisker is only used inside its standard cage, and no changes are found for control, nonspared whisker rats. Allowing the rest of the previously deprived whiskers to regrow to their original length results in the return of the single PS back to its baseline values (Fig. 7).69 Despite this strong case of plasticity, the basic characteristics of the PS, such as peaking at the expected topographical location and the symmetrical declining away from the peak, remained intact. Moreover, even without deprivation of whiskers—just allowing rats to live for 28 days in a “naturalistic habitat” that promotes tunnel digging, interactions with other rats, and foraging activities—results in PS contraction and reduction in its amplitude as compared to controls that are housed in standard cages residing within the same room.27 While the findings were obtained after 28 days, cellular and molecular studies comparing rats living in a naturalistic habitat to matched standard cage controls in the same room showed that plasticity can start as early as 2 days after transfer to the naturalistic environment,70 therefore, raising the possibility that future imaging studies of whisker PS could detect such plasticity at short periods following transfer to the naturalistic habitat. However, extremely long, continuous living in the naturalistic habitat ( months) showed no difference in PS spatial extent and amplitude compared to standard cage controls within the same room (Kvasnak and Frostig, unpublished results). Taken together, these findings suggest that while the whisker PS can exhibit significant experience dependent plastic changes, there seems to be a spatial extent and amplitude “set point” that it is returning to, implying a possibility for homeostatic control on the spatial extent and amplitude of the PS. Fig. 7Imaging PS plasticity using ISOI. Plasticity of a spared whisker’s functional PS is reversible upon restoration of normal sensory input. (a) Schematic of the experimental design. (b) Examples of ISOI images for the spared whisker PS obtained from a sensory-deprived animal that remained in its home cage (top row) or was given an opportunity for spared whisker guided exploration outside its home cage (bottom row) are taken before deprivation, after 28 days of deprivation, and after 28 days of whisker regrowth. Ratio values are converted to grayscale values in which the prestimulus baseline is shown as gray, and the black and white values on the grayscale bar are set to a decrease or increase of from baseline values, respectively. For detailed analysis of the plasticity at all activity levels of the spared whisker PS, see Ref. 69. 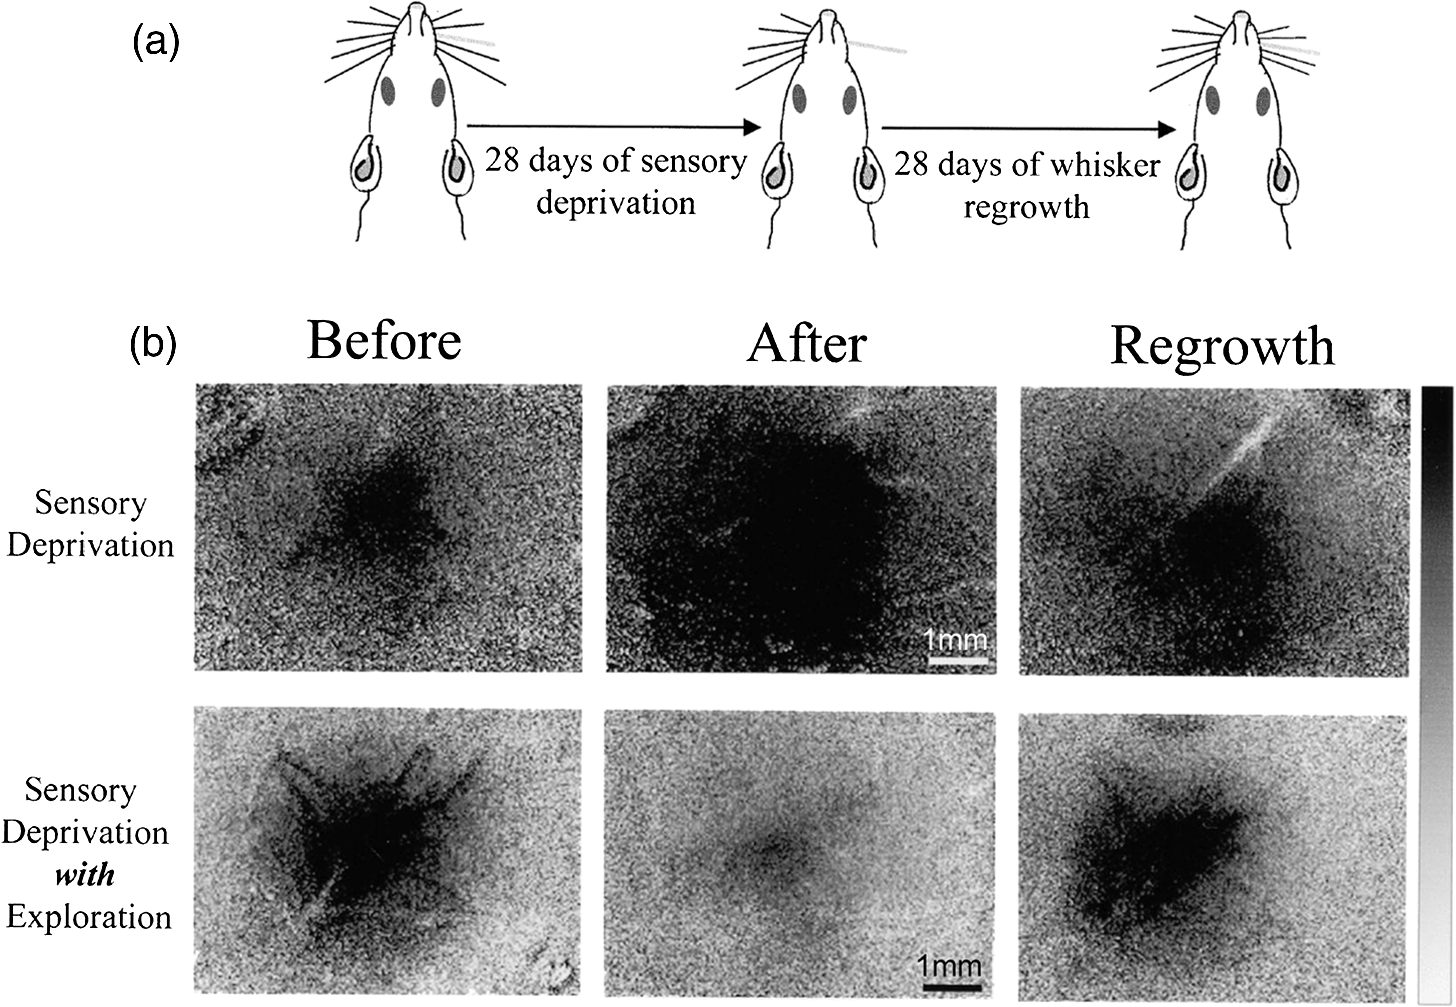 Additional supportive evidence regarding the behaviorally relevant dynamic nature of the whisker PS originated from the studies of the PMBSF in alert or behaving mice demonstrating that the areal extent and amplitude of a whisker PS were dependent on a wakefulness state and the behavioral context. Passive whisker stimulation during quiet wakefulness resulted in a larger, stronger PS during wakefulness as compared to the PS in the same mouse when anesthetized.50 Similarly, Mohajerani et al.52 replicated these findings and extended them by demonstrating that the large PS imaged in auditory cortex in response to pure tone during quiet awake state has stronger amplitude and lasts longer compared to the PS evoked by an identical stimulus in the same mouse when anesthetized. Furthermore, whisker PS became smaller and exhibited weaker amplitude during active whisking in the air, yet became large and strong again (similar to quiet wakefulness) following an active whisker touch.50 Recently, in the Petersen lab, VSDOI imaging was used to image the cortex of mice trained in a simple, goal directed learning task: to lick a water reward spout after a 1-ms deflection of a single whisker. Hit trials, in which the mouse licked after a whisker stimulus, were accompanied by a larger whisker PS compared to miss trials. Prestimulus whisking decreased behavioral performance by increasing the fraction of miss trials, and these miss trials had attenuated cortical responses, a strong example of behavioral modulation of the PS.59 5.Additional Findings Pointing to Possible Relevance of Point Spreads5.1.Point Spread as a Potential Structure–Function Neocortical MotifThe findings reviewed thus far collectively introduce the possibility that a large PS, whether it is functional or anatomical, may be a motif repeated across neocortical gray matter. For example, as reviewed in Sec. 4.1, large functional PSs have been observed for different species (rat, mouse, cat, monkey, ferret, guinea pig) and cortical areas of different sensory modalities (visual, somatosensory, auditory). As reviewed in Sec. 4.4, large anatomical PSs have also been described and quantified specifically for the rat somatosensory cortex, in particular, the PMBSF region of somatosensory cortex. Since then, the Frostig research team have pursued additional experiments to explicitly address whether large functional and anatomical PSs are observed across a myriad of cortical areas including even nonsensory regions. Both imaging and anatomical experiments were pursued for various sensory areas of the rat cortex. While employing the same technical (e.g., imaging data collection and data processing) and surgical (e.g., anesthesia) protocols as those applied for imaging whisker PSs [Fig. 2(a)], the Frostig research team imaged the functional PSs for various sensory cortical areas in order to address potential variability typically encountered when comparing results obtained from different labs. As seen in [Fig. 2(b)], point tactile stimulation to the skin at the knuckle forepaw area, point visual stimulation to the eye, and point (pure tone) stimulation to the auditory system all resulted in a PS that is similarly large as to the PS obtained in the rat PMBSF, characterized by one peak above the appropriate topographical map location and declining symmetrically over cortical distance. Therefore, experiments were also conducted to determine whether a large anatomical PS occurs for cortical areas other than the rat PMBSF that could explain the similarity of such imaged PSs. The anatomical PSs for various primary sensory cortical areas were mapped by the anterograde tract-tracer BDA.61 BDA was injected into the supragranular layers of the somatosensory, visual and auditory cortex. Similar to the imaged PSs obtained for these primary sensory areas [Fig. 2(b)], the anatomical PSs were also found to be large and were characterized by a progressive reduction of projections density with cortical distance away from peak density. Furthermore, the anatomical PSs for these other sensory areas shared other features with that for PMBSF: diffuse long-range projections spreading in all directions and spanning into other primary cortices; the spatial extent of PS projections into other unimodal cortices was dependent on the location of the injection site (i.e., the closer to the cytoarchitectonic border the deeper the axonal projections into other cortices); and axonal labeling in specific known targets were also detected presumably connected by white matter projections. When combined with the findings previously described earlier in the review, collectively these imaging and anatomical findings suggest that large functional and anatomical PSs may constitute a motif shared across the various sensory cortices in the rat. Furthermore, they suggest that beyond the traditional area-to-area projections to specific targets through white matter, there is a system of diffuse, long-range horizontal projections through gray matter that could directly connect primary cortices. In other words, the “two-system” schematic of projections [Figs. 6(a)–6c)] that was based on results obtained in the PMBSF could also be applicable for other sensory areas. The potential implications of these findings to cross-modal interactions and plasticity have been discussed in Ref. 61. Still, other experiments have been pursued to determine whether a large PS can be observed even for nonsensory cortical regions. Employing AAV virus vectors and the same qualitative and quantitative analyses as described above for the PMBSF, Johnson and Frostig71 have further demonstrated that injections in the supragranular layers of all known types of neocortical tissue including granular (trunk area of somatosensory cortex), dysgranular (several dysgranular areas surrounding PMBSF), and agranular cortex (motor cortex) reveal diffuse anatomical PSs that radiate horizontally through gray matter in all directions and trespass cytoarchitectonic borders into other areas surrounding them. Indeed, the quantified images of the anatomical PS mapping in all these cortical areas were quite similar to the ones obtained in the PMBSF. That the findings obtained for nonsensory cortical areas are similar to those obtained for SI, AI, and VI suggest that large PSs could constitute a unifying motif of organization for the entire neocortex. In other words, a possibility exists for every point in gray matter to be the source (and recipient) of the diffuse horizontal system in a distance-dependent fashion. The ubiquity of large PSs observed across different species from mice to monkeys and across different cortical areas from primary sensory to dysgranular and agranular cortex suggests the possibility that a large PS may be an evolutionary conserved general motif of the mammalian neocortex. Moreover, the fact that functional and anatomical PSs trespass borders strengthen the evidence described above that the neocortex can be viewed more of a continuum rather than a parceled entity as already suggested by Frostig et al.58 in their 2008 study. The ubiquitous presence of large PSs, which require precious metabolic resources for their development and especially their maintenance, begs the question: what is the relevance for a PS to be large? The next two subsections provide additional findings about PSs that point toward possible relevance for their existence. 5.2.Relative Spatiotemporal Invariance of a Point SpreadAs mentioned earlier in Sec. 1, the PS is composed of many thousands of neurons engaged in coordinated activity and thus, can be considered a classic case of Cajal’s “neuronal avalanche” ensemble. A follow-up study of the PS spatiotemporal characteristics provided the opportunity to discover emergent properties not readily attainable simply by studying cortical activity at the single neuron level. As already reviewed in an earlier section, for a given stimulus amplitude, the spatial extent of the PS was similar irrespective of where its peak location resided within a given sensory cortex, and thus, this characteristic of the PS could be thought of as being invariant with respect to its location in the cortex. Findings from the follow-up study suggest that another characteristic of the PS, namely its relative spatiotemporal profile in millisecond resolution, can also be invariant to stimulation magnitude. Following ISOI of a whisker PS, a 32-microelectrode array (eight microelectrodes organized in a straight line in layer 1, eight in layers 2 to 3, eight in layer 4, and eight in layer 5) was employed to simultaneously record from all microelectrodes both suprathreshold and subthreshold neuronal activity within the PMBSF. Jacobs et al.72 characterized the spatiotemporal profile of a single whisker PS in response to a variety of stimulation amplitudes delivered at 5 Hz: four angular displacements ranging from 0.035 to 7.5 deg that differed in a logarithmic (base 6) scale ranging from barely perceptible to the eye (0.035 deg) up to moderate strength (7.5 deg). The acquired data were analyzed based on 1-ms frames of spatiotemporal movies obtained from each microelectrode. Detailed spatiotemporal movies of evoked cortical activity were obtained for each of the stimulation amplitudes. These movies of subthreshold activity (LFP) and suprathreshold activity (multiunit potentials) recorded from the same microelectrodes clearly demonstrated that the PS exhibits a stronger evoked amplitude and larger spatial extent when a stronger stimulation amplitude is delivered, which is congruent with results of previous studies that also employed various amplitudes of sensory stimulation, as previously reviewed in Sec. 4.1. However, when these spatiotemporal movies were normalized to the largest amplitude of evoked response per stimulus strength, the normalized movies demonstrated that the spatiotemporal characteristics of the PS are the same irrespective of stimulation amplitude, despite the major difference between stimulation amplitudes ( fold difference between the weakest and strongest stimulation amplitude). Figure 8 shows an example of the raw and normalized LFP spatiotemporal movies created for all stimuli strengths for the first deflection of the whisker. Similar results were obtained for consecutive deflections of the 5-Hz stimulation for both LFP and multiunit potentials. In other words, while the absolute spatiotemporal profile of a PS can depend on stimulation amplitude, its relative profile was invariant to major changes in stimulus strength. These findings suggest that the relative spatiotemporal profile can be added alongside the spatial extent size as being another characteristic of the PS that emerges at the ensemble level as being invariant. Such findings may be of interest to those studying underlying physiological mechanisms of sensory coding for perceptual invariance. Fig. 8Invariance of the relative spatiotemporal response profile of a whisker PS. (a) microelectrode arrays were used to record LFP responses evoked by a single whisker (five deflections delivered at 5 Hz) across a mesoscopic section of SI extending beyond the boundaries of barrel cortex and penetrating through most cortical layers in six rats (left and middle panels). A color scale can be applied to the LFP response magnitudes collected from the electrode arrays as a means to provide “snapshots” of mesoscopic activity at a given time point (example provided in right panel). (b) 1-ms frame movies of LFP responses evoked by the first deflection of a single whisker for four stimulus amplitudes (0.035, 0.2, 1.25, and 7.5 deg). Note the laminar and lateral spread of LFP response across time as evoked by a single whisker, and that the amplitude of response is dependent on stimulation amplitude. (c) The relative spatial profile of evoked LFP spread for each stimulus amplitude can be obtained by normalizing each movie to its own maximum value across all pixels and time points. Note that after normalization, the relative spatiotemporal profile is similar across all stimulus amplitudes. From Ref. 72. 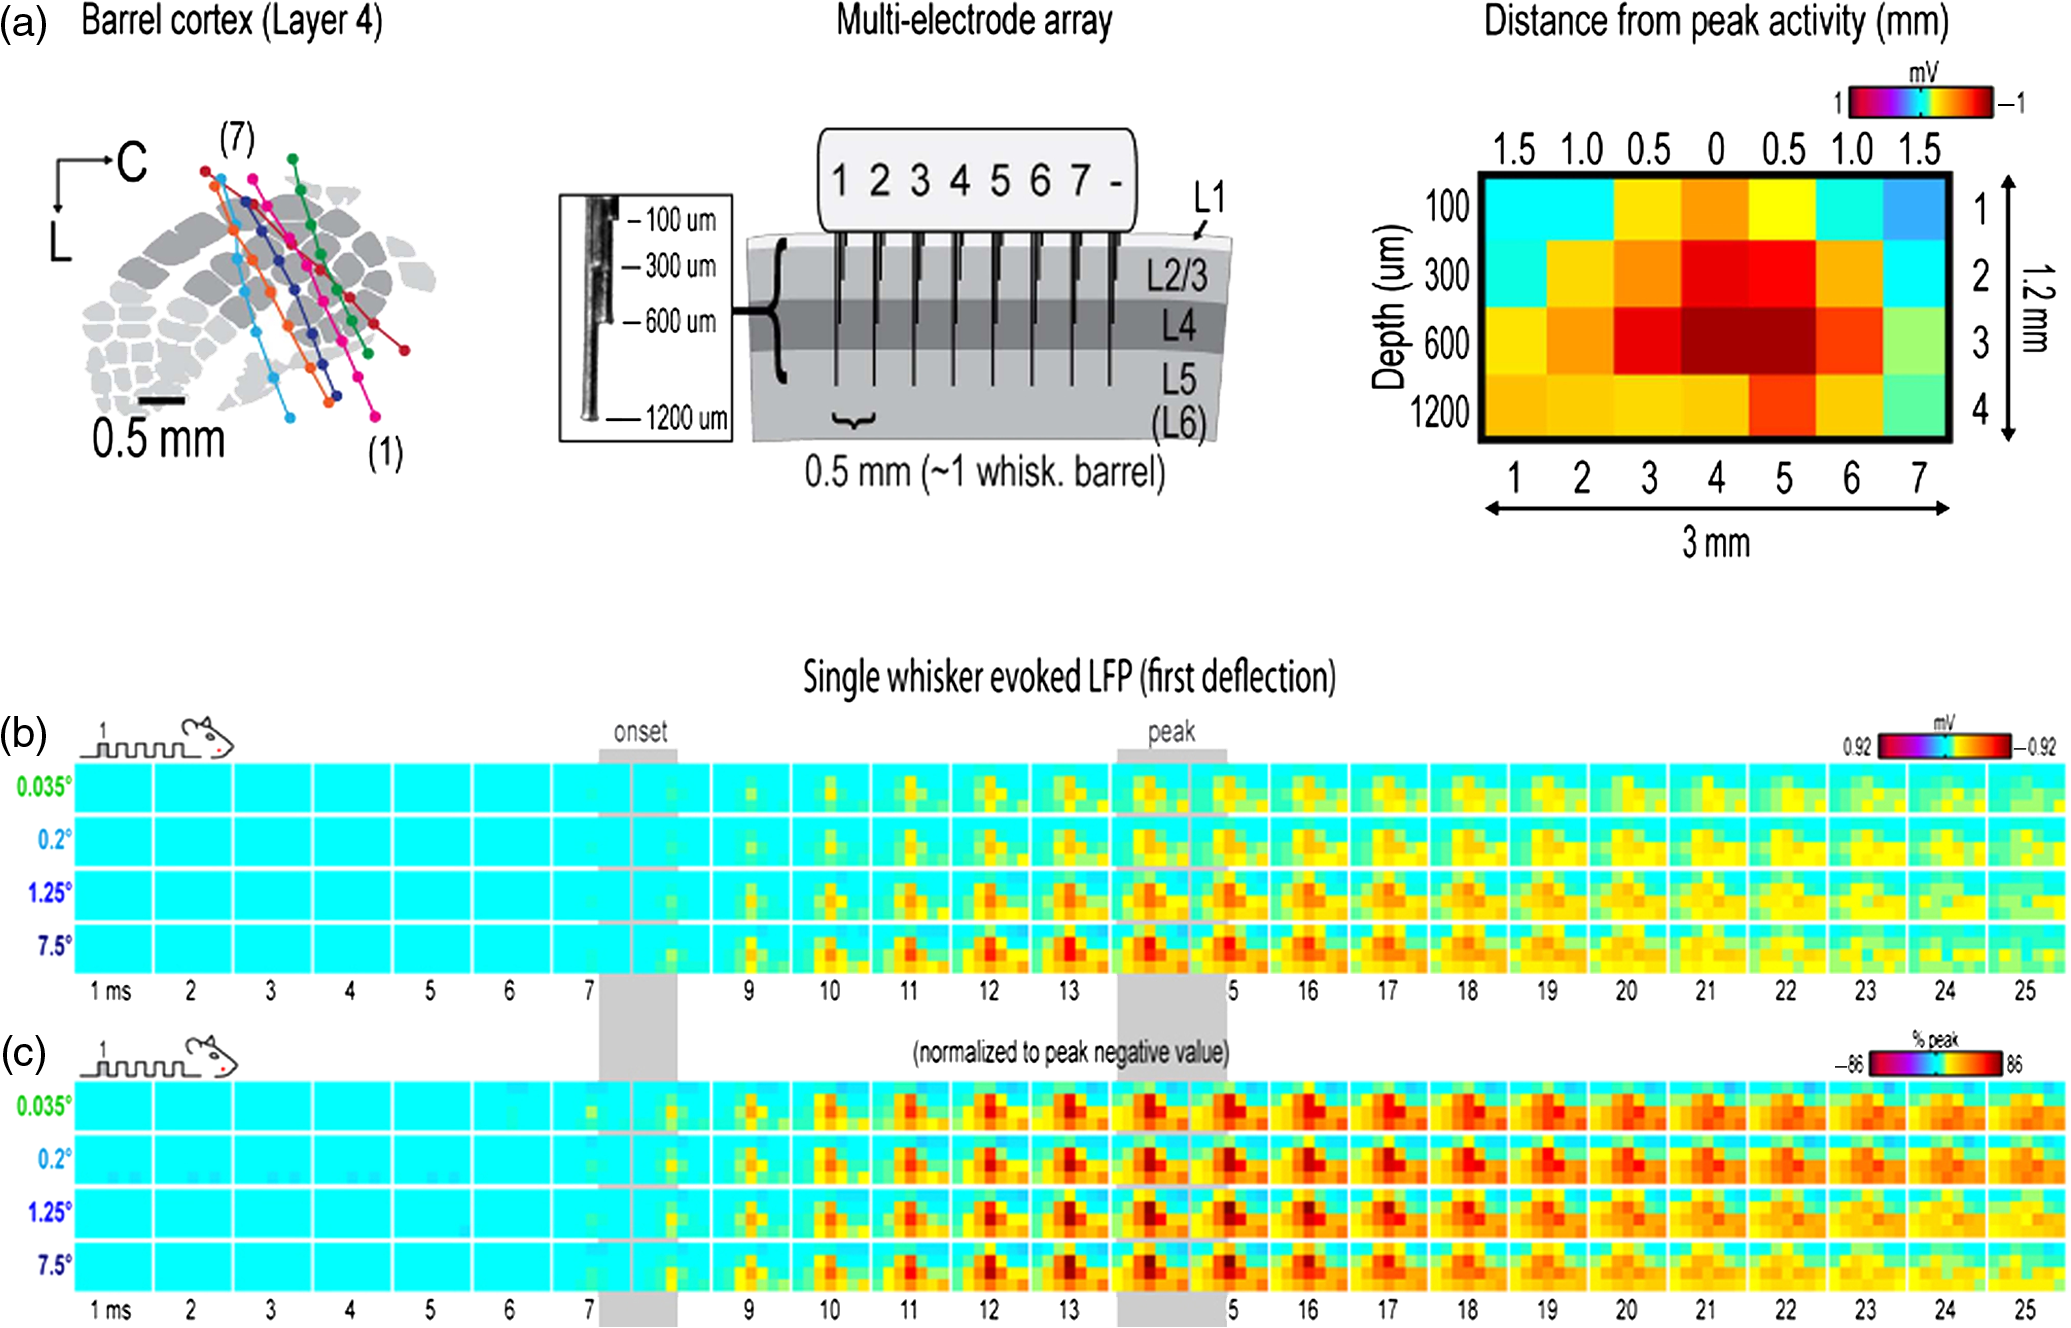 5.3.Point Spread could Serve as a Building Block for Integrated Cortical ActivationWhile a whisker PS is quite useful as an animal model for cortical function, the stimulation of a single whisker is a rather artificial situation when compared to what actually happens in an awake, behaving rodent. The study of simultaneously stimulating the entire whisker array on the snout is important because it represents a more naturalistic type of stimulation that would be actually encountered by the rat. Due to their large spatial spread, neighboring whisker PSs highly overlap with each other, which begs the question: what would be the integrated cortical response when multiple PSs are simultaneously activated? To address this question, a study was conducted that employed ISOI and microelectrode array recordings, along with modeling and pharmacological manipulations, to characterize the cortical activity spread in response to multiwhisker stimulation.66 To formulate predictions, the PS for whisker C2 as averaged across 37 rats was obtained [Fig. 6(d)] and used as a template for any whisker PS, justified by our previously described findings that PSs of different whiskers are similar.23 A model of the possible cortical response to multiwhisker stimulation (i.e., simultaneous activation of multiple PSs) was generated simply by linearly summating all individual PSs associated with the stimulated whiskers. Specifically, a copy of the PS template was used for each stimulated whisker such that its peak activity coregistered with the location of that whisker’s barrel within PMBSF, and then all appropriately aligned PSs were spatially summated. The generated model for all 24 large facial whiskers on the snout is illustrated in [Fig. 9(a), left]. This model provided predictions about various aspects of the cortical response, such as the peak magnitude, peak location within the PMBSF, and overall 3-D shape of the response magnitude as it decayed away from the peak. Interestingly, despite the stimulation of many whiskers, the model predicted a single peak at the center of the activated area, as opposed to 24 local peaks as possibly could be expected based on the one-to-one principle of organization for the whisker-to-barrel system. Furthermore, the model predicted that the response magnitude would decay relatively symmetrically in all directions away from the peak activity (in a fashion reminiscent of a single whisker PS) as though the activity collectively evoked by stimulating multiple whiskers was being funneled toward a single peak in its center (response to multiwhisker stimulation could also be referred to as a “funneled” response). In other words, the area of maximal overlap between the spatially summated PSs evolves into the peak of the funneled response, and at progressive distances away from the peak, the overlap among PSs decreases resulting in the weakening of the evoked amplitude with cortical distance away from the area with maximal overlap. To generalize this simulation result, a model was generated in a similar manner for a matrix, hence 4 whiskers, located on a corner of the snout [Fig. 9(a), right]. Again, the model predicted a single, funneled peak at the center of the evoked area that weakens relatively symmetrically in all directions away from peak activity, but it also predicted that the peak would shift to the appropriate location within the PBMSF—i.e., the location of peak evoked activity at the center of the barrels associated with the matrix of whiskers; except for the peak location, however, the four-whiskers model shared many features with the 24-whiskers model. Fig. 9Modeling versus in vivo (ISOI imaging and electrophysiological confirmation) results for stimulating all the large whiskers (left column) or the corner matrix of whiskers (right column) of the whisker array. (a) The predicted model of imaging cortical response to stimulating 24 or 4 whiskers. Modeling is based on using whisker C2 functional PS averaged across 37 rats as a building block [see Fig. 6(d) for a partial view of the building block when using a 3.5 mm radius from peak activity] by serving as a representative PS for any individual whisker and performing linear spatial summation of the PSs associated with all the individual whiskers intended for stimulation. Provided here are the 2-D (insets; ; imaging data superimposed on barrels map; rostral toward the right; lateral toward the bottom) and 3-D images of the predicted response for the same cortical area to stimulating either all 24 (left panel) or 4 (right panel; corner whiskers D3, D4, E3, and E4) large whiskers. The same color scale is applied to both the 2-D and 3-D images. Note the differences in the overall size, shape, and location of the predicted response to stimulating 24 (left panel) versus 4 (right panel) whiskers when compared to each other as well as to single whisker C2 [see Figs. 2(b) and 6(d)]. In particular, the modeling predicts that the cortical response to stimulating all 24 whiskers is spatially larger compared to a single whisker PS and has a single activity peak that is centrally located within the barrels map, while the cortical response to stimulating corner whiskers D3, D4, E3, and E4 is predicted to exhibit a spatial extent larger than for a single whisker PS, but smaller than for 24 whiskers, and with a single peak whose location has shifted in the anterior direction away from the center of the barrels map to the center of the activation. (b) The in vivo imaging data averaged across rats. Note the similarity of the in vivo data compared to the predicted models. (c) The rostrocaudal line plot for the model versus in vivo cortical response. Magenta shading indicates SE. Note the ability of the model to predict many aspects of the cortical response obtained in vivo, including the overall shape of the activity spread, the single peak of activity, and the location of peak activity (center of -axis co-registers with center of barrel map). The models explain 80% and 79% of the in vivo variability for the 24 and 4 whiskers cases, respectively. (d) LFP electrophysiology confirmation using an eight-electrode array arranged in a straight line within supragranular layers, with the third electrode located centrally within the barrels map. Average response to stimulating either 24 or 4 whiskers (magenta) is compared to the average response to stimulating whisker C2 (black) within the same rats. 0 mm on -axis co-registers with center of barrel map. (e) Same as for (d) except for multiunit recordings from the same electrodes within the same rats. From Ref. 66. 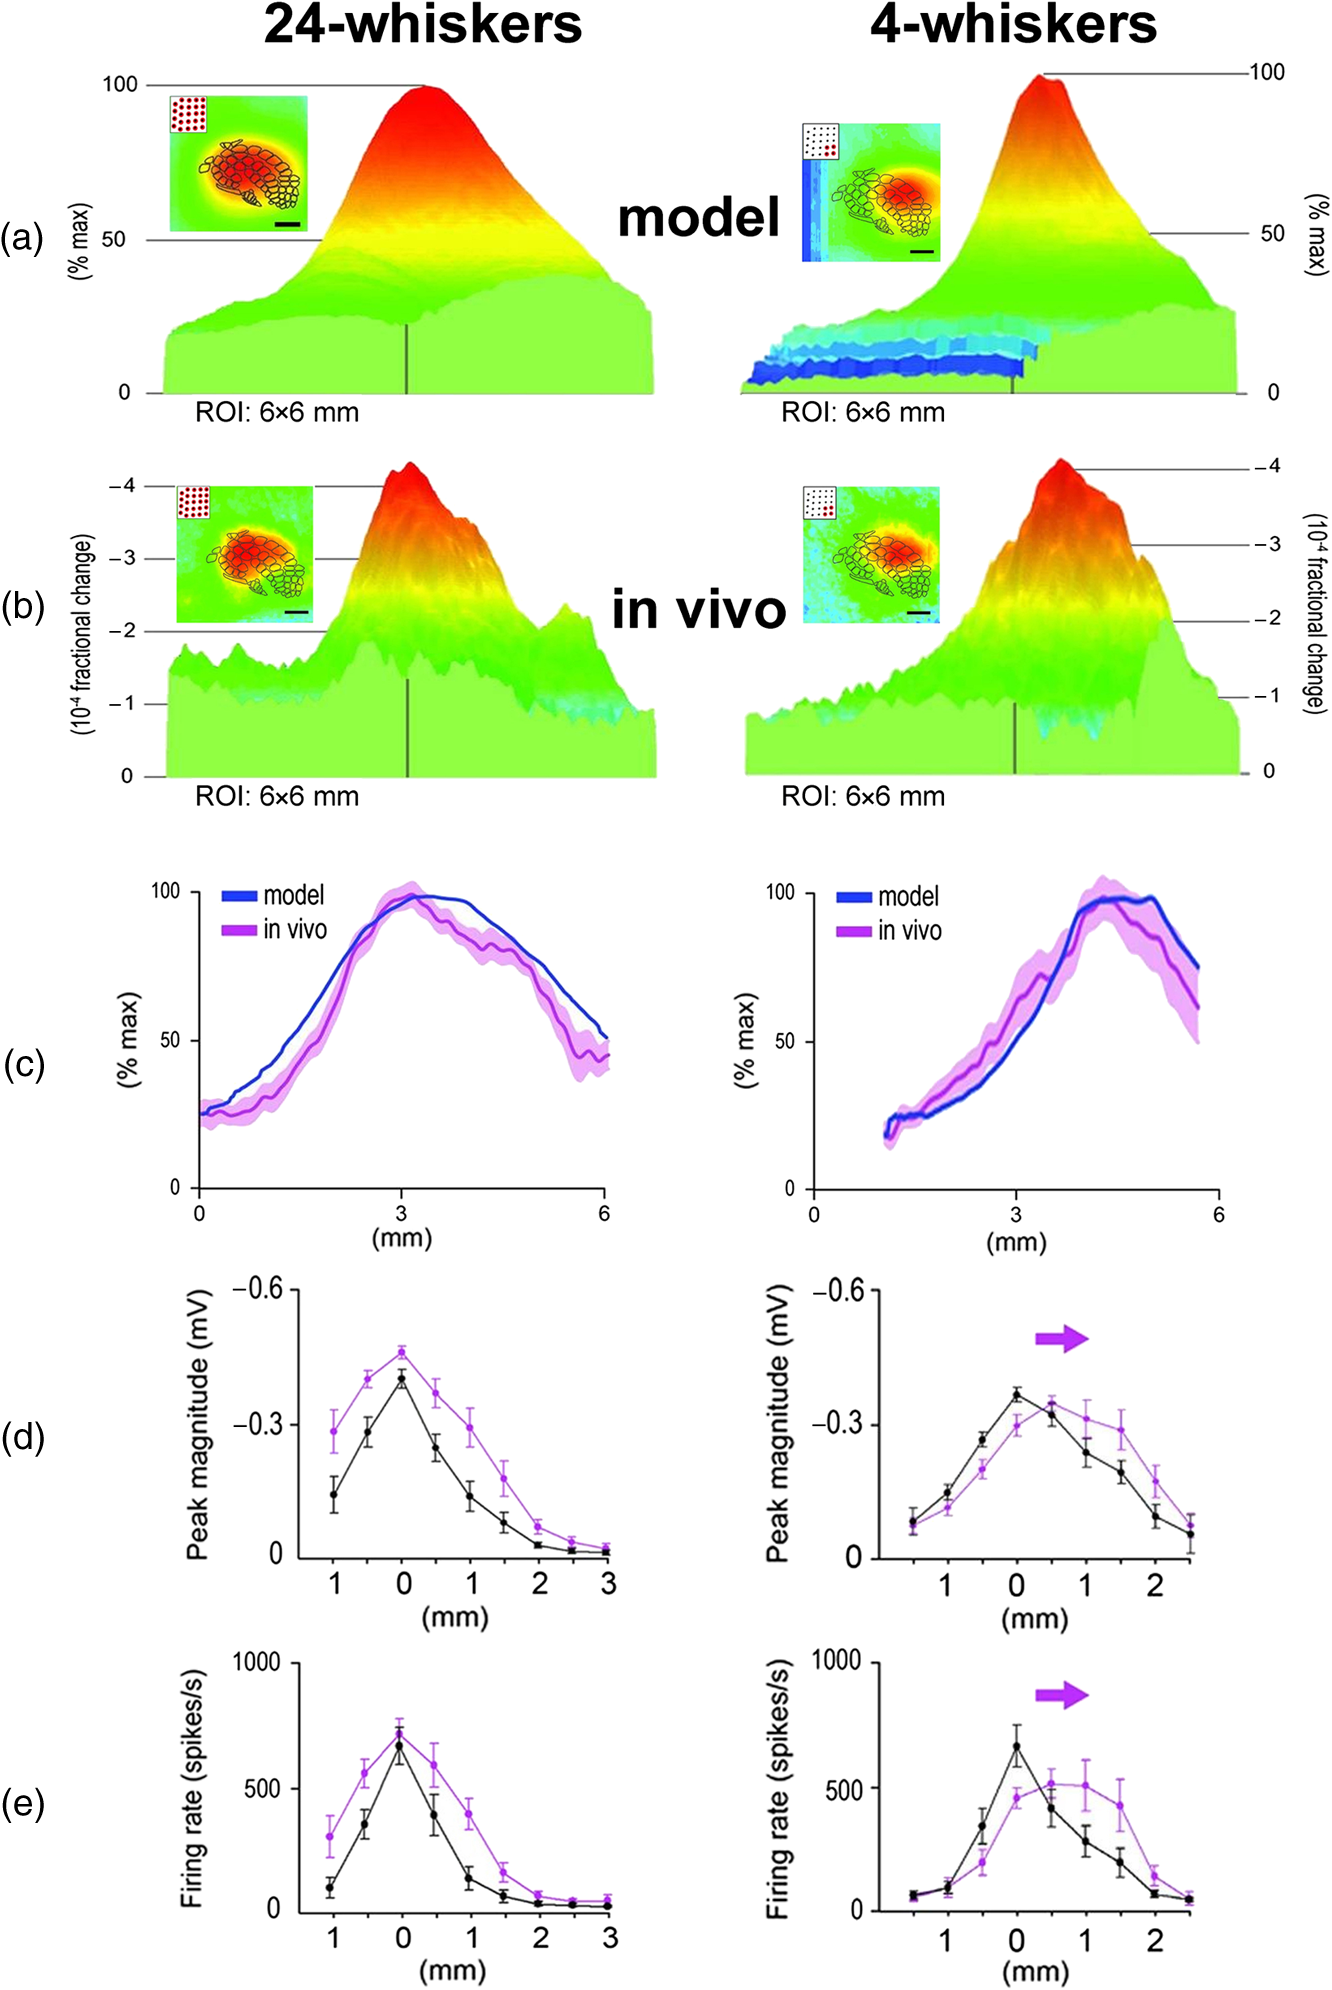 Comparison between the simulation results and the functional imaging (ISOI) results obtained in vivo while simultaneously stimulating multiple whiskers is summarized in Figs. 9(a)–9(c), along with neuronal recordings (multiunits and LFP) confirmation [Figs. 9(d) and 9(e)]. The models succeeded in predicting many aspects of the obtained in vivo funneled responses, including a single peak, the location of that peak within the PMBSF, and the decay in magnitude as the response radiated away from the peak activity. Interestingly, the model grossly overestimated the peak amplitude of the experimental data [Figs. 7(e) and 7(f) in Ref. 66], suggesting that some form of mutual cortical activity attenuation occurs when simultaneously stimulating multiple whiskers. Collectively, these findings suggest that a PS-based rule (specifically, the linear spatial summation of individual PSs that are topographically aligned) can be used to model various aspects of the cortical response to simultaneous stimulation of multiple whiskers. Results from additional experiments [Figs. (10) and (11)] further extended these findings. When the temporary sodium channel blocker lidocaine was locally injected into one side of the funneled response evoked by stimulating 24 whiskers [Fig. 10(a)], rather than simply silencing the portion of the funneled response receiving the lidocaine [Fig. 10(b)], the resultant response appeared as a new funneled response with its peak shifted away from the site of lidocaine injection [Figs. 10(c)–10(e)]. This result reconfirmed the observation that the evoked funneled peak response of multiwhisker stimulation is always found toward the center of the response area. In addition, the result suggested that such a change in peak location originates within the cortex [Fig. 10(c)], because if the single funneled peak location of multiwhisker activation was only dependent on thalamocortical input, then it would not relocate following the lidocaine injection [Fig. 10(b)]. A different set of experiments was conducted to determine whether results could be replicated for a cortical area other than somatosensory cortex. As illustrated in Fig. 11, modeling based on the spatial summation of individual PSs can also be used to predict various features of the response in visual cortex to simultaneous stimulation of two visual point stimuli. Last, in the previous section, it was already mentioned that using subthreshold (LFPs) and suprathreshold (multiunit potential) neuronal recordings, Jacobs et al.72 found the relative spatiotemporal profile of a single whisker PS to be invariant to major changes in whisker stimulation amplitude. The PS-based modeling of the cortical response to multiwhisker stimulation, where each whisker’s relative spatiotemporal profile is invariant to stimulus amplitude, would predict that the relative spatiotemporal profile of the funneled response evoked by multiwhisker stimulation should also be invariant to stimulus strength. Indeed, Jacobs et al.72 obtained subthreshold and suprathreshold neuronal recordings results evoked by multiwhisker stimulation that were found to be relatively invariant to stimulation amplitude. These findings further support the suggestion that a single whisker PS is potentially a building block of integrated activity following multipoint stimulations. Fig. 10Cortical response evoked by the 24-whiskers array can be predicted by modeling using single whisker PSs as building blocks for activity interactions occurring at the cortical level. (a) Eight electrodes spaced 0.5-mm apart recorded the funneled response for 24 whiskers (middle electrodes aimed at the funneled peak activity location) before and after a local lidocaine injection (green) deposited distal (1.5 mm) to the middle electrodes, at 300- to cortical depth. (b) If subcortical activity interactions were the sole contributors to the funneled response, then no shifting in the funneled peak activity location would be expected to occur outside the lidocaine site. (c) If activity interactions occurring at the cortical level (double-headed arrows) contributed to the funneled response, then the local silencing of cortical activity should lead to a new spatial overlap of the remaining unsilenced single whisker PSs that in turn should lead to a shift in the funneled peak location away from the lidocaine site and toward the center of the new activated area. Results from (d) sub- and (e) suprathreshold neuronal recordings initiated before versus a few minutes after a targeted lidocaine injection are congruent with predictions of panel (c). Recordings initiated 1 h after the lidocaine injection revealed a recovery of response almost to preinjection levels (insets). From Ref. 66.  Fig. 11Separate and simultaneous activation of two functional PSs at different locations in rat visual cortex as imaged with ISOI; model and experimental results. Labeling in left column applies to remaining columns. Rostral is toward the left and lateral is toward the bottom for all panels in top two rows. In the same animal, ISOI was used to image the cortical response evoked by two visual point stimulations, whether delivered individually (50 deg ; 80 deg ; both at elevation of ) or simultaneously (third column). The fourth column provides the predicted model based on linear spatial summation of the individual PSs as seen in columns 1 and 2. Upper row: 2-D maps scaled in fractional change units. Middle row: topographical map displaying isoactivity lines. Bottom row: 3-D images scaled in fractional change units. From Chen-Bee and Frostig, unpublished data. 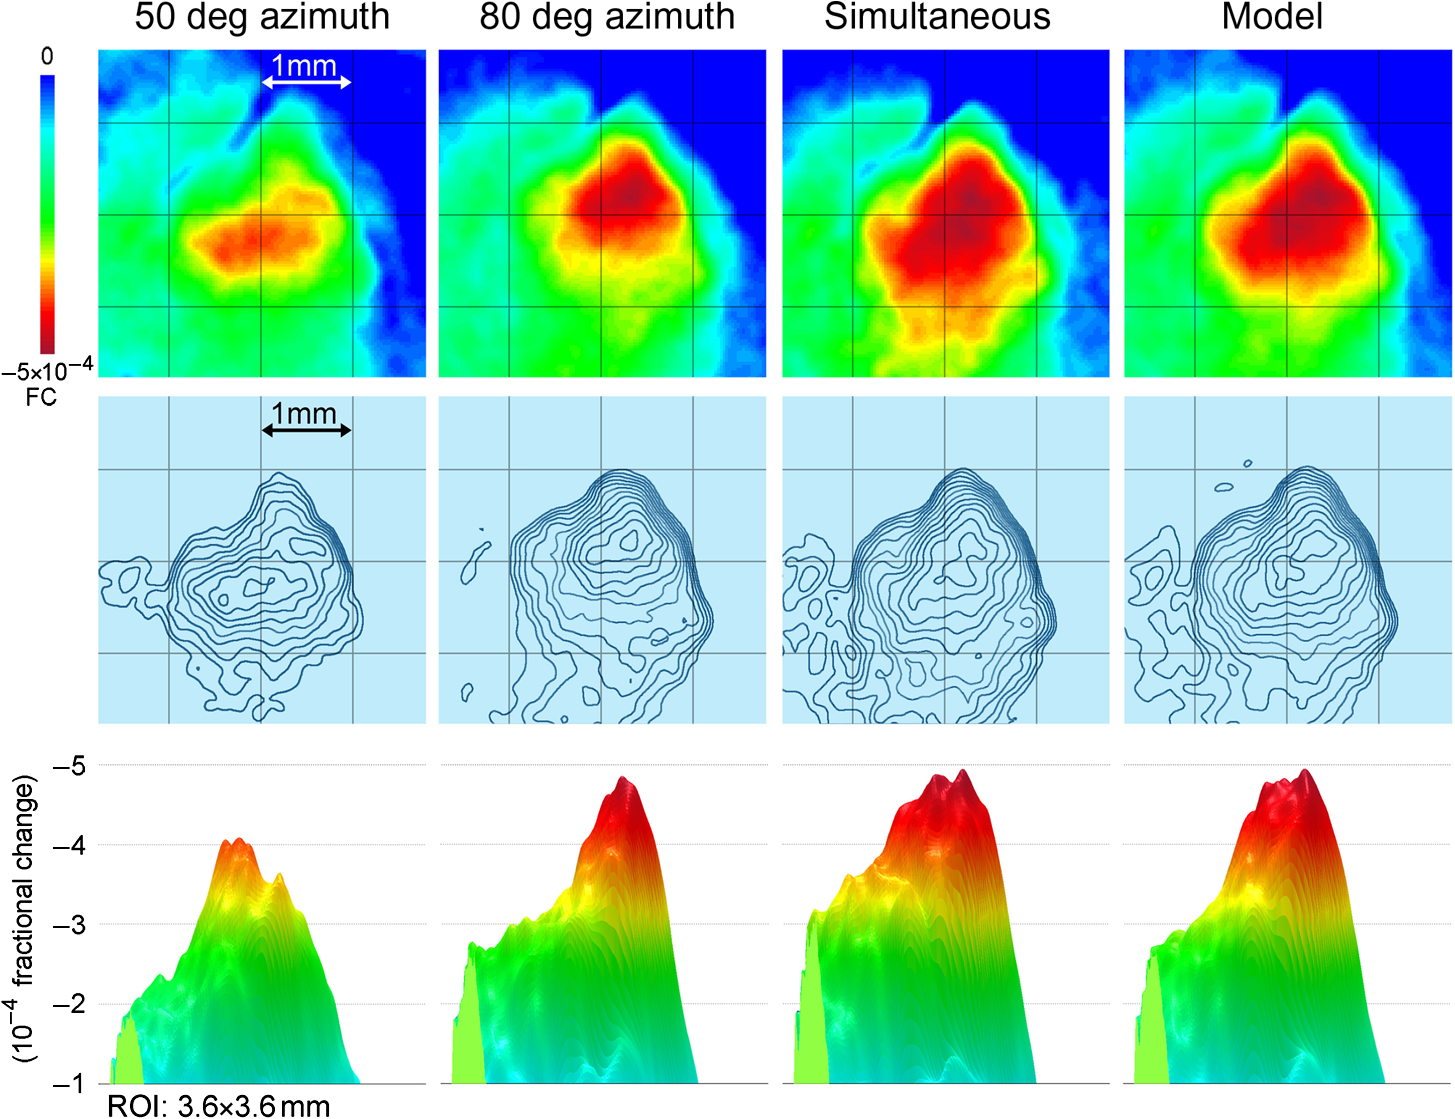 Taken together, the results (Figs. 8–11) collectively suggest that PSs can be used as a building block for the cortical response to simultaneous multipoint stimulation. Further research is needed to test the robustness of such PS-based modeling for other combinations of multipoint stimulation as well as across various cortical areas and mammalian species. If PS-based integration, based on our modeling, is found to be robust, it would be interesting to see whether it may be useful for addressing questions related to integrative evoked cortical activity patterns associated with perception and cognition. 6.SummaryThe development of wide-field optical imaging techniques opened a new research avenue that enabled, for the first time, high-resolution research into the spatiotemporal functional organization of the neocortex at the mesoscopic level. One target of such studies has been the cortical response to point stimulation. Optical imaging findings of the cortical PS combined with electrophysiological and anatomical PS findings suggest that the anatomical and functional organization of the sensory cortex at the mesoscopic level shares common themes. By investigating various sensory cortical areas across different mammalian species, optical imaging studies revealed that functional PSs exhibit common preserved features, such as one activity peak at the topographically appropriate location within the cortex, progressive decay of activity in all directions away from the peak activity, and the spatial extent size being similarly large irrespective of whether the activity peak resides toward the center or border of its associated sensory cortical area. Preserving these PS characteristics led to an unexpected finding that functional PSs could cross cytoarchitectural borders between cortical areas and even trespass into other unimodal cortical territories. Detailed postimaging electrophysiological studies verified these imaged PS characteristics and further implicated the evoked subthreshold activity as underlying the large spread of the imaged PS. Detailed mappings of the anatomical PS demonstrated that a diffuse system of long-range horizontal projections within the cortical gray matter exhibit many of the same spatial features as the functional PS spread, and combined with pharmacological and anatomical manipulations, have implicated this long-range diffuse system as the underlying system supporting the functional PS spread, suggesting a spatial match between structure and function at the mesoscopic scale. PSs are dynamic, capable of modifying its amplitude and spatial extent size depending on point stimulation parameters, simultaneous activation of neighboring PSs, different states of behavior, experience-dependent changes in peripheral use, and involvement in a learning task. Still, an interesting characteristic of PSs is that its relative spatiotemporal profile is invariant to major changes in stimulus amplitude, which may have implications for those researching neuronal correlates of perceptual invariance. Another interesting facet of PSs is the ability to use them as a building block for modeling the findings of integrated cortical response to simultaneous delivery of multiple point stimulations in the somatosensory and visual cortex, which may have implications for understanding cortical activity integration. Together, these findings would suggest a view of the cortex from the perspective of it being more of a continuous entity as opposed to it being exclusively a parceled modular entity with strict borders surrounding well-defined regions. In addition, the ubiquity of functional PSs ranging from mice to monkeys further suggests that the PS is a fundamental structure–function motif that is evolutionarily conserved. It is hoped that the current review will encourage more scientific interest in further investigating functional and anatomical PSs. To that end, new wide-field mesoscopic imaging techniques are currently available that offer new ways for imaging the PS. Although still limited only to genetically engineered mice, imaging combined with techniques, such as voltage-sensitive fluorescent proteins6 and application of improved calcium indicators73,74 [for a recent review see Ref. 75], could be employed to further the pursuit of PS-related questions and thereby expand our understanding of the neocortex at the mesoscopic ensemble level—a level of research that has been relatively sparse over the years. If so, Santiago Ramon y Cajal’s “law of avalanche” would finally start to attract the attention it deserves. AcknowledgmentsThe authors would like to thank previous and current collaborators Susan Masino, Michael Kwon, Jonathan Bakin, Yehuda Dory, Neal Prakash, Daniel Polley, Barbara Brett-Green, Silke Penschuck, Eugene Kvasnak, Jimmy Stehberg, Ying Xiong, Christopher Lay, Melissa Davis, Aneeka Hancock, Yi Zhou, and Ellen Wann for their participation in various aspects of the research that led to this review. Supported by NIH grants NINDS NS-34519, NINDS NS-39760, NINDS NS-43165, NINDS NS-48350, NINDS NS-055832, NINDS NS-066001, and NSF IBN-9507936. This review is dedicated to Professor Amiram Grinvald. R.D.F. would like to thank Professor Grinvald for introducing him to the point-spread concept and its research, and for introducing him to the barrel cortex with his memorable dictum: “whenever I want to understand cortical function, I study the barrel cortex.” ReferencesJ. T. McIlwain,
“Point images in the visual system: new interest in an old idea,”
Trend Neurosci., 9 354
–358
(1986). http://dx.doi.org/10.1016/0166-2236(86)90113-X Google Scholar
D. Sharon et al.,
“Cortical response field dynamics in cat visual cortex,”
Cereb. Cortex, 17
(12), 2866
–2877
(2007). http://dx.doi.org/10.1093/cercor/bhm019 Google Scholar
S. Ramon y Cajal, Recollections of My Life, American Philosophical Society, Philadelphia
(1937). Google Scholar
L. Spillmann, B. Dresp-Langley and C. H. Tseng,
“Beyond the classical receptive field: the effect of contextual stimuli,”
J. Vision, 15
(9), 7
(2015). http://dx.doi.org/10.1167/15.9.7 1534-7362 Google Scholar
A. Grinvald et al.,
“Voltage-sensitive dye imaging of neocortical activity,”
Cold Spring Harbor Protoc., 2016
(1), 13
–28
(2016). http://dx.doi.org/10.1101/pdb.top089367 Google Scholar
S. D. Antic, R. M. Empson and T. Knopfel,
“Voltage imaging to understand connections and functions of neuronal circuits,”
J. Neurophysiol., 116
(1), 135
–152
(2016). http://dx.doi.org/10.1152/jn.00226.2016 JONEA4 0022-3077 Google Scholar
R. D. Frostig, C. H. Chen-Bee,
“The use of intrinsic signal optical imaging for mapping cortical function,”
Handbook of Neuronal Activity Measurements, Cambridge University Press, Cambridge, United Kingdom
(2012). Google Scholar
A. Grinvald et al.,
“Imaging the neocortex functional architecture using multiple intrinsic signals: implications for hemodynamic-based functional imaging,”
Cold Spring Harbor Protoc., 2016
(3), 238
–250
(2016). http://dx.doi.org/10.1101/pdb.top089375 Google Scholar
H. D. Lu et al.,
“Intrinsic signal optical imaging of visual brain activity: tracking of fast cortical dynamics,”
Neuroimage, 148 160
–168
(2017). http://dx.doi.org/10.1016/j.neuroimage.2017.01.006 NEIMEF 1053-8119 Google Scholar
C. H. Chen-Bee et al.,
“The triphasic intrinsic signal: implications for functional imaging,”
J. Neurosci., 27
(17), 4572
–4586
(2007). http://dx.doi.org/10.1523/JNEUROSCI.0326-07.2007 Google Scholar
Y. B. Sirotin et al.,
“Spatiotemporal precision and hemodynamic mechanism of optical point spreads in alert primates,”
Proc. Natl. Acad. Sci. U. S. A., 106
(43), 18390
–18395
(2009). http://dx.doi.org/10.1073/pnas.0905509106 Google Scholar
C. Welker,
“Microelectrode delineation of fine grain somatotopic organization of (SmI) cerebral neocortex in albino rat,”
Brain Res., 26
(2), 259
–275
(1971). http://dx.doi.org/10.1016/S0006-8993(71)80004-5 BRREAP 0006-8993 Google Scholar
H. S. Orbach, L. B. Cohen and A. Grinvald,
“Optical mapping of electrical activity in rat somatosensory and visual cortex,”
J. Neurosci., 5
(7), 1886
–1895
(1985). JNRSDS 0270-6474 Google Scholar
A. Grinvald et al.,
“Functional architecture of cortex revealed by optical imaging of intrinsic signals,”
Nature, 324
(6095), 361
–364
(1986). http://dx.doi.org/10.1038/324361a0 Google Scholar
J. A. London, L. B. Cohen and J. Y. Wu,
“Optical recordings of the cortical response to whisker stimulation before and after the addition of an epileptogenic agent,”
J. Neurosci., 9
(6), 2182
–2190
(1989). JNRSDS 0270-6474 Google Scholar
K. Fox, Barrel Cortex, Cambridge University Press, Cambridge
(2008). Google Scholar
I. Taniguchi et al.,
“Spatio-temporal pattern of frequency representation in the auditory cortex of guinea pigs,”
Neurosci. Lett., 146
(1), 37
–40
(1992). http://dx.doi.org/10.1016/0304-3940(92)90166-5 NELED5 0304-3940 Google Scholar
A. Grinvald et al.,
“Cortical point-spread function and long-range lateral interactions revealed by real-time optical imaging of macaque monkey primary visual cortex,”
J. Neurosci., 14
(5 Pt 1), 2545
–2568
(1994). Google Scholar
C. H. Chen-Bee et al.,
“Intrinsic signal optical imaging of brain function using short stimulus delivery intervals,”
J. Neurosci. Methods, 187
(2), 171
–182
(2010). http://dx.doi.org/10.1016/j.jneumeth.2010.01.009 JNMEDT 0165-0270 Google Scholar
I. Ferezou et al.,
“Spatiotemporal dynamics of cortical sensorimotor integration in behaving mice,”
Neuron, 56
(5), 907
–923
(2007). http://dx.doi.org/10.1016/j.neuron.2007.10.007 NERNET 0896-6273 Google Scholar
S. A. Masino et al.,
“Characterization of functional organization within rat barrel cortex using intrinsic signal optical imaging through a thinned skull,”
Proc. Natl. Acad. Sci. U. S. A., 90
(21), 9998
–10002
(1993). http://dx.doi.org/10.1073/pnas.90.21.9998 Google Scholar
C. H. Chen-Bee and R. D. Frostig,
“Variability and interhemispheric asymmetry of single-whisker functional representations in rat barrel cortex,”
J. Neurophysiol., 76
(2), 884
–894
(1996). JONEA4 0022-3077 Google Scholar
B. A. Brett-Green, C. H. Chen-Bee and R. D. Frostig,
“Comparing the functional representations of central and border whiskers in rat primary somatosensory cortex,”
J. Neurosci., 21
(24), 9944
–9954
(2001). Google Scholar
S. A. Masino and R. D. Frostig,
“Quantitative long-term imaging of the functional representation of a whisker in rat barrel cortex,”
Proc. Natl. Acad. Sci. U. S. A., 93
(10), 4942
–4947
(1996). http://dx.doi.org/10.1073/pnas.93.10.4942 Google Scholar
C. H. Chen-Bee et al.,
“Visualizing and quantifying evoked cortical activity assessed with intrinsic signal imaging,”
J. Neurosci. Methods, 97
(2), 157
–173
(2000). http://dx.doi.org/10.1016/S0165-0270(00)00180-1 JNMEDT 0165-0270 Google Scholar
S. Penschuck et al.,
“In vivo modulation of a cortical functional sensory representation shortly after topical cholinergic agent application,”
J. Comp. Neurol., 452
(1), 38
–50
(2002). http://dx.doi.org/10.1002/(ISSN)1096-9861 Google Scholar
D. B. Polley, E. Kvasnak and R. D. Frostig,
“Naturalistic experience transforms sensory maps in the adult cortex of caged animals,”
Nature, 429
(6987), 67
–71
(2004). http://dx.doi.org/10.1038/nature02469 Google Scholar
N. Prakash et al.,
“Malformation of the functional organization of somatosensory cortex in adult ephrin-A5 knock-out mice revealed by in vivo functional imaging,”
J. Neurosci., 20
(15), 5841
–5847
(2000). Google Scholar
A. Das and C. D. Gilbert,
“Long-range horizontal connections and their role in cortical reorganization revealed by optical recording of cat primary visual cortex [see comments],”
Nature, 375
(6534), 780
–784
(1995). http://dx.doi.org/10.1038/375780a0 Google Scholar
J. S. Bakin et al.,
“Suprathreshold auditory cortex activation visualized by intrinsic signal optical imaging,”
Cereb. Cortex, 6
(2), 120
–130
(1996). http://dx.doi.org/10.1093/cercor/6.2.120 Google Scholar
V. Tsytsarev and S. Tanaka,
“Intrinsic optical signals from rat primary auditory cortex in response to sound stimuli presented to contralateral, ipsilateral and bilateral ears,”
Neuroreport, 13
(13), 1661
–1666
(2002). http://dx.doi.org/10.1097/00001756-200209160-00019 NERPEZ 0959-4965 Google Scholar
H. Versnel et al.,
“Optical imaging of intrinsic signals in ferret auditory cortex: responses to narrowband sound stimuli,”
J. Neurophysiol., 88
(3), 1545
–1558
(2002). JONEA4 0022-3077 Google Scholar
V. Tsytsarev et al.,
“Sound frequency representation in cat auditory cortex,”
Neuroimage, 23
(4), 1246
–1255
(2004). http://dx.doi.org/10.1016/j.neuroimage.2004.08.021 NEIMEF 1053-8119 Google Scholar
B. J. Farley and A. J. Norena,
“Membrane potential dynamics of populations of cortical neurons during auditory streaming,”
J. Neurophysiol., 114
(4), 2418
–2430
(2015). http://dx.doi.org/10.1152/jn.00545.2015 JONEA4 0022-3077 Google Scholar
C. C. Petersen, A. Grinvald and B. Sakmann,
“Spatiotemporal dynamics of sensory responses in layer 2/3 of rat barrel cortex measured in vivo by voltage-sensitive dye imaging combined with whole-cell voltage recordings and neuron reconstructions,”
J. Neurosci., 23
(4), 1298
–1309
(2003). Google Scholar
G. E. Carvell and D. J. Simons,
“Biometric analyses of vibrissal tactile discrimination in the rat,”
J. Neurosci., 10
(8), 2638
–2648
(1990). Google Scholar
T. Berger et al.,
“Combined voltage and calcium epifluorescence imaging in vitro and in vivo reveals subthreshold and suprathreshold dynamics of mouse barrel cortex,”
J. Neurophysiol., 97
(5), 3751
–3762
(2007). http://dx.doi.org/10.1152/jn.01178.2006 JONEA4 0022-3077 Google Scholar
T. Deneux and A. Grinvald,
“Milliseconds of sensory input abruptly modulate the dynamics of cortical states for seconds,”
Cereb. Cortex, 1
–15
(2016). https://doi.org/10.1093/cercor/bhw259 Google Scholar
A. J. Blood, S. M. Narayan and A. W. Toga,
“Stimulus parameters influence characteristics of optical intrinsic signal responses in somatosensory cortex,”
J. Cereb. Blood Flow Metab., 15
(6), 1109
–1120
(1995). http://dx.doi.org/10.1038/jcbfm.1995.138 Google Scholar
M. Jones, J. Berwick and J. Mayhew,
“Changes in blood flow, oxygenation, and volume following extended stimulation of rodent barrel cortex,”
Neuroimage, 15
(3), 474
–487
(2002). http://dx.doi.org/10.1006/nimg.2001.1000 NEIMEF 1053-8119 Google Scholar
D. Derdikman et al.,
“Imaging spatiotemporal dynamics of surround inhibition in the barrels somatosensory cortex,”
J. Neurosci., 23
(8), 3100
–3105
(2003). Google Scholar
A. Devor et al.,
“Coupling of total hemoglobin concentration, oxygenation, and neural activity in rat somatosensory cortex,”
Neuron, 39
(2), 353
–359
(2003). http://dx.doi.org/10.1016/S0896-6273(03)00403-3 NERNET 0896-6273 Google Scholar
M. Nemoto et al.,
“Functional signal- and paradigm-dependent linear relationships between synaptic activity and hemodynamic responses in rat somatosensory cortex,”
J. Neurosci., 24
(15), 3850
–3861
(2004). http://dx.doi.org/10.1523/JNEUROSCI.4870-03.2004 Google Scholar
E. F. Civillico and D. Contreras,
“Integration of evoked responses in supragranular cortex studied with optical recordings in vivo,”
J. Neurophysiol., 96
(1), 336
–351
(2006). http://dx.doi.org/10.1152/jn.00128.2006 JONEA4 0022-3077 Google Scholar
E. F. Civillico and D. Contreras,
“Spatiotemporal properties of sensory responses in vivo are strongly dependent on network context,”
Front. Syst. Neurosci., 6 25
(2012). http://dx.doi.org/10.3389/fnsys.2012.00025 Google Scholar
M. T. Lippert et al.,
“Methods for voltage-sensitive dye imaging of rat cortical activity with high signal-to-noise ratio,”
J. Neurophysiol., 98
(1), 502
–512
(2007). http://dx.doi.org/10.1152/jn.01169.2006 JONEA4 0022-3077 Google Scholar
I. M. Devonshire et al.,
“Effects of urethane anaesthesia on sensory processing in the rat barrel cortex revealed by combined optical imaging and electrophysiology,”
Eur. J. Neurosci., 32
(5), 786
–797
(2010). http://dx.doi.org/10.1111/j.1460-9568.2010.07322.x Google Scholar
B. R. Lustig et al.,
“Voltage-sensitive dye imaging reveals shifting spatiotemporal spread of whisker-induced activity in rat barrel cortex,”
J. Neurophysiol., 109
(9), 2382
–2392
(2013). http://dx.doi.org/10.1152/jn.00430.2012 JONEA4 0022-3077 Google Scholar
D. R. Ollerenshaw et al.,
“The adaptive trade-off between detection and discrimination in cortical representations and behavior,”
Neuron, 81
(5), 1152
–1164
(2014). http://dx.doi.org/10.1016/j.neuron.2014.01.025 NERNET 0896-6273 Google Scholar
I. Ferezou, S. Bolea and C. C. Petersen,
“Visualizing the cortical representation of whisker touch: voltage-sensitive dye imaging in freely moving mice,”
Neuron, 50
(4), 617
–629
(2006). http://dx.doi.org/10.1016/j.neuron.2006.03.043 NERNET 0896-6273 Google Scholar
D. H. Lim et al.,
“In vivo large-scale cortical mapping using channelrhodopsin-2 stimulation in transgenic mice reveals asymmetric and reciprocal relationships between cortical areas,”
Front. Neural Circuits, 6 11
(2012). http://dx.doi.org/10.3389/fncir.2012.00011 Google Scholar
M. H. Mohajerani et al.,
“Spontaneous cortical activity alternates between motifs defined by regional axonal projections,”
Nat. Neurosci., 16
(10), 1426
–1435
(2013). http://dx.doi.org/10.1038/nn.3499 NANEFN 1097-6256 Google Scholar
H. Slovin et al.,
“Long-term voltage-sensitive dye imaging reveals cortical dynamics in behaving monkeys,”
J. Neurophysiol., 88
(6), 3421
–3438
(2002). http://dx.doi.org/10.1152/jn.00194.2002 JONEA4 0022-3077 Google Scholar
C. R. Palmer, Y. Chen and E. Seidemann,
“Uniform spatial spread of population activity in primate parafoveal V1,”
J. Neurophysiol., 107
(7), 1857
–1867
(2012). http://dx.doi.org/10.1152/jn.00117.2011 JONEA4 0022-3077 Google Scholar
V. Bringuier et al.,
“Horizontal propagation of visual activity in the synaptic integration field of area 17 neurons,”
Science, 283 695
–699
(1999). http://dx.doi.org/10.1126/science.283.5402.695 Google Scholar
J. Schummers, H. Yu and M. Sur,
“Tuned responses of astrocytes and their influence on hemodynamic signals in the visual cortex,”
Science, 320
(5883), 1638
–1643
(2008). http://dx.doi.org/10.1126/science.1156120 SCIEAS 0036-8075 Google Scholar
S. Kaur, R. Lazar and R. Metherate,
“Intracortical pathways determine breadth of subthreshold frequency receptive fields in primary auditory cortex,”
J. Neurophysiol., 91
(6), 2551
–2567
(2004). http://dx.doi.org/10.1152/jn.01121.2003 JONEA4 0022-3077 Google Scholar
R. D. Frostig et al.,
“Large-scale organization of rat sensorimotor cortex based on a motif of large activation spreads,”
J. Neurosci., 28
(49), 13274
–13284
(2008). http://dx.doi.org/10.1523/JNEUROSCI.4074-08.2008 Google Scholar
A. Kyriakatos et al.,
“Voltage-sensitive dye imaging of mouse neocortex during a whisker detection task,”
Neurophotonics, 4
(3), 031204
(2017). http://dx.doi.org/10.1117/1.NPh.4.3.031204 Google Scholar
W. Akemann et al.,
“Route to genetically targeted optical electrophysiology: development and applications of voltage-sensitive fluorescent proteins,”
Neurophotonics, 2
(2), 021008
(2015). http://dx.doi.org/10.1117/1.NPh.2.2.021008 Google Scholar
J. Stehberg, P. T. Dang and R. D. Frostig,
“Unimodal primary sensory cortices are directly connected by long-range horizontal projections in the rat sensory cortex,”
Front. Neuroanat., 8 93
(2014). http://dx.doi.org/10.3389/fnana.2014.00093 Google Scholar
B. A. Johnson and R. D. Frostig,
“Photonics meets connectomics: case of diffuse, long-range horizontal projections in rat cortex,”
Neurophotonics, 2
(4), 041403
(2015). http://dx.doi.org/10.1117/1.NPh.2.4.041403 Google Scholar
B. A. Johnson and R. D. Frostig,
“Long, intrinsic horizontal axons radiating through and beyond rat barrel cortex have spatial distributions similar to horizontal spreads of activity evoked by whisker stimulation,”
Brain Struct. Funct., 221
(7), 3617
–3639
(2016). http://dx.doi.org/10.1007/s00429-015-1123-7 Google Scholar
M. Kinoshita, C. D. Gilbert and A. Das,
“Optical imaging of contextual interactions in V1 of the behaving monkey,”
J. Neurophysiol., 102
(3), 1930
–1944
(2009). http://dx.doi.org/10.1152/jn.90882.2008 JONEA4 0022-3077 Google Scholar
G. Mirabella, S. Battiston and M. E. Diamond,
“Integration of multiple-whisker inputs in rat somatosensory cortex,”
Cereb. Cortex, 11
(2), 164
–170
(2001). http://dx.doi.org/10.1093/cercor/11.2.164 Google Scholar
C. H. Chen-Bee et al.,
“Whisker array functional representation in rat barrel cortex: transcendence of one-to-one topography and its underlying mechanism,”
Front. Neural Circuits, 6 93
(2012). http://dx.doi.org/10.3389/fncir.2012.00093 Google Scholar
D. Kleinfeld and K. R. Delaney,
“Distributed representation of vibrissa movement in the upper layers of somatosensory cortex revealed with voltage-sensitive dyes,”
J. Comp. Neurol., 375
(1), 89
–108
(1996). http://dx.doi.org/10.1002/(ISSN)1096-9861 Google Scholar
D. Goldreich, B. E. Peterson and M. M. Merzenich,
“Optical imaging and electrophysiology of rat barrel cortex. II. Responses to paired-vibrissa deflections,”
Cereb. Cortex, 8
(2), 184
–192
(1998). http://dx.doi.org/10.1093/cercor/8.2.184 Google Scholar
D. B. Polley, C. H. Chen-Bee and R. D. Frostig,
“Two directions of plasticity in the sensory-deprived adult cortex [see comments],”
Neuron, 24
(3), 623
–637
(1999). http://dx.doi.org/10.1016/S0896-6273(00)81117-4 NERNET 0896-6273 Google Scholar
F. Gomez-Pinilla et al.,
“The influence of naturalistic experience on plasticity markers in somatosensory cortex and hippocampus: effects of whisker use,”
Brain Res., 1388 39
–47
(2011). http://dx.doi.org/10.1016/j.brainres.2011.02.068 BRREAP 0006-8993 Google Scholar
B. A. Johnson and R. D. Frostig,
“Long-range, border crossing, horizontal axon radiations are a common feature of multiple distinct cortical regions,”
(2017). Google Scholar
N. S. Jacobs, C. H. Chen-Bee and R. D. Frostig,
“Emergence of spatiotemporal invariance in large neuronal ensembles in rat barrel cortex,”
Front. Neural Circuits, 9 34
(2015). http://dx.doi.org/10.3389/fncir.2015.00034 Google Scholar
G. Silasi et al.,
“Intact skull chronic windows for mesoscopic wide-field imaging in awake mice,”
J. Neurosci. Methods, 267 141
–149
(2016). http://dx.doi.org/10.1016/j.jneumeth.2016.04.012 JNMEDT 0165-0270 Google Scholar
T. H. Murphy et al.,
“High-throughput automated home-cage mesoscopic functional imaging of mouse cortex,”
Nat. Commun., 7 11611
(2016). http://dx.doi.org/10.1038/ncomms11611 Google Scholar
Y. Ma et al.,
“Wide-field optical mapping of neural activity and brain haemodynamics: considerations and novel approaches,”
Philos. Trans. R. Soc. London, 371
(1705),
(2016). http://dx.doi.org/10.1098/rstb.2015.0360 PTRSAV 0370-2316 Google Scholar
|


