
|
|
1.IntroductionThe burgeoning field of optogenetics is increasingly branching into new areas of the brain and is expanding into new species of study, which in-turn requires device engineers to be able to respond rapidly with customized optrodes to meet these changing needs.1–4 In the absence of a large catalog of previously built intracortical probes for light delivery as reference, it was necessary to develop a method to target specific areas of the brain and laminae of the cerebral cortex, which was also applicable to a wide variety of animals, by taking advantage of commercially available brain atlases to reduce the need for live animals. The current de facto standard for intracortical light delivery is a fiber optic-coupled cannula from makers such as Thorlabs.5 Several different methods have been created to deliver light to larger volumes of tissue and to target specific neocortical regions.6–9 Arrays of cannulae get too cumbersome and are difficult to fabricate and insert, so research groups have devised arrays to illuminate tissue.10 The goal of this study was to develop a method of customizing Utah optrode array (UOA)’s using Solidworks® to model a brain’s region of interest in three-dimensions (3-D). A major benefit of this work was to reduce the number of animals needed for experimentation by virtually implanting a 3-D model of a UOA into the brain’s region of interest 3-D model. The method demonstrated in this study is easily transferred to any animal species or anatomical region in which an atlas has been created; the atlas only needs to have individualized anatomical plates from optical images, computer tomographic scan, magnetic resonance images, etc, which can be converted into .jpg images and imported into Solidworks®. Stereotaxic measurements were used in this study’s 3-D models, but any reference dimensions could have been used to create the brain’s region of interest 3-D model. Figure 1 provides a schematic overview of the stereotactic method for customizing UOAs. Fig. 1Stereotactic method for customizing UOAs. (a) 3-D CAD brain modeling of macaque V4D using Calabrese17 atlas plates with highlighted Paxinos16 regions. A 10-mm section of V4D is selected for 3-D CAD modeling, and the section’s 23 atlas plates have been spaced at simulating their location within the macaque brain. (b) Two 3-D CAD models of the UOA shown virtually implanted in V4D ( array with TGV and a smaller ); both devices are shown implanted into the 3-D CAD brain model. (c) A completed soda-lime glass UOA, and (d) histological results showing successful macaque V4D implantation.  2.MethodsThe foundation for this work was laid using a high-density UOA with 1.5-mm-long/square optrodes as shown in Fig. 2, which was largely based upon prior work by this group to create an optical array based on the widely used Utah electrode array.11–15 This prototype device caused significant tissue damage in marmoset (Callithrix jacchus) visual cortex, so it was determined that it was necessary to design a more suitable array for small nonhuman primates and small rodents using a Solidworks® 3-D computer-aided design (CAD). From the 3-D brain model, an UOA was designed and modeled to target individual laminae within the neocortices of small animals, and the UOA model was fabricated using wafer-scale microfabrication techniques.12 The customized device was then inserted into two macaque monkeys (Macaca fascicularis) during nonrecoverable surgeries to assess the acute tissue damage caused during the implantation process. Two devices were later inserted into two C57BL/6 wild-type mice (Mus musculus) during recoverable surgeries with excellent long-term tolerability. Fig. 2(a) A Solidworks® 3-D model of the high-density UOA with a TGV. (b) High density array shown just prior to insertion resting on a marmoset’s primary visual cortex after craniotomy and durotomy have been performed. (c) Postfixation tissue damage assessment shows the array caused vascular damage as well as damage from the trauma of insertion, where high amounts of tissue have been compressed between the array’s optrodes. Histological assessment of tissue damage was not performed due to the level of tissue damage seen following device explantation. The white arrows mark the insertion location of a single electrode which was successful in recording neural spiking during postinsertion optrode illumination. Active neural action potentials indicated the neural tissue close to the optrodes around the TGV were still firing. 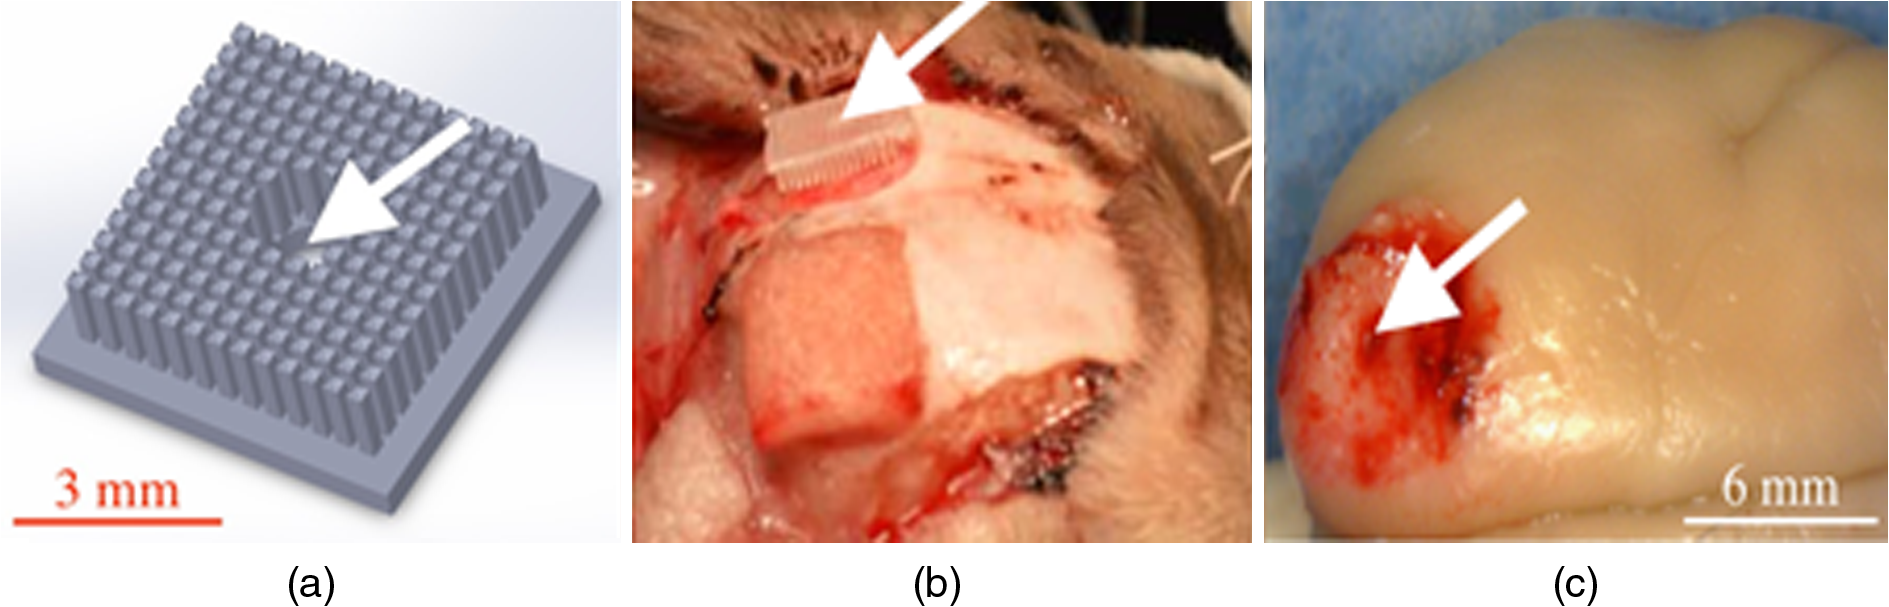 2.1.Marmoset (Callithrix jacchus)To assess cortical damage caused by the array, a single marmoset that was undergoing an acute electrophysiological recording procedure for unrelated experiments was implanted with a UOA at the end of the recording session. This reduced the number of animals needed for the two separate studies. The unrelated electrophysiological experiments took place in the right hemisphere, and the UOA was inserted into the left hemisphere. 2.1.1.Prototype high density UOA with through glass viaThis device was fabricated from fused silica using orthogonal dicing techniques13 and a through glass via (TGV) to allow for insertion of a recording electrode through the UOA. Optrodes were obelisk-shaped with 45-deg pyramidal tips, 1.5-mm long, wide, set at pitch, leaving a gap between them of . The backplane was thick and had an outer perimeter of . The TGV was created by grit ablation through a partially completed array just prior to wet etching and annealing. The array’s backplane was masked using Kapton® tape with a window exposed to allow the grit to access the glass for etching. The array was then placed into a cardboard carrier that supported the array during the aggressive grit blasting. alumina () grit was sprayed through a tip at for until a hole was drilled on the front side of the array. The TGV removed nine inner optrodes, so it was necessary to ensure no sharp edges remained of partially etched optrodes. 2.1.2.Marmoset in vivo UOA insertionMarmoset was anesthetized as described in detail for macaques in Sec. 2.5.1. A prototype UOA was sterilized and placed on the primary visual cortex of a sufentanil-anesthetized [6 to ] marmoset monkey, as shown in Fig. 2(b), after craniotomy and durotomy, and it was inserted using a perpendicularly positioned, actuated pneumatic hammer (Blackrock, Salt Lake City, Utah; 16 PSI, depth range). Significant tissue damage can be seen in Fig. 2, following postfixation removal of the device. 2.1.3.Marmoset electrophysiology through the TGVFollowing insertion of the high density array, a high impedance epoxylite-coated tungsten microelectrode (1 to , FHC Inc., Bowdoin, Maine) was advanced through the TGV using a hydraulic micropositioner (Kopf Instruments, Tujunga, California). Spikes were amplified and bandpass filtered between 400 Hz and 5 kHz, and sampled at 22 kHz by a dual-processor G5 Power Mac, running custom scripts on EXPO software (courtesy of Dr. Peter Lennie, University of Rochester, Rochester, New York). Visually evoked spiking activity was recorded in response to high contrast (100%) drifting (2 to 5 Hz) sinusoidal gratings (spatial frequency 0.5 to ) of varying orientation. Spikes were displayed on a Sony GDM-C520K monitor with a mean luminance of and at a viewing distance of 57 cm. However, visually driven spiking activity was sluggish and spikes were rapidly decaying, most likely due to the damage from insertion of the high-density array. 2.2.Stereotaxic Atlas Plate Utility in UOA DesignThe tissue damage caused by the prototype array prompted a complete redesign of the device with anatomical considerations, such as Paxinos16 region of interest, cortical layer(s) of interest, and minimal invasiveness as a goal, using stereotaxic coordinate atlases. A key feature of the stereotaxic coordinate system is that it is based on standard right-handed 3-D Cartesian coordinate system, where the , , and axes have been mapped to anatomical structures of the skull. The or mediolateral (ML) axis is the distance away from the sagittal suture or midline; the or anteroposterior (AP) axis is mapped to the interaural line; and the or dorsoventral (DV) axis is mapped to the distance from the top of the skull at the 0 point. For this paper, the stereotaxic coordinates are referenced to bregma and will look like their Cartesian analog (ML, AP, and DV). These coordinates have enormous utility for the neuroscientist in that they can be used for targeting specific areas without the need to harm animals in trial and error experiments. Stereotaxic coordinate systems afford device engineers opportunities to exploit the targeting of areas with customizing neural prostheses to the area within the atlas plates of interest. By placing the atlas plates covering the region of interest into a 3-D CAD program such as Solidworks®, the designer can create a 3-D model of the space in between plates that can then be used to create a custom computer–brain interface and place it into the correct location that is planned during the surgery. 2.3.Solidworks® 3-D Modeling of the Brain’s Region of InterestSolidworks® 3-D CAD was used to create a 3-D CAD model of the region of interest in the brain by importing brain atlas plates with stereotaxic coordinates, stitching the regions of interest together, and rending as a 3-D CAD solid. The 3-D CAD model was then used to design a custom UOA that was capable of laying entirely within the region of interest in all 3-D and virtually placed. Once placed, the array’s precise placement was converted to stereotaxic coordinates for actual placement. Maskless wafer-level microfabrication techniques for UOA microfabrication12 were used to create the UOA to target layer VI of the dorsal region of visual area V4 (V4D) of the macaque monkey (M. fascicularis) visual cortex. The device was inserted with minimal acute tissue damage when compared to the previous marmoset work and was suitable for implantation into small rodents such as the common mouse (M. musculus). Calabrese17 atlas plates, with Paxinos16 V4D, were captured from the Scalable Brain Atlas18 and then placed onto individual planes within the Solidworks® CAD environment spaced at the precise spacing they would be within the atlas (). Each Paxinos16 region was outlined on each of the 23 plates of V4D with a B-spline (see Fig. 3), and the splines were lofted together to create a single 3-D CAD model of the V4D region. A centroid of interest was identified within the 3-D CAD model for ideal UOA placement. The customized UOA was placed at the centroid of interest and virtually inserted at (, , ). Figure 3 shows the spline and lofting process along with the 3-D CAD model of V4D. Fig. 3(a) A portion of the Calabrese17 atlas plates as captured from the Scalable Brain Atlas18 viewer showing the Paxinos16 region V4D in Solidworks® with each of the Paxnos16 regions outlined with a B-spline. (a) Conceptualized Solidworks® 3-D model with lofts between the Paxinos16 regions of each plate of V4D shown between the starting and ending plates. (c) Sagittal view of the 3-D model of V4D with insertion marks where the array has been virtually inserted. The white arrows mark the centroid of interest for illumination of layer IV. 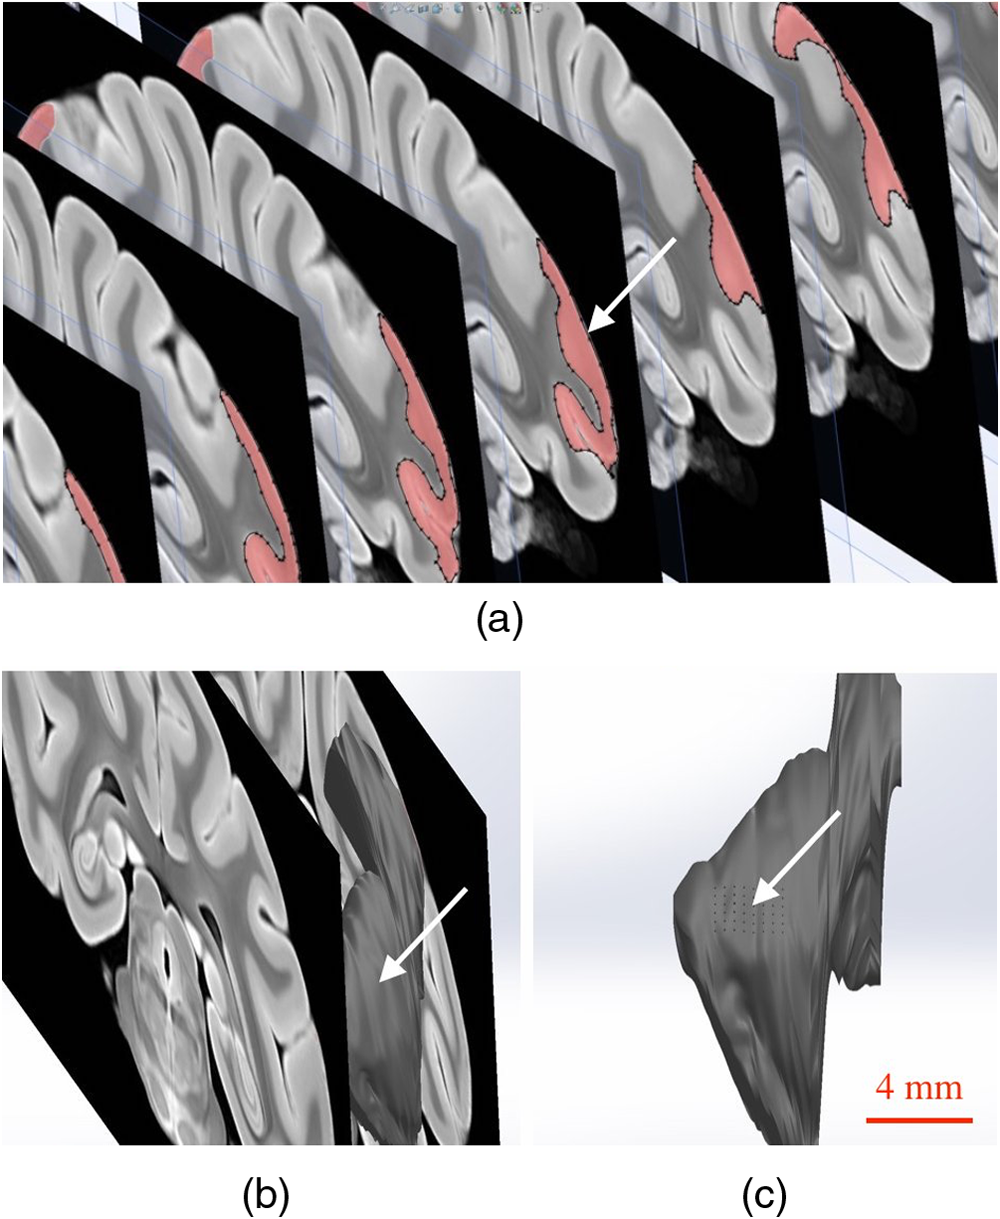 In principal, essentially any 3-D CAD package capable of drawing basis-splines and 3-D lofts could be used for creating the 3-D models of the brain, and during this research AutoCAD®, ImageJ®, Solidworks®, and the Scalable Brain Atlas were explored. Solidworks® proved to be better suited for importing .jpg images directly into the model space. It was possible to draw directly onto the .jpg in Solidworks® without affecting the 3-D model that was created because the modeling environment interpreted the .jpg as infinitely thin; thus, the .jpg had no volume to skew the 3-D solid model. 2.4.Customization of an 8 × 6 UOAArray design improvement started with a careful study of the fine structures of the brain, using Paxinos16 regions, with the goal of targeting a smaller area of the brain to minimize the contact surface area of the array and its optrodes. Stereotaxic coordinate system atlases are widespread, and typically show coronal cross-sections of species specific brains, e.g., Fig. 3.16,19,20 The Scalable Brain Atlas18 is an internet-based atlas viewer where researchers can display many different species: macaque, mouse, rat, human, marmoset, and opossum. It is necessary to select an atlas to view in the Scalable Brain’s18 user interface, where the interface is broken into three main compartments: (1) sagittal hemispherical cartoon view of atlas plates, (2) coronal view of region of interest slice with Paxinos16 outlines, and (3) regional hierarchy showing a list of regions present in the selected atlas slice. The Calabrese17 et al. atlas is an MRI + DTI atlas and did not use stereotaxic coordinates, so it was necessary to convert the distances to stereotaxic coordinates using the Scalable Brain’s18 measurement system. Screen selections were captured from the Scalable Brain’s18 Atlas plate viewer of gradient echo (GRE)-stained Calabrese17 plates, with Paxinos16 region highlighted and imported into Solidworks®. UOA fabrication has been well characterized in the previous work13–15 where the general purpose12 UOA’s key features of optrode pitch, outer flange, and -thick backplane have been incorporated into a custom array. Figure 4 shows conversion from the high density array to the custom array. Fig. 4(Top left) Design parameters for both and the arrays set to the same scale. (Top right) Side-by-side comparison of the high density array and the much smaller UOA. Key differences are wider optrode spacing and the removal of all sharp edges that may contact neural tissue on the UOA. Note: (Bottom left) Volumetric representation of neural tissue surrounding optrodes. Each optrode compresses the tissue into the space between optrodes as they penetrate: (a) the optrode has a tissue volume to optrode volume of , (b) the optrode has a tissue volume to optrode volume of , and (c) the optrode has a tissue volume to optrode volume of . (Bottom right) Paxinos16 region V4D with laminae conceptualized showing array tips at the boundary of layers III and IV.  2.5.Macaque (Macaca fascicularis)Two anesthetized macaques were implanted with the customized UOA during a scheduled nonrecoverable surgery. As with the marmoset, these animals were part of an unrelated electrophysiological experiment, and the implantation of the UOA was accomplished after those experiments were completed. 2.5.1.Macaque in vivo 8 × 6 UOA insertionIn vivo insertion of the UOA was done on two macaque monkeys (M. fascicularis) to assess the damage caused during insertion, for comparison to the original marmoset (C. jacchus) and to determine if V4D layer IV was properly targeted by the device as designed. Monkeys were initially anesthetized with ketamine ( i.m.), isoflurane (2% in oxygen), followed by continuous sufentanil citrate [ i.v.], fluid infusion [ i.v.], and artificially ventilated. Anesthetic depth was assessed continuously via end-tidal , oximetry, heart rate, and blood pressure monitoring. Craniotomy and durotomy were performed to expose cortical surface. Following insertion of the UOA, the durotomy was closed with a layer of sterile Gelfoam®, and the craniotomy was sealed with dental cement. The experiment was terminated with a lethal dose of pentobarbital ( i.v.), and the animal perfused with 4% paraformaldehyde and the brain removed for histology. Prior to insertion, the optrodes were sterilized in chlorhexidine solution. One optrode was placed on the cortical surface in an area devoid of large surface vasculature and inserted using a perpendicularly positioned, actuated pneumatic hammer (Blackrock, Salt Lake City, Utah; 10 PSI, 0.6-mm depth range) at stereotaxic coordinates (, , and ). 2.5.2.Macaque postexplantation histologyThe optrode was removed from the brain following fixation, brains were postfixed in 4% paraformaldehyde for 6 h and cryoprotected in 30% sucrose. Brains were frozen-sectioned sagittally at and reacted for cytochrome oxidase. Sections were mounted, dehydrated, defatted, and coverslipped. Sections were photographed at low power ( objective) on a Ziess Axioskop 2 (Ziess, Oberkochen, Germany) using Neurolucida software (MicroBrightField Bioscience, Williston, Vermont). 2.6.C57BL/6 Wild-Type (Mus musculus)One UOA was implanted into a single mouse as part of a scheduled recoverable surgery. The array was to gauge the animal’s recovery and long-term tolerability of the device. A second mouse was implanted as part of a Holobundle light delivery system.21 2.6.1.Mouse in vivo insertion preparationMice were anesthetized with isoflurane (2%), mounted on a surgical frame and had their body temperature maintained. Analgesia was administered locally (kamacaine, s.c.), topically (lidocaine HCl 2%), and systemically (buprenorphine s.c.), dexamethasone ( s.c.) were administered to reduce brain edema, meloxicam ( s.c.) was administered to prevent inflammation and occlusion of the glass implant, and eye ointment (Duratears, Alcon-Couvreur) was applied to prevent dryness. The right parietal bone was removed from the midline to 4 mm lateral to the midline. Post-op treatment included injections of broad-spectrum antibiotics (penicillin–streptomycin) and analgesia (buprenorphine). 2.6.2.Mouse in vivo insertion of a UOA with a Holobundle light delivery systemThe UOA was used in conjunction with a specialized optogenetic light delivery system for transmitting defined light patterns through the highly scattering mouse cortex.22 The modified Holobundle system, based on the early apparatus described by Farah et al.,21 uses computer-generated holography to project light patterns into a custom fiber bundle matching the UOA’s arrangement, which is designed to transmit the light pattern into the bore of an MRI machine. The bundle’s termination was encased in a guide coupled to a cortical connector for aligning the bundle and the UOA during repeated insertions, and a beam for fixing the animal head to the MRI cradle. The assembly was 3-D printed, MRI compatible, and bonded together with cyanoacrylate prior to surgery. In addition, connected UOAs were inserted into the cortex of two mice: wild-type C57BL/6 mouse (M. musculus) and a transgenic mouse expressing channelrhodopin-2-eYFP under a Thy1.2 promoter (strain: B6.Cg-Tg(Thy1-COP4/EYFP)9Gfng/J, Jackson Laboratories, Bar Harbor, Maine). The dimensions of the UOA match the distance between the bregma and lambda points of the mouse skull and supports removal of the parietal bone along the suture lines to avoid excessive bleeding or damage to brain tissue. 3.ResultsThe UOA was successfully designed and fabricated using the same wafer-level techniques as previously described.12 Implantation of the customized UOA showed far less blunt force trauma and vasculature laceration than was seen with the high density optrode array. The custom array was also successful in targeting the boundary between layer III and layer IV, which would allow illumination of layer IV as designed. In addition, it is shown that the UOA could be customized to target specific neurons within the motor cortex of C57BL/6 wild-type mouse (M. musculus). 3.1.Atlas 3-D CAD Brain ModelingThe Calabrese17 plates were not readily available in an image format suitable for Solidworks® 3-D CAD modeling, so it was necessary to retrieve .jpg images, with the Paxinos16 regions of V4D, from the Scalable Brain Atlas18 as 23 individual screen shots. Lofting between the Solidworks® splined regions was far from ideal because of the complex shapes of some of the plates’ splines. The loft generator had a tendency to miscalculate the loft when the spline perimeter tended to compress, so some of the lofts appeared to have singularities where an MRI 3-D scan would not have these singularities. Overall, the 3-D generated model was successful in allowing the virtual placement of the custom UOA within the atlas plates. Paxinos’s16 atlas plates were used to measure the predicted layer thicknesses for the 3-D model of the optrode lengths, because the Calabrese17 atlas plates did not sufficiently highlight the layers of V4D. 3.2.Customized 8 × 6 UOA FabricationArray fabrication was successfully accomplished (see Fig. 5) using the maskless microfabrication techniques previously reported by this group.12 Soda-lime microscope slides were used to create the custom UOA used in this work. Dicing and wet etching were as predicted, but firing the arrays to remove the surface roughness of the dicing and etching processes proved difficult. Over-temperature or over-timed firing caused the optrodes to slump, making them not suitable for implantation, so it was necessary to adjust the firing schedule to better fire the shorter optrodes of the custom UOA. Firing also caused the optrodes to shrink by up to 25% during firing and widen from 75 to . Each of these effects was successfully accounted for in the final devices that were implanted in this study. Fig. 5(a) A customized UOA to specifically target layer IV of Paxinos16 macaque area V4D. The UOA is fabricated out of soda-lime microscope slides using maskless wafer-level microfabrication processes.12 (b) Postperfusion histochemical staining with cytochrome oxidase of sagittal sections of area V4D showed the array was successfully inserted into V4D and reached the boundary between layers III and IV, which would allow for illumination of layer IV during optogenetic studies. The same device was successfully used for holographic projection into motor cortex of the common mouse. 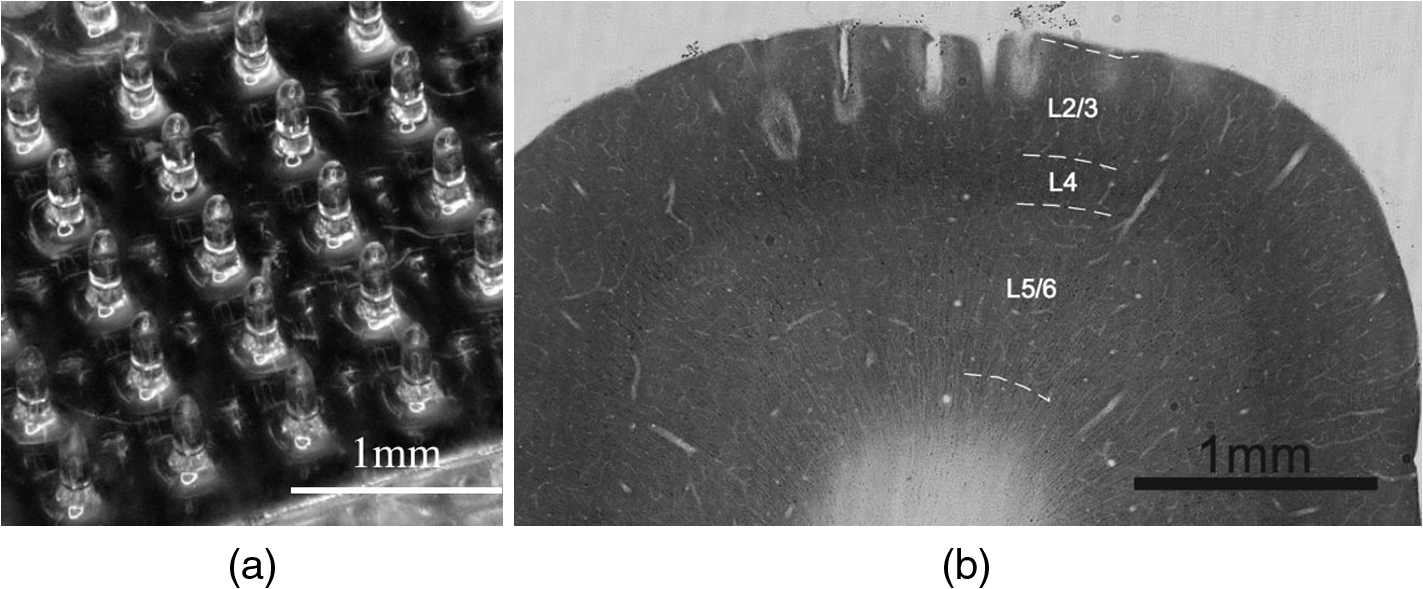 3.3.Marmoset V1 Tissue Damage AssessmentThe high-density UOA caused significant damage and some blood loss in marmoset (C. jacchus) primary visual cortex,23 as seen in Fig. 2. Postmortem inspection showed the high-density device displaced of gray matter and compressed it in between of optrode spacing. Lacerations were observed due to high amount of blunt force trauma of the square optrodes. This damage made it necessary to improve the array’s design and microfabrication techniques, and at the same time eliminate the need for in vivo trial insertion iterations for array improvement using stereotaxic coordinate atlases. Stereotaxic coordinate system atlases are commonplace, so they were used to identify the location of the array’s placement, the array’s perimeter, and the overall size of the craniotomy that was needed to insert the device with minimal invasiveness. This method was adapted to the microfabrication technique of the UOA.12 The prototype device’s failure as an implant was somewhat offset by the success of a TGV that was grit ablated through the backplane of the array. Electrical recordings were made through the TGV with a stereotactic-mounted monopolar microelectrode. This indicated that while the prototype device caused damage, there were still viable neurons within the neocortical columns capable of firing. This was an important discovery with the prototype device because it was initially unknown whether or not tissue compression would damage the neurons directly below the TGV. 3.4.Macaque V4D HistologyUpon array explantation, histology of sagittal sections of area V4D showed the device’s tips reached the boundaries of layer III and layer IV of V4D as designed. Cytochrome oxidase staining highlights revealed force trauma to cortical layers as the light gray “halo” seen throughout the insertion wound of Fig. 5. Histology was not performed on the marmoset when the high density device was explanted because of the damage suggesting the macaque implant represented an improvement in design. 3.5.Displaced Tissue Reduction by Controlling Optrode ShapeFigure 4 shows three CAD models of optrodes surrounded by a rectangular volume of tissue, and Table 1 shows the ratio of tissue volume to optrode volume for the three optrode models. Ratio of tissue-affected volume was quantified using a ratio of total tissue volume to optrode-displaced tissue volume. A single bullet-shaped optrode from the UOA has a tissue-affected volume ratio of that means there is 40 times more surrounding tissue for the optrode’s displaced tissue to push into. On the contrary, there is only a ratio for the 1.5-mm-square optrode of the UOA. Table 1Ratio of volumetric tissue affected by a single optrode.
3.6.Mouse In Vivo Insertion of a UOA-HolobundleConnectors with the UOA were successfully implanted in two mice. The first mouse implanted with the UOA exhibits normal behavior and has not developed any adverse symptoms, infections, or occlusion of the implant for more than 6 months. The modified Holobundle system shown in Fig. 6 can control all the individual fibers and project various patterns at the glass end-plate of the bundle (except for a single misassembled fiber in the corner of the array), with negligible insertion loss of the fiber bundle to the cortical connector and minimal output power instability during repeated attachments. A second transgenic mouse expressing channelrhodopsin-2 was implanted with the aligned connector (see Fig. 6) without serious post-op complications, and will be used to validate the device effectiveness for optogenetic stimulation, and will be reported at a later publication. 4.ConclusionThis study shows that UOA’s can be customized using Solidworks® 3-D CAD model of the visual cortical area V4D of the macaque and of the motor cortex of C57BL/6 wild-type mouse. The UOA has been inserted in wild-type mouse for over 6 months with no adverse reactions, showing excellent biocompatibility. Based on a histological assessment, the device causes a small amount of sharp force trauma at the base of the optrode tips, but this damage is easily repaired during postimplantation recovery. A customized array was successfully fabricated reducing blunt force trauma and laceration of tissue, and the device successfully inserted at the boundary between layers III and IV for optogenetic illumination of layer IV. Insertion damage was far less than that caused by using a high density UOA. Final dimensions of the customized were optrode length (), optrode width (), optrode pitch (), backplane thickness (), and overall form factor (). It was reported that a TGV was fabricated using grit ablation to drill through the backplane of the UOA. This design allows for simultaneous electrical recording in the middle of the UOA and backplane illumination. Solidworks® 3-D CAD was successfully used to create a 3-D model of Paxinos16 region visual macaque visual cortical area V4D. Calabrese17 atlas plates were imported into Solidworks® from the Scalable Brain,18 the region of interest was B-splined, and each B-splined region was lofted together. The UOA was designed, modeled in Solidworks®, and virtually inserted into the 3-D CAD model of the brain region of interest. This allowed for the array design to be iterated without the need of multiple insertions into a live animal reducing the cost of animals for future study. The major differences between the prototype and the stereotactically designed UOAs are rounded optrodes, tuned optrode length for specific layer targeting, smaller footprint, reduced numbers of optrodes per array, and lower light intensity requirements. In each of the parameters, we see a marked improvement over the array. This study proves that previous anatomical atlases can be exploited to create virtual 3-D anatomical models to customize implantable multioptrode and multielectrode arrays without the use of animals in trial and error experiments. Prior to in vivo experimentation, researchers can use 3-D CAD software to create a 3-D anatomical model of the region of interest and use that virtual model to design a device suitable for implantation to minimize invasiveness and injury to the animal. By eliminating the need for live animals to design a device, this method dramatically accelerates device development by optimizing the device for size and placement within the anatomical region of interest. An additional benefit of this research is that it shows that atlas coordinate systems can be used in conjunction with 3-D CAD to assist in the placement of the actual device. This is achieved using the 3-D CAD anatomical model, virtually placing the device, and using the CAD’s internal measurement system to determine the placement during the actual surgery. In this work, stereotaxic coordinates were used in both the 3-D anatomical model as well as the virtual placement of the device; the virtual placement measurements were then transferred to the stereotactic-mounted pneumatic hammer used for UOA placement. Overall, this work shows great utility to the functional anatomist as well as the neuroscientist. DisclosuresAll nonhuman primate surgical and experimental procedures conformed to guidelines of the National Institutes of Health (NIH) and were approved by the University of Utah Animal Care and Use Committee (15-12008). All rodent experiments were conducted in accordance with the Institutional Animal Care and Use Committee (IACUC) at the Technion–Israel Institute of Technology. The authors declare no financial conflicts of interest. AcknowledgmentsMr. Ronnie Boutte and Dr. Steve Blair would like to acknowledge the generous support of the Utah Science and Research Initiative (USTAR) for their support of the Tunable Optrode Array student funded research and the National Science Foundation (NSF) under grant 1310654 for its support of the atlas-based 3-D CAD design work. Mr. Ronnie Boutte and Mr. Brandon Griffiths would like to thank their employer, Northrop Grumman Corporation, for the use of Solidworks® and the computer hardware needed to create the 3-D CAD Models of V4D, and all of the UOAs, used in this work. Dr. Alessandra Angelucci acknowledges the support by the National Institutes of Health (National Eye Institute grants R01 EY019743 and R01 EY026812), the National Science Foundation (grants IOS 1355075 and EAGER 1649923), the University of Utah Research Foundation (seed grant 10040877), and a grant from Research to Prevent Blindness to the Department of Ophthalmology, University of Utah. Drs. Alessandra Angelucci and Steve Blair acknowledge the National Institute of Neurological Disorders and Stroke BRAIN grant U01 NS099702. This project has received funding from the European Union’s Horizon 2020 research and innovation program under the ERC grant agreement #648927. Mr. Guy Yona and Drs. Shy Shoham and Itamar Kahn would like to acknowledge support by the Israeli Ministry of Science, Technology and Space. They would also like to thank Alexandra Levinsky, Inbar Brosh, and the Technion Preclinical Research Authority and Nadav Cohen for their assistance with rodent care. ReferencesP. Anikeeva et al.,
“Optetrode: a multichannel readout for optogenetic control in freely moving mice,”
Nat. Neurosci., 15 163
–170
(2011). http://dx.doi.org/10.1038/nn.2992 NANEFN 1097-6256 Google Scholar
H. Ayaz et al.,
“An optical brain computer interface for environmental control,”
in Annual Int. Conf. of the IEEE Engineering in Medicine and Biology Society,
(2011). http://dx.doi.org/10.1109/IEMBS.2011.6091561 Google Scholar
R. Hira et al.,
“Transcranial optogenetic stimulation for functional mapping of the motor cortex,”
J. Neurosci. Methods, 179 258
–263
(2009). http://dx.doi.org/10.1016/j.jneumeth.2009.02.001 JNMEDT 0165-0270 Google Scholar
I. Ozden et al.,
“Identification and clustering of event patterns from in vivo multiphoton optical recordings of neuronal ensembles,”
J. Neurophysiol., 100 495
–503
(2008). http://dx.doi.org/10.1152/jn.01310.2007 JONEA4 0022-3077 Google Scholar
Thorlabs, Inc., “Implantable fiber optic cannulae,”
(2017) https://www.thorlabs.com/navigation.cfm?guide_id=2256 March ). 2017). Google Scholar
F. Wu et al.,
“An implantable neural probe with monolithically integrated dielectric waveguide and recording electrodes for optogenetics applications,”
J. Neural Eng., 10 056012
(2013). http://dx.doi.org/10.1088/1741-2560/10/5/056012 1741-2560 Google Scholar
J. Zhang et al.,
“Integrated device for optical stimulation and spatiotemporal electrical recording of neural activity in light-sensitized brain tissue,”
J. Neural Eng., 6 055007
(2009). http://dx.doi.org/10.1088/1741-2560/6/5/055007 1741-2560 Google Scholar
T. Abaya et al.,
“Characterization of a 3D optrode array for infrared neural stimulation,”
Biomed. Opt. Express, 3 2200
–2219
(2012). http://dx.doi.org/10.1364/BOE.3.002200 BOEICL 2156-7085 Google Scholar
R. Berry et al.,
“X-optogenetics and u-optogenetics: feasibility and possibilities,”
Photonics, 2 23
–39
(2015). http://dx.doi.org/10.3390/photonics2010023 Google Scholar
N. G. Laxpati et al.,
“Real-time in vivo optogenetic neuromodulation and multielectrode electrophysiologic recording with NeuroRighter,”
Front. Neuroeng., 7 40
(2014). http://dx.doi.org/10.3389/fneng.2014.00040 Google Scholar
R. Bhandari, S. Negi and F. Solzbacher,
“Wafer-scale fabrication of penetrating neural microelectrode arrays,”
Biomed. Microdevices, 12 797
–807
(2010). http://dx.doi.org/10.1007/s10544-010-9434-1 Google Scholar
R. W. Boutte and S. Blair,
“Maskless wafer-level microfabrication of optical penetrating neural arrays out of soda-lime glass: Utah optrode array,”
Biomed. Microdevices, 18 115
(2016). http://dx.doi.org/10.1007/s10544-016-0140-5 Google Scholar
T. Abaya et al.,
“A 3D glass optrode array for optical neural stimulation,”
Biomed. Opt. Express, 3 3087
(2012). http://dx.doi.org/10.1364/BOE.3.003087 BOEICL 2156-7085 Google Scholar
T. V. F. Abaya et al.,
“Glass optrode arrays for optogenetic stimulation,”
Proc. SPIE, 8586 85860V
(2013). http://dx.doi.org/10.1117/12.2004502 Google Scholar
T. V. Abaya et al.,
“Deep-tissue light delivery via optrode arrays,”
J. Biomed. Opt., 19 015006
(2014). http://dx.doi.org/10.1117/1.JBO.19.1.015006 JBOPFO 1083-3668 Google Scholar
G. Paxinos, X.-F. Huang and A. W. Toga, The Rhesus Monkey Brain in Stereotaxic Coordinates, Academic Press, San Diego, California
(2000). Google Scholar
E. Calabrese et al.,
“A diffusion tensor MRI atlas of the postmortem rhesus macaque brain,”
NeuroImage, 117 408
–416
(2015). http://dx.doi.org/10.1016/j.neuroimage.2015.05.072 NEIMEF 1053-8119 Google Scholar
R. Bakker, P. Tiesinga and R. Ktter,
“The scalable brain atlas: instant web-based access to public brain atlases and related content,”
Neuroinformatics, 13 353
–366
(2015). http://dx.doi.org/10.1007/s12021-014-9258-x 1539-2791 Google Scholar
X. Palazzi and N. Bordier, The Marmoset Brain in Stereotaxic Coordinates, Springer, New York
(2008). Google Scholar
K. S. Saleem and N. K. Logothetis, A Combined MRI and Histology Atlas of the Rhesus Monkey Brain in Stereotaxic Coordinates, Academic Press, London, Waltham, Massachusetts
(2012). Google Scholar
N. Farah et al.,
“Holographic fiber bundle system for patterned optogenetic activation of large-scale neuronal networks,”
Neurophotonics, 2 045002
(2015). http://dx.doi.org/10.1117/1.NPh.2.4.045002 Google Scholar
G. Yona et al.,
“Realistic numerical and analytical modeling of light scattering in brain tissue for optogenetic applications,”
eNeuro, 3 1
–9
(2016). http://dx.doi.org/10.1523/ENEURO.0059-15.2015 Google Scholar
R. W. Boutte et al.,
“Nonhuman primate visual cortex damage assessment of in vivo laser illumination and implanted Utah optrode array,”
(2013). Google Scholar
BiographyRonald W. Boutte is a PhD candidate (expected December 2017) at the University of Utah while working full-time at Northrop Grumman Corporation. He received a BSEE and an MSME. Currently, he is employed as an advanced optoelectronic system test engineer at Northrop Grumman. His research interests are optical neural prosthetics and advanced optical communication systems. He has a special interest in MEMS, MOEMS, and NEMS device research and development. Sam Merlin is currently a neuroscientist employed at Western Sydney University, whose research is focused on understanding the neurocircuitry that underlies early visual processing. He utilizes functional imaging techniques in conjunction with anatomical tracers and electrophysiological recordings, and then functionally manipulates these circuits using optogenetic approaches. His initial optogenetic approaches highlighted the need for customizable implantable devices to target deeper brain structures, without adversely impacting neural circuits. Guy Yona is a PhD candidate in the Autonomous Systems Program at the Technion–Israel Institute of Technology. He received his BS degree in electrical engineering and his BA degree in physics from the Technion–Israel Institute of Technology, Haifa, in 2009 and his MS degree in electrical engineering from Tel-Aviv University, Israel, in 2013. His research interests are closed-loop systems in the brain, optical neural interfaces, and functional imaging. Brandon J. Griffiths is the lead engineer in the Automation Group at Northrop Grumman Corporation. He holds a BS degree in mechanical engineering technology from Southern Utah University and an MS in engineering management from California State University Northridge. His work at Northrop Grumman includes tool design and manufacturing engineering. He is a certified Solidworks® professional and received Technical Innovation awards for design work that resulted in Trade Secret IP awards. Alessandra Angelucci is a professor of ophthalmology/visual science at University of Utah’s Moran Eye Institute. She holds an MD degree from the University of Rome, a PhD in neuroscience from MIT, and was a postdoctoral fellow at University College London. Her research focuses on understanding the computations of neural circuits in the visual cortex of nonhuman primates, employing neuroanatomical, imaging, electrophysiological, and optogenetic techniques. She is on the editorial boards of Visual Neuroscience and Frontiers in Neuroscience. Itamar Kahn is an assistant professor of neuroscience at the Rappaport Faculty of Medicine at Technion–Israel Institute of Technology. His research focuses on understanding the basic principles of communication between brain systems. He has worked on methods for awake mouse imaging, including combining optogenetic control with fMRI in mice and fMRI of awake passive and behaving mice in intact animals and genetic models of developmental disorders. Shy Shoham is a professor of biomedical engineering at the Technion. He holds a BSc in physics from Tel Aviv University, a PhD in bioengineering from the University of Utah, and was a Lewis-Thomas postdoctoral fellow at Princeton University. His lab develops photonic, acoustic and computational tools for spatiotemporal interfacing with neural circuits. He is a member of the editorial boards of the Journal of Neural Engineering and of Translational Vision Science & Technology. Steve Blair received his BS and MS degrees from Rose-Hulman Institute of Technology in 1991 and 1993, respectively, and his PhD from the University of Colorado at Boulder in 1998. Since 1998, he has been with the electrical and computer engineering department at the University of Utah in Salt Lake City. His research interests include neural interfaces, plasmonics, slow-light nonlinear optics, photonic microsystems, and microarray technology. |


