
|
|
1.Neuronal AssembliesIn the last few decades, the discovery of neuronal mechanisms has been greatly aided by the development of imaging techniques; in particular, voltage-sensitive dye imaging (VSDI), pioneered by Amiram Grinvald, has proven to be especially powerful.1 The very high spatiotemporal resolution of VSDI enables the study of brain activity in real-time across a range of micro- and macroscopic processes ranging from intracellular impulse propagation within neurons, to dynamics of synaptic interactions, and on to neuronal population behavior in a wide range of brain states.2–5 In particular, the technology has offered valuable insights into the combined yet transient population activity emerging from the interplay of millions of neurons,6 “neuronal assemblies.” For the purposes of this review, neuronal assemblies will be defined as large-scale coalitions of neurons (tens of millions) activated for less than a second and neither confined to nor defined by specific anatomical brain regions or systems. A central problem in neuroscience is identifying the appropriate means for understanding brain function that caters for microscale interactions while at the same time accommodating a macroscale perspective allowing insight into the complex mental phenomena that are ultimately the principal objective. Assemblies operate at a “mesoscale” level of brain organization that has the potential for providing a valuable functional link between microlevel “bottom up” cellular mechanisms and macroscale “top down” cognitive ones. As such, the goal here is not to give an exhaustive review of all the existing literature on this increasingly investigated phenomenon; rather, we aim to draw on previous work from our own group on the in vitro and in vivo rat brain, to explore how assemblies could indeed provide the erstwhile missing link between the “bottom-up” level of individual synapses and circuits with the “top-down” perspective of macroscale brain regions and emergent cerebral functions. 2.Basic Features of Assemblies in the Rat Brain In VitroDuring the development of early dyes, there were concerns about possible drawbacks of applying an exogenous agent to the central nervous system: (i) direct pharmacological side effects that may change the neurophysiological characteristics of the system; (ii) indirect cumulative effects on the physiology of the preparation such as phototoxicity due to free-radical formation caused by the exposure of the dye molecules to high-energy light; (iii) restrictions placed on overall imaging time if the agent becomes washed out of the tissue and/or the dye is “bleached.” Fortunately, over time, these issues for many dyes have slowly been overcome and signal-to-noise ratios gradually improved.7–11 Nevertheless, it remains essential to correctly test new dyes to ensure they are free of such problems.12 Further limitations of VSDI should be recognized when using brain slice preparations which, out of necessity, can sever connections to the brain regions of interest. These limitations can be minimized by careful slicing techniques that retain key pathways, such as with thalamocortical slice preparations, data from which we present below. Using VSDI, assemblies can now be visualized routinely both in cortical and subcortical regions of rat brain.13,14 Using needle-based optical systems, it is now even possible to visualize subcortical regions in vivo.15 The process manifests as a circular propagating wave of activity that spreads outward from the locus of stimulation, as seen in Fig. 1 in coronal prefrontal cortex brain slices.16 Figure 1(a) shows the relationship between two-dimensional assembly activity patterns and their resulting time-series over time frames of 1 ms, whereas in Fig. 1(b), the data from Fig. 1(a) have been analyzed using a toolbox designed specifically for VSDI data.17 As an aside, it is worth noting that all investigations using VSDI could be made more relevant by standardization of the data processing and subsequent analysis technique (or at the very least of the data processing), as one of the main setbacks of current studies is that it is difficult to directly compare results across research groups. Fig. 1Dynamics of assemblies evoked in prefrontal cortex by intracortical electrical stimulation. Upon stimulation with a single pulse (30 V, 0.1-ms pulse width) there is a fast recruitment of large numbers of neurons activating in near-synchronous fashion. (a) Fluorescence time-series from a representative experiment where a single pulse was delivered to layer II/III of agranular insular cortex (); image shows peak response of evoked neuronal assembly. The amplitude of the optical signal is represented in pseudocolors with warmer colors illustrating a greater degree of membrane depolarization. Still-frame sequential activation of an assembly shows the very fast rise (0 to 6 ms, i), followed by the peak fluorescence emission (6 to 8 ms, ii) and a portion of the slow decay back to baseline (8 to 200+ ms, iii). (b) Image from the slice in the recording bath, as seen through (i) the VSDI optics, (ii) raw data average of fluorescence between 0 and 5 ms after stimulation, (iii) selection of the RoI and its segmentation for analysis (yellow area represents the RoI selected); and (iv) binning of data and representation into color-coded arrays or “space–time” maps. Space–time maps: segments 1 to 15 in (iii) are graphed on the -axis, against time [milliseconds, -axis, (iv)]. Single experiment datasets [as in (iv)] can then be combined to produce overall experiment averaged space–time maps (, ). Image processing via toolbox of Ref. 17. Red box in b(ii) represents the imaging area of focus in a(i)-(iii), while the time-span highlighted in red in b(iv) represents the epoch graphed out as a time-series in (a). From Ref. 16. 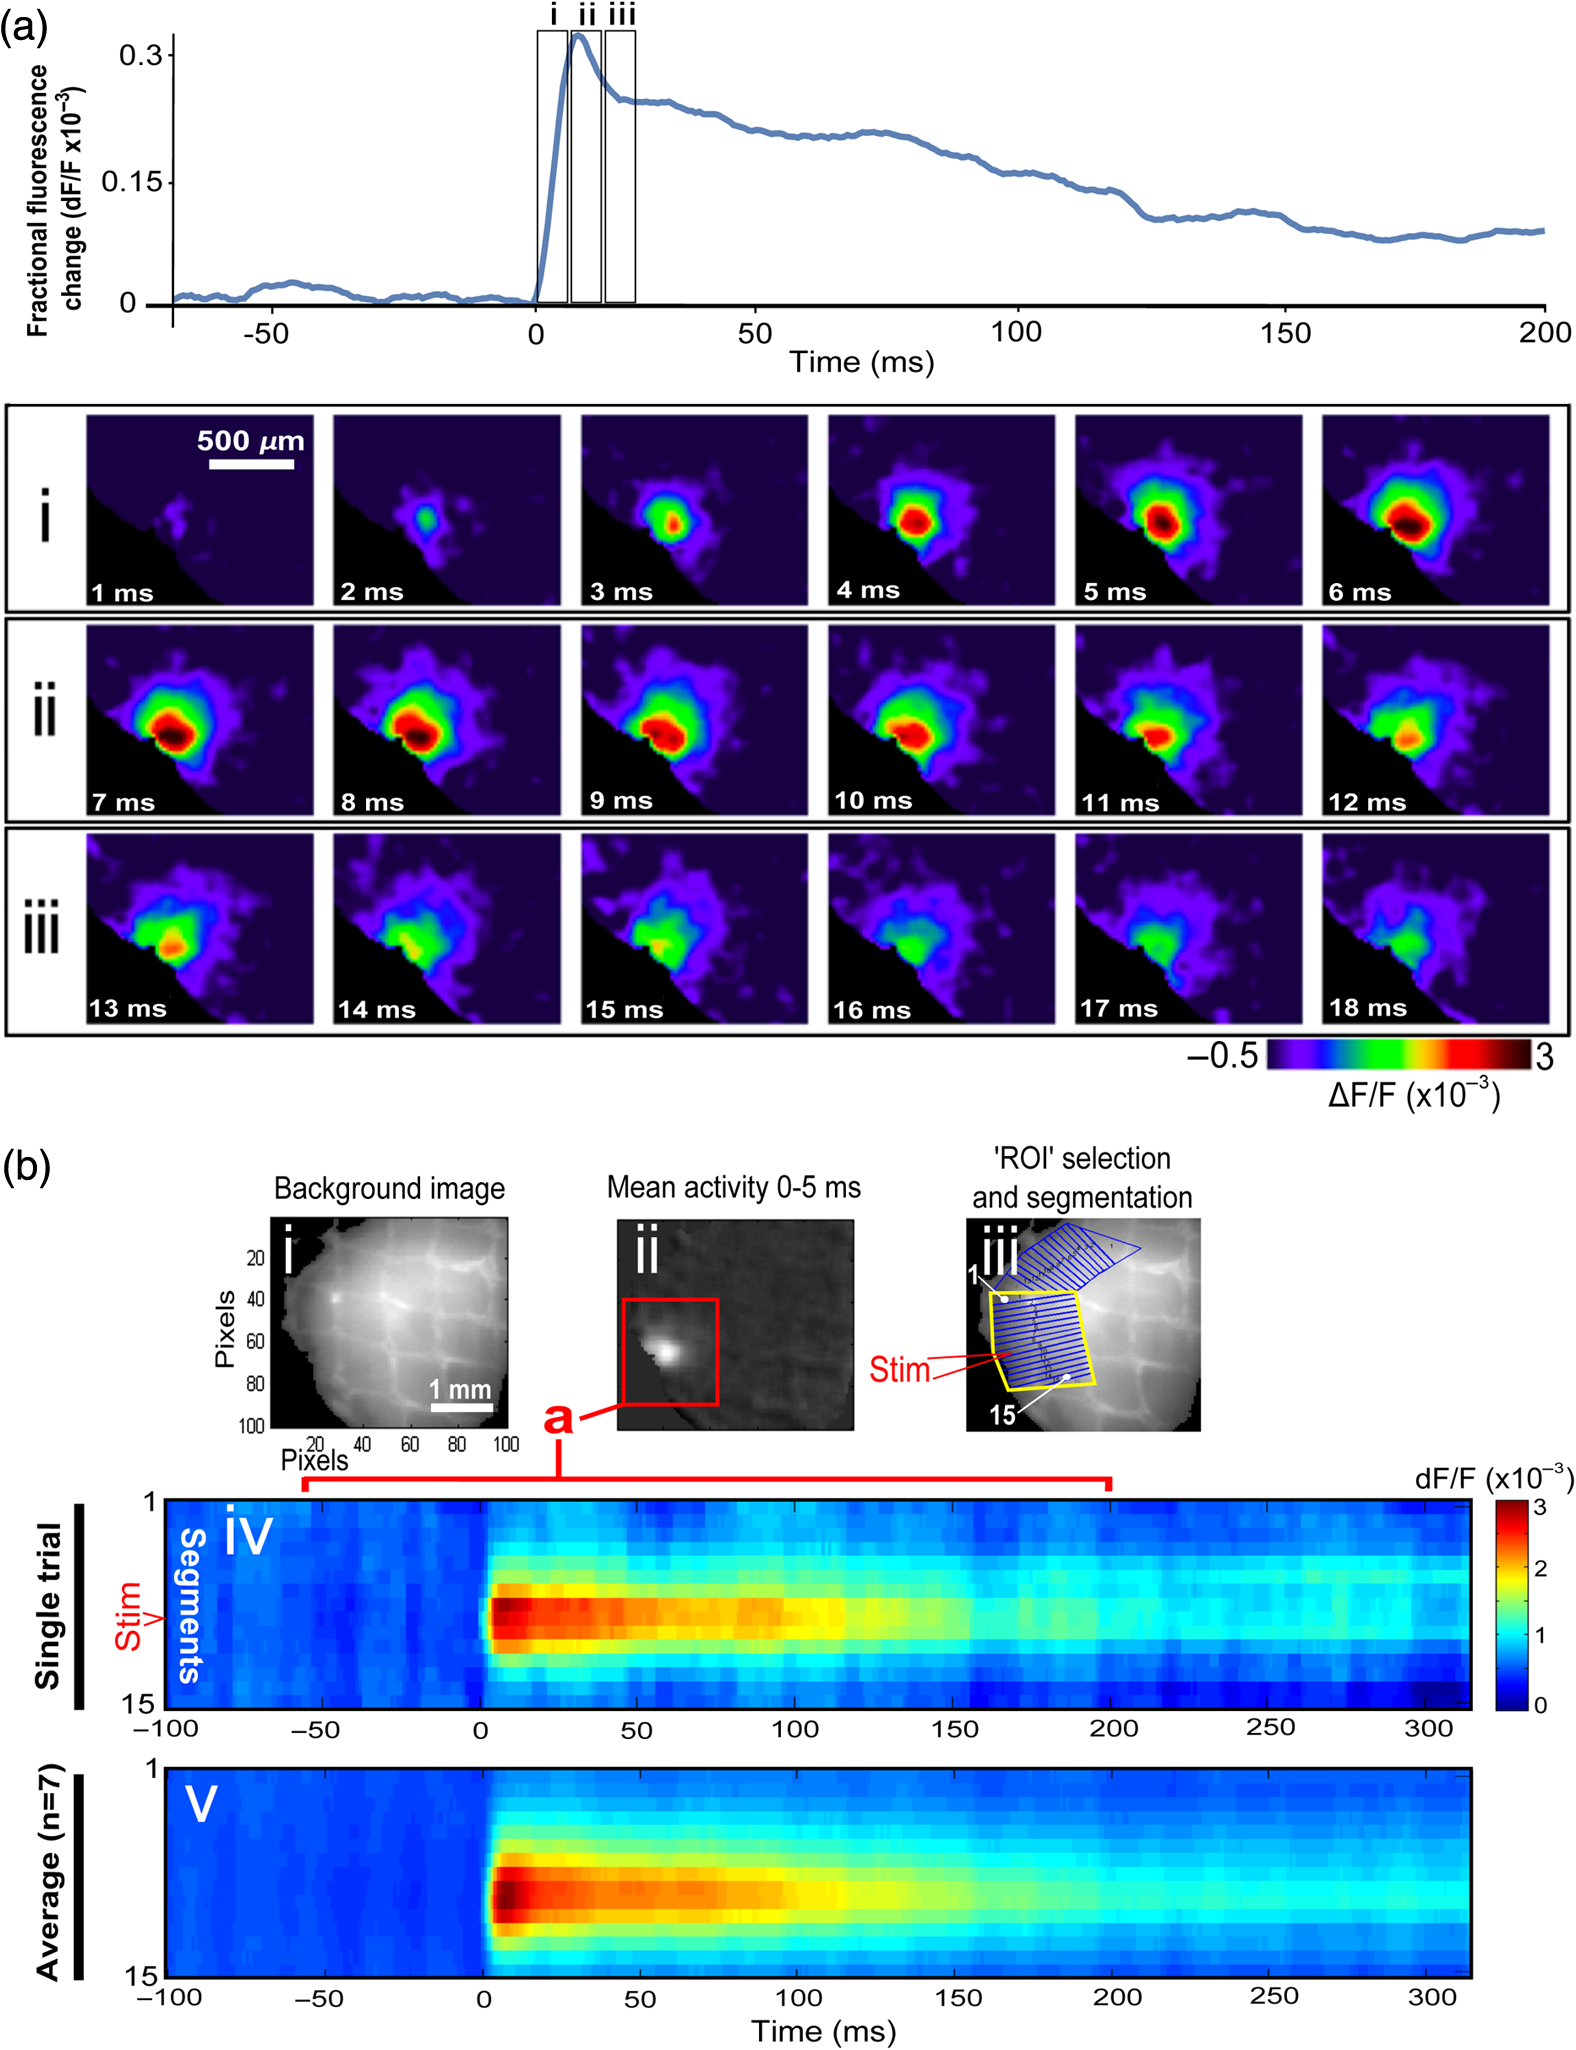 Taking into account the slice morphology and location of the evoked assembly, a region of interest (RoI) is selected in order to take into account the entirety of the response. Once selected, segmentation of the RoI yields, in this case, 15 separate segments [ at midlength width; Fig. 1(b)iii], presenting the averaged activity within each segment as pixels on the -axis in the space–time map (biv), over time (-axis). Using the methodology of the VSDI toolbox, multiple space–time maps can be stacked and averaged together, showing a high consistency in the profile of evoked assemblies [Fig. 1(b)v]. However, assemblies can also be evoked not only by direct local stimulation but also indirectly with remote activation of a connected but distinct brain structure. Figure 2 shows the activation of somatosensory barrel field cortex in brain slices that preserve the thalamocortical projection, triggered using an electric pulse applied to the ventroposteromedial (VPM) nucleus of the thalamus. As can be seen from Fig. 2, stimulated thalamocortical cells within the VPM depolarize the layer IV granule cells of the primary somatosensory barrel field cortex (S1BF) within 5 ms. This signal is then relayed to neighboring cells within each active barrel (both to other granule cells and pyramidal cells) driving a highly efficient recruitment process, which nonetheless takes almost 20 ms to reach peak activity throughout the S1BF: nearly four times as long as it took for the impulse to travel some 1.5 mm from the VPM to S1BF layer IV. Although a contribution from unmyelinated fibers within the cortex may contribute to the slow spread of the assembly, the spatial profile, with intense activity in the centre rather than at the leading edge, combined with the fact that VSDI yields preferential read-out of neuropil rather than axon activity, is all suggestive of signaling mechanisms other than classic synaptic transmission, which are already well known to be operative in the brain.16 Fig. 2Activation of thalamocortical pathway. Still-frame panels showing the sequential activation of barrel field cortex in response to a single stimulation pulse (30 V, 0.1-ms pulse width) to the VPM nucleus of the thalamus. Individual barrels can be seen to activate, with a higher signal intensity (black), within the cortical mantle, in particular within the still-frames 20 and 25 ms after stimulus delivery (time labels are displayed in italics in the top-right corner of each image). Here, it can be seen that the stimulus delivered to the thalamus at 0 ms takes less than 5 ms to reach and start activating layer IV barrels within the cortex; however, it then takes another 20 ms to fully activate the cortex. The amplitude of the optical signal is represented in pseudocolors with warmer colors illustrating a greater degree of membrane depolarization. H = hippocampus; T = thalamus; S1BF = primary somatosensory barrel field. Adapted from Ref. 16. 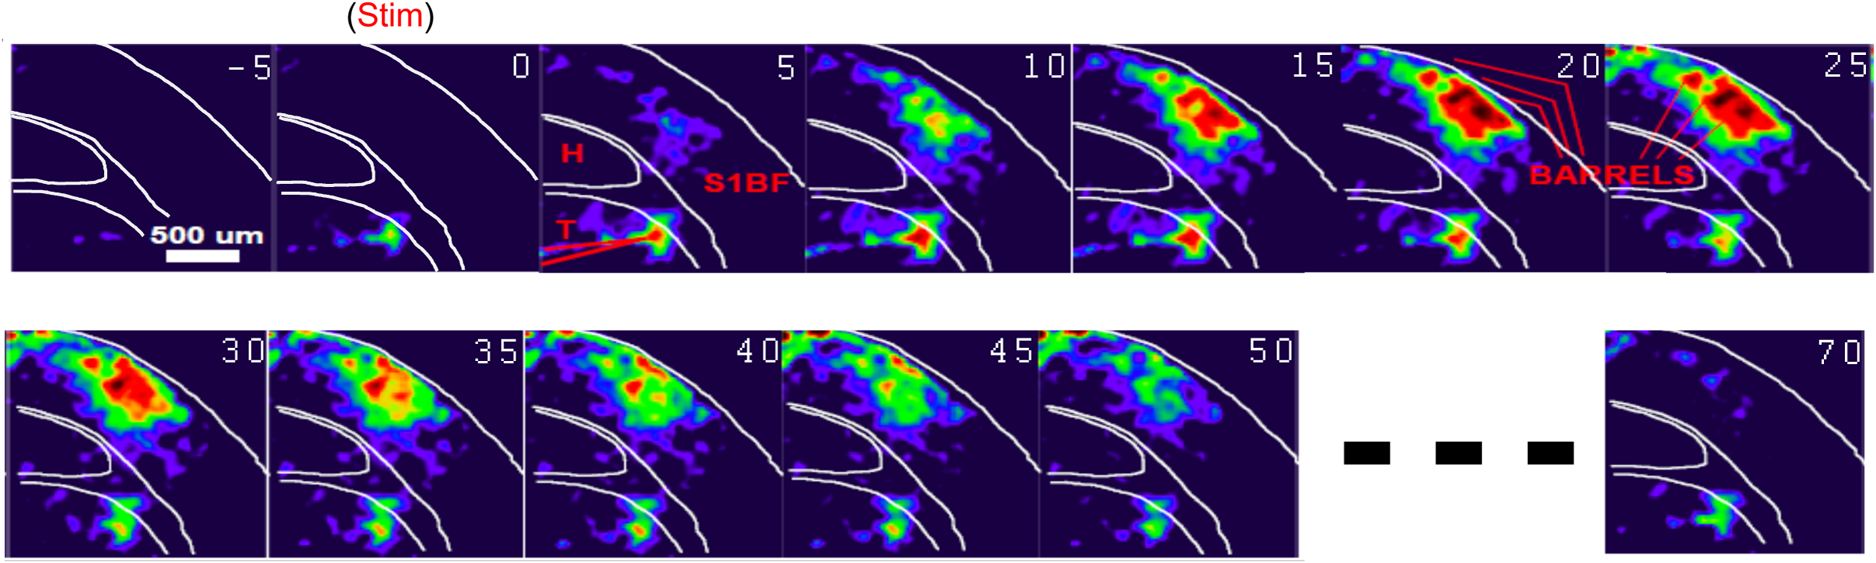 In any event, both direct and remotely evoked assemblies show a wide spread () lasting up to 100 ms and could well be the most significant functional units of brain processing compared to their individual constituting neurons,18 i.e., reveal a much more multifaceted profile of the brain at work. At the other end of the micro-macro scale of organization, assemblies will give far more information than conventional EEG recordings, which will nonetheless reflect, with less detail, some of the dynamic activity of functionally relevant neuronal assemblies: impairments in the activation, maintenance, and decay of assemblies resulting from neuropathological conditions are also apparent on EEG records.19–21 EEG will reflect synchronous activation (an assembly) of 10,000 to 50,000 neurons or more;22 meanwhile, one study has estimated the number of neurons present per millimeter cubed () of cortical tissue in the visual cortex of macaque monkeys in the region of 120,000 neurons.23 However, it should be noted that assemblies often spread wider than a millimeter in diameter, both laterally along layers and radially across the thickness of the cortex both in vitro24–27 and in vivo.28–31 What role(s) might assemblies be playing? Recent studies indicate such a wide range of possible scenarios that they only go to demonstrate how fundamental these transient neuronal coalitions must be to the workings of the brain in diverse states. One over-riding common theme, however, appears to be that assemblies could provide an unprecedented means for differentiating features of brain processing, which were previously unapparent. 3.Functional Role of Assemblies: Differentiating Brain Regions and Stages of DevelopmentAside from the ease of accessibility, experiments on the cortex—in vitro but particularly in vivo—have proved popular because cortical evoked activity is much more extensive, with slower dynamics, than normally seen in subcortical structures.32 One exception to this is the hippocampus, classified nonetheless as “allocortex” which, like the neocortex, is laminated in structure with discrete processing and integration abilities, thus conferring neocortical-like population dynamics.33,34 However, we have now compared two different cortical regions with an unequivocally subcortical site: the prefrontal association cortex, AId2,24 primary somatosensory cortex, S1BF,35 and the basal forebrain. This latter site was chosen due to its significance as a primary site of cell loss in diseases,36,37 such as Alzheimer’s disease.38,39 Assemblies generated in the basal forebrain featured much lower amplitudes and much faster paced dynamics,25 reminiscent of “lurching” waves,32 as previously described in other subcortical structures, such as the thalamus, albeit using electrophysiology. In any event, the profiles of assemblies in the basal forebrain were conspicuously different from those recorded in the two regions of cortex, indicating different population dynamics, possibly reflecting major differences in cytoarchitecture between subcortical and cortical brain regions.25 Hence, it could be argued that if different cytoarchitectonics alone predict a different response profile, VSDI is providing no further insight than could be seen using traditional electrophysiology. However, an additional new and unexpected difference between brain regions turned out only to be possible to detect with VSDI that showed differences in assembly dynamics in different stages of brain development. In rats from postnatal day (p) 7 (infants) to p60 (young adults)—as classified by Ref. 40—evoked assemblies visualized using VSDI decrease in size with increasing age. This effect can be seen in Fig. 3, which compares the evoked activity profiles of p14 (juvenile) and p35-40 (young adolescent) rats. Since we observed an increase in opacity of slice tissue between these two age groups,25 probably due to an increase in myelination,41 it might simply be the case that the apparent decreases in assembly size merely corresponded to a reduced optical signal due to the decrease in exposed excitable membrane space. However, this potential artifact is unlikely for various reasons. First, aside from myelination, many other developmental processes take place in the maturation of rat brain between p14 and p35-40, which together could lead to a net reduction in recorded VSDI signal. Second, and more conclusively, the VSDI signal generated by Di-4-ANEPPS (the dye used here) reflects activity originating most significantly from the neuropil,42 which remains unmyelinated throughout. Since the basal forebrain is part of a region known as the isodendritic core,43 characterized by a conspicuous and exaggerated dendritic arbor, the contribution to the signal from these nonmyelinated parts of the neuron would be substantial. Hence, the optic properties of the tissue can probably be discounted as a significant factor; meanwhile, the dominance of the neuropil contribution to the VSDI signal would account for the sensitivity of assemblies in revealing developmental differences to which standard electrophysiological recordings would be insensitive, preferentially reflecting as they do axonal conduction and somatic activity. Fig. 3Age-dependent decrease in VSDI signal from evoked responses in cortex and basal forebrain. (i) Response time series from VSDI experiments and (ii) resulting bar graphs of summed fluorescence fractional change elicited from stimulation in (a) layer II/III of p14 and p35-40 S1BF, (b) AId2, and (c) basal forebrain. Responses show a significant age-dependent decrease in recorded signal in all brain areas studied, with a larger decrease seen in cortex than in basal forebrain. **; ***; . From Ref. 25. 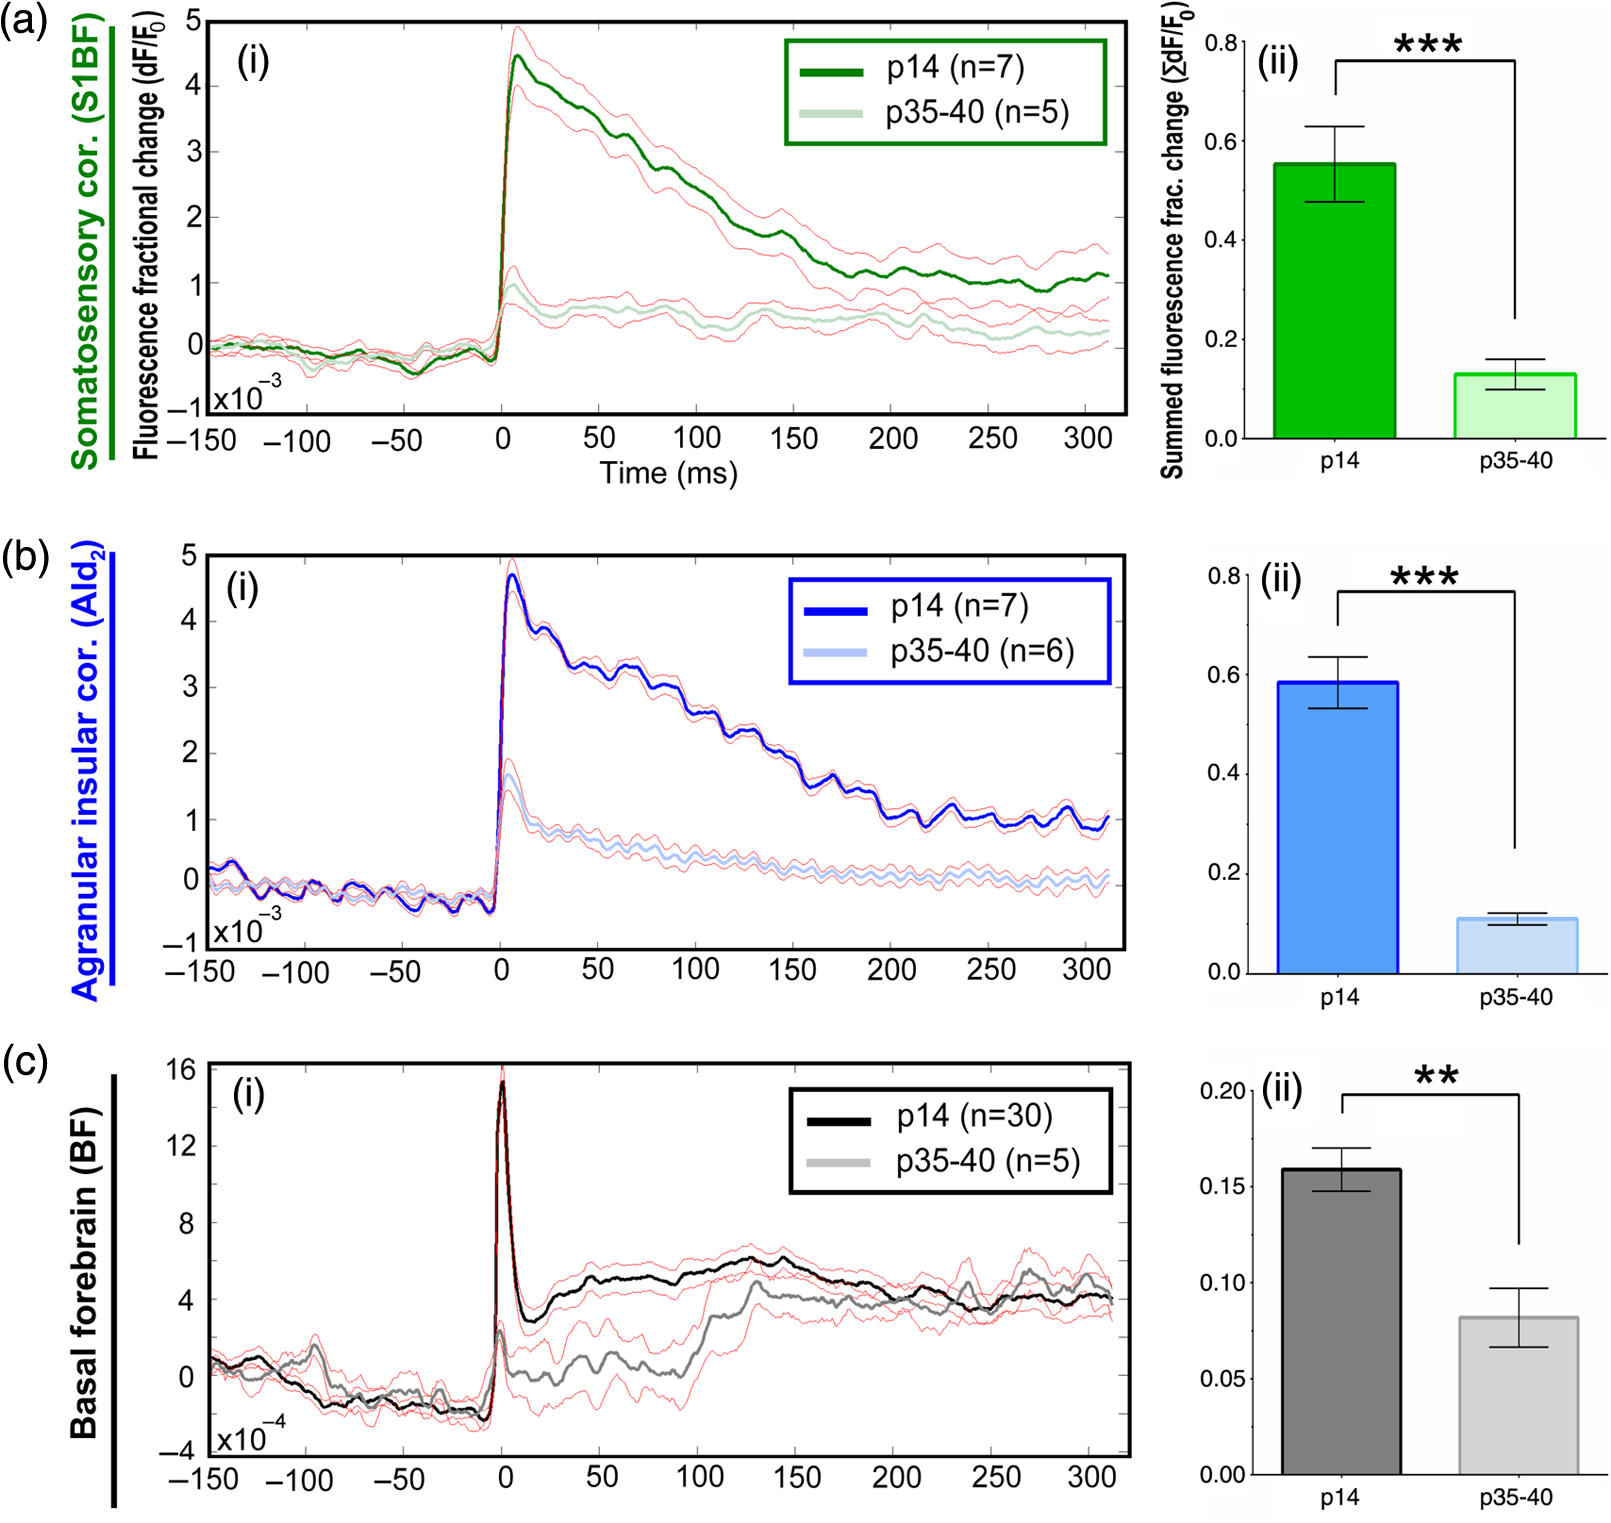 4.Functional Role of Assemblies: Differentiating Processing of Different SensesNot only do assembly dynamics differ according to brain region and age, but to function as well, such as the processing of visual and auditory information. The visual and auditory cortices have very similar cytoarchitecture, namely the characteristic laminar structure representing the topography of the sensory surface.44 The cortices of nearly all mammals display a common modular organization, involving a series of relays from the sensory receptor surface through the brainstem, midbrain, and thalamic regions to the respective cortical target areas. For vision and hearing, the underlying electrophysiological processing, as for any other sensory neocortical region, has a common theme: signals propagate as volleys of action potentials transduced from light or sound in the retina or cochlea. It is baffling therefore where and how, in the brain, there is a comparable and sufficiently unambiguous differential that could account for such very different subjective experiences as seeing and hearing. When we conducted VSDI studies in different sensory cortices in vitro, we found no significant discrepancies between the visual and auditory cortices for any of the following: fluorescence activity following first stimulation; area of assembly following first stimulation; fluorescence activity following second stimulation; area of assembly following second stimulation; time of decay in fluorescent/assembly activity.45 But then, surprisingly, we observed a clear distinction in the spatial spread of neuronal assembly activity, but only from around 300 ms following stimulation (Fig. 4). Fig. 4Differential effects of neuronal assemblies in visual and auditory cortex assembly centroid distance () from the point of stimulation plotted as a function of time (ms) for each individual slice. Red represents visual cortex and blue represents auditory cortex. Each 5-ms frame is plotted as a circle with an area proportional to assembly area in that frame, forming a trace of assembly movement over time (sometimes appearing as a solid line due to overlapping circles). For the first 200 ms, both cortices behave similarly, with a broad spread of activation across both the deep and superficial cortical layers. The expansion in assembly activity resulting from stimulation causes the centroid to move further from the electrode. Between 250 and 300 ms following first stimulation, activity in the visual cortex concentrates in the deeper layers, close to the point of stimulation, while auditory cortex show a localization in the superficial layer. From Ref. 45.  The neural assemblies spread widely across layers in the two cortices following paired-pulse stimulation of putative layer 4. However, the respective patterns of activity started to differentiate only within a specific time frame (250 to 300 ms). The signal was predominant near the point of stimulation in the visual cortex, whereas in the auditory cortex, the signal was stronger in the superficial layers (Fig. 5). Fig. 5Coronal sections of (a) visual and (b) auditory cortical areas from 11 brain slices each overlaid by a color-coded optical imaged map showing activity of assemblies. Note the strong activity observed close to the electrode tip in the visual cortex (i.e., in putative layer IV) and away from the electrode tip in the auditory cortex, i.e., toward the superficial cortical layers. Warm colors indicate longer lasting assembly. Sections are oriented so as to depict superficial layers toward the right end of each individual panel. From Ref. 45. 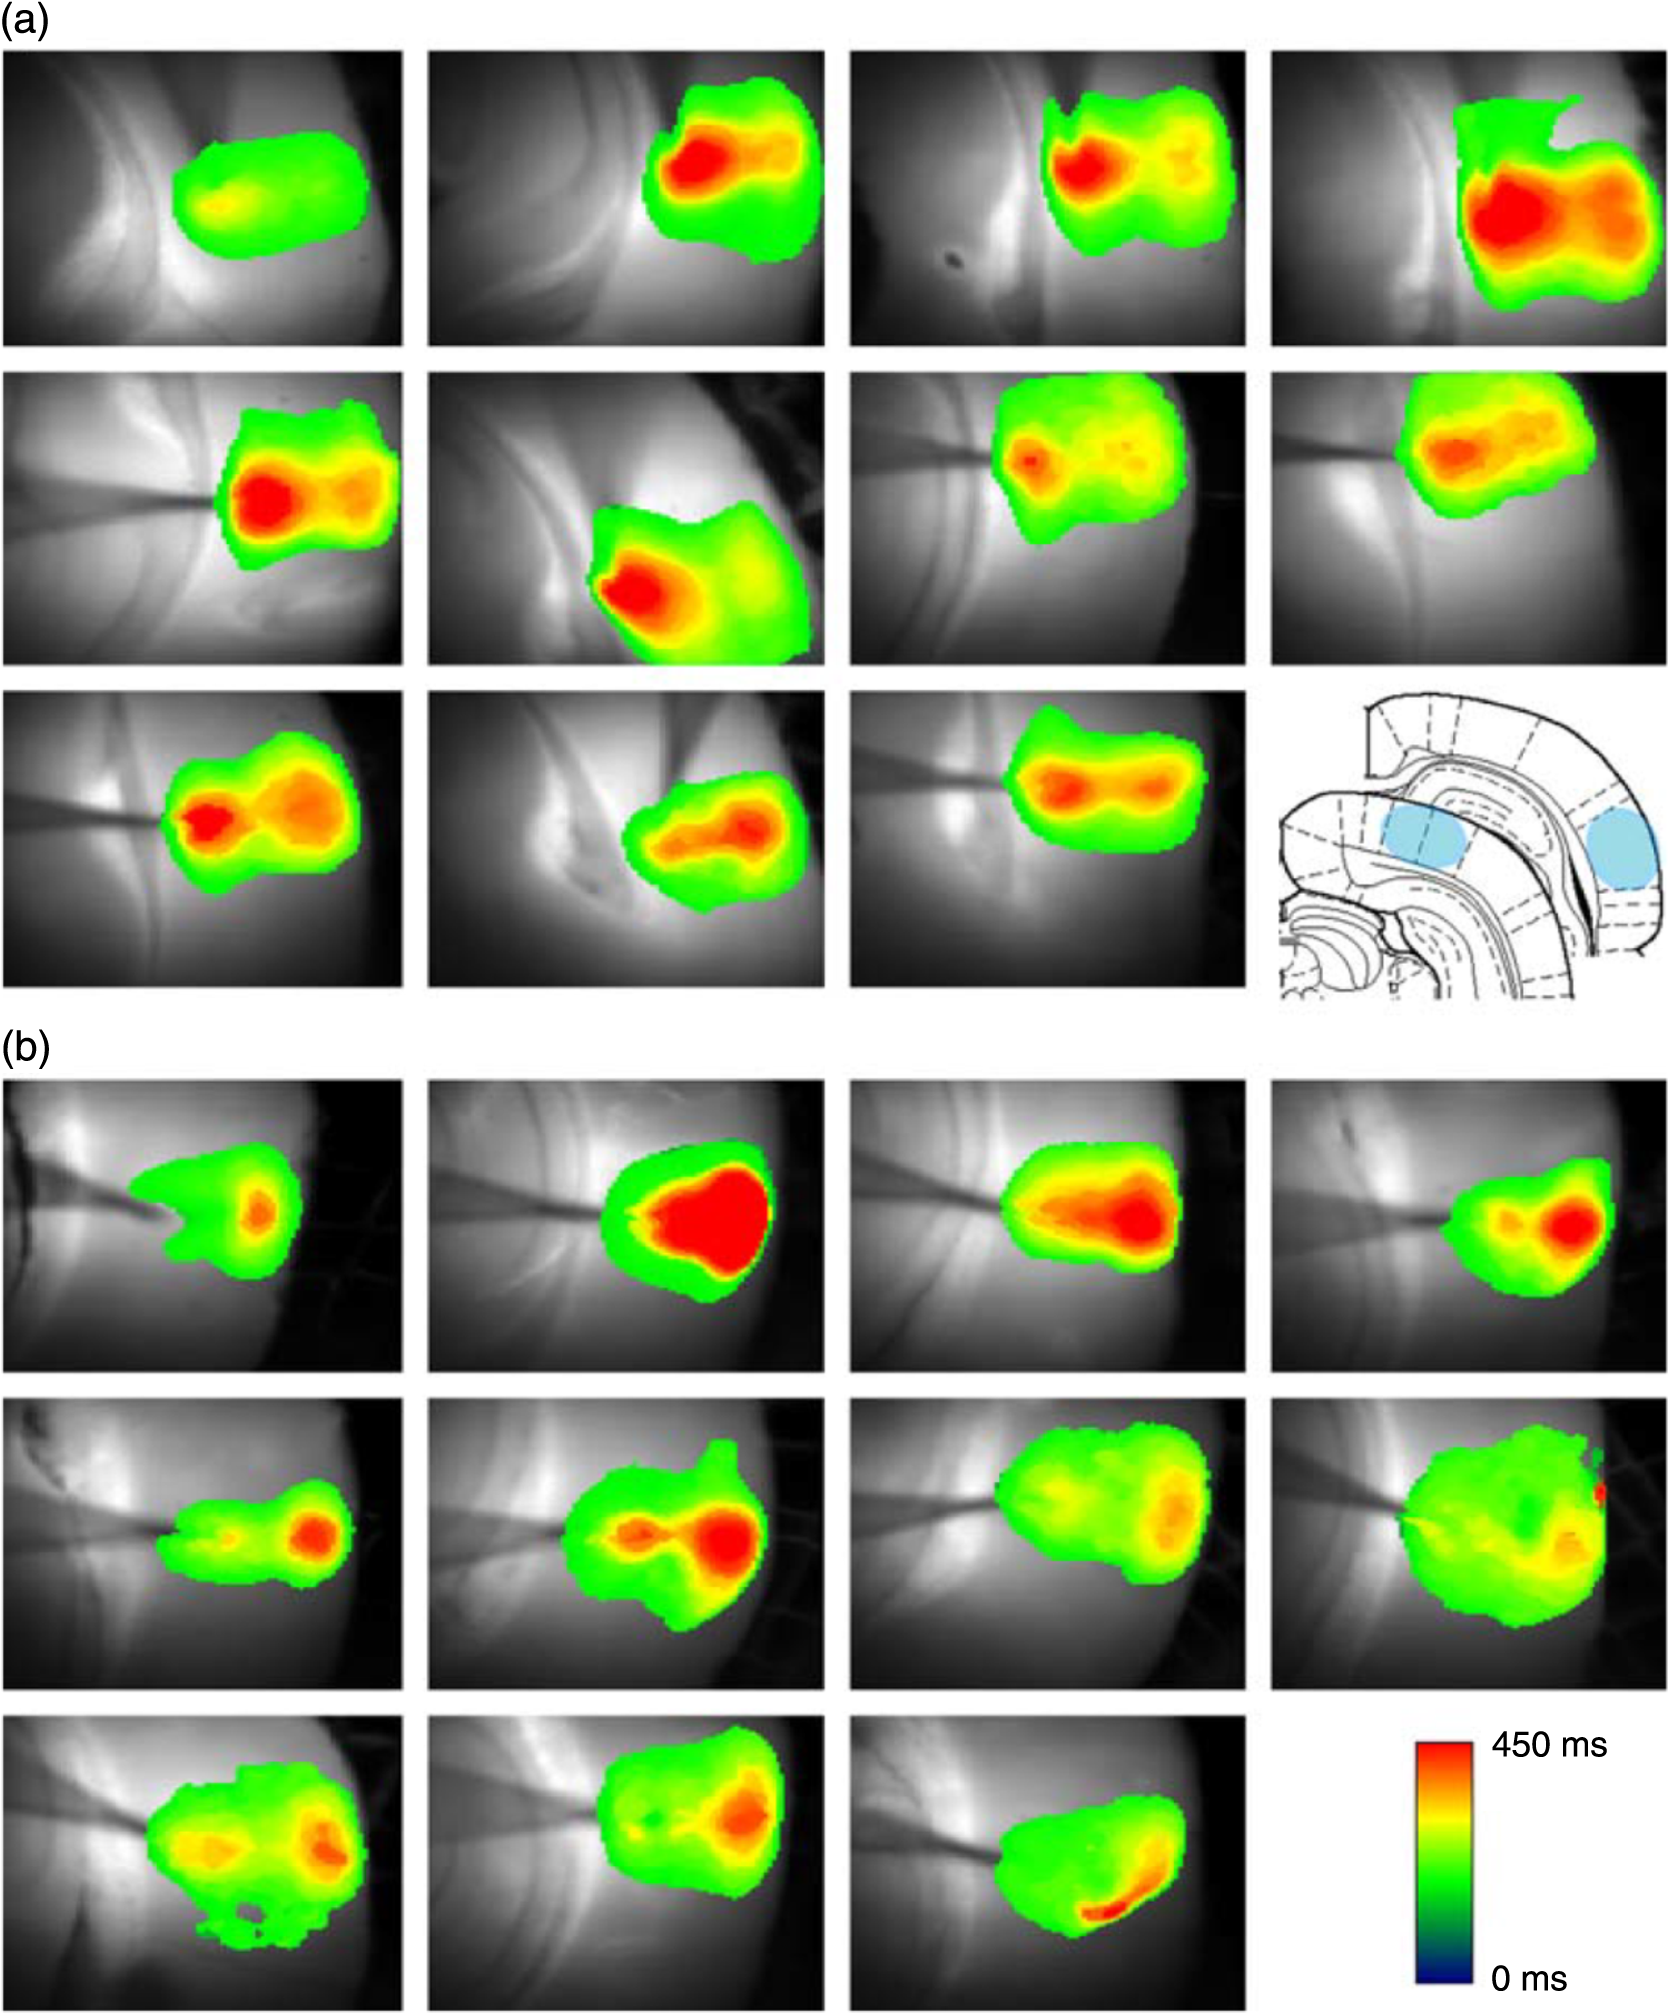 Although the precise underlying mechanisms for differences in visual and auditory cortical processing observed in our data are hard to identify conclusively, the following factors might be pertinent: (i) a difference in subthreshold electrical activity, (ii) a priming mechanism that may shape the response to subsequent stimuli, and (iii) a difference in the firing threshold of cortical neurons. Moreover, while there are many parallels in the anatomical organization between visual and auditory cortices suggestive of common principles involved in their structure and connectivity,46 there are also potentially important differences: the auditory cortex usually receives binaural input from subcortical nuclei unlike visual cortex, which is the earliest relay station to receive inputs from the two visual hemifields. Furthermore, the main thalamic inputs to visual cortex terminate primarily in layer IV,47 whereas in the auditory cortex, some thalamic (lemniscal) inputs are distributed widely, extending well into layer III,48 while others (nonlemniscal) terminate in layer I:49 it could well be that the differences observed in our imaging data reflect this unique extended distribution patterns of the auditory cortex that would not be revealed with conventional recordings. In any event, standard electrophysiological techniques, such as single/multiunit recordings or local field potential measures, could only reflect “mean” neuronal population activity and hence, once again, would be inadequate for studying detecting these kind of shifting spatial patterns over subsecond time scales. This kind of investigation using VSDI to visualize assemblies in different sensory systems could also be valuable as it may throw new light on previous findings involving long-term plasticity within contrasting modalities. Recent studies have shown that the “visual” cortical areas in the naturally blind mole rat (Spalax ehrenbergi) can be activated by auditory stimulation50–52 and, similarly, the “auditory” cortex of congenitally deaf mice can respond to visual or somatosensory stimulation,53 suggesting that the modular cortical visual or auditory pattern is present even in the absence of its apparent use. Likewise, Sur et al.54,55 have reported that inputs from one sensory modality, when rerouted to another during the neonatal period, can activate the newly wired neocortical region and even affect behavior. These long-term, chronic experiments suggest that the cognitive and perceptual ability attributed to the sensory neocortical areas is plastic and not merely dependent on differences in anatomical connectivity, and such plasticity may be mediated by different assembly dynamics. More fascinating still, such additional information, not available with traditional electrophysiology, could give insights into a truly fundamental question: how do the distinctive “subjective” experiences characteristic of each sensory modality actually relate to differences in the spatiotemporal properties of neuronal assemblies in the visual and auditory cortices as reported here? Conscious perception only occurs several hundred milliseconds after a sensory input, as well established from the pioneering work or Libet et al.56,57 Hence, as discussed previously in greater length,45 the discrepancies seen here with VSDI in the auditory versus visual cortices, within a similar time window needed for the generation of consciousness, might provide further insights in to understanding the neuronal mechanisms underlying conscious experience. In order to investigate this relationship more precisely, we would need a common yardstick for comparing the distinctive perceptual experiences of seeing and hearing. So far, the only quantifiable but also phenomenological scenario that could be related to the differential processing revealed here is with the effects of anesthesia: auditory processing is the final modality to become nonfunctional under general anesthesia and the first to recover its function during reversal of anesthesia.58,59 An interesting question could now be how do such differences in persistence relate to the differences in assembly dynamics; as such, the study of assemblies could open up a new approach by exploring how the dynamics of these transient and large scale neuronal coalitions might link differential subjective states to a differential underlying physiological processing in the brain.60,61 One possible scenario, as set out in “A Day in the Life of the Brain,”62 is that multiple and overlapping assemblies, continuously generated, would correspond to degrees of consciousness from one moment to the next. While such investigations into consciousness (see Ref. 62) are well outside the scope of this review, the more immediate goal is certainly feasible of exploring assembly dynamics in relation to “loss” of consciousness, i.e., the effects of anesthesia. 5.Functional Role of Assemblies: Differentiating Anesthetic Versus Analgesic ActionAnalgesics and anesthetics have diverse synaptic actions that nonetheless have a common net inhibitory action on neuronal discharge, as revealed with electrophysiology. Yet it turns out that optical imaging reveals an interesting difference. Most consistently, VSDI detected an enhanced period of activation following anesthetic, but not analgesic application (Fig. 6) that was not readily seen with concomitant electrophysiological recordings.63 These findings suggest that irrespective of the diverse and inconsistent effects of the various drugs at a synaptic level, the dynamics of neuronal assemblies are modified selectively by anesthetics but not analgesics. Fig. 6Analgesic and anesthetic effects on hippocampal activity. VSDI recordings were made of neuronal population activity in CA1 region of hippocampal slices of rat brain in response to paired-pulse electrical stimulation along the Schaffer collaterals from the CA3 region in the presence of anesthetics or analgesics. The left panel of images shows the responses under control conditions (in artificial cerebrospinal fluid, ACSF) and the right panel of images shows treatment conditions. Both analgesics and anesthetics are linked with the actions of the inhibitory GABAergic system and so two compounds from each class were tested: (a) analgesics morphine, (b) gabapentin, (c) anesthetics propofol, and (d) thiopental. Warmer colors show a higher degree of depolarizing excitation. The analgesic treatments do not significantly differ from their controls (a and b) but the anesthetics (c and d) cause a prolonged period of excitation that lasts for up to 500 ms after the second stimulating pulse. The optical recordings are also represented by traces below; black, control; red, treatment. From Ref. 63. 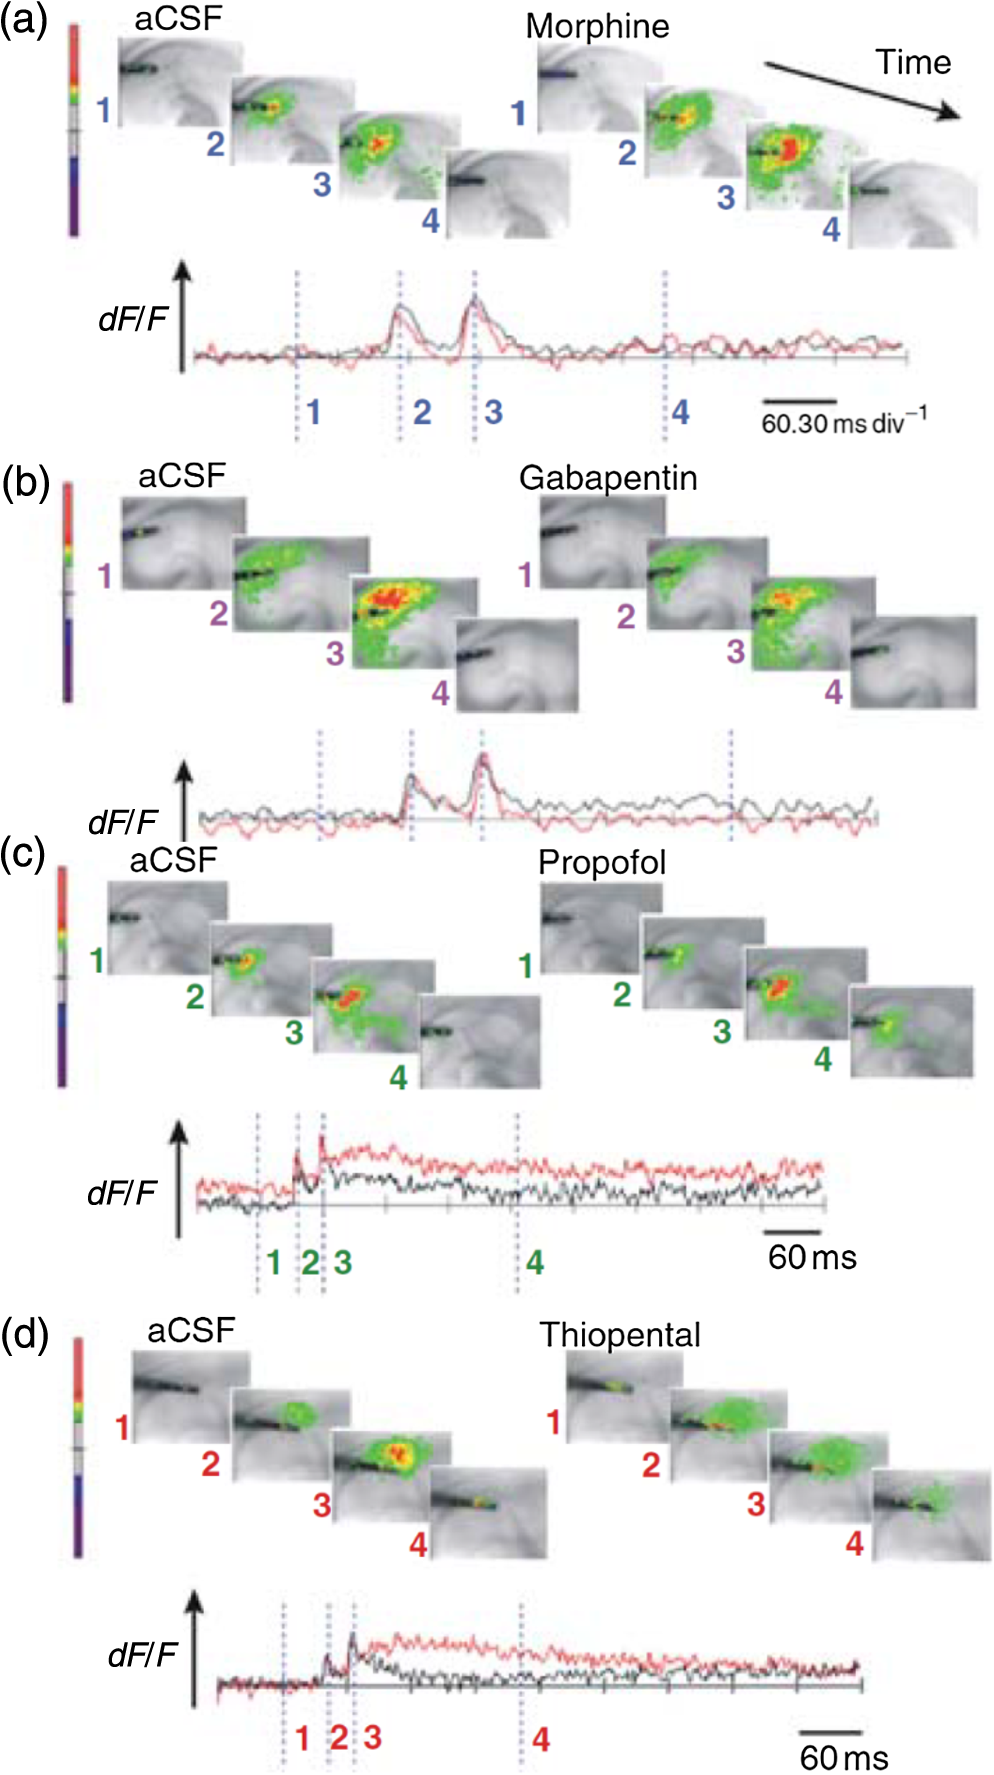 This effect cannot be explained by the possibility of the respective drug washing out more slowly than others as, in each case, the test compound was added to a closed circulating perfusion system and was, therefore, constantly present. Moreover, increases in synaptic action can also be discounted as the critical factor as morphine showed an increase in excitatory action but did not cause a persistent increase in synaptic activity following the stimulating pulses. Conversely, inhibitory synaptic action cannot be considered relevant as gabapentin shares a depressant synaptic action with the anesthetic compounds64 but does not cause the prolonged activation response shown here by the anesthetics. Propofol and thiopental, which are chemically distinct and possess different synaptic actions, are nonetheless comparable functionally: they are both anesthetics. Hence, beyond microscale “bottom-up” isolated and individual chemical action and synaptic activity, it is the mesoscale level of neuronal assembly dynamics that appears to most clearly determine the macroscale loss of consciousness. This, in turn, will be dependent on a variety of inputs from different key areas, such as the thalamus65 and cortex66 and, indeed, the hippocampus, the area studied here. Irrespective of whatever complex underlying transmitter interactions might be in play, this study revealed a surprising new property of anesthetics at a level of brain organization previously underappreciated. It would appear that the generation of highly transient (forming and disbanding within 60 ms) large-scale neuronal assemblies in areas such as the hippocampus might well be a necessary condition for sustaining consciousness. The possible link (albeit one that is necessary but not sufficient) between assemblies in the hippocampus, consciousness, and anesthesia, can actually be investigated without giving any drug at all. 6.Functional Role of Assemblies: Differentiating Effectiveness of Anesthesia under Normal Versus High Atmospheric PressureThe physiological consequences of breathing compressed air and various gas mixtures have been documented since the advent of deep diving and observing the effects on workmen exposed to subsurface conditions in mines and excavation sites.67 Under hyperbaric conditions, chemically inert gases, such as xenon and nitrogen narcosis, have an unexpected and unexplained anesthetic action:67–69 more intriguing still is the observation that the action of various narcotic and anesthetic species can be reversed by application of high pressure conditions.70,71 In collaboration with Professor Paul F. McMillan (University College London), a chemist and physical scientist with an expertise in high-pressure research, we were able to investigate hyperbaric effects, including narcosis, rare-gas (Xe) anesthesia, and pressure-reversal of anesthesia and narcosis, on the generation of assemblies in rat brain slices, specifically the hippocampus. We developed an experimental hyperbaric chamber designed to operate at pressures up to to 300 atmospheres, beyond which convulsions and cell death ensue. Pressure reversal effects are typically observed to occur in the to 150 atm range, whereas narcosis effects and Xe anesthesia are usually described within the lower pressure range, for example, between to 10 atm. The system was capable of controlling and maintaining a stable hyperbaric environment within these two quite different pressure regimes.72 To the best of our knowledge, these were the first in situ high pressure observations of the behavior of neuronal network communication within rat hippocampal brain slices. At ambient pressure, the highest amplitude of the optically recorded voltage signal is observed only as a single pixel near the tip of the excitation electrode. Also, spreading of the signal does not extend very far along the CA3 to CA1 Schaffer collateral. Under hyperbaric conditions of , the neuronal voltage response is much stronger. The signal propagation along the CA3 to CA1 Schaffer collateral is now considerably extended, and there is a large region of maximum depolarization (represented in red in Fig. 7) that indicates semicoherent firing of a large population of neurons. Fig. 7Fluorescent image of a rat hippocampal slice obtained using the VSD method at ambient pressure and 32 atm, respectively, in the high pressure cell. Still images of neuronal transient assembly formation on a Schaffer collateral pathway of a rat hippocampal slice stained with VSD. The overall image is and each pixel provides an optical trace of differential fluorescence over time. The maximum signals are superimposed on the hippocampus image with the excitation electrode; the Schaffer collateral and dentate gyrus are easily seen. The amplitude of the optical signal is represented in pseudocolors with warmer colors illustrating a greater degree of membrane depolarization. Two electrical pulses of amplitude 60 V lasting 0.1 ms each, separated from each other by 60 ms, triggered spreading of the neuronal signal within the brain slice. The depolarization started at the stimulating electrode, with the first excitation pulse occurring 100 ms after starting the measurement, and spread along the CA3 to CA1 Schaffer collateral pathway. Under hyperbaric conditions (), the neuronal voltage response is much stronger, and the signal propagation along the CA3–CA1 Schaffer collateral is considerably extended. From Ref. 72. 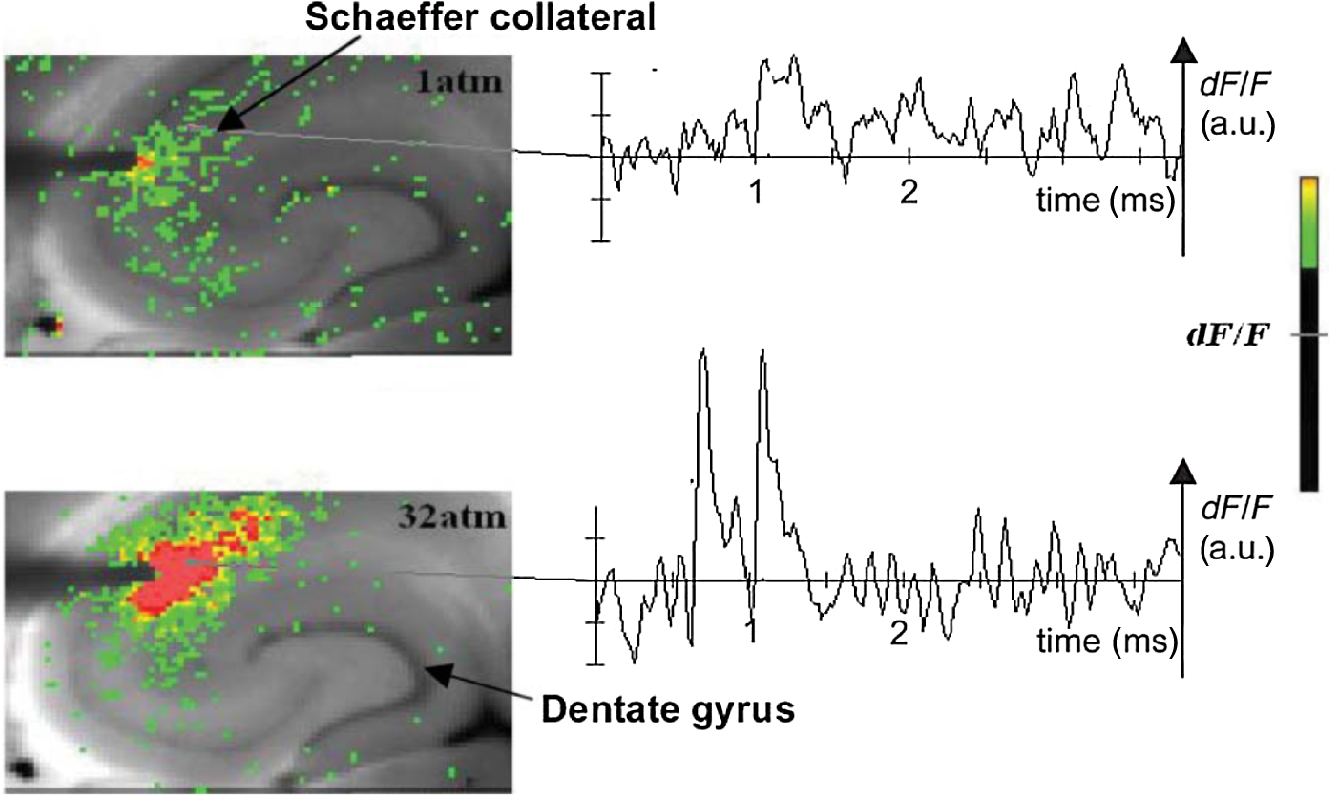 Following the recognition of hyperbaric effects on anesthesia and narcosis and of neurological syndromes related to human exposure to the high pressure environment, various theories have been proposed according to the assumed site and mode of their action within the neuronal cells. The lipid theory based on the Meyer–Overton correlations suggests that the neuronal lipid bilayer is the primary target site of anesthetic action.73,74 However, the anesthetic concentrations needed to produce relevant changes in membrane lipid properties would be highly toxic to the organism. It is now thought that ion channels and neurotransmitter receptor sites formed from protein complexes embedded within the neuronal cell membranes constitute the primary sites of anesthetic action.75,76 Discovery of the stereospecificity of certain anesthetics and their optical isomers, which are equally soluble in lipids, supports a protein-based theory of anesthetic action. The structures of CNS receptors are still not completely resolved, including their precise location in the neuronal membrane. Recent studies have revealed that Xe, like other noble gases with anesthetic potencies under elevated pressure, can occupy hydrophobic pockets buried within protein molecules. Once again, studies using VSDI might provide insights into the dynamic formation of neuronal complexes that may permit a link between bottom-up molecular-scale and top-down animal studies, where functional loss of consciousness with deepening anesthesia can be investigated directly. 7.Functional Role of Assemblies: Differentiating Light and Deep Levels of AnesthesiaGeneral anesthesia is clearly a useful tool to investigate the characteristics of neuronal assemblies since their action can be appreciated at both the “bottom up” level of functioning and the “top down” level of function. However, general anesthesia is not a unitary phenomenon but comprises several categories of brain states, each identifiable by specific patterns of spontaneous (mainly cortical) activity. Simultaneously, and perhaps as a consequence, the perception of incoming sensory inputs is abolished, despite evoked activity being readily detectable. Thus, as responses remain intact, different anesthetic states can be utilized to explore the state-dependency of sensory-evoked activity. There are two schools of thought pertinent to a study of assembly dynamics regarding the manner by which anesthetic agents can abolish consciousness and disrupt sensory inputs: neuronal-specificity and process-coherence theories. This distinction has been summarized in the debate on conscious states between Koch, arguing for neuronal-specificity, and Greenfield putting the case for process-coherence.77 Neuronal specificity theories state that the activity of structurally localizable groups of specific neurons is responsible for abolishing consciousness, whereas process-coherence theories posit that it is the pattern of activity within nonspecified neurons that is of crucial importance.78 A number of groups are investigating the former (e.g., see Ref. 79) and have found that different anesthetic agents have a common suppressive locus of action in thalamic and midbrain regions, indicating a disruption of ascending-activating and thalamocortical communication being necessary for anesthesia. Other groups dispute this “suppressive theory of action” due to the existence of anesthetics and unconscious states in which neural discharge rates are actually increased (e.g., chloralose and Viadril anesthesia and unconsciousness associated with epileptic seizures78,80). Unfortunately, there are few studies of process-coherence theories of anesthetics,81 largely due to our previous inability to study them. The application of VSDI is perfect for this purpose, not least since we have already observed the in vitro effects of anesthetics in prolonging neuronal assembly, independent of the anesthetic molecular structure. We have used anesthetics as a tool to further characterize the formation of neuronal assemblies, and ultimately their link to different functional states. Accordingly, we investigated the effects of increasing levels of anesthesia on the formation of neuronal assemblies in the rat somatosensory cortex in vivo. Both the anatomy and function of rat somatosensory cortex has been extensively studied; an added attribute of the whisker system is the discrete aggregations of cells (known as barrels) in the primary sensory cortex that correspond topographically to the pattern of whiskers on the rat’s snout (see Fig. 2 for the activation of barrels in vitro). This enables the evoked activity from a single whisker to be precisely localized to a specific area of cortex, allowing the spread of activity to be correlated to the anatomically defined barrel. We recorded somatosensory-evoked potentials (SEPs) simultaneously with VSDI (Fig. 8). Fig. 8Time course plots of SEP and VSDI responses during different states of anesthesia. (a) SEP responses. (b) VSDI responses; inset illustrates the timing of initial SEP and VSDI response components. Bold line, light anesthesia; dashed line, moderate anesthesia; dotted line, deep anesthesia. From Ref. 28. 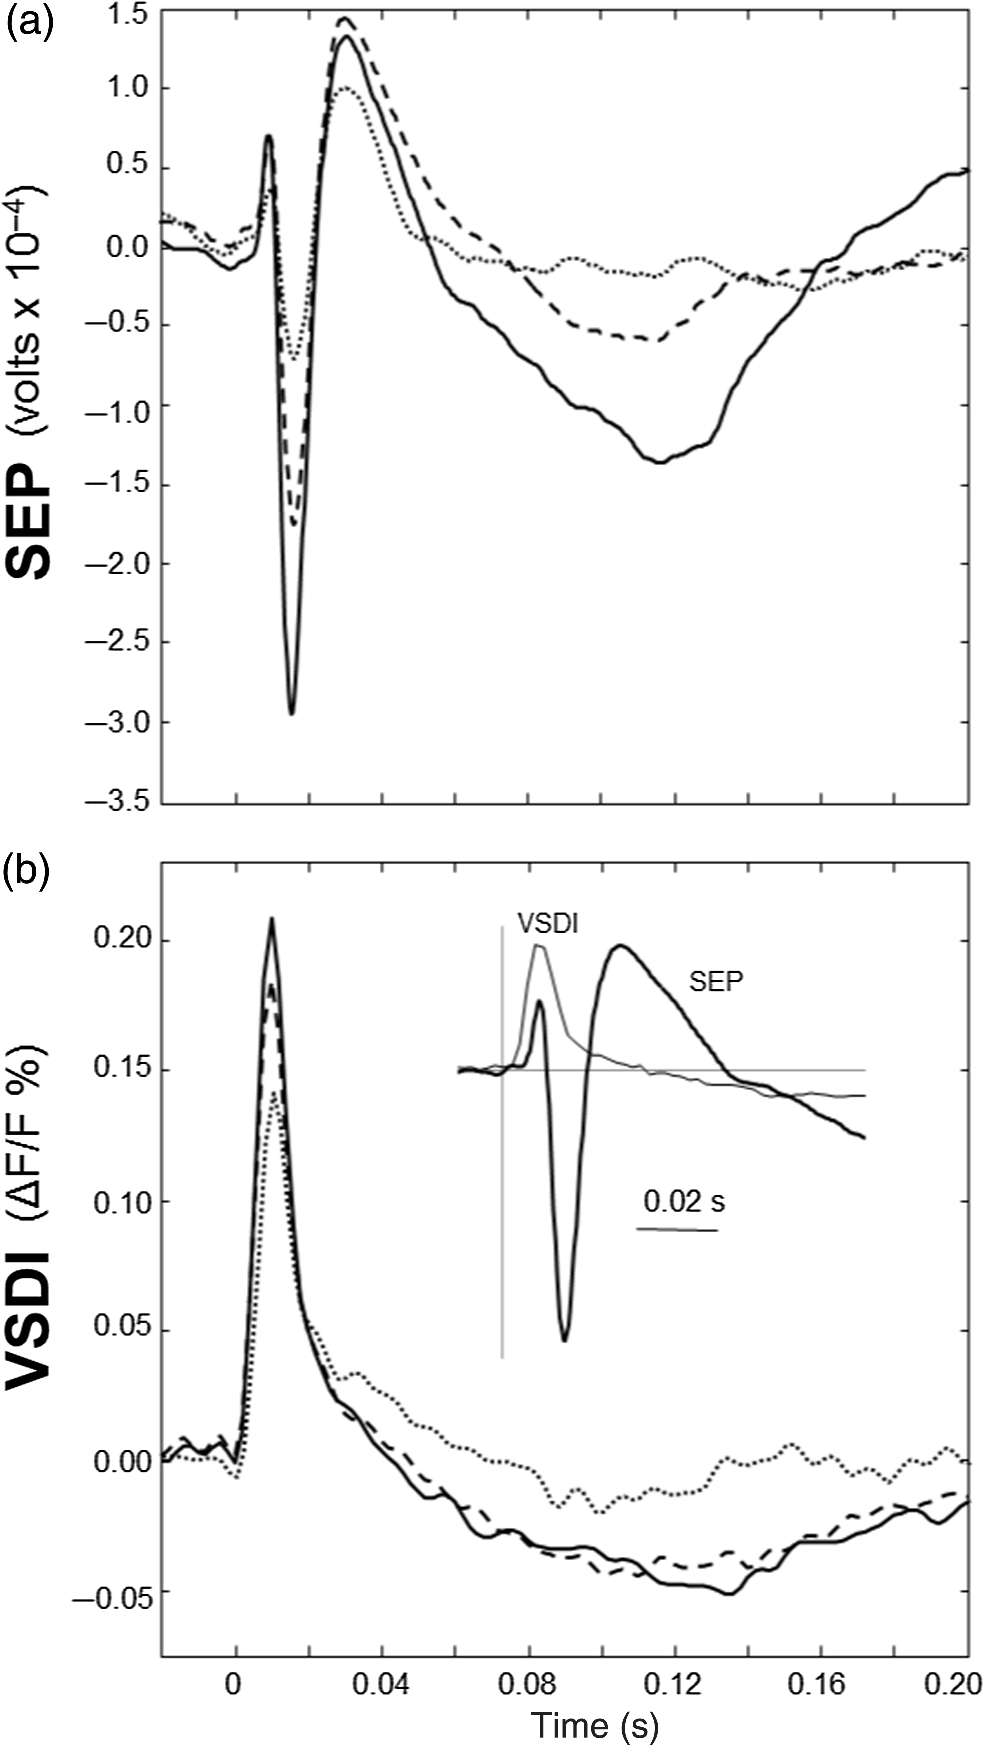 To combine the temporal response components above with the spatial response (Fig. 9) during light anesthesia, an initially localized area of activity gives way to more widespread activity that fills the whole image region within a relatively short period of time (). This is followed by an extensive hyperpolarization that occurs later in the activated barrel then elsewhere (see activity at 60 ms) and, in some regions, lasts up to 200 ms after stimulation onset. Spatial activity in deep anesthesia follows the same overall pattern of focal depolarization, propagation over the entire region and subsequent hyperpolarization, but differs in several ways to the response under light anesthesia: first, the initial depolarization is of a smaller amplitude [as noted during examination of the VSDI time course data from an area within the centre of the activation; Fig. 9(b)], which is consistent with other groups’ findings recorded with electrophysiology.82–86 Second, responses do not extend as widely; third, VSDI responses (but not SEP responses) exhibit significant prolonged activation resulting in a delayed return to baseline. More recent work has contradicted this and found that evoked responses in awake animals are far more extensive than those recorded during anesthesia,87,88 but these findings may be due to the dye-evoked artificial enhancement of evoked signals that we have previously reported,12 as acknowledged by Mohajerani et al.,89 which can enhance evoked responses but not spontaneous oscillations. And fourth, subsequent hyperpolarization is of a smaller amplitude than in light anesthesia and lasts for a shorter duration. Thus, the extensive hyperpolarization during light anesthesia—believed to return the system to a state of sensory readiness—is largely absent at deep levels of anesthesia. Indeed, when repeated sensory stimuli are presented, such as might occur when a rat is examining an object with its whiskers, there is greater fidelity of the pattern of inputs during light anesthesia.28 Accordingly, depths of anesthesia determine the capacity of the system to process and extract meaning from incoming information: in the lightest anesthesia, the response is sharpened in both time and space, conferring the most accurate characteristics of the physical stimulus. Fig. 9VSDI activation patterns evoked by stand-alone whisker stimulation during (a) light and (b) deep levels of anesthesia. Time after stimulus onset is displayed in upper right corners; note change in time intervals in second and third rows. Time course in the lower right corner of each panel illustrates the response from the centre of the image; tick marks beneath the plot illustrate the portions of the response that are shown in the images (interval between the first two ticks shown in images on the first row; interval between last two ticks in the expanded time images shown on the second and third rows). Color-map represents normalized change in the optical signal (data were normalized to the maximally activated pixel); the amplitude of the optical signal is represented in pseudocolors with warmer colors illustrating a greater degree of membrane depolarization. Data shown are averages from all animals with each image centralized on the pixel exhibiting the maximum response (). . From Ref. 28. 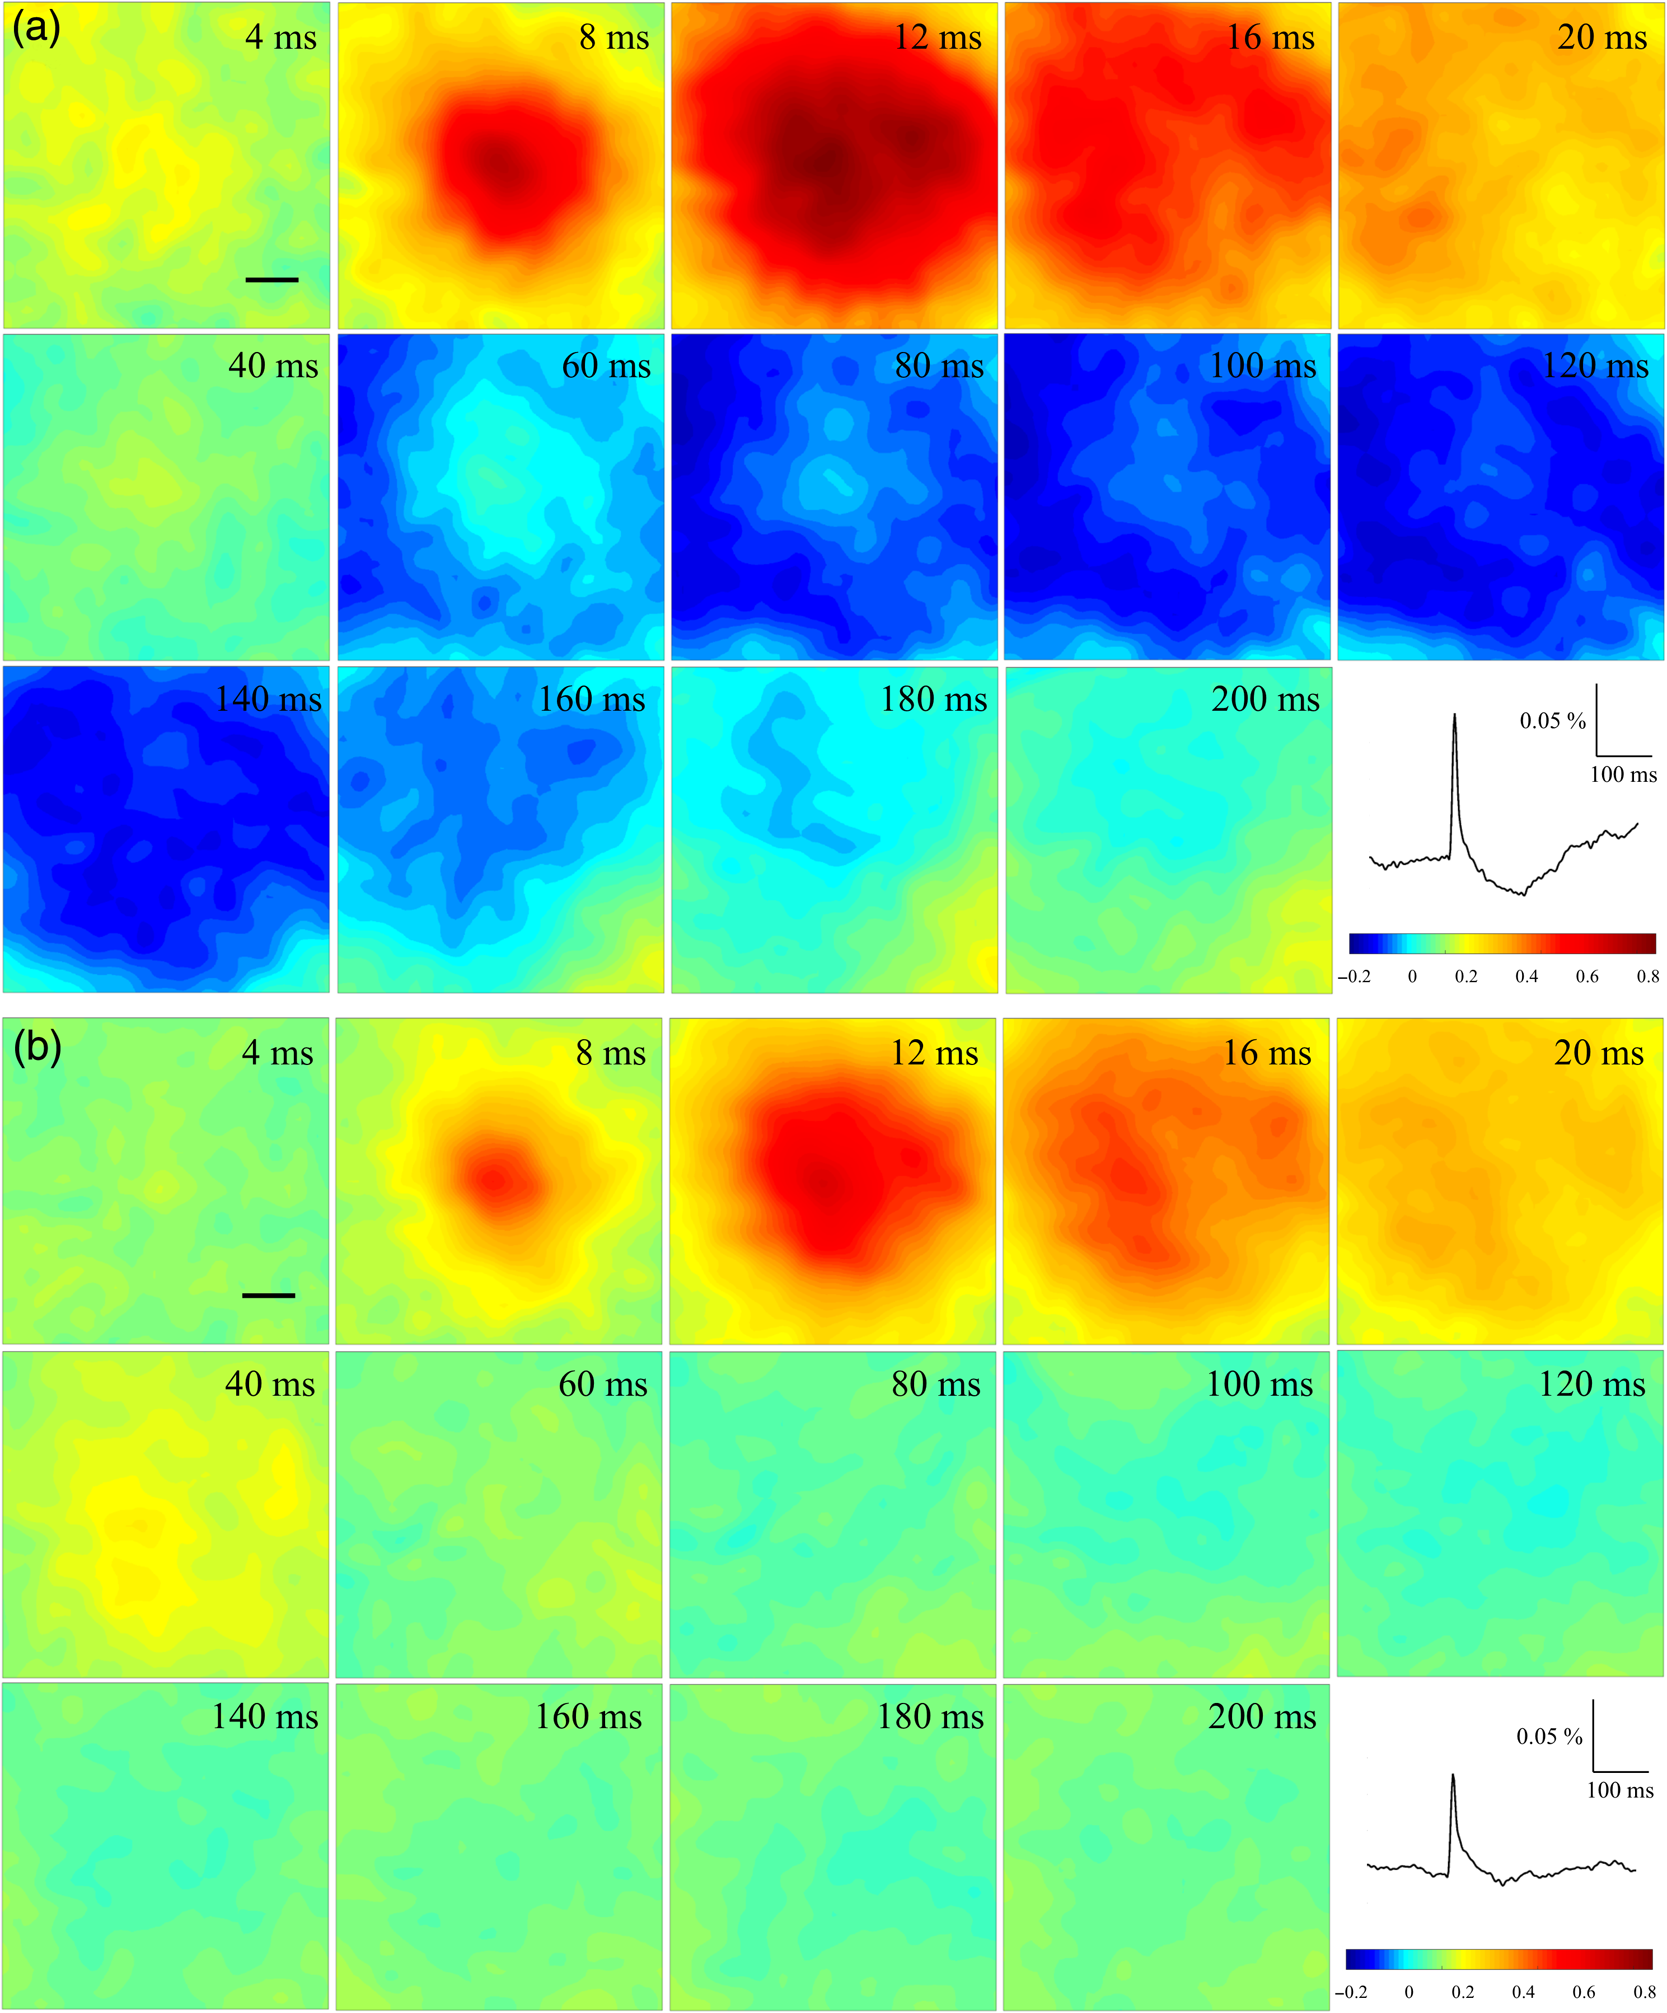 The effect of anesthesia to prolong response duration (reported above) has also been recorded in the isolated in vitro hippocampus;63 we thus speculate that response prolongation may be a more common effect of anesthesia and, in doing so, may sustain the brain in a state in which it remains unresponsive or interferes with incoming sensory information. We were also able to show that the reduction in amplitude of the assembly, during this period, did not change its relative intrinsic pattern of activity: the reduction in response amplitude during deep anesthesia relative to light anesthesia was constant across the area of activation, resulting in a global downscaling of the population response. Though the data presented here provide mere clues as to the action of anesthetics on the brain, given the importance of network states in a variety of neural functions, especially those that involve states of arousal,78,90,91 our incomplete understanding of the mechanisms underlying general anesthesia will no doubt be further improved with the application of imaging techniques, such as VSDI and the thorough examination of spatiotemporal components of brain activity. However, it is important to remember that VSDI is a technique, not a theory. In and of itself, it cannot generate falsifiable hypotheses,92 but it can reveal previously undiscovered possibilities in brain functioning, including the fullest possible profile of actions of erstwhile unfamiliar bioactive agents. 8.Applications for the Future: Extrapolating the “Bottom-Up” Action of New Bioactive Agents to “Top Down” ActionIn 2002, we identified a bioactive agent, cleaved from a very familiar enzyme, but exerting independent modulatory effects of possible relevance to the process of neurodegeneration.38 Acetylcholinesterase (AChE) is now acknowledged to have a secondary, nonenzymatic function independent of cholinergic transmission. In the last decade, the salient part of the molecule has been identified, i.e., a 14 amino acid peptide fragment (T14), deriving from the C-terminus of AChE: this peptide is bioactive in a range of preparations and acts at an allosteric site on the nicotinic acetylcholine receptor (-nAChR).93 To conduct such experiments using this peptide, a synthetic version of the peptide was made either as the salient 14 amino acid fragment (referred to as “T14”),24,94 or as a longer and more stable peptide which contained the T14 (termed “T30”).25,95 Additionally, some studies were conducted with both the T14 and T30, which all showed both synthetic peptides induced similar effects albeit more potently induced by T30 compared to those of T14.93,96 Badin et al.24 have used VSDI to provide further understanding into the spatial dynamics of the effects of the peptide (Fig. 10): T14 application had a facilitatory effect, i.e., increased the time-course of activation at submicromolar concentrations only (700 nM) without significantly affecting the spread of evoked assemblies. Moreover, coapplying T14 with the -nAChR competitive antagonist methyllycaconitine produced inhibition in activation synchrony not seen with either agent on their own, suggesting an additive inhibitory effect. In conclusion, the T14 peptide derived from AChE could be seen to produce a dose-dependent biphasic modulation of cortical networks activity dependent on the -nAChR: these findings should thus provide a more comprehensive insight into the immediate actions of a novel bioactive agent of high potential relevance to neurodegenerative disorders, such as Alzheimer’s disease. Fig. 10“Space–time” maps showing the time-course of evoked assembly activation. Qualitative effects of drug treatment on the time-course of assembly activation. Sample space–time maps from (a) T14, (b) methyllycaconitine (MLA), (c) T14 followed by the addition of MLA, and (d) MLA then switched to T14 experiments are shown to illustrate the highly modulatory nature of T14’s effects on cortical networks. Each panel shows the activity of a 2-mm-long row of pixels (PR, 50 pixels in length, 1 pixel in width; each pixel is long; (i) lying over the RoI, along a 250-ms time-frame (stimulation occurs after 20 ms). Stimulation is depicted by the white dotted line seen on the space–time maps. Inset to panel (b): (i) bright field view of the slice in the recording bath with electrode set in layer II/III of the ; each axis is 100 pixels (4 mm) in length. (ii–v) Montage showing sequential activity of evoked responses in cortical slices at 3, 8, 13, and 18 ms after initial stimulating pulse (encapsulating the peak response component), illustrating the method by which space–time maps were compiled and displayed. The amplitude of the optical signal is represented in pseudocolors with warmer colors illustrating a greater degree of membrane depolarization. From Ref. 24. 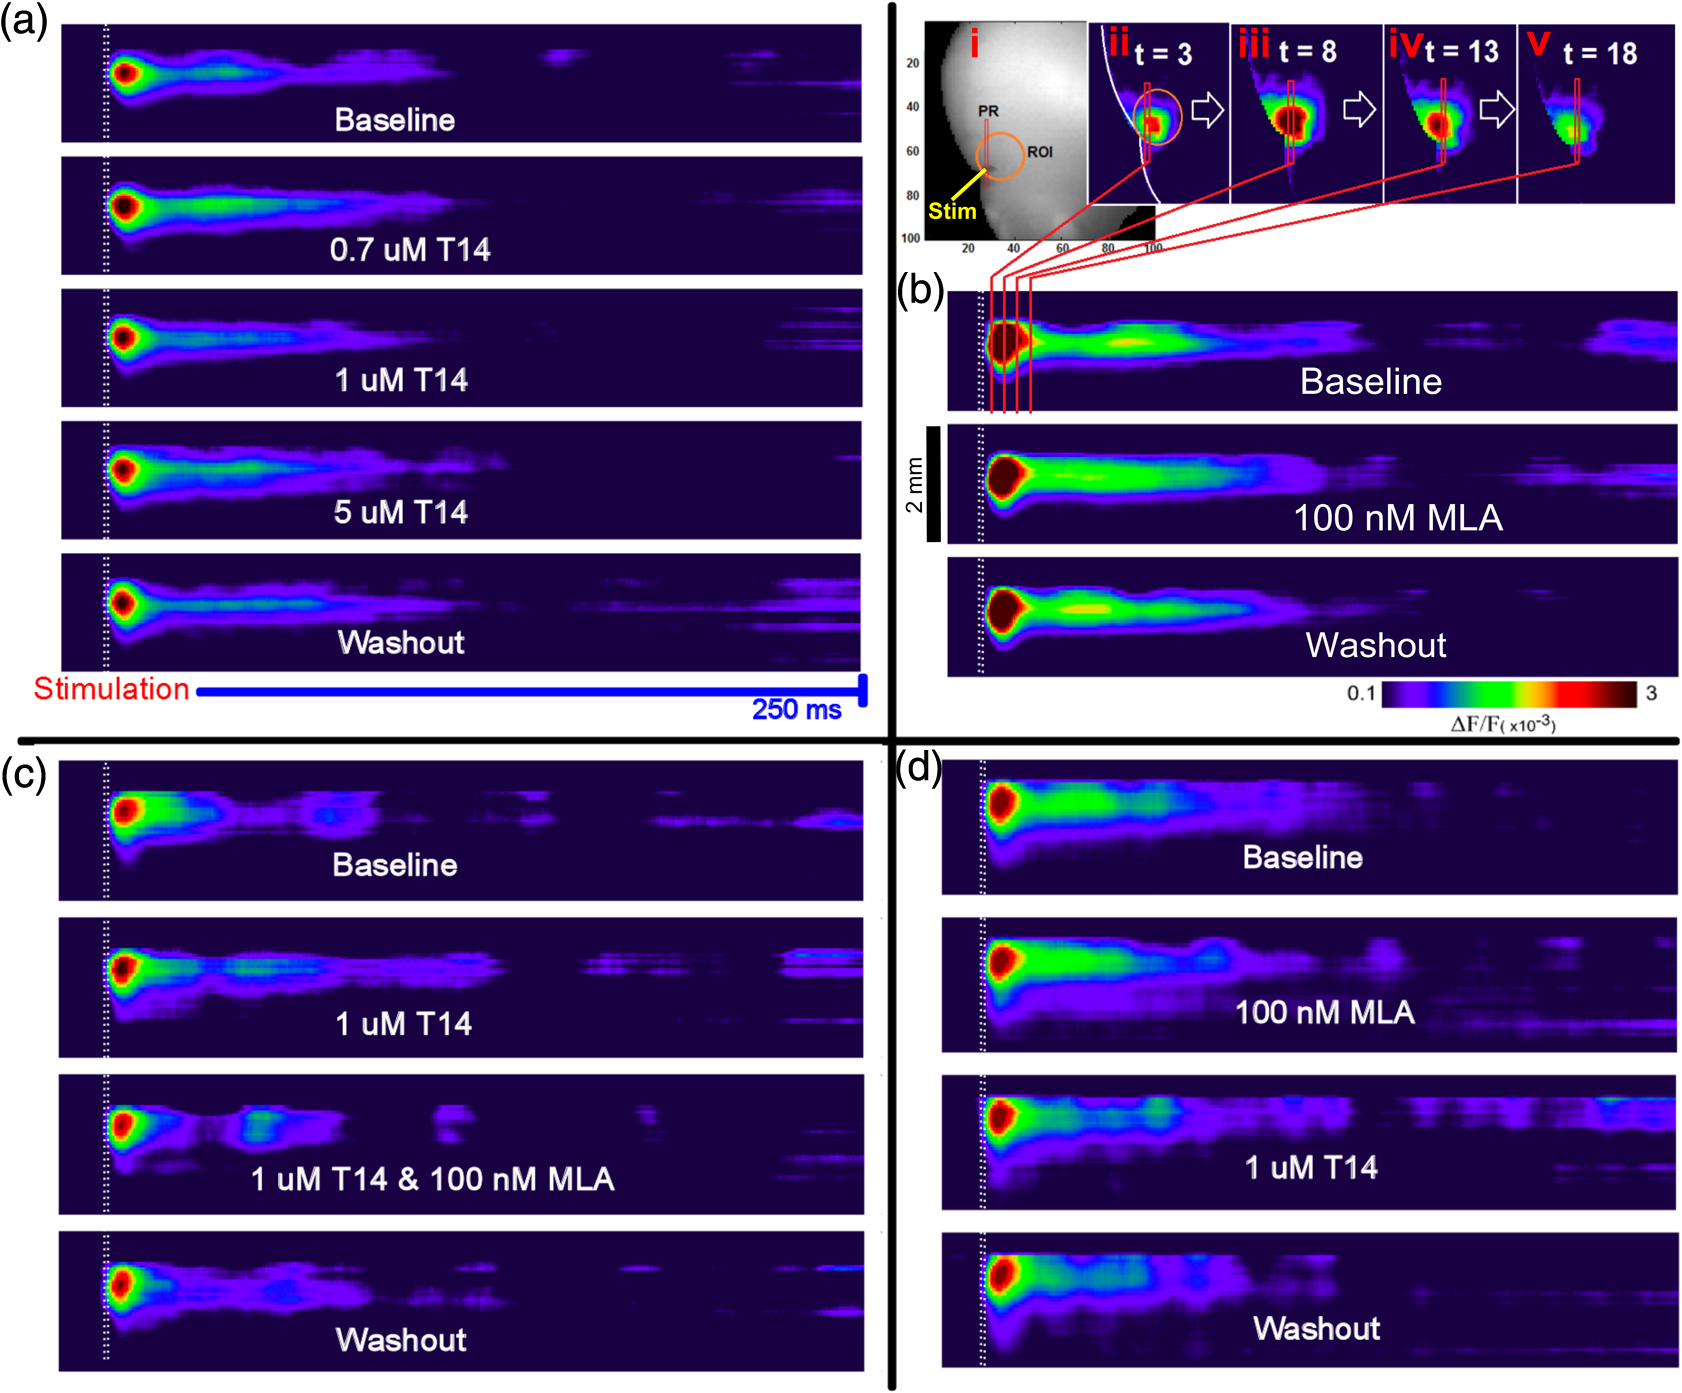 Given that the proposed mechanism of peptide-induced excitotoxicity would be of great relevance to Alzheimer’s disease, we subsequently tested its effects in brain slices containing basal forebrain, a major area from which cells are lost in Alzheimer’s disease:97 we observed a net reduction in the size of assemblies (Fig. 11). In young animals, such as those used here, where levels of endogenous AChE-peptide were found to be already high,25 the additive effect of exogenous peptide will inhibit calcium influx98,99 due to phosphorylation of the channels100 accounting for the apparently depressant effect observed. Fig. 11Effect of AChE-peptide application on mesoscale basal forebrain population dynamics and reversal using the candidate blocker NBP14. (a) Inhibition by T30 (, ) of p14 basal forebrain long-latency population activity recorded during two consecutive epochs, displayed as (i) averaged time series, (ii) space–time maps, and (iii) resulting bar graph of summed fluorescence across the three experimental conditions. (b) Reversal of T30 inhibitory effects after coperfusion with the blocker NBP14 (), shown as averaged time series, representative averaged space–time maps (i and ii, ), and (iii) histogram of summed fluorescence (). Color bar units: . The amplitude of the optical signal is represented in pseudocolors with warmer colors illustrating a greater degree of membrane depolarization. *; ***; ****; n.s., nonsignificant. Modified and adapted from Ref. 25. 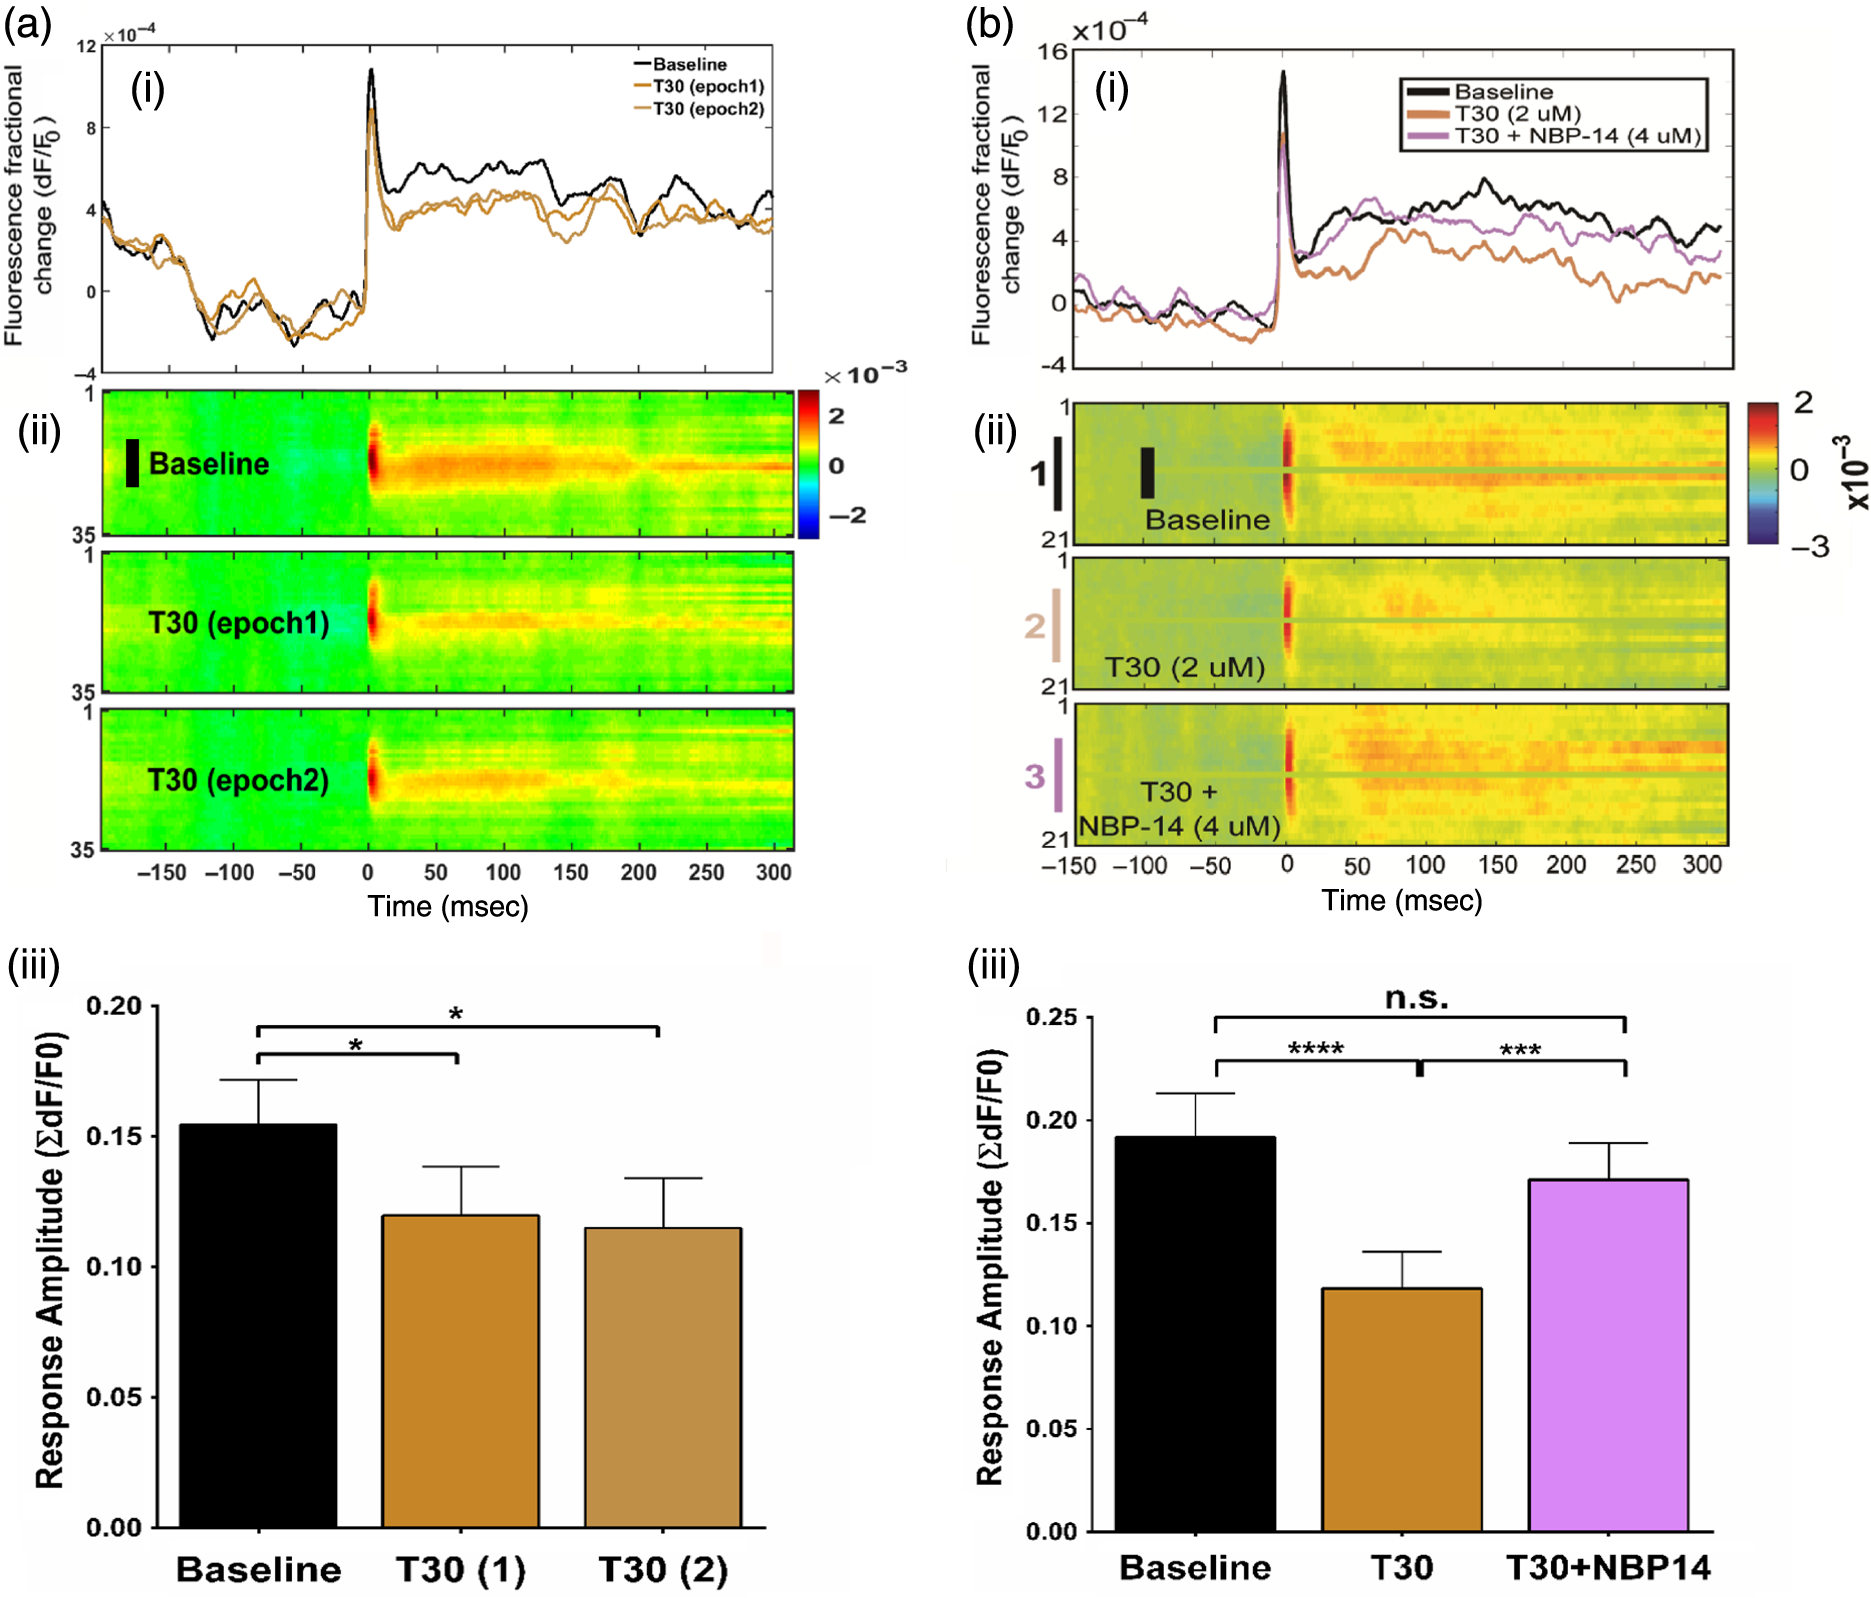 In an attempt to progress the development of effective drugs for halting the neurodegenerative process, we also tested whether a molecular variant would act as an antagonist, i.e., a cyclized variant of the active motif of AChE-peptide: “NBP14.”95 The practice of cyclization of compounds to improve their stability is not new101 and has been exploited previously as a therapeutic strategy.102,103 However, to the best of our knowledge, cyclization of a peptide to act as a blocker of its endogenous, linear counterpart in relation to neurodegenerative disorders, is unprecedented. In studies on cell cultures, NBP14 proved a potent blocker of the effects of its linear counterpart, but such studies could be considered insufficiently physiological. Hence, we investigated the effects of NBP14 on the peptide-induced reduction in assembly size, and indeed observed a reversal of the effect (Fig. 11). As well as proving a powerful tool for screening drugs in real-time and revealing the action of signaling agents, VSDI of neuronal assemblies might provide a wider perspective still. 9.Applications for the Future: Linking “Bottom-Up” Mechanisms of Neuronal Signalling with “Top-Down” ConsciousnessNeuronal assemblies represent the manifestation of transient activation of multiple neuronal networks: each includes hundreds of thousands of cells which activate together,6 and so it could be the case that, in addition to classic synaptic transmission, they need to engage a range of signaling mechanisms operating over the widest possible range of spatiotemporal scales. We have recently identified three possible signaling processes that could contribute to assembly dynamics (Fig. 12): synaptic transmission, volume transmission, and electrotonic spread via gap junctions. Fig. 12Schematic diagram of the three forms of signaling required for the generation and maintenance of assemblies. (i) Dendrites (top left) can release bioactive agents, which diffuse nonspecifically, independent of action potential generation, over larger distances ( to mm); “volume transmission.” (ii) Synaptic transmission (top right) is the process by which a neuron immediately generates an action potential as soon as the electrochemical gradient between the inside and outside cell compartments changes past a specific threshold, usually due to external input from other neurons, or in some cases generated internally (spontaneous action potential firing). At the synapse, the action potential triggers the release of neurotransmitters, which diffuse across the synaptic cleft and bind to specific receptors on the postsynaptic cell, in turn gating/opening the respective target ion channels in the postsynaptic density; this mode of communication is fast, and target-specific. (iii) Gap junctions comprise a direct electrical link between two cells and allow current to flow freely from cell to cell, providing very fast transmission, yet with very steep decay dynamics. Together with the time variability of the stimulus, electrotonic spread favors the onset of self-sustained electromagnetic waves (EM transmission), which excite neighboring neurons faster and more widely than synaptic transmission alone. Taken together, and in the context of functional neuronal networks in vivo, the three modes of neuronal communication described above combine to generate mesoscopic neuronal activity patterns, which can vary according to differential weighting of the three components, in turn seen, with VSDI, as highly variable neuronal assemblies. From Ref. 16. 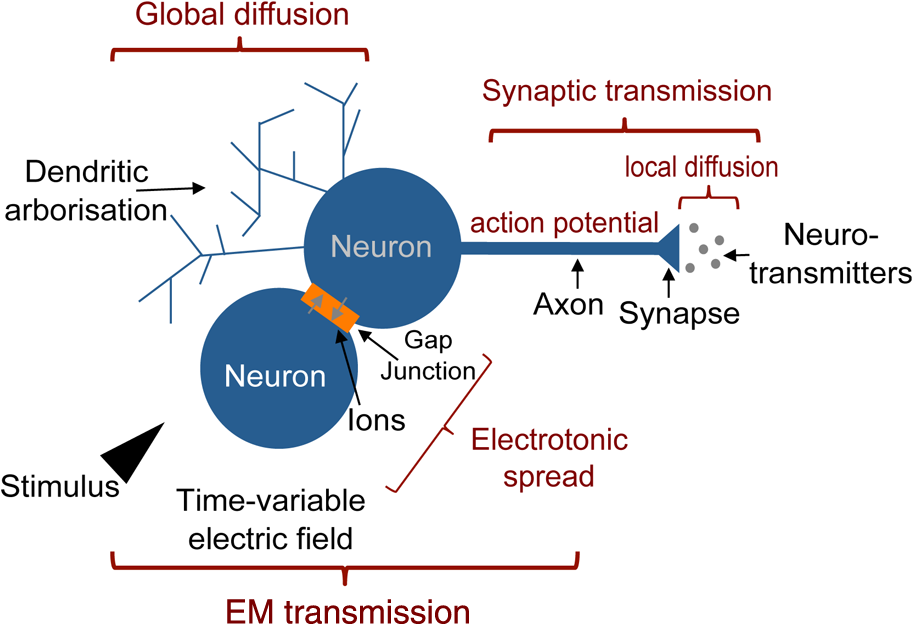 These three separate principles could each be at work determining the formation, duration, and decay of an assembly and have each been described with a specific physical model.16 However, it is hard to envisage how these three distinct mechanisms could in reality operate independently: rather, they are most likely to combine to different extents on different occasions to give rise to the general phenomenon we recognize as an assembly. In the future, by combining the three mechanisms above, predictions could eventually be made for the collective output from multiple individual assemblies across the holistic brain. This collective output could correspond to one-off, unique brain states, specifically a moment of consciousness, for the following reasons. First, neural activity only appears to contribute to a state of consciousness when it is sustained:104 this time-window is commensurate with the decay of an assembly, when the electrical potentials recorded in the brain are the same for reportedly “seen” versus “unseen” stimuli up until the crucial threshold of 270 ms.105,106 Second, anesthetics, which by definition abolish consciousness, significantly lengthen the duration of an individual assembly both in vivo29 and in vitro.63 Third, a time window of approximately this length demarcates the earliest spatial differentiation of different patterns in assemblies for subjective differentiation of sensory modalities.45 Fourth, the resultant intrinsic energy will need to be conserved in some chemical, electrical, or thermal form. In the case of heat, pressure will increase, and vice versa: perhaps, this could explain why increased pressure and hence an increase in thermal energy will lead to both the onset of consciousness in anesthetized animals107 as well as a massive increase in assembly size.72 These disparate empirical findings, each in themselves circumstantial, nonetheless in combination start to constitute a persuasive picture: as such, they could most readily be accommodated theoretically in the integration of multiple assemblies at the end of an epoch of some 250 to 300 ms into a “space–time manifold,” never previously applied to neuroscience, yet which in turn would offer a neuronal correlate for a moment of consciousness.62 Eventually therefore, this approach based on VSDI of assemblies could have the potential for quantification of a holistic brain state with a temporal and spatial resolution commensurate with neurophysiological and neurochemical events. 10.Technical DevelopmentsIn the last 20 years, investigators have turned to the use of genetically encoded voltage/calcium indicators, i.e., GEVIs and GECIs, respectively.108–110 This approach, of creating genetically encoded reporters of neuronal activity, provides a number of advantages including the ability of specifying the cell type(s) in which these indicators are expressed, the nontoxic nature of such dyes meaning they can indeed be used for experiments with protracted time courses (necessary for relating behavior to dynamic activity), in addition to the less invasive nature of experiments using such indicators (as there is no need for removal of the dura mater). GEVIs provide a useful tool in imaging the synaptic input entering a neuronal circuit, whereas data acquired using GECIs have been shown to report the resulting spiking output of neuronal networks.111 In turn, the input to a neuronal network (i.e., using GEVIs) provides an indication of its signal integration and processing dynamics,112 while monitoring network output using GECIs provides more focused indications as to the outcome of those computations.111 11.ConclusionsThe journey we have just made has been based on a narrow range of findings exclusively on the rat brain from a discrete set of brain regions and even then, primarily from our own lab: however, it is clear that only VSDI rather than conventional electrophysiology has the potential to differentiate diverse levels and stages of brain processes and thus reveal insights that conventional techniques could not. Assemblies, as visualized with optical imaging, clearly play an important role in a range of different functions from development to sensory processing to drug action, anesthesia, and hence eventually even consciousness. As such, we hypothesize that they provide a missing link in understanding top-down macroscale activity of specific brain regions and bottom-up neuronal networking that could revolutionize our perspectives within neuroscience: all this is only now possible due to voltage-sensitive dyes and hence in turn to the ground-breaking and ingenious work of Amiram Grinvald. We are indeed in his debt. DisclosuresThe authors declare competing financial interests: Susan Greenfield is the founder and CEO of Neuro-Bio Ltd. and holds shares in the company. Antoine-Scott Badin and Giovanni Ferrati are employees of Neuro-Bio Ltd. and Ian Devonshire has received remuneration for work undertaken for Neuro-Bio Ltd. AcknowledgmentsThe research described in this article was funded by the Templeton Foundation, the Royal Society, the Wolfson Foundation, the Engineering and Physical Sciences Research Council, the Mind Science Foundation, the Arete Initiative at the University of Chicago, the James Martin 21st Century School, and the European Society of Anesthesiology. The work involving NBP14 is covered by patent applications WO 2015/004430 and GB1505239.2. ReferencesH. S. Orbach, L. B. Cohen and A. Grinvald,
“Optical mapping of electrical activity in rat somatosensory and visual cortex,”
J. Neurosci., 5 1886
–1895
(1985). JNRSDS 0270-6474 Google Scholar
A. Grinvald et al.,
“Imaging the dynamics of mammalian neocortical population activity in-vivo,”
Adv. Exp. Med. Biol., 859 243
–271
(2015). http://dx.doi.org/10.1007/978-3-319-17641-3_10 AEMBAP 0065-2598 Google Scholar
A. Grinvald and C. C. H. Petersen,
“Imaging the dynamics of neocortical population activity in behaving and freely moving mammals,”
Adv. Exp. Med. Biol., 859 273
–296
(2015). http://dx.doi.org/10.1007/978-3-319-17641-3_11 AEMBAP 0065-2598 Google Scholar
E. S. Hill, A. M. Bruno and W. N. Frost,
“Recent developments in VSD imaging of small neuronal networks,”
Learn. Mem., 21 499
–505
(2014). http://dx.doi.org/10.1101/lm.035964.114 Google Scholar
V. Tsytsarev et al.,
“Recent progress in voltage-sensitive dye imaging for neuroscience,”
J. Nanosci. Nanotechnol., 14 4733
–4744
(2014). http://dx.doi.org/10.1166/jnn.2014.9531 PACHASJNNOAR 0033-45451533-4880 Google Scholar
A. Grinvald et al.,
“Cortical point-spread function and long-range lateral interactions revealed by real-time optical imaging of macaque monkey primary visual cortex,”
J. Neurosci., 14 2545
–2568
(1994). JNRSDS 0270-6474 Google Scholar
L. M. Loew,
“Potentiometric dyes: imaging electrical activity of cell membranes,”
Pure Appl. Chem., 68 1405
–1409
(1996). http://dx.doi.org/10.1351/pac199668071405 Google Scholar
L. M. Loew et al.,
“A naphthyl analog of the aminostyryl pyridinium class of potentiometric membrane dyes shows consistent sensitivity in a variety of tissue, cell, and model membrane preparations,”
J. Membr. Biol., 130 1
–10
(1992). http://dx.doi.org/10.1007/BF00233734 JMBBBO 0022-2631 Google Scholar
P. Schaffer et al.,
“Di-4-ANEPPS causes photodynamic damage to isolated cardiomyocytes,”
Pflugers Arch., 426 548
–551
(1994). http://dx.doi.org/10.1007/BF00378533 Google Scholar
D. Shoham et al.,
“Imaging cortical dynamics at high spatial and temporal resolution with novel blue voltage-sensitive dyes,”
Neuron, 24 791
–802
(1999). http://dx.doi.org/10.1016/S0896-6273(00)81027-2 NERNET 0896-6273 Google Scholar
H. Slovin et al.,
“Long-term voltage-sensitive dye imaging reveals cortical dynamics in behaving monkeys,”
J. Neurophysiol., 88 3421
–3438
(2002). http://dx.doi.org/10.1152/jn.00194.2002 JONEA4 0022-3077 Google Scholar
T. H. Grandy, S. A. Greenfield and I. M. Devonshire,
“An evaluation of in vivo voltage-sensitive dyes: pharmacological side effects and signal-to-noise ratios after effective removal of brain-pulsation artifacts,”
J. Neurophysiol., 108 2931
–2945
(2012). http://dx.doi.org/10.1152/jn.00512.2011 JONEA4 0022-3077 Google Scholar
J. C. Wester and D. Contreras,
“Differential modulation of spontaneous and evoked thalamocortical network activity by acetylcholine level in vitro,”
J. Neurosci., 33 17951
–17966
(2013). http://dx.doi.org/10.1523/JNEUROSCI.1644-13.2013 JNRSDS 0270-6474 Google Scholar
N. Koganezawa et al.,
“Excitatory postrhinal projections to principal cells in the medial entorhinal cortex,”
J. Neurosci., 35 15860
–15874
(2015). http://dx.doi.org/10.1523/JNEUROSCI.0653-15.2015 JNRSDS 0270-6474 Google Scholar
Q. Tang et al.,
“In vivo voltage-sensitive dye imaging of subcortical brain function,”
Sci. Rep., 5 17325
(2015). http://dx.doi.org/10.1038/srep17325 SRCEC3 2045-2322 Google Scholar
A.-S. P. Badin, F. Fermani and S. A. Greenfield,
“The features and functions of neuronal assemblies: possible dependency on mechanisms beyond synaptic transmission,”
Front. Neural Circuits, 10 114
(2017). http://dx.doi.org/10.3389/FNCIR.2016.00114 Google Scholar
E. B. Bourgeois et al.,
“A toolbox for spatiotemporal analysis of voltage-sensitive dye imaging data in brain slices,”
PLoS One, 9 e108686
(2014). http://dx.doi.org/10.1371/journal.pone.0108686 POLNCL 1932-6203 Google Scholar
J. K. Miller et al.,
“Visual stimuli recruit intrinsically generated cortical ensembles,”
Proc. Natl. Acad. Sci., 111 E4053
–E4061
(2014). http://dx.doi.org/10.1073/pnas.1406077111 Google Scholar
H. Homayoun and B. Moghaddam,
“NMDA receptor hypofunction produces opposite effects on prefrontal cortex interneurons and pyramidal neurons,”
J. Neurosci., 27 11496
–11500
(2007). http://dx.doi.org/10.1523/JNEUROSCI.2213-07.2007 JNRSDS 0270-6474 Google Scholar
H. Hampel et al.,
“Core biological marker candidates of Alzheimer’s disease—perspectives for diagnosis, prediction of outcome and reflection of biological activity,”
J. Neural Transm., 111 247
–272
(2004). http://dx.doi.org/10.1007/s00702-003-0065-z Google Scholar
M. Filion and L. Tremblay,
“Abnormal spontaneous activity of globus pallidus neurons in monkeys with MPTP-induced parkinsonism,”
Brain Res., 547 142
–151
(1991). http://dx.doi.org/10.1016/0006-8993(91)90585-J Google Scholar
S. Murakami and Y. Okada,
“Contributions of principal neocortical neurons to magnetoencephalography and electroencephalography signals,”
J. Physiol., 575 925
–936
(2006). http://dx.doi.org/10.1113/jphysiol.2006.105379 JPHYA7 0022-3751 Google Scholar
J. O’Kusky and M. Colonnier,
“A laminar analysis of the number of neurons, glia, and synapses in the visual cortex (area 17) of adult macaque monkeys,”
J. Comput. Neurol., 210 278
–290
(1982). http://dx.doi.org/10.1002/cne.902100307 Google Scholar
A.-S. Badin, J. Eraifej and S. Greenfield,
“High-resolution spatio-temporal bioactivity of a novel peptide revealed by optical imaging in rat orbitofrontal cortex in vitro: possible implications for neurodegenerative diseases,”
Neuropharmacology, 73 10
–18
(2013). http://dx.doi.org/10.1016/j.neuropharm.2013.05.019 NEPHBW 0028-3908 Google Scholar
A.-S. Badin et al.,
“Physiological profiling of an endogenous peptide in the basal forebrain: age-related bioactivity and blockade with a novel modulator,”
Neuropharmacology, 105 47
–60
(2016). http://dx.doi.org/10.1016/j.neuropharm.2016.01.012 NEPHBW 0028-3908 Google Scholar
C. C. Petersen and B. Sakmann,
“Functionally independent columns of rat somatosensory barrel cortex revealed with voltage-sensitive dye imaging,”
J. Neurosci., 21 8435
–8446
(2001). JNRSDS 0270-6474 Google Scholar
R. Yuste, D. W. Tank and D. Kleinfeld,
“Functional study of the rat cortical microcircuitry with voltage-sensitive dye imaging of neocortical slices,”
Cereb. Cortex, 7 546
–558
(1997). 53OPAV 1047-3211 Google Scholar
I. M. Devonshire et al.,
“Effects of urethane anaesthesia on sensory processing in the rat barrel cortex revealed by combined optical imaging and electrophysiology,”
Eur. J. Neurosci., 32 786
–797
(2010). http://dx.doi.org/10.1111/j.1460-9568.2010.07322.x EJONEI 0953-816X Google Scholar
I. M. Devonshire et al.,
“Environmental enrichment differentially modifies specific components of sensory-evoked activity in rat barrel cortex as revealed by simultaneous electrophysiological recordings and optical imaging in vivo,”
Neuroscience, 170 662
–669
(2010). http://dx.doi.org/10.1016/j.neuroscience.2010.07.029 Google Scholar
C. C. H. Petersen, A. Grinvald and B. Sakmann,
“Spatiotemporal dynamics of sensory responses in layer of rat barrel cortex measured in vivo by voltage-sensitive dye imaging combined with whole-cell voltage recordings and neuron reconstructions,”
J. Neurosci., 23 1298
–1309
(2003). JNRSDS 0270-6474 Google Scholar
B. Kuhn, W. Denk and R. M. Bruno,
“In vivo two-photon voltage-sensitive dye imaging reveals top-down control of cortical layers 1 and 2 during wakefulness,”
Proc. Natl. Acad. Sci., 105 7588
–7593
(2008). http://dx.doi.org/10.1073/pnas.0802462105 Google Scholar
D. Golomb, X. J. Wang and J. Rinzel,
“Propagation of spindle waves in a thalamic slice model,”
J. Neurophysiol., 75 750
–769
(1996). JONEA4 0022-3077 Google Scholar
E. O. Mann and S. A. Greenfield,
“Novel modulatory mechanisms revealed by the sustained application of nicotine in the guinea-pig hippocampus in vitro,”
J. Physiol., 551 539
–550
(2003). http://dx.doi.org/10.1113/jphysiol.2003.045492 JPHYA7 0022-3751 Google Scholar
T. Tominaga et al.,
“Quantification of optical signals with electrophysiological signals in neural activities of Di-4-ANEPPS stained rat hippocampal slices,”
J. Neurosci. Methods, 102 11
–23
(2000). http://dx.doi.org/10.1016/S0165-0270(00)00270-3 JNMEDT 0165-0270 Google Scholar
T. Berger et al.,
“Combined voltage and calcium epifluorescence imaging in vitro and in vivo reveals subthreshold and suprathreshold dynamics of mouse barrel cortex,”
J. Neurophysiol., 97 3751
–3762
(2007). http://dx.doi.org/10.1152/jn.01178.2006 JONEA4 0022-3077 Google Scholar
D. S. Auld et al.,
“Alzheimer’s disease and the basal forebrain cholinergic system: relations to beta-amyloid peptides, cognition, and treatment strategies,”
Prog. Neurobiol., 68 209
–245
(2002). http://dx.doi.org/10.1016/S0301-0082(02)00079-5 PGNBA5 0301-0082 Google Scholar
J. T. Coyle, D. L. Price and M. R. DeLong,
“Alzheimer’s disease: a disorder of cortical cholinergic innervation,”
Science, 219 1184
–1190
(1983). http://dx.doi.org/10.1126/science.6338589 SCIEAS 0036-8075 Google Scholar
S. Greenfield and D. J. Vaux,
“Parkinson’s disease, Alzheimer’s disease and motor neurone disease: identifying a common mechanism,”
Neuroscience, 113 485
–492
(2002). http://dx.doi.org/10.1016/S0306-4522(02)00194-X Google Scholar
N. J. Woolf,
“Global and serial neurons form a hierarchically arranged interface proposed to underlie memory and cognition,”
Neuroscience, 74 625
–651
(1996). http://dx.doi.org/10.1016/0306-4522(96)00163-7 Google Scholar
N. A. Andreollo et al.,
“Rat’s age versus human’s age: what is the relationship?,”
Arq. Bras. Cir. Dig., 25 49
–51
(2012). http://dx.doi.org/10.1590/S0102-67202012000100011 Google Scholar
J. L. Nuñez et al.,
“Myelination in the splenium of the corpus callosum in adult male and female rats,”
Brain Res. Dev. Brain Res., 120 87
–90
(2000). http://dx.doi.org/10.1016/S0165-3806(99)00193-5 Google Scholar
W. Denk, J. H. Strickler and W. W. Webb,
“Two-photon laser scanning fluorescence microscopy,”
Science, 248 73
–76
(1990). http://dx.doi.org/10.1126/science.2321027 SCIEAS 0036-8075 Google Scholar
M. N. Rossor,
“Parkinson’s disease and Alzheimer’s disease as disorders of the isodendritic core,”
Br. Med. J., 283 1588
–1590
(1981). http://dx.doi.org/10.1136/bmj.283.6306.1588 BMJOAE 0007-1447 Google Scholar
T. Binzegger, R. J. Douglas and K. A. C. Martin,
“A quantitative map of the circuit of cat primary visual cortex,”
J. Neurosci., 24 8441
–8453
(2004). http://dx.doi.org/10.1523/JNEUROSCI.1400-04.2004 JNRSDS 0270-6474 Google Scholar
S. Chakraborty, A. Sandberg and S. A. Greenfield,
“Differential dynamics of transient neuronal assemblies in visual compared to auditory cortex,”
Exp. Brain Res., 182 491
–498
(2007). http://dx.doi.org/10.1007/s00221-007-1008-y EXBRAP 0014-4819 Google Scholar
A. J. Rockel, R. W. Hiorns and T. P. Powell,
“The basic uniformity in structure of the neocortex,”
Brain, 103 221
–244
(1980). http://dx.doi.org/10.1093/brain/103.2.221 BRAIAK 0006-8950 Google Scholar
S. LeVay and C. D. Gilbert,
“Laminar patterns of geniculocortical projection in the cat,”
Brain Res., 113 1
–19
(1976). http://dx.doi.org/10.1016/0006-8993(76)90002-0 Google Scholar
P. H. Smith and L. C. Populin,
“Fundamental differences between the thalamocortical recipient layers of the cat auditory and visual cortices,”
J. Comput. Neurol., 436 508
–519
(2001). http://dx.doi.org/10.1002/(ISSN)1096-9861 Google Scholar
C. L. Huang and J. A. Winer,
“Auditory thalamocortical projections in the cat: laminar and areal patterns of input,”
J. Comput. Neurol., 427 302
–331
(2000). http://dx.doi.org/10.1002/(ISSN)1096-9861 Google Scholar
H. M. Cooper, M. Herbin and E. Nevo,
“Visual system of a naturally microphthalmic mammal: the blind mole rat, Spalax ehrenbergi,”
J. Comput. Neurol., 328 313
–350
(1993). http://dx.doi.org/10.1002/(ISSN)1096-9861 Google Scholar
G. Bronchti et al.,
“Auditory activation of ‘visual’ cortical areas in the blind mole rat (Spalax ehrenbergi),”
Eur. J. Neurosci., 16 311
–329
(2002). http://dx.doi.org/10.1046/j.1460-9568.2002.02063.x EJONEI 0953-816X Google Scholar
P. Heil et al.,
“Invasion of visual cortex by the auditory system in the naturally blind mole rat,”
Neuroreport, 2 735
–738
(1991). http://dx.doi.org/10.1097/00001756-199112000-00001 NERPEZ 0959-4965 Google Scholar
D. L. Hunt, E. N. Yamoah and L. Krubitzer,
“Multisensory plasticity in congenitally deaf mice: How are cortical areas functionally specified?,”
Neuroscience, 139 1507
–1524
(2006). http://dx.doi.org/10.1016/j.neuroscience.2006.01.023 Google Scholar
A. W. Roe et al.,
“A map of visual space induced in primary auditory cortex,”
Science, 250 818
–820
(1990). http://dx.doi.org/10.1126/science.2237432 SCIEAS 0036-8075 Google Scholar
L. von Melchner, S. L. Pallas and M. Sur,
“Visual behaviour mediated by retinal projections directed to the auditory pathway,”
Nature, 404 871
–876
(2000). http://dx.doi.org/10.1038/35009102 Google Scholar
B. Libet, E. W. Wright and C. A. Gleason,
“Preparation- or intention-to-act in relation to pre-event potentials recorded at the vertex,”
Electroencephalogr. Clin. Neurophysiol., 56 367
–372
(1983). http://dx.doi.org/10.1016/0013-4694(83)90262-6 ECNEAZ 0013-4694 Google Scholar
B. Libet, E. Wright and C. Gleason,
“Readiness-potentials preceding unrestricted ‘spontaneous’ vs. pre-planned voluntary acts,”
Electroencephalogr. Clin. Neurophysiol., 54 322
–335
(1982). http://dx.doi.org/10.1016/0013-4694(82)90181-X ECNEAZ 0013-4694 Google Scholar
G. H. Lubke et al.,
“Dependence of explicit and implicit memory on hypnotic state in trauma patients,”
Anesthesiology, 90 670
–680
(1999). http://dx.doi.org/10.1097/00000542-199903000-00007 ANESAV 0003-3022 Google Scholar
C. Kerssens et al.,
“Auditory information processing during adequate propofol anesthesia monitored by electroencephalogram bispectral index,”
Anesth. Analg., 92 1210
–1214
(2001). http://dx.doi.org/10.1097/00000539-200105000-00024 Google Scholar
D. J. Chalmers,
“On the search for the neural correlate of consciousness,”
Toward a Science of Consciousness, 219
–230 MIT Press, Cambridge, Massachusetts
(1998). Google Scholar
T. Metzinger, Neural Correlates of Consciousness: Empirical and Conceptual Questions, MIT Press, Cambridge, Massachusetts
(2000). http://dx.doi.org/10.1017/CBO9781107415324.004 Google Scholar
S. A. Greenfield, A Day in the Life of the Brain, Allen Lane, London, United Kingdom
(2016). Google Scholar
T. F. T. Collins et al.,
“Dynamics of neuronal assemblies are modulated by anaesthetics but not analgesics,”
Eur. J. Anesthesiol., 24 609
–614
(2007). http://dx.doi.org/10.1017/S026502150700004X Google Scholar
S. Bertrand et al.,
“The anticonvulsant, antihyperalgesic agent gabapentin is an agonist at brain gamma-aminobutyric acid type B receptors negatively coupled to voltage-dependent calcium channels,”
J. Pharmacol. Exp. Ther., 298 15
–24
(2001). JPETAB 0022-3565 Google Scholar
C. Pedroarena and R. Llinás,
“Dendritic calcium conductances generate high-frequency oscillation in thalamocortical neurons,”
Proc. Natl. Acad. Sci. U. S. A., 94 724
–728
(1997). http://dx.doi.org/10.1073/pnas.94.2.724 Google Scholar
R. Llinás et al.,
“The neuronal basis for consciousness,”
Philos. Trans. R. Soc. Lond. B. Biol. Sci., 353 1841
–1849
(1998). http://dx.doi.org/10.1098/rstb.1998.0336 PTRBAE 0962-8436 Google Scholar
P. Bennett and D. Elliott, The Physiology and Medicine of Diving, W.B. Saunders Co. Ltd.(1993). Google Scholar
J. R. Trudell, D. D. Koblin and E. I. Eger,
“A molecular description of how noble gases and nitrogen bind to a model site of anesthetic action,”
Anesth. Analg., 87 411
–418
(1998). http://dx.doi.org/10.1213/00000539-199808000-00034 Google Scholar
D. D. Koblin et al.,
“Minimum alveolar concentrations of noble gases, nitrogen, and sulfur hexafluoride in rats: helium and neon as nonimmobilizers (nonanesthetics),”
Anesth. Analg., 87 419
–424
(1998). http://dx.doi.org/10.1213/00000539-199808000-00035 Google Scholar
F. H. Johnson and E. A. Flagler,
“Hydrostatic pressure reversal of narcosis in tadpoles,”
Science, 112 91
–92
(1950). http://dx.doi.org/10.1126/science.112.2899.91-a SCIEAS 0036-8075 Google Scholar
D. L. Davies et al.,
“Ethanol potentiation of glycine receptors expressed in xenopus oocytes antagonized by increased atmospheric pressure,”
Alcohol Clin. Exp. Res., 27 743
–755
(2003). http://dx.doi.org/10.1097/01.ALC.0000065722.31109.A1 Google Scholar
A. Wlodarczyk, P. F. McMillan and S. A. Greenfield,
“High pressure effects in anaesthesia and narcosis,”
Chem. Soc. Rev., 35 890
–898
(2006). http://dx.doi.org/10.1039/b517771p CSRVBR 0306-0012 Google Scholar
H. Meyer,
“Zur Theorie der Alkoholnarkose,”
Arch. für Exp. Pathol. und Pharmakologie, 42 109
–118
(1899). http://dx.doi.org/10.1007/BF01834479 Google Scholar
C. E. Overton, Studien über die Narkose zugleich ein Beitrag zur allgemeinen Pharmakologie, Gustav Fischer, Jena, Germany
(1901). Google Scholar
N. P. Franks and W. R. Lieb,
“Molecular mechanisms of general anaesthesia,”
Nature, 300 487
–493
(1982). http://dx.doi.org/10.1038/300487a0 Google Scholar
N. P. Franks and W. R. Lieb,
“Molecular and cellular mechanisms of general anaesthesia,”
Nature, 367 607
–614
(1994). http://dx.doi.org/10.1038/367607a0 Google Scholar
C. Koch and S. Greenfield,
“How does consciousness happen?,”
Sci. Am., 297 76
–83
(2007). http://dx.doi.org/10.1038/scientificamerican1007-76 SCAMAC 0036-8733 Google Scholar
P. Cariani,
“Anesthesia, neural information processing, and conscious awareness,”
Conscious. Cogn., 9 387
–395
(2000). http://dx.doi.org/10.1006/ccog.1999.0420 Google Scholar
M. T. Alkire, R. J. Haier and J. H. Fallon,
“Toward a unified theory of narcosis: brain imaging evidence for a thalamocortical switch as the neurophysiologic basis of anesthetic-induced unconsciousness,”
Conscious. Cogn., 9 370
–386
(2000). http://dx.doi.org/10.1006/ccog.1999.0423 Google Scholar
H. H. Jasper, Brain and Conscious Experience, Springer, New York
(1965). Google Scholar
P. Århem, G. Klement and J. Nilsson,
“Mechanisms of anesthesia: towards integrating network, cellular, and molecular level modeling,”
Neuropsychopharmacology, 28 S40
–S47
(2003). http://dx.doi.org/10.1038/sj.npp.1300142 NEROEW 0893-133X Google Scholar
A. Angel and D. A. Gratton,
“The effect of anaesthetic agents on cerebral cortical responses in the rat,”
Br. J. Pharmacol., 76 541
–549
(1982). Google Scholar
M. Armstrong-James and M. J. George,
“Influence of anesthesia on spontaneous activity and receptive field size of single units in rat Sm1 neocortex,”
Exp. Neurol., 99 369
–387
(1988). http://dx.doi.org/10.1016/0014-4886(88)90155-0 EXNEAC 0014-4886 Google Scholar
I. Koyanagi and C. H. Tator,
“The effects of cortical stimulation, anesthesia and recording site on somatosensory evoked potentials in the rat,”
Electroencephalogr. Clin. Neurophysiol., 101 534
–542
(1996). ECNEAZ 0013-4694 Google Scholar
I. A. Erchova, M. A. Lebedev and M. E. Diamond,
“Somatosensory cortical neuronal population activity across states of anaesthesia,”
Eur. J. Neurosci., 15 744
–752
(2002). http://dx.doi.org/10.1046/j.0953-816x.2002.01898.x EJONEI 0953-816X Google Scholar
L. M. Antunes et al.,
“Comparison of electroencephalogram activity and auditory evoked responses during isoflurane and halothane anaesthesia in the rat,”
Vet. Anaesth. Analg., 30 15
–23
(2003). http://dx.doi.org/10.1046/j.1467-2995.2003.00085.x Google Scholar
I. Ferezou, S. Bolea and C. C. H. Petersen,
“Visualizing the cortical representation of whisker touch: voltage-sensitive dye imaging in freely moving mice,”
Neuron, 50 617
–629
(2006). http://dx.doi.org/10.1016/j.neuron.2006.03.043 NERNET 0896-6273 Google Scholar
I. Ferezou et al.,
“Spatiotemporal dynamics of cortical sensorimotor integration in behaving mice,”
Neuron, 56 907
–923
(2007). http://dx.doi.org/10.1016/j.neuron.2007.10.007 NERNET 0896-6273 Google Scholar
M. H. Mohajerani et al.,
“Spontaneous cortical activity alternates between motifs defined by regional axonal projections,”
Nat. Neurosci., 16 1426
–1435
(2013). http://dx.doi.org/10.1038/nn.3499 NANEFN 1097-6256 Google Scholar
K. D. Harris,
“Opinion: neural signatures of cell assembly organization,”
Nat. Rev. Neurosci., 6 399
–407
(2005). http://dx.doi.org/10.1038/nrn1669 NRNAAN 1471-003X Google Scholar
J. M. Krueger et al.,
“Sleep as a fundamental property of neuronal assemblies,”
Nat. Rev. Neurosci., 9 910
–919
(2008). http://dx.doi.org/10.1038/nrn2521 NRNAAN 1471-003X Google Scholar
K. R. Popper, The Logic of Scientific Discovery, Hutchinson & Co, London, United Kingdom
(1959). Google Scholar
S. Greenfield,
“Discovering and targeting the basic mechanism of neurodegeneration: the role of peptides from the C-terminus of acetylcholinesterase: non-hydrolytic effects of ache: the actions of peptides derived from the C-terminal and their relevance to neurodegeneration,”
Chem. Biol. Interact., 203 543
–546
(2013). http://dx.doi.org/10.1016/j.cbi.2013.03.015 Google Scholar
S. Greenfield,
“A peptide derived from acetylcholinesterase is a pivotal signalling molecule in neurodegeneration,”
Chem. Biol. Interact., 157–158 211
–218
(2005). http://dx.doi.org/10.1016/j.cbi.2005.10.032 Google Scholar
S. Garcia-Ratés et al.,
“Pharmacological profiling of a novel modulator of the nicotinic receptor: blockade of a toxic acetylcholinesterase-derived peptide increased in Alzheimer brains,”
Neuropharmacology, 105 487
–499
(2016). http://dx.doi.org/10.1016/j.neuropharm.2016.02.006 NEPHBW 0028-3908 Google Scholar
S. Garcia-Ratés et al.,
“Additive toxicity of -amyloid by a novel bioactive peptide in vitro: possible implications for Alzheimer’s disease,”
PLoS One, 8 e54864
(2013). http://dx.doi.org/10.1371/journal.pone.0054864 POLNCL 1932-6203 Google Scholar
T. H. Ferreira-Vieira et al.,
“Alzheimer’s disease: targeting the cholinergic system,”
Curr. Neuropharmacol., 14 101
–115
(2016). http://dx.doi.org/10.2174/1570159X13666150716165726 Google Scholar
C. L. M. Bon and S. A. Greenfield,
“Bioactivity of a peptide derived from acetylcholinesterase: electrophysiological characterization in guinea-pig hippocampus,”
Eur. J. Neurosci., 17 1991
–1995
(2003). http://dx.doi.org/10.1046/j.1460-9568.2003.02648.x EJONEI 0953-816X Google Scholar
S. A. Greenfield et al.,
“A novel peptide modulates alpha7 nicotinic receptor responses: implications for a possible trophic-toxic mechanism within the brain,”
J. Neurochem., 90 325
–331
(2004). http://dx.doi.org/10.1111/j.1471-4159.2004.02494.x JONRA9 0022-3042 Google Scholar
T. D. Plant and N. B. Standen,
“Calcium current inactivation in identified neurones of Helix aspersa,”
J. Physiol., 321 273
–285
(1981). http://dx.doi.org/10.1113/jphysiol.1981.sp013983 JPHYA7 0022-3751 Google Scholar
D. Goodwin, P. Simerska and I. Toth,
“Peptides as therapeutics with enhanced bioactivity,”
Curr. Med. Chem., 19 4451
–4461
(2012). http://dx.doi.org/10.2174/092986712803251548 CMCHE7 0929-8673 Google Scholar
D. Haworth et al.,
“Anti-inflammatory activity of c(ILDV-NH(CH2)5CO), a novel, selective, cyclic peptide inhibitor of VLA-4-mediated cell adhesion,”
Br. J. Pharmacol., 126 1751
–1760
(1999). http://dx.doi.org/10.1038/sj.bjp.0702511 Google Scholar
S. Hess et al.,
“Backbone cyclic peptidomimetic melanocortin-4 receptor agonist as a novel orally administrated drug lead for treating obesity,”
J. Med. Chem., 51 1026
–1034
(2008). http://dx.doi.org/10.1021/jm701093y JMCMAR 0022-2623 Google Scholar
T. Bachmann, Microgenetic Approach to the Conscious Mind, John Benjamins, Amsterdam, The Netherlands
(2000). Google Scholar
E. K. Vogel, S. J. Luck and K. L. Shapiro,
“Electrophysiological evidence for a postperceptual locus of suppression during the attentional blink,”
J. Exp. Psychol. Hum. Percept. Perform., 24 1656
–1674
(1998). http://dx.doi.org/10.1037/0096-1523.24.6.1656 JPHPDH 0096-1523 Google Scholar
C. Sergent, S. Baillet and S. Dehaene,
“Timing of the brain events underlying access to consciousness during the attentional blink,”
Nat. Neurosci., 8 1391
–1400
(2005). http://dx.doi.org/10.1038/nn1549 NANEFN 1097-6256 Google Scholar
J. J. Kendig, Y. Grossman and M. B. MacIver,
“Pressure reversal of anaesthesia: a synaptic mechanism,”
Br. J. Anaesth., 60 806
–816
(1988). http://dx.doi.org/10.1093/bja/60.7.806 BJANAD 0007-0912 Google Scholar
T. Knöpfel,
“Genetically encoded optical indicators for the analysis of neuronal circuits,”
Nat. Rev. Neurosci., 13 687
–700
(2012). http://dx.doi.org/10.1038/nrn3293 NRNAAN 1471-003X Google Scholar
T. Knöpfel, J. Díez-García and W. Akemann,
“Optical probing of neuronal circuit dynamics: genetically encoded versus classical fluorescent sensors,”
Trends Neurosci., 29 160
–166
(2006). http://dx.doi.org/10.1016/j.tins.2006.01.004 Google Scholar
M. S. Siegel and E. Y. Isacoff,
“A genetically encoded optical probe of membrane voltage,”
Neuron, 19 735
–741
(1997). http://dx.doi.org/10.1016/S0896-6273(00)80955-1 NERNET 0896-6273 Google Scholar
S. D. Antic, R. M. Empson and T. Knöpfel,
“Voltage imaging to understand connections and functions of neuronal circuits,”
J. Neurophysiol., 116 135
–152
(2016). http://dx.doi.org/10.1152/jn.00226.2016 JONEA4 0022-3077 Google Scholar
P. Poirazi, T. Brannon and B. W. Mel,
“Pyramidal neuron as two-layer neural network,”
Neuron, 37 989
–999
(2003). http://dx.doi.org/10.1016/S0896-6273(03)00149-1 NERNET 0896-6273 Google Scholar
BiographySusan A. Greenfield, CBE, received her DPhil in pharmacology from the University of Oxford and has held research fellowships at the University of Oxford, the College de France Paris, and NYU Medical Center. She is currently the founder and CEO of a biotech company (www.neuro-bio.com) that is developing a disruptive anti-Alzheimer treatment. Her awards include: 32 honorary degrees; an Honorary Fellowship of the Royal College of Physicians; and the L’Ordre National de la Légion d’Honneur. Antoine-Scott Badin received his BSc degree in neuroscience and pharmacology from the University of Edinburgh and has recently completed his DPhil at the University of Oxford. Whilst at Oxford he was based at Neuro-Bio Ltd., where his research used voltage-sensitive dye imaging to uncover the effects of anaesthetics and psychoactive substances on the dynamics of neuronal assemblies. Giovanni Ferrati studied neurobiology at the University of Turin and received his PhD from the Neuroscience Institute in Alicante using electrophysiology to study plasticity at thalamocortical synapses in the mouse whisker system. He is currently a postdoctoral researcher at Neuro-Bio Ltd., a biotech company developing novel treatments against Alzheimer’s disease, investigating the mechanisms underlying its onset and progression through optical and electrophysiological techniques. Ian M. Devonshire received his BSc and PhD degrees in neuroscience at the University of Sheffield with doctoral studies being performed in the laboratory of John Mayhew. He has held research fellowships at the Universities of Oxford and Nottingham where he has combined multimodal imaging techniques and electrophysiology to better understand cortical network dynamics and neural correlates of chronic pain. He is also coauthor of two books on neuroscience written for school and university educators. |


