|
|
1.IntroductionCoupling between cerebral blood flow (CBF), cerebral blood volume (CBV), and cerebral metabolic rate of oxygen () is an important primary function of the microcirculation,1,2 as the brain requires a continuous supply of glucose and oxygen () provided by CBF and blood oxygen content to meet cellular oxygen requirements.2 Identification of a causal relationship between relative cerebral blood volume (rCBV),–relative cerebral blood flow (rCBF), and relative cerebral metabolic rate of oxygen under resting physiological conditions in the neonatal brain could help to elucidate the principles of cortical hemodynamic function during development. High coupling between changes in CBF and CBV has been demonstrated in both resting state and stimulus-induced activity. The relationship between CBF and CBV has been shown to be adequately quantified by a simple power law equation in both steady state and dynamic state [Grubb’s law, which assumes a constant relationship between rCBF and rCBV: ].3 Several groups have observed different values of when measured during functional challenges.4 Under steady-state conditions, CBF and CBV have been shown to have steady values in response to a physiological challenge, such as hypercapnia or hypocapnia.3,5 Grubb’s exponent has often been measured under dynamic conditions during neural stimulation experiments, in which both CBF and CBV changed following stimulation.4 Previous stimulation studies have reported that CBV increased progressively during the first few seconds of stimulation, while CBF did not change. After several seconds, CBF started to increase much more rapidly than CBV and returned to baseline before CBV returned to baseline.6,7 Under resting-state conditions, the causality and nonlinear relationship between CBF and CBV changes can be used to determine whether CBV drives CBF or vice versa. Roy and Sherrington1 proposed the hypothesis of stimulus-induced increases in CBF driven by local metabolic demand. Strong coupling between CBF and is observed during neural stimulation in adults,8 but a mismatch in CBF-metabolism coupling was reported by Fox and Raichle,9 who described that, during neuronal activation, regional CBF increased by 50%, while increased by only 5%. In fact, CBF can increase in the absence of any significant variations of ,10 and inversely, can increase with no significant increase of CBF.11 Whether or not a precise coupling exists between CBF and during neural stimulation has been the subject of numerous studies in both adults12 and preterms.13,14 While the linear relationship between CBF and changes at the resting state has been demonstrated in adults,1 it remains a subject of debate in preterms.15 This study was designed to address whether rCBV drives rCBF in preterms or vice versa and to provide information about the directionality and causality between measured changes in rCBV and rCBF (also between evaluated and rCBF). We used the transfer entropy (TE) method based on information theory16 to evaluate the nonlinear interactions between rCBV–rCBF and in resting preterm infants. TE determines the intensity and direction of the relationship and the dominance between two discrete random variables17 (i.e., rCBF and ). Based on the concept of causality,18 we investigated a possible causal interaction between rCBF and rCBV by predictive analysis of time-series of rCBF (or rCBV) measurements by incorporating data from another previous rCBV (or rCBF) time-series. Near-infrared spectroscopy (NIRS)19 and diffuse correlation spectroscopy (DCS)20 are optical imaging techniques that noninvasively and repeatedly measure cerebral vascular parameters at the bedside in preterms.21,22 An NIRS device allows the monitoring of relative changes in ([HbT] () that is equivalent to relative changes in CBV. The relative changes in CBF are proportional to the relative changes in tissue blood flow related to the motion of red blood cells that can be measured by the DCS device.20 Estimation of by optical imaging requires measurement of rCBF and oxygen extraction fraction (OEF). According to Boas and Payne,23 CBF can be estimated from CBV by inverting Grubb’s equation, which allows to be estimated from CBV. To evaluate independently from rCBF, it required the calculation of by rCBV and OEF. This can be achieved due to the independent measurement of rCBV by NIRS and rCBF by DCS. Although Leung et al.24 suggested that Grubb’s relation cannot be inverted to estimate CBF from CBV. Using independent estimation of by rCBV,25 the causality investigation could be performed by analyzing the interactions between estimated (NIRS) and directly measured rCBF (DCS). rCBF and are linked in a complex way, notably they are affected by autoregulation mechanisms.26 These adaptive mechanisms act to preserve constant CBF over a range of blood pressures by adapting cerebrovascular resistances or vasodilation. The mechanisms of cerebral autoregulation in preterm infants remain unclear and may involve a combination of myogenic, neurogenic, and metabolic processes that regulate cerebrovascular resistance to maintain CBF.26 In the present study, we evaluate the possible relationships and causalities between rCBF, rCBV, and in resting state in preterms. 2.Materials and MethodsTen preterm neonates [six females; mean gestational age (GA) at birth: 28.5 weeks GA and four males; mean GA at birth: 27.5 weeks GA] were tested in the supine position (recording age: 31 wGA, Table 1). This study is part of the French public hospital Clinical Research Project (PHRC National). The study was approved by the Amiens University Hospital local ethics committee according to the guidelines of the Declaration of Helsinki of 1975 (CPP Nord-Ouest II-France IDRCB-2008-A00704-51). Parents were informed about the study and provided their written informed consent. Table 1Clinical features of the tested infants.
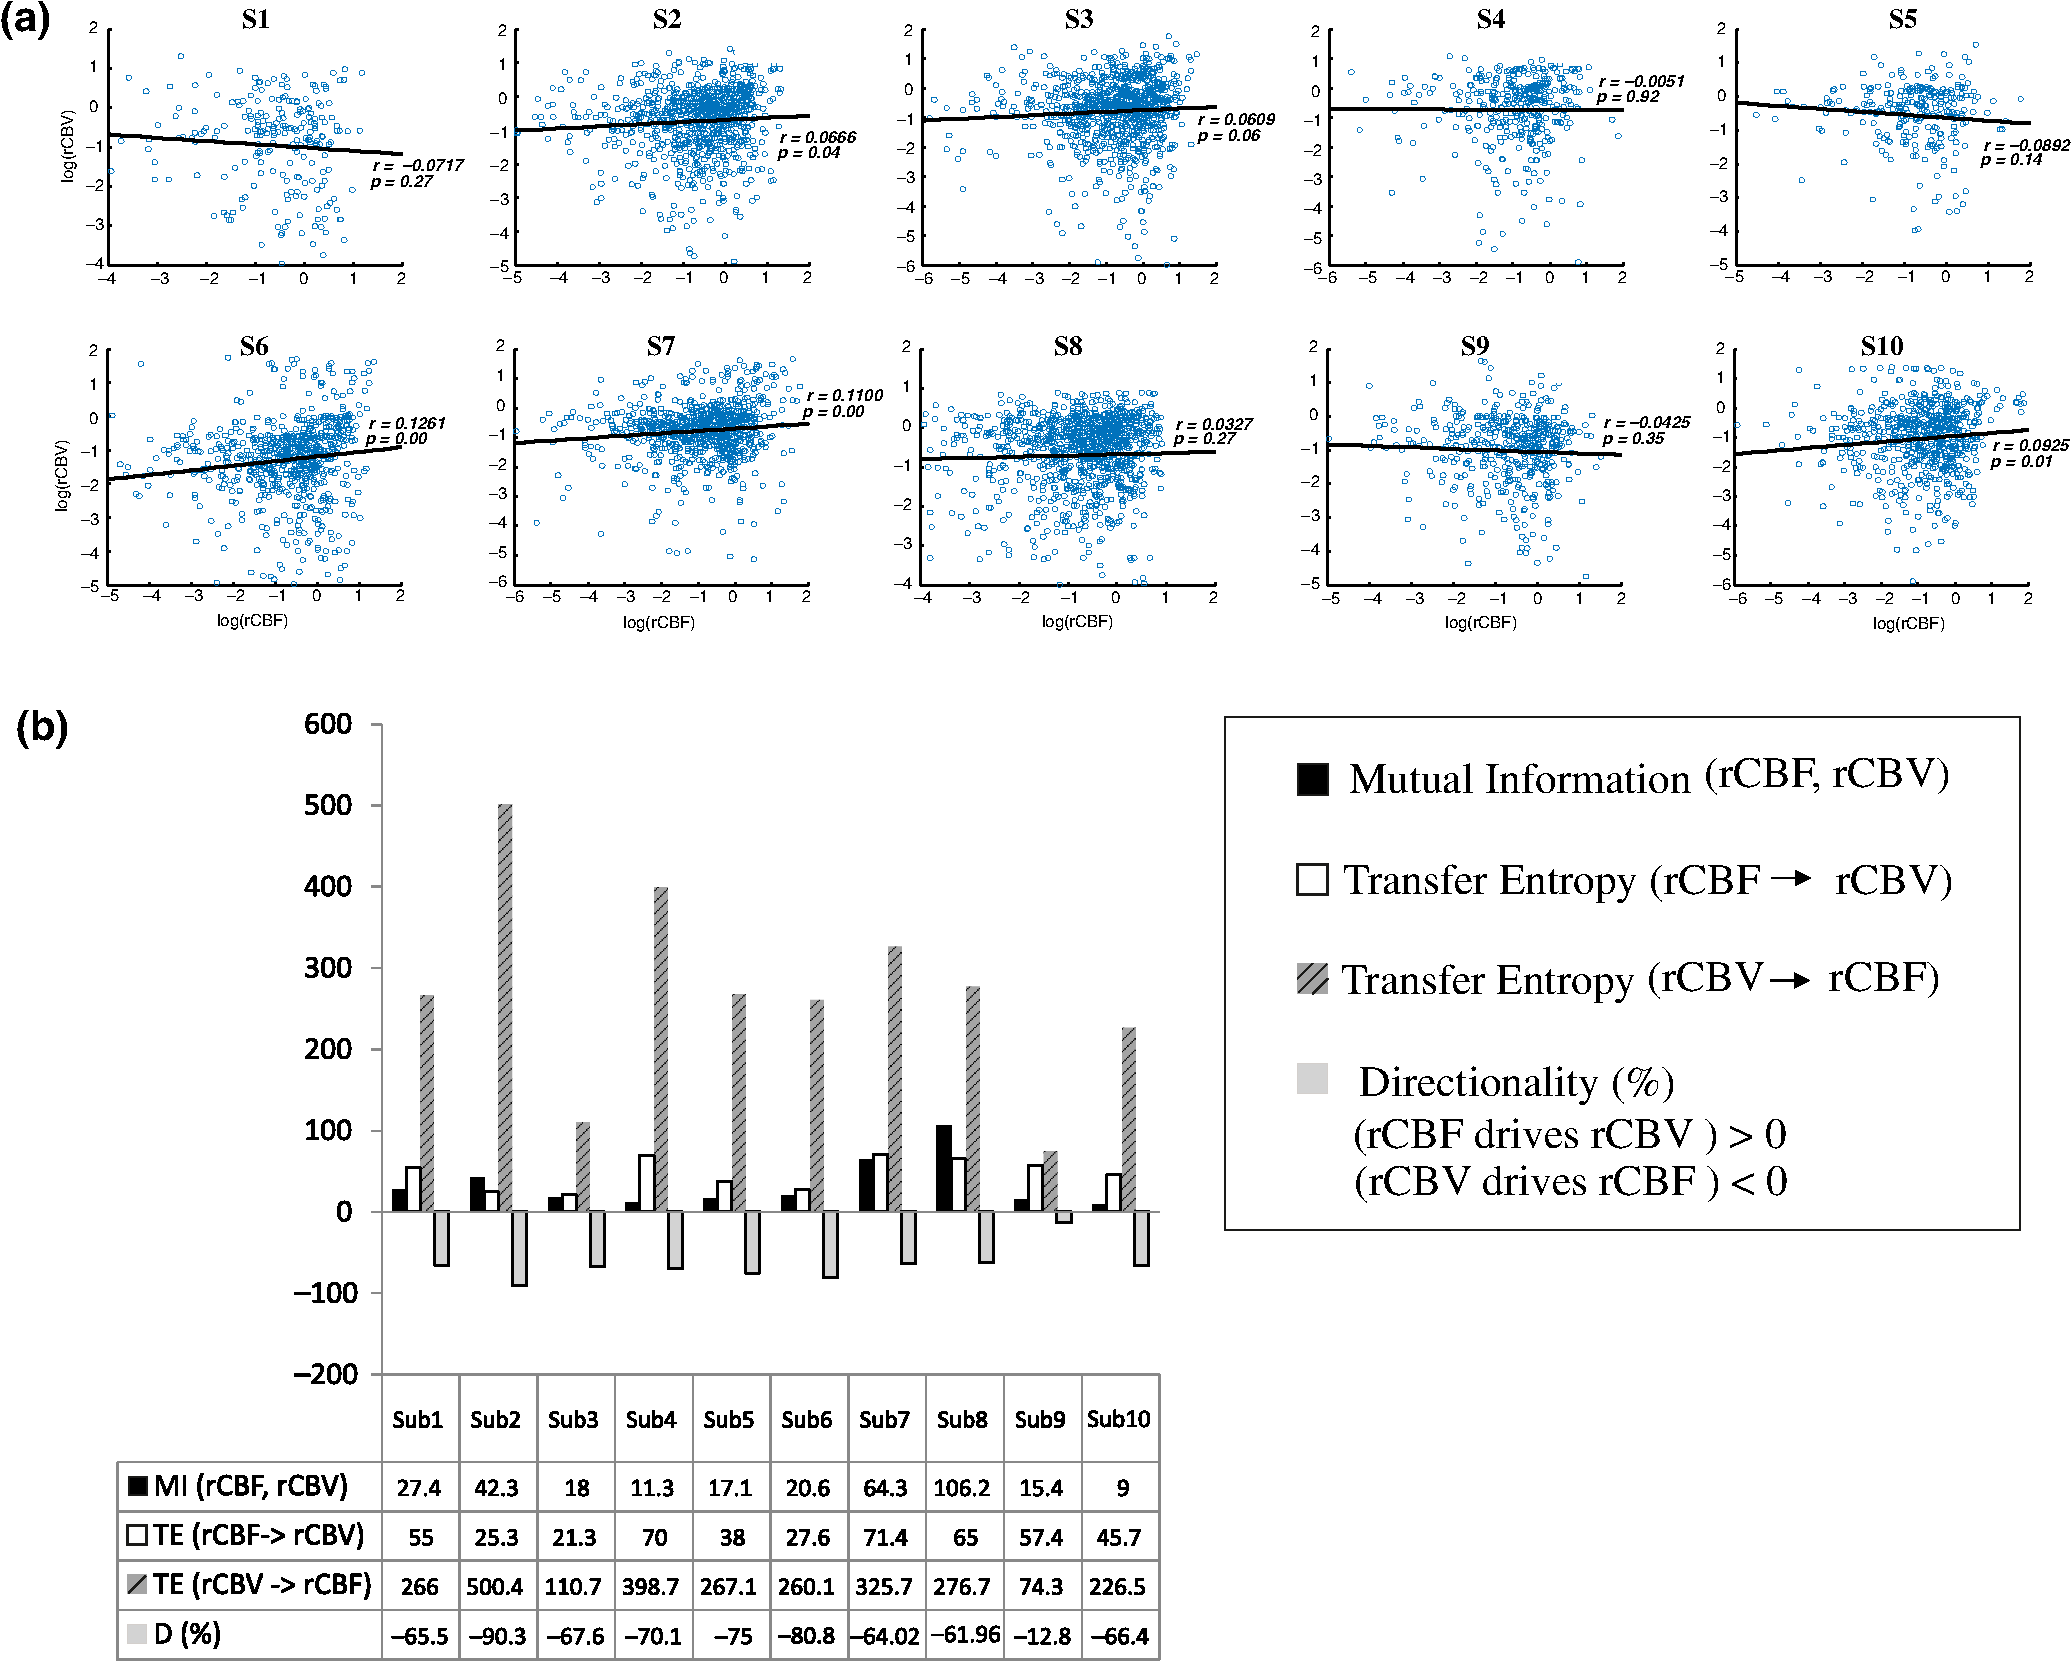
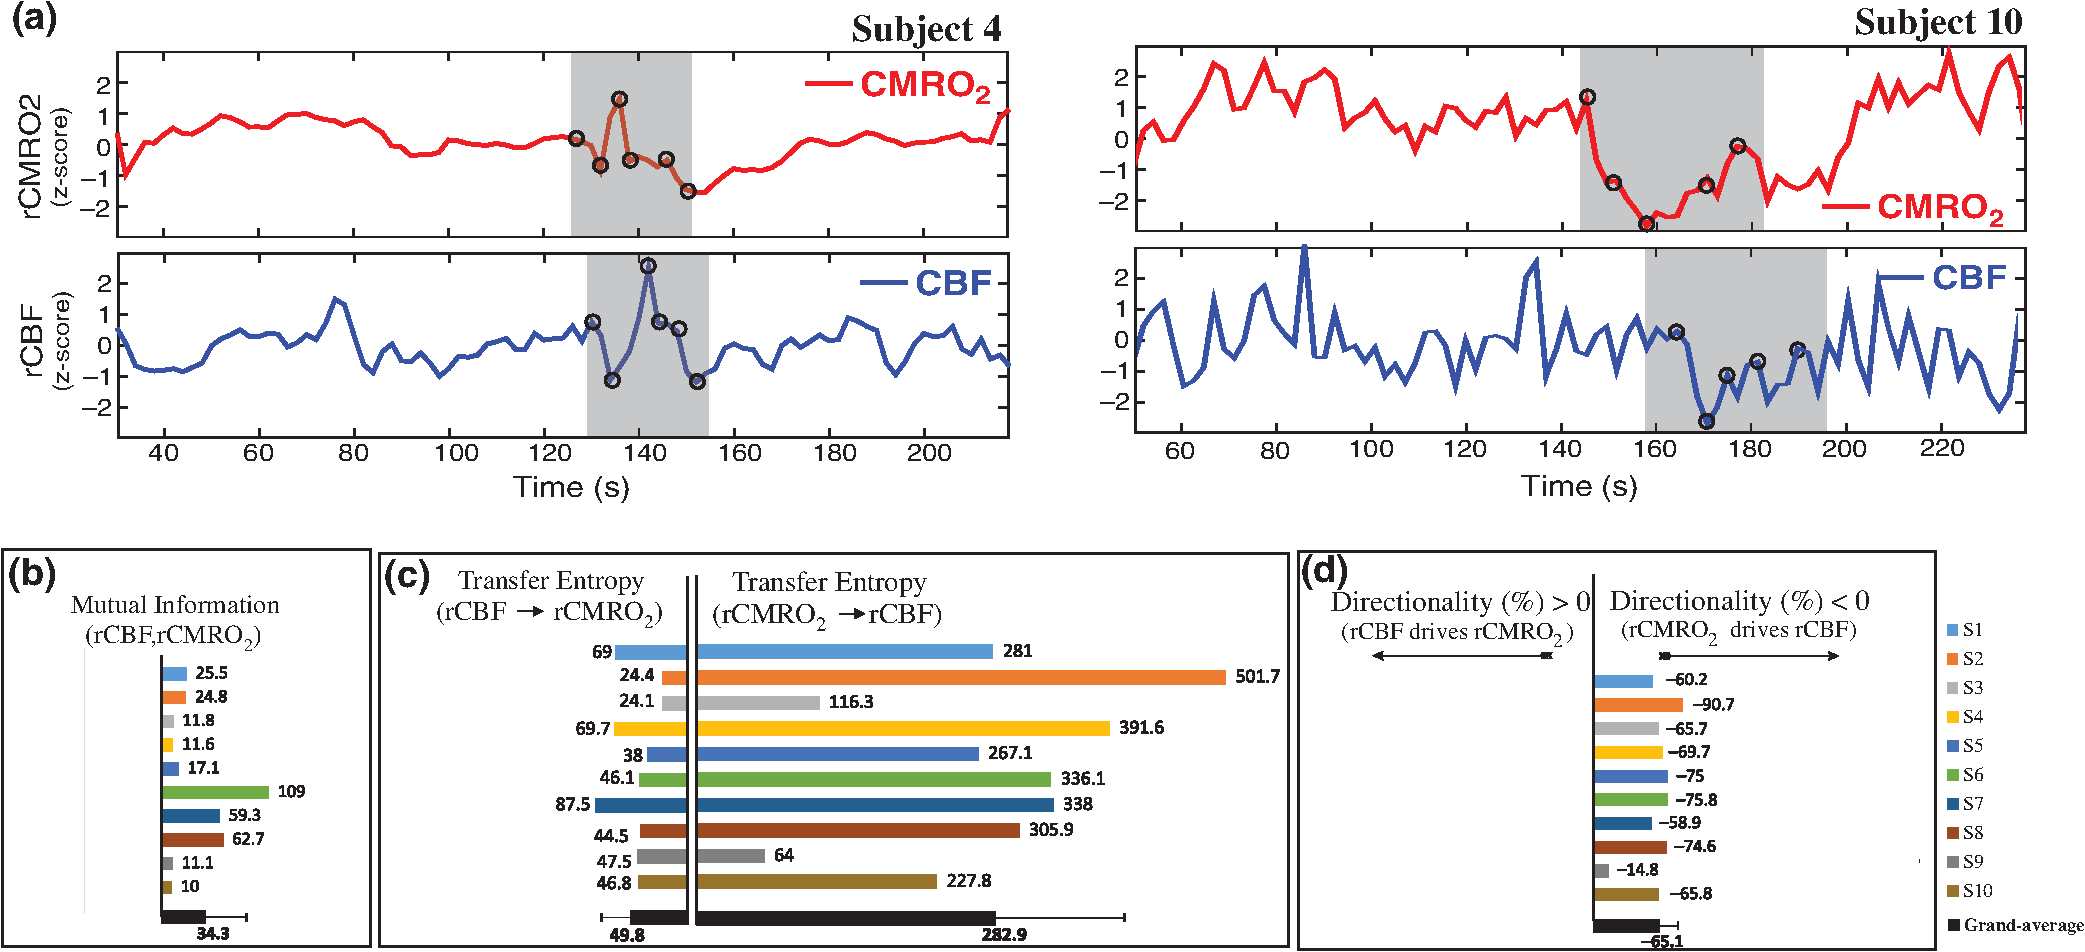
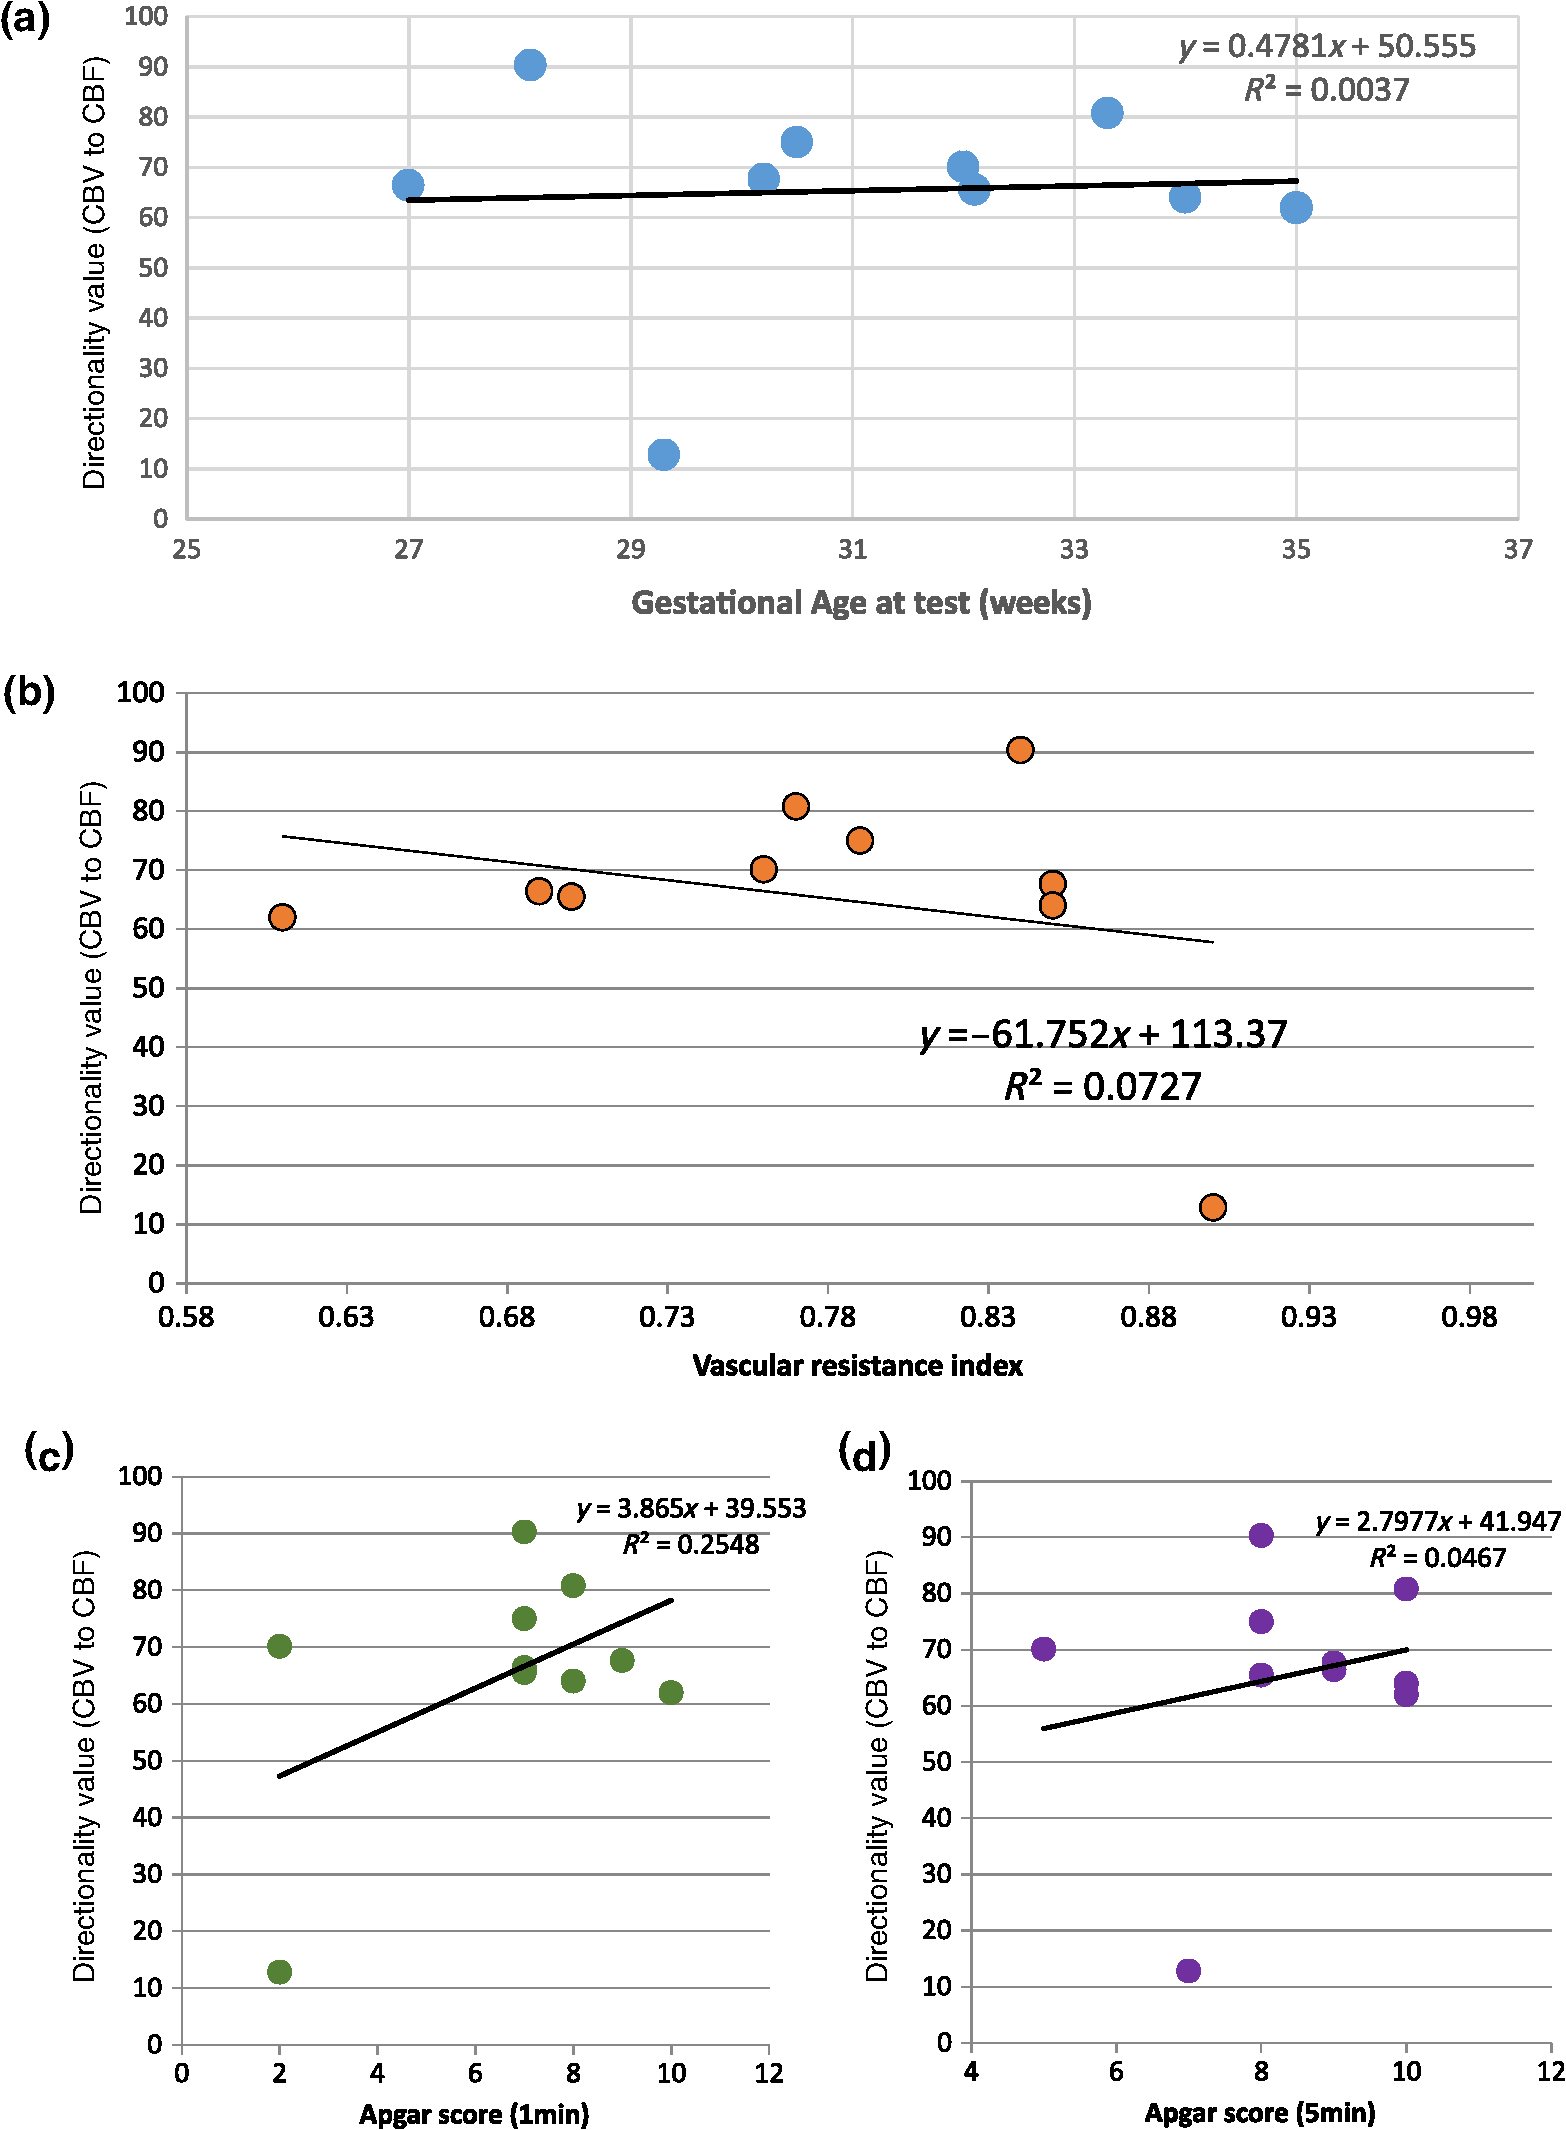
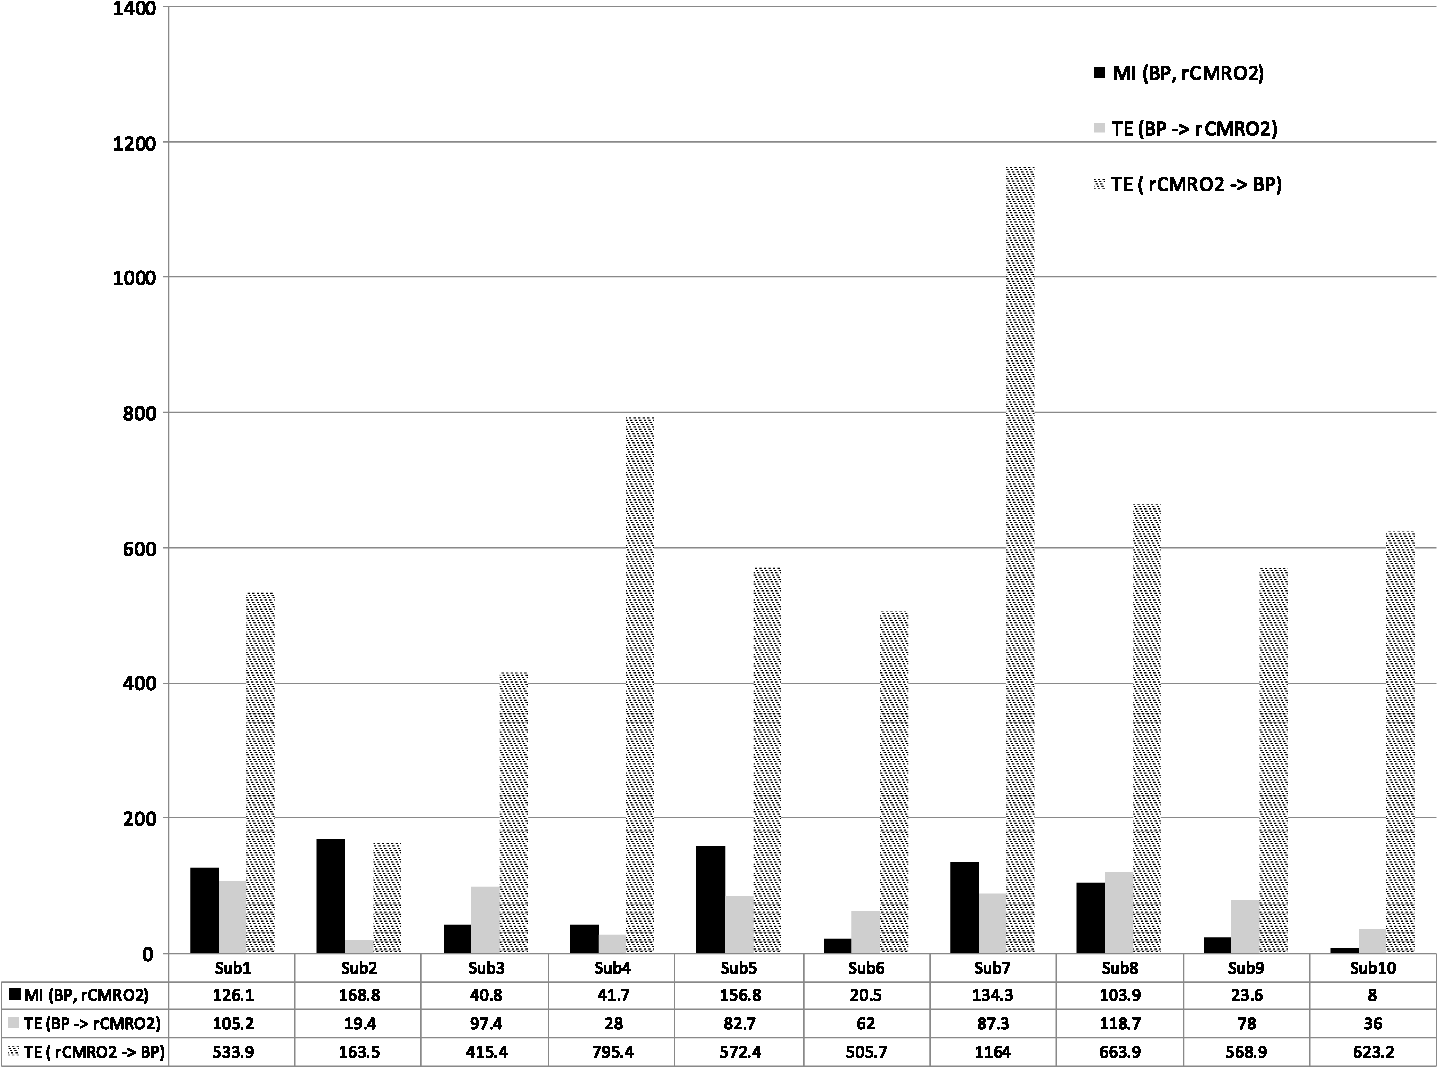
Note: M, male; F, female; GA, gestational age; brain US, brain ultrasonography; PAH, pulmonary arterial hypertension; PRS, positive rolandic spikes. 2.1.Diffuse Correlation Spectroscopy and Near-Infrared Spectroscopy InstrumentationDCS and NIRS devices were synchronized and all events detected by DCS were also recorded by the NIRS devices (Fig. 1). The overall measurement duration was between 30 and 40 min for each subject. NIRS/DCS data were acquired simultaneously from the frontal area providing large volumes of data in order to converge TE and investigate the relationships between rCBF–rCBV and at the resting state. Fig. 1(a) The infants were tested with the DCS and CW-NIRS systems, (b) diagram of the combined DCS-NIRS probe, and (c) diagram of the calculation of by NIRS data and rCBF by DCS data. 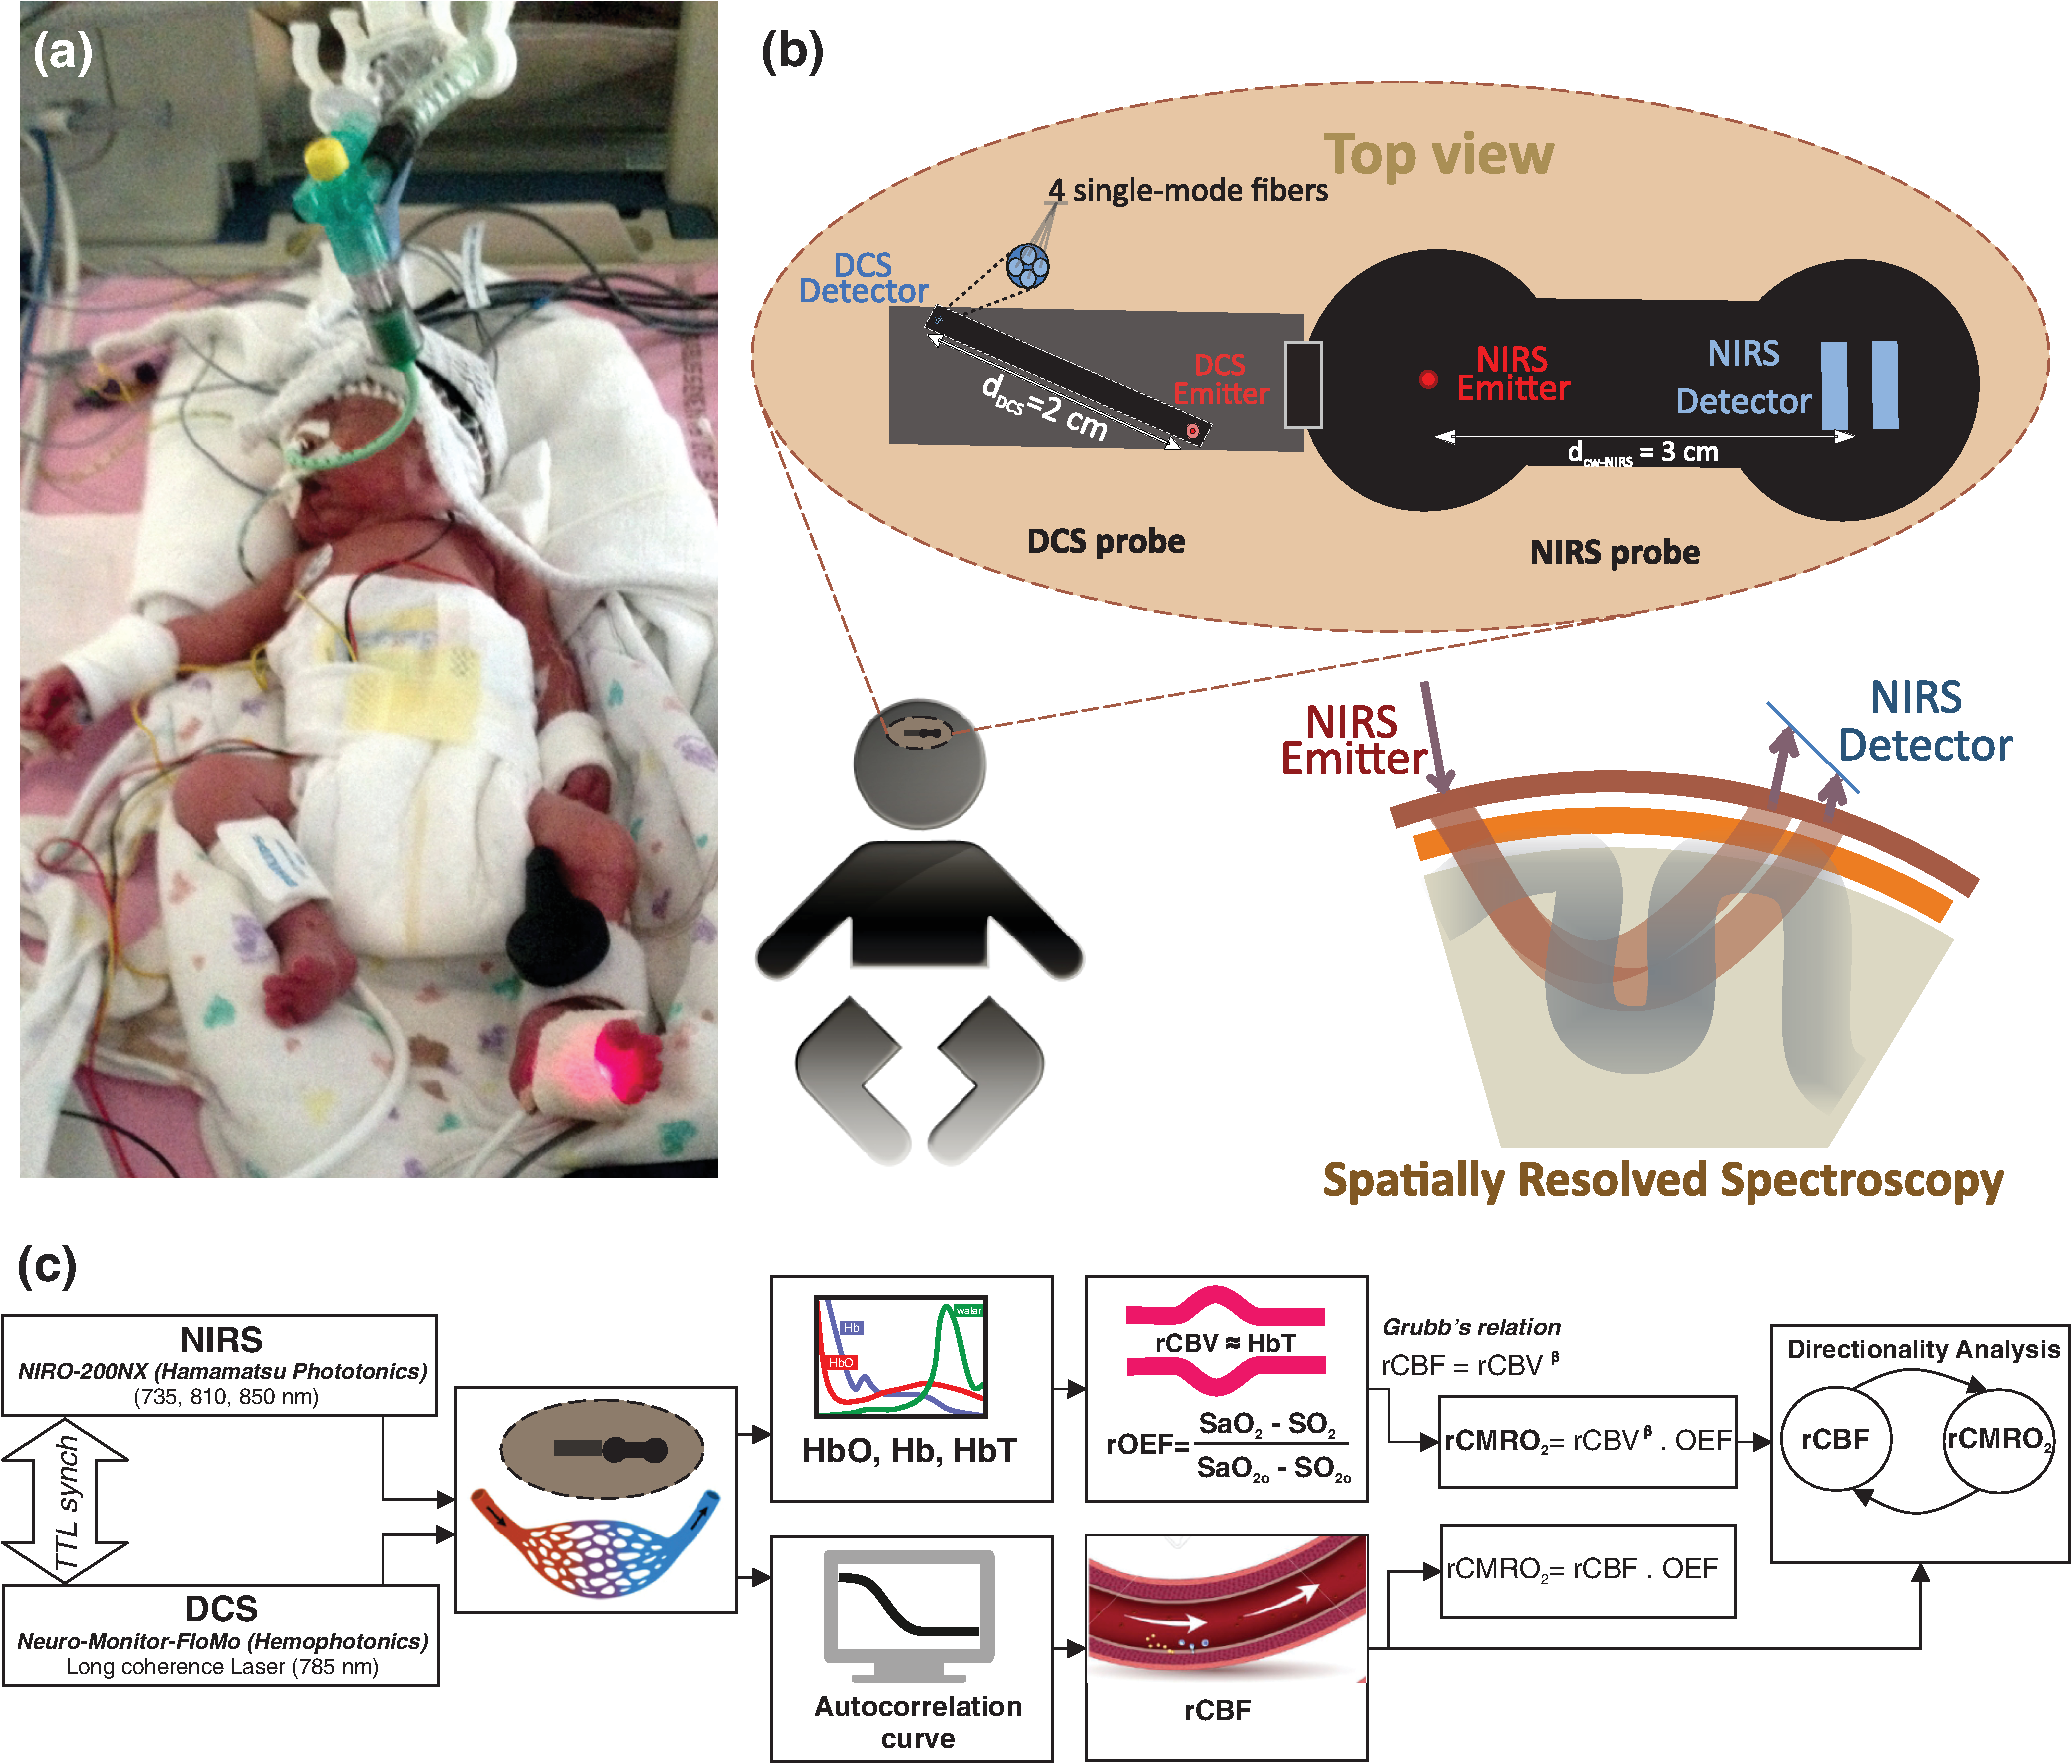 2.1.1.Diffuse correlation spectroscopyDCS is an optical blood flow measurement modality that uses intensity fluctuations of NIR light to noninvasively quantify CBF. The light scattered by moving red blood cells causes temporal fluctuation of the detected light intensity. The time lag of these fluctuations is quantified by the intensity–time autocorrelation function of the detected light. The correlation diffusion equation is applied to fit the autocorrelation function in order to calculate a cerebral blood flow index (CBFi). Neuro-Monitor-FloMo (Hemophotonics SL, Spain) consists of a narrowband continuous-wave (CW) laser (785 nm, Crystalaser Inc., Nevada) with a long coherence length (), four fast photon-counting avalanche photodiodes (SPCM-AQR-14-FC, Pacer Components Inc., United Kingdom), and a four-channel autocorrelator board (Flex03OEM-4CH, Correlator Inc., New Jersey). The system uses CW lasers in the NIR range () with an acquisition rate of 0.3921 Hz (one sample every 2.55 s). The light was delivered to the brain surface via multimode fibers and light on the head surface was detected by four single-mode fibers away from the source. The light was detected by single-photon counting avalanche photodiodes (SPCM-AQR(H) series, Excelitas, Canada). 2.1.2.Continuous-wave tissue oximeter (near-infrared spectroscopy)NIRS probes NIRO-200NX (Hamamatsu Photonics Corp., Tokyo, Japan) were placed on the infant’s forehead to measure cerebral oxygenation in the frontal cortex. The NIRO 200 NX uses spatially resolved spectroscopy (SRS) at three wavelengths (, 810, and 850 nm). It is based on the solution of the diffusion approximation for a highly scattering semi-infinite homogeneous medium. The effective light attenuation coefficient can be estimated by measuring the decrease in reflected light as a function of distance. By assuming wavelength dependence of the reduced scattering coefficient, the spectral shape of the absorption coefficient can then be calculated and tissue oxygen saturation can be estimated.27 The average output power of the lasers was and the CW acquisition rates were 5 Hz (200 ms). 2.1.3.Diffuse correlation spectroscopy and near-infrared spectroscopy probeTo simultaneously measure rCBF and rCBV dynamics, we developed a specific probe that supports DCS, and NIRS emitters and detectors. Recording sites on the subject’s head and a diagram of the two combined probes are shown in Fig. 1(a). The infants were placed in the supine position on a comfortable pad in a dark and quiet incubator. The incubator was further protected against ambient light by dark sheets. The probe was smoothly secured to the infant’s head with straps and foam padding. Figure 1(b) shows the diagram of the combined DCS-NIRS probe. DCS probe: The tips of the source and detector fibers were angled to 90 deg and tightly held in place by a flexible rubber material. Four detectors (blue circles) were set up in a multicore arrangement away () from the emitter (red circle), creating four measuring points (channels) over the frontal area. A special DCS probe made of soft, flexible rubber (3 mm thick) was designed to comfortably hold the source and detector fibers on the infant’s head. NIRS probe: The NIRS probe comprising two detectors and one source and the emitter–detector distance of the CW optical NIRS probe was 3 cm. The NIRS source contained three wavelength emitters (735, 810, and 850 nm) (bottom right-hand corner). (tissue oxygenation) was measured by using the SRS method. SRS is a method used to calculate concentrations by measuring the change of light attenuation () over distance (), i.e., , as shown in Fig. 1(b). 2.2.Data Processing and Statistical AnalysisOffline analysis was performed using in-house MATLAB scripts for CBF measured by Neuro-Monitor-FloMo (Hemophotonics SL, Spain), and for CBV (total hemoglobin, ) and OEF measured by NIRO-200NX (Hamamatsu Photonics Corp, Tokyo, Japan). A z-score-based algorithm was used to reject artifact signals.13 As individual features, such as skull thickness and hair color, influence signal strength, the signal was first homogenized in each participant by computing a z-score across all measurement periods for each channel. A z-score greater than 4 in any channel was considered to be an artifact, in which case the entire artifact time-window was excised from the data for all channels.13 The mean value of rCBF signals recorded from four paired source–detectors was calculated. The remaining cleaned rCBV, rCBF signals were bandpass filtered (0.03 to 0.5 Hz) using a zero phase filter (Butterworth, order: 3) to eliminate physiologic noise (e.g., slow drifts, arterial pulse oscillations). 2.2.1.rCMRO2 calculated by near-infrared spectroscopy datacan generally be calculated by combining relative changes in CBF and OEF, but monitoring rCBV independently of rCBF by the NIRS device allows to be evaluated independently of rCBF21 by using instead of rCBF in relation1 [Fig. 1(c)]. The was estimated as follows:28 where rOEF is defined as follows:With venous oxygenation, , where , and are the arterial and venous contributions that are constant over time,29 and arterial oxygenation . Mechanical ventilation parameters and inspired oxygen concentrations were constantly maintained at sufficiently high levels to saturate arterial hemoglobin (). is the microvascular tissue oxygen saturation30 (). By considering Grubb’s relation between changes in rCBF and rCBV31 ()21 (time invariant characteristic of beta has been validated statistically): CBV was defined as , where CBV is expressed in , HbT in , () is the molecular weight of hemoglobin, is the brain tissue density, and HGB () is the blood hemoglobin concentration. The control state at time was defined as the mean value of the signal and was considered to be the reference value. 2.3.Nonlinear Flow-Metabolism Interaction by Transfer EntropyTE was used to define the strength of causality and the coupling between rCBV–rCBF and . The concept of entropy is related to the degree of uncertainty associated with a signal random variable (i.e., rCBF). In other words, it provides a measure of the average uncertainty in a random variable. The determination of entropy of a random variable rCBF with a probability mass function is defined by the following equation: The first step consisted of the evaluation of the entropy (H) corresponding to the uncertainty associated with one of the two variables, rCBV, and rCBF. The analysis was based on times-series with identical probability variables and a flat distribution of quantized values. The original normal distribution of the two variables (rCBF and rCBV) is shown in Fig. 2(a). In order to produce time-series with identical probability variables of rCBF and rCBV, raw rCBF and rCBV data were quantized using 25th, 50th, 75th, and 100th percentiles, and rCBF and rCBV values between the (0, 25th), (25th, 50th), (50th, 75th), and (75th, 100th) percentiles, corresponding to 1, 2, 3, 4, respectively, in Fig. 2(b). The quantized rCBF and rCBV values presented the required flat distribution [Fig. 2(c)]. Fig. 2(a) Distribution histogram of rCBV and rCBF, (b) time-series of rCBV and rCBF expressed as quantized values to produce time-series with identical probability variables, (c) flat distribution of rCBV and rCBF, and (d) diagram of the surrogate data approach to the rCBF-rCBV coupling hypothesis. 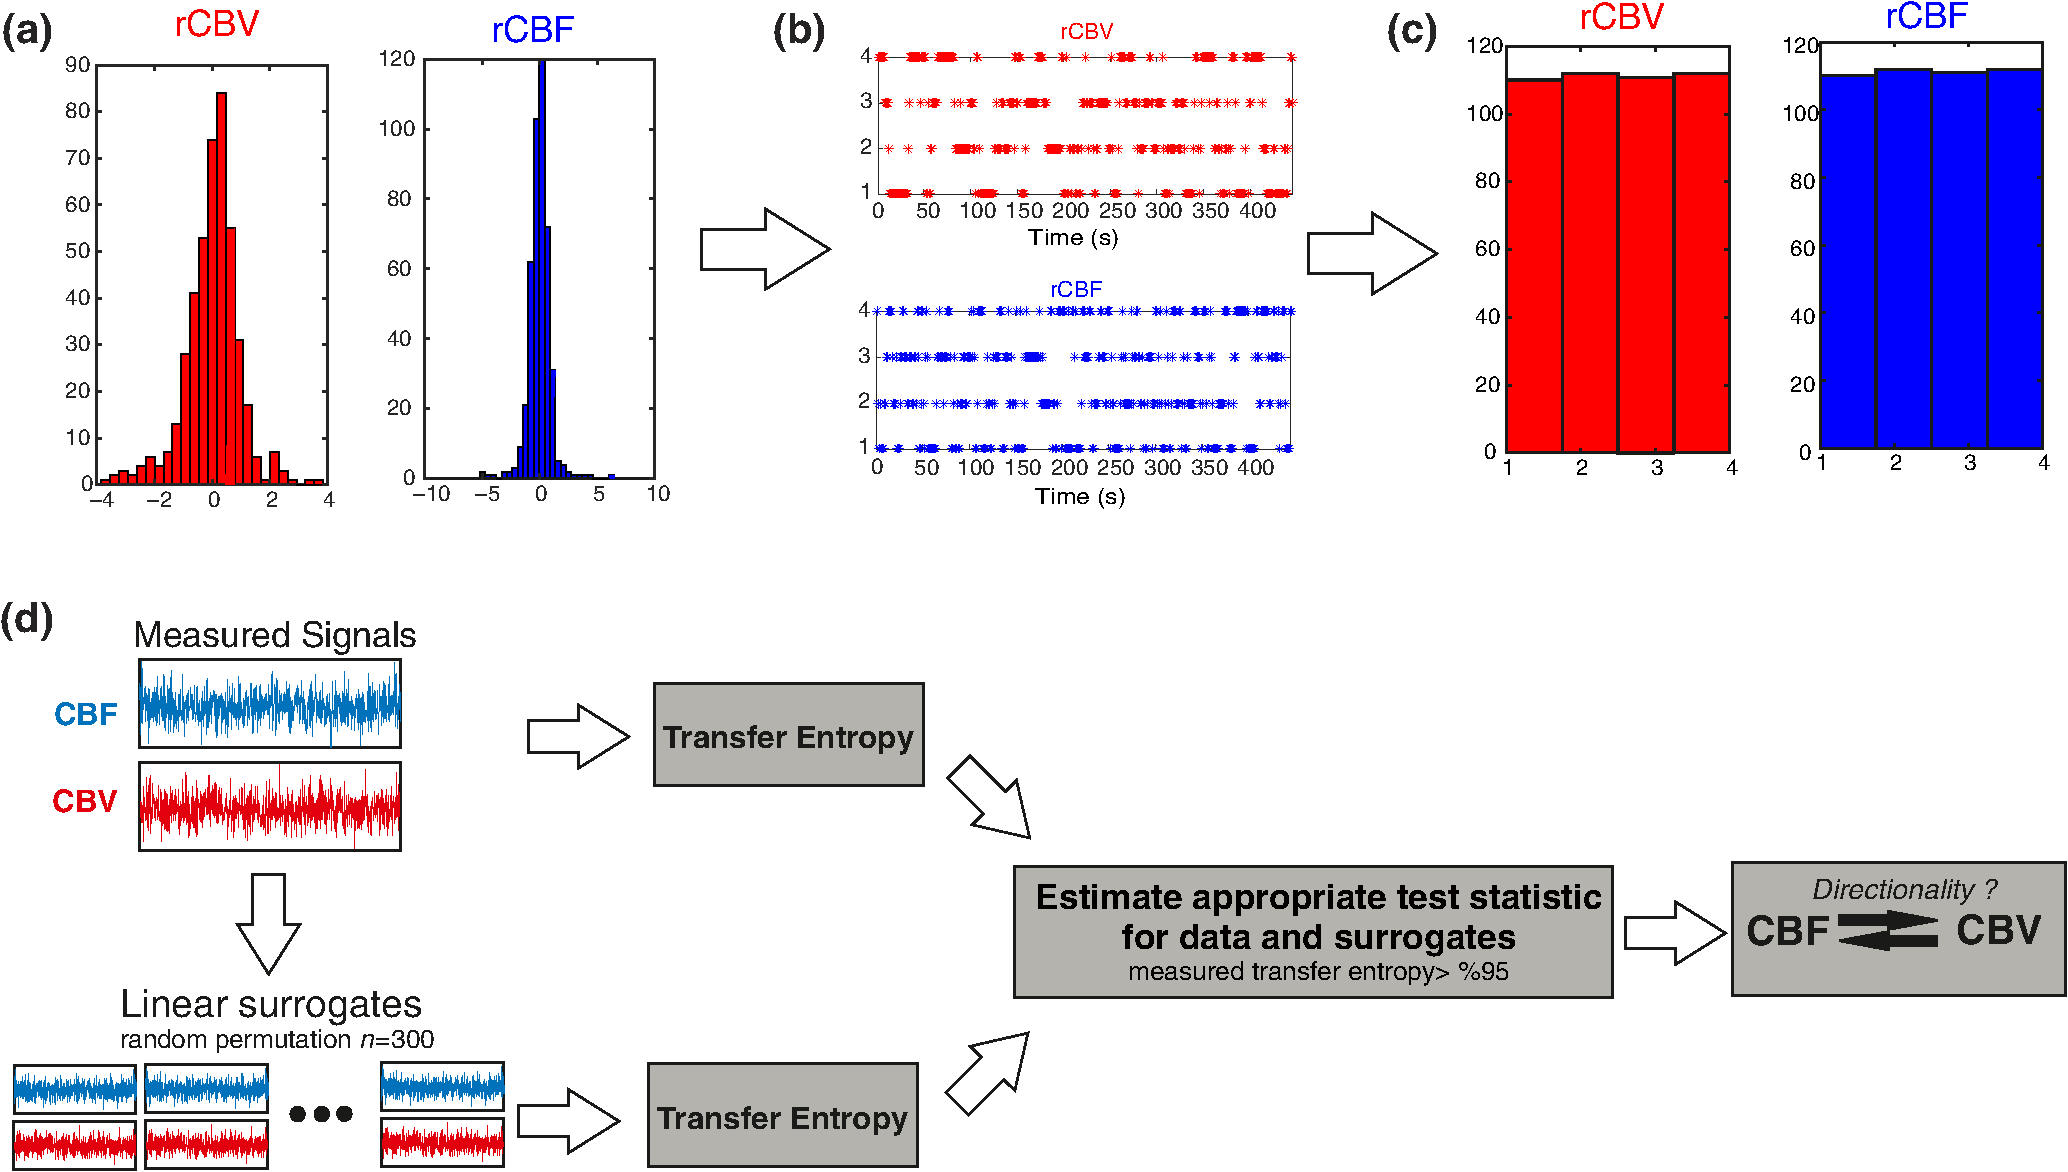 The reduction of the uncertainty of one random variable obtained by the addition of a second variable (i.e., rCBV, where rCBV is not completely independent of rCBF), is defined as mutual information (MI). MI is a measure of the amount of information that one random variable provides about another random variable, defined by H(rCBF, rCBV) corresponding to the entropy of the two variables, rCBF, and rCBV: The second step consisted of the evaluation of the MI shared by the two variables. To evaluate the interdependency between the two variables, rCBV, and rCBF, the MI was compared to the entropy (H) of each variable. When MI between these two variables is less than entropy (H), it can be concluded that the two variables are dependent. As MI is symmetrical for the exchange of signals, it captures the information shared by two signals but is unable to distinguish the driving signal. The reduction in the uncertainty of rCBF due to the information provided by rCBV can also be obtained by introducing a third variable, resulting in conditional mutual information (CMI). The MI between rCBF and rCBV conditioned by a third variable corresponds to the part of the information derived from simultaneous analysis of rCBF and rCBV that is unrelated to the third variable (i.e., ): To obtain an asymmetrical measure, the bivariate version of CMI was used, wherein the third variable is a lagged version of variable rCBF or rCBV (delayed MI). It states that a signal rCBF is caused by signal rCBV when the future of signal rCBV is more accurately predicted by appending information from the past and present of signal rCBF than by using information from the present and past of signal rCBV alone.18 Delayed MI shows a causal dependence related to the information exchanged rather than the information shared (for instance, due to a common drive of both signals by a third external source).32 TE from rCBF to rCBV is defined by the following equation, where is a discrete time-index value: The information transfer between rCBV and rCBF was measured by the time-lagged CMI. By applying time-lagged CMI to the two variables (rCBF and rCBV), if is less than , it can be concluded that rCBF is more dependent on rCBV. Then, because TE is based on transition probabilities, it can be used to determine the dominant direction in the relationship between two variables. The directionality index (DI) between two variables rCBF and rCBV is calculated by When , it was concluded that the rCBV was predominant over rCBF. Conversely, when , rCBF controlled rCBV and, indicates balanced bilateral interactions between the two variables. The statistical significance of TE and MI measurements was evaluated by using a surrogate method by measuring the dependency of two time-series (rCBF and rCBV) with one of the signals randomly shuffled and reorganized and with each sample replaced in a random position in the series. The limit of statistical confidence corresponding to the 95th percentile was found by repeating a different permutation on one of the signals 300 times. The third step consisted of the evaluation of the direction of the relationships between rCBF and rCBV, which can be determined by the DI on both measured and surrogate data. The confidence intervals can be used to calculate statistical power in order to conclude that a surrogate explains at least a certain proportion of the correct direction. If the test statistic from the data is higher than the 95th percentile of the surrogate, it demonstrates the reliability of the estimation procedure [Fig. 2(d)]. All steps were identical for investigation of the relationship between rCBF and . 3.Results3.1.Linear Interaction Between rCBF–rCBV and rCBF − rCMRO2Changes in rCBV were plotted as a function of rCBF for 10 subjects [Fig. 3(a)], resulting in a fluctuating correlation between rCBV and rCBF with a tendency toward a positive correlation in preterms and a negative correlation in the remaining four preterms with an average slope of . 3.2.Computation of Transfer EntropyThe entropy (H) of rCBF and rCBV for each subject and each parameter was equal to 2. For each subject, the MI of rCBF and rCBV was less than the entropy (H) of rCBV and rCBF [ and ] [Fig. 3(b)]. By considering as a product of the measured HbT and , the same analysis was performed to test the relationship between rCBF and (Fig. 4). Selected parts of and rCBF for subjects #4 and #10, illustrating the evaluation of TE from to rCBF as indicated by circles on signals in the dark gray box, suggest that the source signal () drives the target signal (rCBF) [Fig. 4(a)]. The entropy (H) of rCBF and for each subject and each parameter was equal to 2. For each subject, MI of rCBF and was less than the entropy (H) of and rCBF. The average value of MI () was less than the entropy () [Fig. 4(b)]. These results indicate that rCBF and rCBV (also, rCBF and ) can be considered to be dependent variables at the resting state in the preterm brain. 3.3.Causal Relationship Between rCBF–rCBV and rCBF − rCMRO2TE was used to identify a causal relationship between rCBF and rCBV, as it detects the relationship between the past of one signal (rCBV) and the present of another signal (). For each subject, was less than and the average value of (0.0476) was less than the average value of (0.2702) [Fig. 3(b)]. These results demonstrate that appears to be more dependent on rCBV than on rCBF, suggesting that rCBV drives rCBF at the resting state in the preterm brain. This relationship can be summarized by the DI between rCBF and rCBV [Fig. 3(b)]. The negative values of the DI () suggest that rCBV was predominant over rCBF. Statistical analysis with a limit of statistical confidence corresponding to the 95th percentile of the 300 trials was performed according to the surrogate method. As the DI measured in each of the 10 subjects was higher than the 95th percentile, statistical analysis robustly detected the correct direction of rCBV on rCBF. By applying the same analysis to the relationship between the rCBF and , the negative values of suggest that estimated would be predominant over measured rCBF [Figs. 4(c) and 4(d)]. 3.4.Directionality from rCBV to rCBF with GA at the Time of the Test, Vascular Resistance Index, Apgar Score at 1 min and at 5 min, Bilateral Intraventricular Hemorrhage-III in Preterm NeonatesRelationship of directionality from rCBV to rCBF with GA at the time of the test, vascular resistance index, Apgar score at 1 min and at 5 min, bilateral intraventricular hemorrhage (IVH-III) in preterm neonates was investigated. Figure 5 shows the directionality between rCBV and rCBF as a function of GA at the time of the test (, ) [Fig. 5(a)], a function of vascular resistance index (, ) [Fig. 5(b)], a function of Apgar score (1 min) (, ) and Apgar score (5 min) (, ) [Fig. 5(c)], The results do not demonstrate any significant relationship between maturational stage, vascular resistance index, Apgar score, and developmental dynamics of the relationship between rCBF and rCBV. More subjects could be recruited in future studies in order to investigate the impact of GA, vascular resistance index, Apgar score, bilateral IVH-III on TE. 3.5.Relationship Between rCMRO2 and Mean Arterial Blood Pressure at the Resting State in Preterm Neonatal BrainFigure 6 shows the relationships between and mean arterial blood pressure (MABP). The nonzero MI between and MABP demonstrates that the two variables are partially dependent on each other, suggesting that might also be partly dependent on other systemic variables. On the other hand, the grand averages of 10 subjects for the linear correlation between and MABP, and and heart rate (HR) were not statistically significant (. , and . , , respectively). 3.6.Impact of Possible Time Lag VariabilityAnalysis of directionality is often based on synchrony assumptions of the two signals, suggesting that time lag variability would have an impact on the conclusions. It is, therefore, important to assess this time lag effect by means of sensitivity analyses. We considered different time lags between 0.8 to 2.4 s [DCS sampling period (2.5 s) is the maximum possible time lag]. Figure 7 shows that time lag changes had a negligible impact on the DI. The consistency between the results of primary analysis and the results of maximum possible time lag analysis, therefore, support the conclusions and the credibility of the results. 3.7.Effect of Different Beta Values on Transfer EntropyWe used a constant value for beta in Grubb’s equation ().21 The effect of different constant values (0.1, 0.2, 0.3, 0.4, 0.75, 1, 2) on TE between rCBF and was investigated (Fig. 8). Regardless of the value considered, the directionality of was predominant over rCBF. 4.DiscussionThis study demonstrates that, in very preterm newborns (), rCBV is predominant over rCBF and that neurovascular interactions appear to be sufficiently efficient for to be already able to drive rCBF at rest. While our previous data13,14 supported the existence of neurovascular coupling in response to neuronal activations by auditory stimuli in very preterm infants, little is known about the interactions between rCBF and rCBV (and between rCBF and ) in preterms at rest,15 in whom the cardiovascular and autonomic nervous systems remain largely immature. The linear relationship between rCBF and rCBV (rCBF and ) has been extensively studied at rest in adult humans5 (during sleep33 and under general anesthesia34) and in animals,35,36 showing that CBF and CBV (as well as CBF and )37 are tightly coupled under normal conditions. In the present study, the linear correlation between rCBF and rCBV was fluctuating with a tendency to be either positive () or negative () [Fig. 3(a)], which is consistent with the results in preterm infants reporting rather stable rCBV whatever the changes in rCBF.21 In comparison to the mature adult brain, presenting high coupling between CBF and CBV, a weaker correlation between these two variables was observed in the developing neonatal brain. Most studies have explored the linear relationships between rCBF and rCBV21 (rCBF and 15). To the best of our knowledge, this is the first study to evaluate the nonlinear relationships between rCBF and rCBV in preterm infants, demonstrating the intensity and asymmetry of the interactions between these two autonomic variables, i.e., rCBF and rCBV, using TE analysis derived from information theory.16 To ensure the independency of the recorded parameters, rCBF and rCBV were simultaneously recorded by two separate devices using two different approaches, DCS and NIRS, respectively. In preterms, the negative DI () between rCBV and rCBF suggests that rCBV has a more predominant driving influence on rCBF (versus rCBF to rCBV) at the resting state. We tested to what degree the maximum time lag between the two separate devices would affect the results, despite the fact that the acquisition devices were synchronized by an external event trigger. The maximum possible lag changes (Fig. 7) and the effect of different constant values of (Fig. 8) had a negligible impact on the DI. Our results at resting state are in agreement with those reported by Roche-Labarbe et al.,6 although their study was conducted under different conditions, with large in-flow modeled related to task-evoked conditions, such as somatosensory stimulation.6 During the first few seconds of stimulation, rCBV increased progressively, while changes in rCBF started to increase abruptly after only a few seconds,6 suggesting a lag between changes in rCBV and rCBF. Fig. 7Impact of time-lagged rCBF on with different time lags (0.8 s, 1.6 s, 2.2 s, 2.4 s): (a) amount of information shared between rCBF and measured by MI, (b) TE indicates the amount of information exchanged from rCBF to and vice versa with different time lags, (c) DI indicates the dominant direction of the transfer, the negative sign indicates the dominance of over rCBF and vice versa. 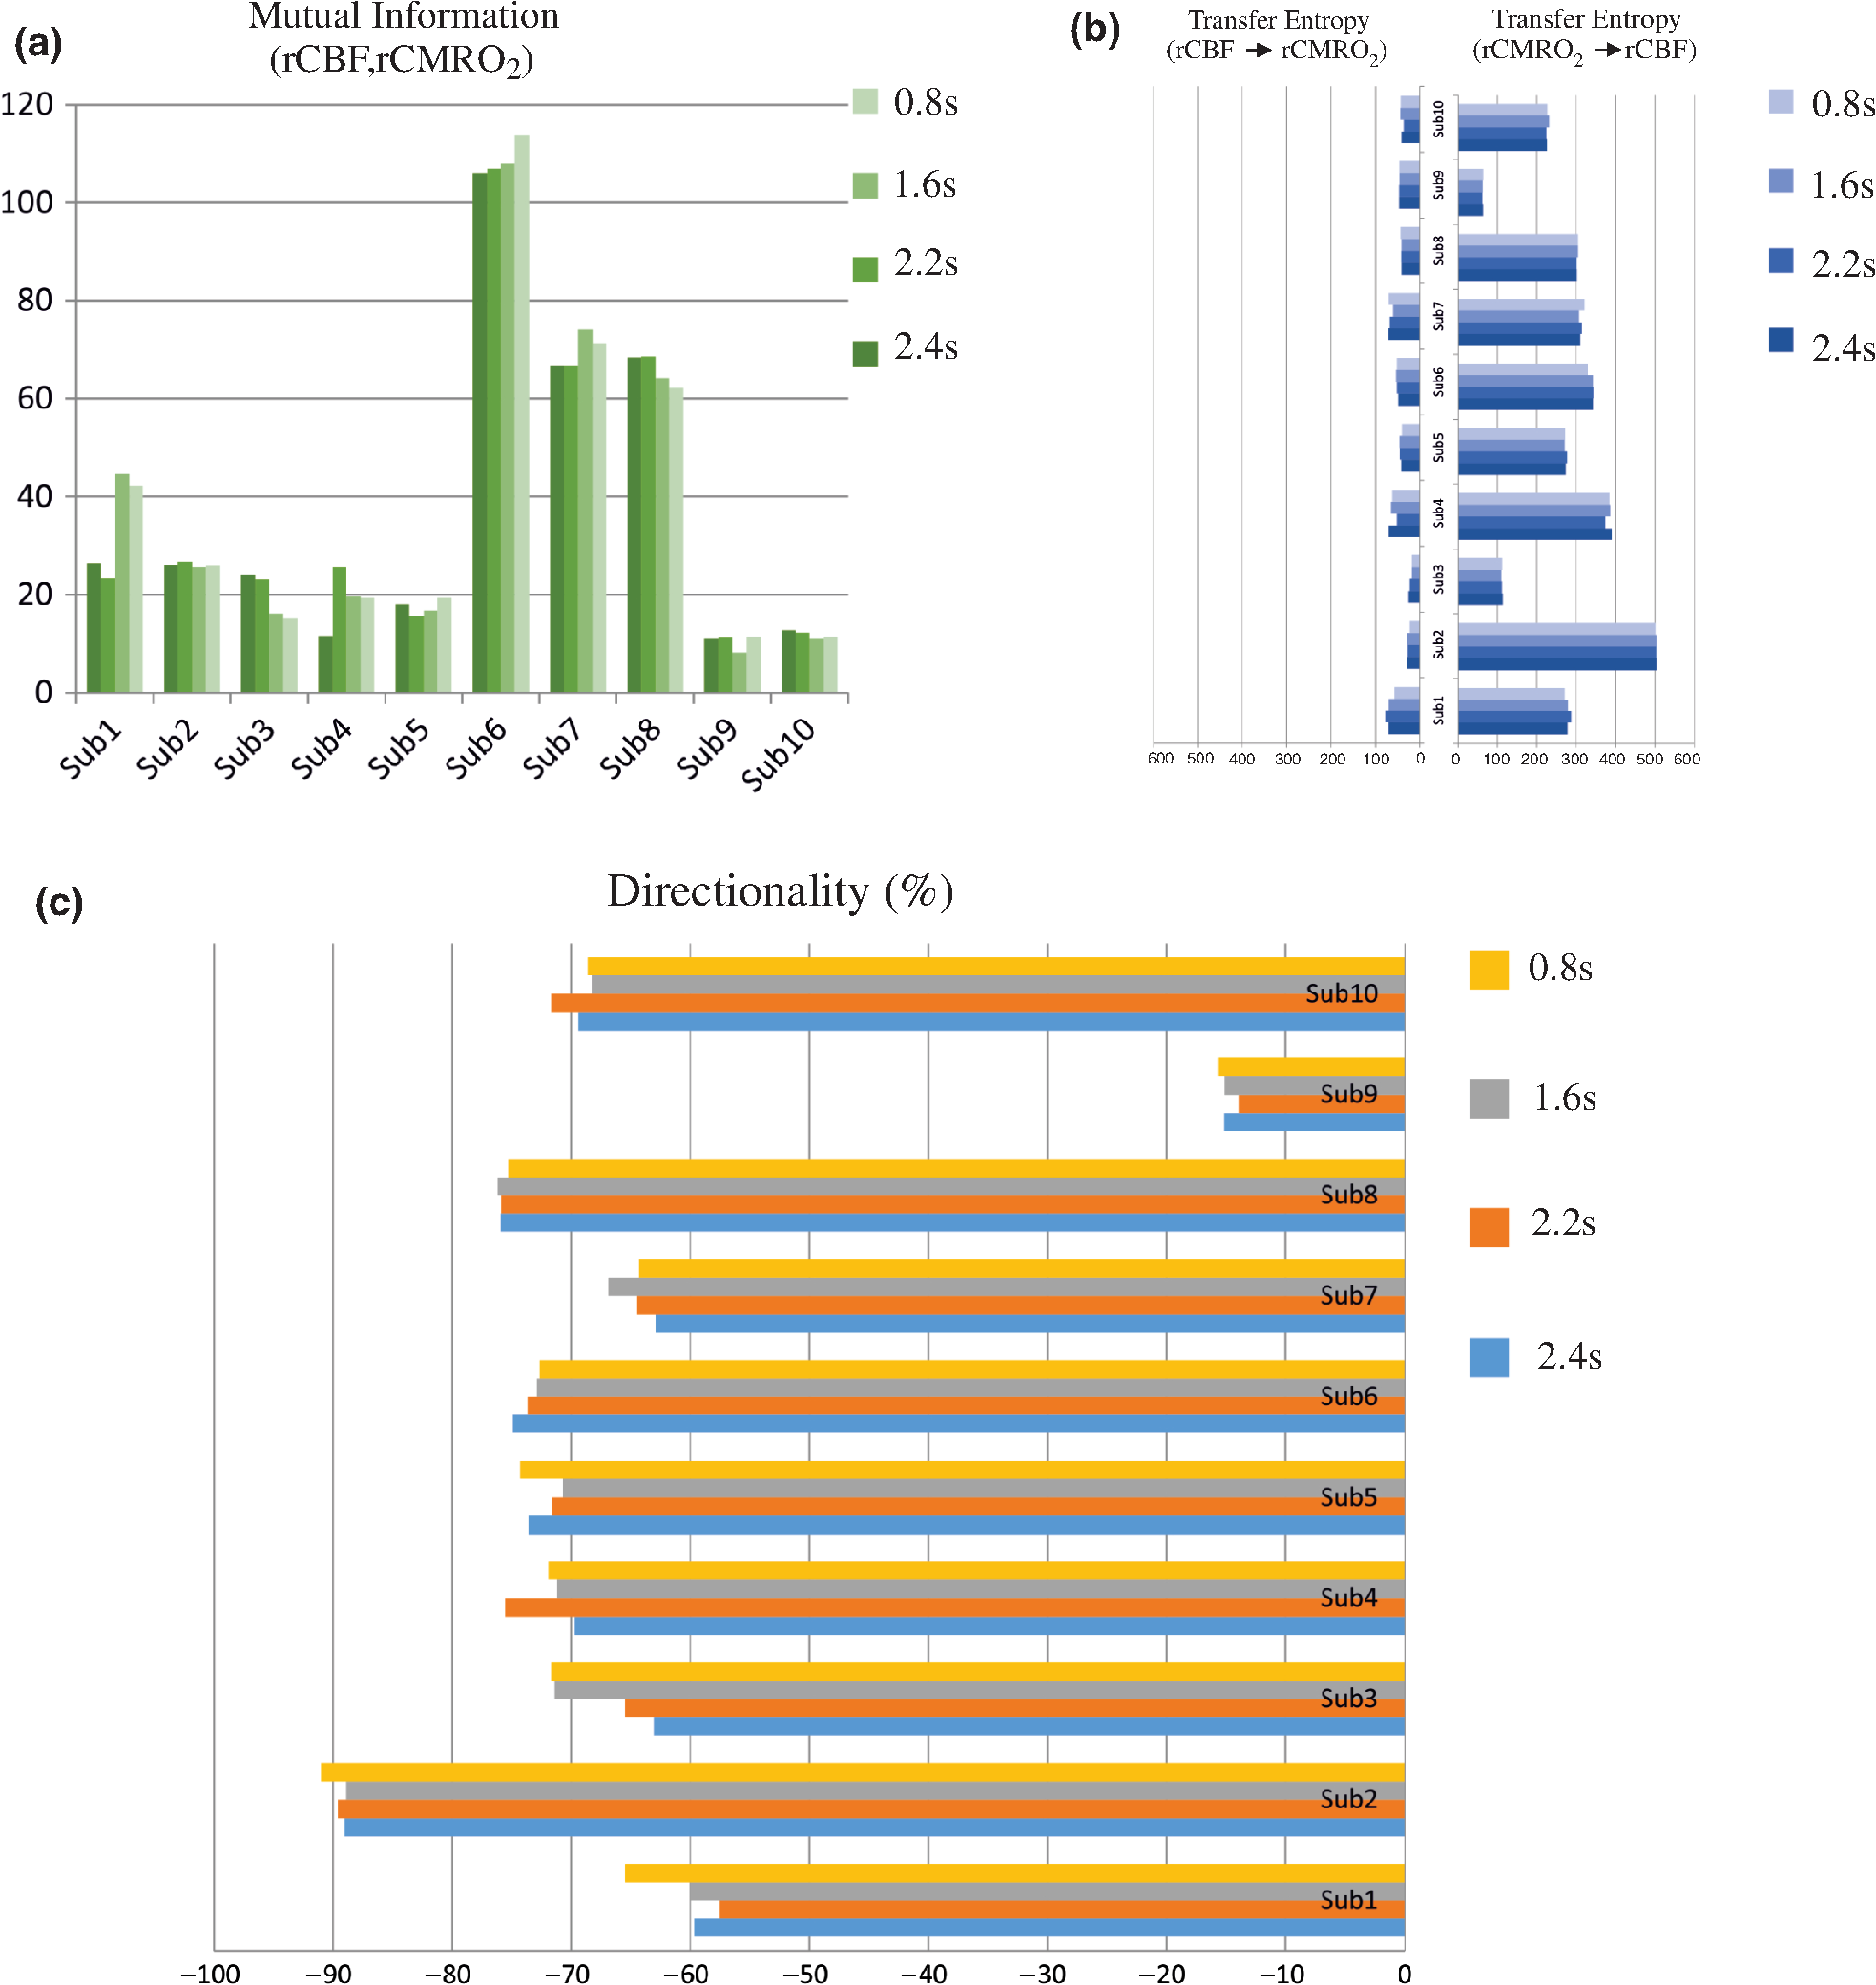 Fig. 8TE indicates the amount of information exchanged from rCBF to and vice versa (10 subjects with seven different values of ).  Notwithstanding the methodological limitations [(i) small differences in tissue volume sampled, (ii) optimization of the distances between emitters and detectors of the NIRS and DCS probes to minimize light interferences, (iii) higher integration time for DCS than for NIRS to achieve a balance between signal quality and temporal resolution] and the physiological complexity (arteriole resistance, arterial/venous/capillary compartment), the use of information entropy has the advantage of combining the probabilities for multiple outcomes to one meaningful measure, i.e., the directionality from rCBV to rCBF, and it does not assume a specific statistical distribution or an estimate of a mean. TE implies to quantify the causal relationship between the variables (i.e., rCBV and rCBF). The causality does not necessarily imply that two variables have a time lag, they also could have taken place simultaneously. Increased volume followed by increased flow with a slight delay (i.e., time lag between the rCBV and rCBF), directs us to explore for a suitable physiological underlying mechanism. Although the reports of relative CBV and CBF dynamics have been controversial,4,38,39 our finding (rCBV followed by rCBF changes) supports the assumption of a process of capillary filling (increase in rCBV)38 followed by a delayed neurovascular regulation of rCBF in the capillary bed. Functional recruitment of capillaries is the changeover of low blood flow to high blood flow capillaries.40 An initial phase of activation can be expected when local capillary blood volume increases, but at a time when arterioles have not yet dilated and the blood flow has not yet increased.38 This type of lagged relationship between blood volume and blood flow has been described to be valid if the outflow from the capillary compartment in the activated regions is briefly lower than the inflow to this capillary compartment.38 The capacitance of the capillaries was to raise and their resistance was to reduce, following neuronal activation (i.e., the capillary bed might play as a “sink” for red blood cells).38 This in turn allows the outflow from the compartment to decrease before the occurrence of upstream arteriolar dilatation that would provoke an increased inflow. Thereafter, when the arteriolar part has dilated, the increased inflow causes a flow increase in the entire capillary compartment, oxyhemoglobin increases, and deoxyhemoglobin decreases.38 Leung et al.24 suggested that Grubb’s relation cannot be used to estimate because the variances in and measurements would be different, but, in contrast, Boas and Payne noted that: “both of these calculations assume that the dependent variable is functionally dependent on the independent variable and that the variance in the linear regression is exclusively derived from the variance in the dependent variable”. rCBF can, therefore, be estimated from rCBV, allowing to be estimated when only rCBV measurements are available.23 By considering the neurovascular coupling cascade (multiple signaling pathways encompassing perivascular astrocytes, vasoactive chemical agents, and direct neuronal connections)41,42 and estimation of index by rCBV,23 the linear correlation between rCBF and was also fluctuating with a tendency to be either positive () or negative (). This fluctuation in the linear correlation between rCBF and has already been described in preterm infants, with no relationship observed in healthy preterms, while a strong relationship was observed after dopamine treatment,15 suggesting that the underlying mechanisms of the interactions between rCBF and in preterms are fairly complex, immature, and have yet to be determined.43 The direction of the nonlinear relationship between rCBF and is an accepted hypothesis in adults1 and supports the idea that rCBF could be controlled by oxygen demand.44 Nonlinear analysis can be used to detect a wider range of interactions between variables compared to conventional analysis, such as linear correlation. Analysis of the nonlinear relationship between rCBF and , and the negative values of DI suggest that is significantly predominant over rCBF in the resting state in the preterm healthy brain. As depends on the degree of brain activity at the resting state,45 rCBF variations may be partly driven by brain activity at rest. This hypothesis is now being tested in the laboratory by combining EEG, NIRS, and DCS in preterms. The relationship between and MABP was also assessed. The nonzero MI between and MABP implies that, although might be affected by changes in systemic variables, some of the variations of depend on other variables, such as rCBF. This study also demonstrates a possible relationship between rCBF and with a directionality from estimated to measured rCBF. The already functional directionality between rCBF and rCBV or between rCBF and suggests that the intimate cellular mechanisms observed in adults, such as the participation of astrocytes and the various signals arising from activated neuronal assemblies and transmitted to perivascular glial endfeet, might be already functional in preterms from 28 wGA, resulting in changes in arterial tone.46 This type of analysis could be applied in clinical practice to investigate whether this relationship between rCBF and rCBV (rCBF and ) persists in patients at risk of neuronal or vascular brain injury (IVH, hydrocephalus, etc.). The results of this study demonstrate the lowest directionality value ( to rCBF) for neonate #9 with bilateral IVH-III and hydrocephalus. Although a greater number of subjects must be included in future studies, this result is in agreement with those we reported in Mahmoudzadeh et al.,47 showing the absence of hemodynamic responses induced by phoneme stimuli in IVH III-IV preterms. The results also demonstrate the highest directionality value (rCBV to rCBF) and ( to rCBF) in neonate #2, who was one of the two patients of our study with an abnormal EEG (positive rolandic spikes). Further studies are also required to assess the developmental dynamics of the relationship between rCBF and rCBV (rCBF and ) at different postnatal ages. The various treatments administered to preterm infants in this study may have influenced the relationship between rCBF and rCBV (rCBF and ). For example, opioids (morphine) may have decreased .48 Moreover, it is widely accepted that neurovascular modulations are highly dependent on sedative treatment including direct cerebral vasodilation and significantly reduced cerebral metabolic demand, which would reduce rCBF in response to neuronal activation during anesthesia.49 Strict coupling between rCBF and cannot be expected under such conditions. Nevertheless, the directionality from rCBF to rCBV (rCBF to ) was preserved even in lightly sedated preterms. 5.ConclusionsThis study focused on the nonlinear relationship between rCBF and rCBV (rCBF and ) in preterm infants recorded before 32 wGA. The mechanisms by which rCBV drives rCBF ( drives rCBF) are already functional at this early age of development regardless of whether or not these two variables are strictly correlated. As the directionality was observed in all preterm infants regardless of the type of anesthesia, it would be interesting to test the application of this technique in routine clinical practice as a potential index of neurovascular coupling in a larger population of preterms at risk of neuronal or vascular brain injury. DisclosuresThe authors declared no potential conflicts of interest with respect to the research, authorship, and/or publication of this article. ReferencesC. S. Roy and C. S. Sherrington,
“On the regulation of the blood-supply of the brain,”
J. Physiol., 11
(1–2), 85
–158
(1890). http://dx.doi.org/10.1113/jphysiol.1890.sp000321 Google Scholar
C. S. Kleinman and I. Seri, Hemodynamics and Cardiology: Neonatology Questions and Controversies, 19103
–2899 Elsevier Health Sciences, Philadelphia, Pennsylvania
(2012). Google Scholar
R. L. Grubb et al.,
“The effects of changes in cerebral blood volume, blood flow, and vascular mean transit time,”
Stroke, 5
(5), 630
–639
(1974). http://dx.doi.org/10.1161/01.STR.5.5.630 Google Scholar
M. Jones et al.,
“Concurrent optical imaging spectroscopy and laser-Doppler flowmetry: the relationship between blood flow, oxygenation, and volume in rodent barrel cortex,”
Neuroimage, 13
(6 Pt 1), 1002
–1015
(2001). http://dx.doi.org/10.1006/nimg.2001.0808 Google Scholar
H. Ito et al.,
“Changes in human cerebral blood flow and cerebral blood volume during hypercapnia and hypocapnia measured by positron emission tomography,”
J. Cereb. Blood Flow Metab., 23
(6), 665
–670
(2003). http://dx.doi.org/10.1097/01.WCB.0000067721.64998.F5 Google Scholar
N. Roche-Labarbe et al.,
“Somatosensory evoked changes in cerebral oxygen consumption measured non-invasively in premature neonates,”
Neuroimage, 85
(Pt 1), 279
–286
(2014). http://dx.doi.org/10.1016/j.neuroimage.2013.01.035 Google Scholar
R. B. Buxton, E. C. Wong and L. R. Frank,
“Dynamics of blood flow and oxygenation changes during brain activation: the balloon model,”
Magn. Reson. Med., 39
(6), 855
–864
(1998). http://dx.doi.org/10.1002/(ISSN)1522-2594 Google Scholar
R. B. Buxton and L. R. Frank,
“A model for the coupling between cerebral blood flow and oxygen metabolism during neural stimulation,”
J. Cereb. Blood Flow Metab., 17
(1), 64
–72
(1997). http://dx.doi.org/10.1097/00004647-199701000-00009 Google Scholar
P. T. Fox and M. E. Raichle,
“Focal physiological uncoupling of cerebral blood flow and oxidative metabolism during somatosensory stimulation in human subjects,”
Proc. Natl. Acad. Sci. U. S. A., 83
(4), 1140
–1144
(1986). http://dx.doi.org/10.1073/pnas.83.4.1140 Google Scholar
H. Fujita et al.,
“Oxygen consumption of cerebral cortex fails to increase during continued vibrotactile stimulation,”
J. Cereb. Blood Flow Metab., 19
(3), 266
–271
(1999). http://dx.doi.org/10.1097/00004647-199903000-00004 Google Scholar
M. Vafaee and A. Gjedde,
“ changes by finger motion: No evidence of flow-metabolism coupling in putamen,”
NeuroImage, 13
(6 Suppl.), 1012
(2001). Google Scholar
M. E. Raichle,
“Behind the scenes of functional brain imaging: a historical and physiological perspective,”
Proc. Natl. Acad. Sci. U. S. A., 95
(3), 765
–772
(1998). http://dx.doi.org/10.1073/pnas.95.3.765 Google Scholar
M. Mahmoudzadeh et al.,
“Syllabic discrimination in premature human infants prior to complete formation of cortical layers,”
Proc. Natl. Acad. Sci., 110
(12), 4846
–4851
(2013). http://dx.doi.org/10.1073/pnas.1212220110 Google Scholar
M. Mahmoudzadeh et al.,
“Functional maps at the onset of auditory inputs in very early preterm human neonates,”
Cereb. Cortex,
(2016). http://dx.doi.org/10.1093/cercor/bhw103 Google Scholar
F. Y. Wong et al.,
“Dopamine therapy promotes cerebral flow-metabolism coupling in preterm infants,”
Intensive Care Med., 35
(10), 1777
–1782
(2009). http://dx.doi.org/10.1007/s00134-009-1602-5 Google Scholar
C. E. Shannon,
“A mathematical theory of communication,”
Bell Syst. Technol. J., 27
(3), 379
–423
(1948). http://dx.doi.org/10.1002/bltj.1948.27.issue-3 Google Scholar
B. Gourevitch and J. J. Eggermont,
“Evaluating information transfer between auditory cortical neurons,”
J. Neurophysiol., 97
(3), 2533
–2543
(2007). http://dx.doi.org/10.1152/jn.01106.2006 Google Scholar
N. Wiener,
“The theory of prediction,”
Modern Mathematics for Engineers, McGraw-Hill, New York
(1956). Google Scholar
M. Wolf and G. Greisen,
“Advances in near-infrared spectroscopy to study the brain of the preterm and term neonate,”
Clin. Perinatol., 36
(4), 807
–834
(2009). http://dx.doi.org/10.1016/j.clp.2009.07.007 Google Scholar
T. Durduran et al.,
“Optical measurement of cerebral hemodynamics and oxygen metabolism in neonates with congenital heart defects,”
J. Biomed. Opt., 15
(3), 037004
(2010). http://dx.doi.org/10.1117/1.3425884 Google Scholar
N. Roche-Labarbe et al.,
“Noninvasive optical measures of CBV, , CBF index, and in human premature neonates’ brains in the first six weeks of life,”
Hum. Brain Mapp., 31
(3), 341
–352
(2010). http://dx.doi.org/10.1002/hbm.v31:3 Google Scholar
M. Nourhashemi, M. Mahmoudzadeh and F. Wallois,
“Thermal impact of near-infrared laser in advanced noninvasive optical brain imaging,”
Neurophotonics, 3
(1), 015001
(2016). http://dx.doi.org/10.1117/1.NPh.3.1.015001 Google Scholar
D. A. Boas and S. J. Payne,
“Comment on ‘Estimating a modified Grubb’s exponent in healthy human brains with near infrared spectroscopy and transcranial Doppler’,”
Physiol. Meas., 30
(10), L9
–L11
(2009). http://dx.doi.org/10.1088/0967-3334/30/10/L01 Google Scholar
T. S. Leung et al.,
“Estimating a modified Grubb’s exponent in healthy human brains with near infrared spectroscopy and transcranial Doppler,”
Physiol. Meas., 30
(1), 1
–12
(2009). http://dx.doi.org/10.1088/0967-3334/30/1/001 Google Scholar
M. A. Franceschini et al.,
“Assessment of infant brain development with frequency-domain near-infrared spectroscopy,”
Pediatr. Res., 61
(5 Pt 1), 546
–551
(2007). http://dx.doi.org/10.1203/pdr.0b013e318045be99 Google Scholar
O. B. Paulson, S. Strandgaard and L. Edvinsson,
“Cerebral autoregulation,”
Cerebrovasc. Brain Metab. Rev., 2
(2), 161
–192
(1990). Google Scholar
S. J. Matcher et al.,
“Absolute quantification methods in tissue near-infrared spectroscopy,”
Proc. SPIE, 2389 486
–495
(1995). http://dx.doi.org/10.1117/12.209997 Google Scholar
J. P. Culver et al.,
“Diffuse optical tomography of cerebral blood flow, oxygenation, and metabolism in rat during focal ischemia,”
J. Cereb. Blood Flow Metab., 23
(8), 911
–924
(2003). http://dx.doi.org/10.1097/01.WCB.0000076703.71231.BB Google Scholar
H. M. Watzman et al.,
“Arterial and venous contributions to near-infrared cerebral oximetry,”
Anesthesiology, 93
(4), 947
–953
(2000). http://dx.doi.org/10.1097/00000542-200010000-00012 Google Scholar
S. Wray et al.,
“Characterization of the near infrared absorption spectra of cytochrome aa3 and haemoglobin for the non-invasive monitoring of cerebral oxygenation,”
Biochim. Biophys. Acta, 933
(1), 184
–192
(1988). http://dx.doi.org/10.1016/0005-2728(88)90069-2 Google Scholar
T. L. Davis et al.,
“Calibrated functional MRI: mapping the dynamics of oxidative metabolism,”
Proc. Natl. Acad. Sci. U. S. A., 95
(4), 1834
–1839
(1998). http://dx.doi.org/10.1073/pnas.95.4.1834 Google Scholar
T. Schreiber,
“Measuring information transfer,”
Phys. Rev. Lett., 85
(2), 461
–464
(2000). http://dx.doi.org/10.1103/PhysRevLett.85.461 Google Scholar
P. L. Madsen et al.,
“Cerebral metabolism and cerebral blood flow in humans during deep and rapid-eye-movement sleep,”
J. Appl. Physiol., 70
(6), 2597
–2601
(1991). Google Scholar
A. M. Lam et al.,
“Change in cerebral blood flow velocity with onset of EEG silence during inhalation anesthesia in humans: evidence of flow-metabolism coupling?,”
J. Cereb. Blood Flow Metab., 15
(4), 714
–717
(1995). http://dx.doi.org/10.1038/jcbfm.1995.88 Google Scholar
R. L. Grubb et al.,
“The effects of changes in cerebral blood volume, blood flow, and vascular mean transit time,”
Stroke, 5
(5), 630
–639
(1974). http://dx.doi.org/10.1161/01.STR.5.5.630 Google Scholar
L. Sokoloff et al.,
“The [14C]deoxyglucose method for the measurement of local cerebral glucose utilization: theory, procedure, and normal values in the conscious and anesthetized albino rat,”
J. Neurochem., 28
(5), 897
–916
(1977). http://dx.doi.org/10.1111/jnc.1977.28.issue-5 Google Scholar
B. M. Cohen et al.,
“Abnormalities of regional distribution of cerebral vasculature in schizophrenia detected by dynamic susceptibility contrast MRI,”
Am. J. Psychiatry, 152
(12), 1801
–1803
(1995). http://dx.doi.org/10.1176/ajp.152.12.1801 Google Scholar
D. Malonek et al.,
“Vascular imprints of neuronal activity: relationships between the dynamics of cortical blood flow, oxygenation, and volume changes following sensory stimulation,”
Proc. Natl. Acad. Sci., 94
(26), 14826
–14831
(1997). http://dx.doi.org/10.1073/pnas.94.26.14826 Google Scholar
S. A. Sheth et al.,
“Spatiotemporal evolution of functional hemodynamic changes and their relationship to neuronal activity,”
J. Cereb. Blood Flow Metab., 25
(7), 830
–841
(2005). http://dx.doi.org/10.1038/sj.jcbfm.9600091 Google Scholar
W. Kuschinsky and O. B. Paulson,
“Capillary circulation in the brain,”
Cerebrovasc. Brain Metab. Rev., 4
(3), 261
–286
(1992). Google Scholar
B. Cauli and E. Hamel,
“Revisiting the role of neurons in neurovascular coupling,”
Front. Neuroenerg., 2 9
(2010). http://dx.doi.org/10.3389/fnene.2010.00009 Google Scholar
A. F. McCaslin et al.,
“In vivo 3D morphology of astrocyte-vasculature interactions in the somatosensory cortex: implications for neurovascular coupling,”
J. Cereb. Blood Flow Metab., 31
(3), 795
–806
(2011). http://dx.doi.org/10.1038/jcbfm.2010.204 Google Scholar
G. Greisen,
“Cerebral blood flow in preterm infants during the first week of life,”
Acta Paediatr. Scand., 75
(1), 43
–51
(1986). http://dx.doi.org/10.1111/apa.1986.75.issue-1 Google Scholar
R. W. Baumgartner, Handbook on Neurovascular Ultrasound, S. Karger AG, Basel, Switzerland
(2006). Google Scholar
W. Kuschinsky,
“Coupling of function, metabolism, and blood flow in the brain,”
Neurosurg. Rev., 14
(3), 163
–168
(1991). http://dx.doi.org/10.1007/BF00310651 Google Scholar
O. B. Paulson et al.,
“Cerebral blood flow response to functional activation,”
J. Cereb. Blood Flow Metab., 30
(1), 2
–14
(2010). http://dx.doi.org/10.1038/jcbfm.2009.188 Google Scholar
M. Mahmoudzadeh et al.,
“Consequence of intraventricular hemorrhage on neurovascular coupling evoked by speech syllables in preterm neonates,”
(2016). Google Scholar
H. Uchino et al., Neuroanesthesia and Cerebrospinal Protection, Springer, Japan
(2015). Google Scholar
Y. Kuroda et al.,
“Blood flow velocity of middle cerebral artery during prolonged anesthesia with halothane, isoflurane, and sevoflurane in humans,”
Anesthesiology, 87
(3), 527
–532
(1997). http://dx.doi.org/10.1097/00000542-199709000-00011 Google Scholar
|