
|
|
1.Introduction—Voltage-Sensitive Dye Imaging In Vivo, the Groundbreaking StepThe use of voltage-sensitive dye as a probe for optical detection of excitation across neuronal membranes started with experiments on nerve trunks from the legs of lobsters and spider crabs1 and with recordings of single cell action potentials in neurons of leech segmental ganglia.2 More than twenty years later, a further breakthrough for this technique was established when Grinvald et al.3 demonstrated voltage-sensitive fluorescent recordings from monkey primary visual cortex. This represented the first successful in vivo real-time imaging of activity within the mammalian cortex (but see Ref. 4). Using this technique, Grinvald and colleagues could, for the first time, visualize at the functional level how a small visual stimulus (a square of light) produces far-spreading activity in primary visual cortex (V1), much beyond the region of thalamic input (Fig. 1). Hence, the method provided direct evidence of the impact of dendritic integration and the functional properties of long-range horizontal connections5–8 at the neuronal population level. Fig. 1Horizontal connections and the cortical point-spread function. Histological section of cortical tissue after staining with cytochrome oxidase that visualizes the regular mosaic pattern of oxidase blobs in V1 (Macaque monkey). The small square in the center of the image approximates the region that is activated by feedforward thalamic input using a visual stimulus as small as in size. The center ellipse delineates the region where activity measured with VSDI dropped to (37%); the outer ellipse refers to decline of (14%) of an approximated exponential fit to the data. What is exemplified here is that due to activity across long-range horizontal connections, a much larger region was covered than expected from direct thalamic input (square in the middle). As a consequence, neurons are involved in the processing of even such a small and most simple square stimulus. Reproduced with permission from Ref. 3. 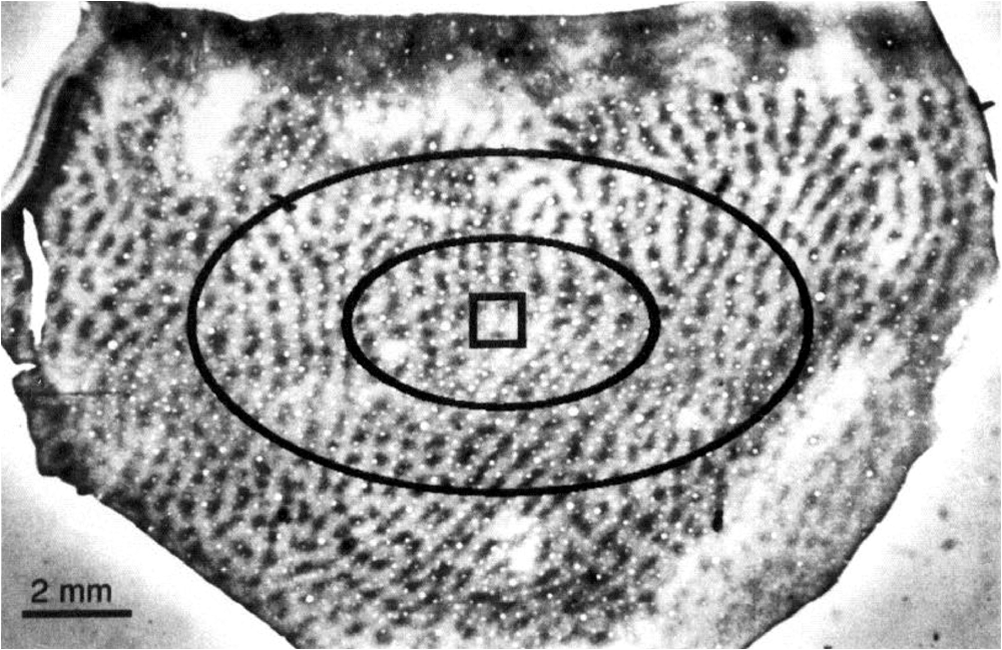 Because from then on voltage-sensitive dye imaging (VSDI) was shown to allow for recordings along a continuum of membrane potentials, far spread interactions of neuronal populations across long-range connections, constituting gradual input from outside the classical receptive field,9 became optically accessible. Moreover, in animals with small brains, such as mice, the wide field of view provided by high numerical aperture10 (several square millimeters of cortex), permitted simultaneous recordings of multiple brain areas.11 Finally, the major advantage of VSDI, that is, its high spatiotemporal resolution in capturing large-scale subthreshold activations, makes it possible to track widespread interactions within and across different cortical areas (including frontal regions) during sensorimotor tasks,12,13 giving experimental access to key theoretical questions related to cerebral coding strategies during behavior.14–16 2.Catching the Voltage Gradient—Retinotopic Motion Signals Across V1What would be a simple and straightforward stimulation paradigm to image the local propagation of subthreshold activity, and in particular, its functional impact on V1 output? To explore this question, Amiram Grinvald gave me the unique opportunity to measure cortical responses to the line-motion paradigm17 during my time as a postdoc in his laboratory (where Amos Arieli, Dahlia Sharon, David Omer, and Ivo Vanzetta introduced to me the demanding surgery and imaging procedures with invaluable patience). In the line-motion paradigm [Fig. 2(a)], illusory motion is perceived along a line flashed briefly after the presentation of a small spot, such that the line appears drawn out from the location of the preceding spot [Fig. 2(b)]. Hence, it was hypothesized that the sensation of motion evoked by the subsequently flashed line could result from sequential suprathreshold activation mimicking real motion drawing away from the local cue.17–20 Fig. 2Boosting of cortical spread in the line-motion paradigm. (a) The line-motion condition: A small spot (“cue”) is briefly presented before a bar stimulus. (b) Human subjects report illusory line-drawing. (c)–(f) VSDI of patterns of evoked cortical activity as a function of time (average across 22 repetitions). Yellow dotted contours approximate retinotopic representation of the stimuli. White contours delimit low-amplitude activity (significance level; ). The cortical area imaged is shown at upper right. Scale bar 1 mm; P, posterior; M, medial. Green vertical lines in (f) indicate estimated position of the stimuli along posterior–anterior axis. Time in milliseconds after stimulus onset is shown at the top. Stimulation time is shown at the bottom of each row. Color scale indicates averaged fractional changes in fluorescence intensity (). Stimuli: (c) flashed small square. (d) Flashed bar. (e) Line-motion paradigm. (f) Moving small square (). Modified from Ref. 20.  Figure 2(c) shows cortical responses (in V1 of an anaesthetized cat) evoked by the spot when it was flashed alone.20 Consistent with spreading along horizontal connections, postsynaptic subthreshold activity propagated at a speed of (Refs. 3 and 9) and extended far beyond the suprathreshold retinotopic representation of the square (reddish colors encircled by black contours). The second stationary stimulus, the bar that was flashed alone 60 ms later, yielded a similar finding [Fig. 2(d)]—that is, high-level activity delineated a circumscribed region representing the elongated retinotopic shape of the bar almost immediately (arrows). In contrast, when the line-motion condition was presented, we found that high-amplitude activity did not remain stable, but was gradually drawn out toward the end of the cortical bar representation [Fig. 2(e), lower arrows]. To compare how physical motion is represented across the imaged cortical area, the small square was moved across exactly the same region as that covered by the bar [Fig. 2(f)]. Similar to the line-motion condition, the moving square evoked high-amplitude activity propagating anteriorly (see black contours and lower arrows), reflecting the retinotopic motion trajectory of the square. In summary, using the line-motion paradigm, we were able to visualize directly how the horizontal cortical spread of activity was gradually boosted when a second stimulus appeared in rapid succession to the first. Hence, perception of apparent line-motion under our conditions19 may establish “seeing” one’s own previously subthreshold propagating activity that is gradually and asymmetrically boosted above detection threshold. These observations suggest that higher brain areas may directly use retinotopic motion signals for creating the perception of motion. In support of this idea, we recently showed—using another paradigm that creates apparent motion perception in humans—how asymmetrically propagating activity resembles the perceived direction of motion.21 Once again, the high spatiotemporal resolution of VSDI enabled us to track activity within milliseconds across several millimeters of cortex at submillimeter resolution (Fig. 3). Fig. 3Boosting of cortical spread through counterchange of luminance at two neighboring locations. First row: upper square turns dark, whereas lower square turns bright (B, background). Second row: lower square turns dark and upper square turns bright. Colorbar indicates activity levels (average across 24 repetitions). White contours in right frames encircle amplitude levels with . White bar in frame at , horizontal reference lines are 1.6 mm apart. Right column: space-time plots of activity in 1% steps (30% to 70%) of maximum amplitude. Line colors match color scale of image frames. Each line connects locations with same amplitude levels (mean across the central 7 pixels constituting each wave front and back) in anterior and posterior directions. Reproduced from Ref. 21. 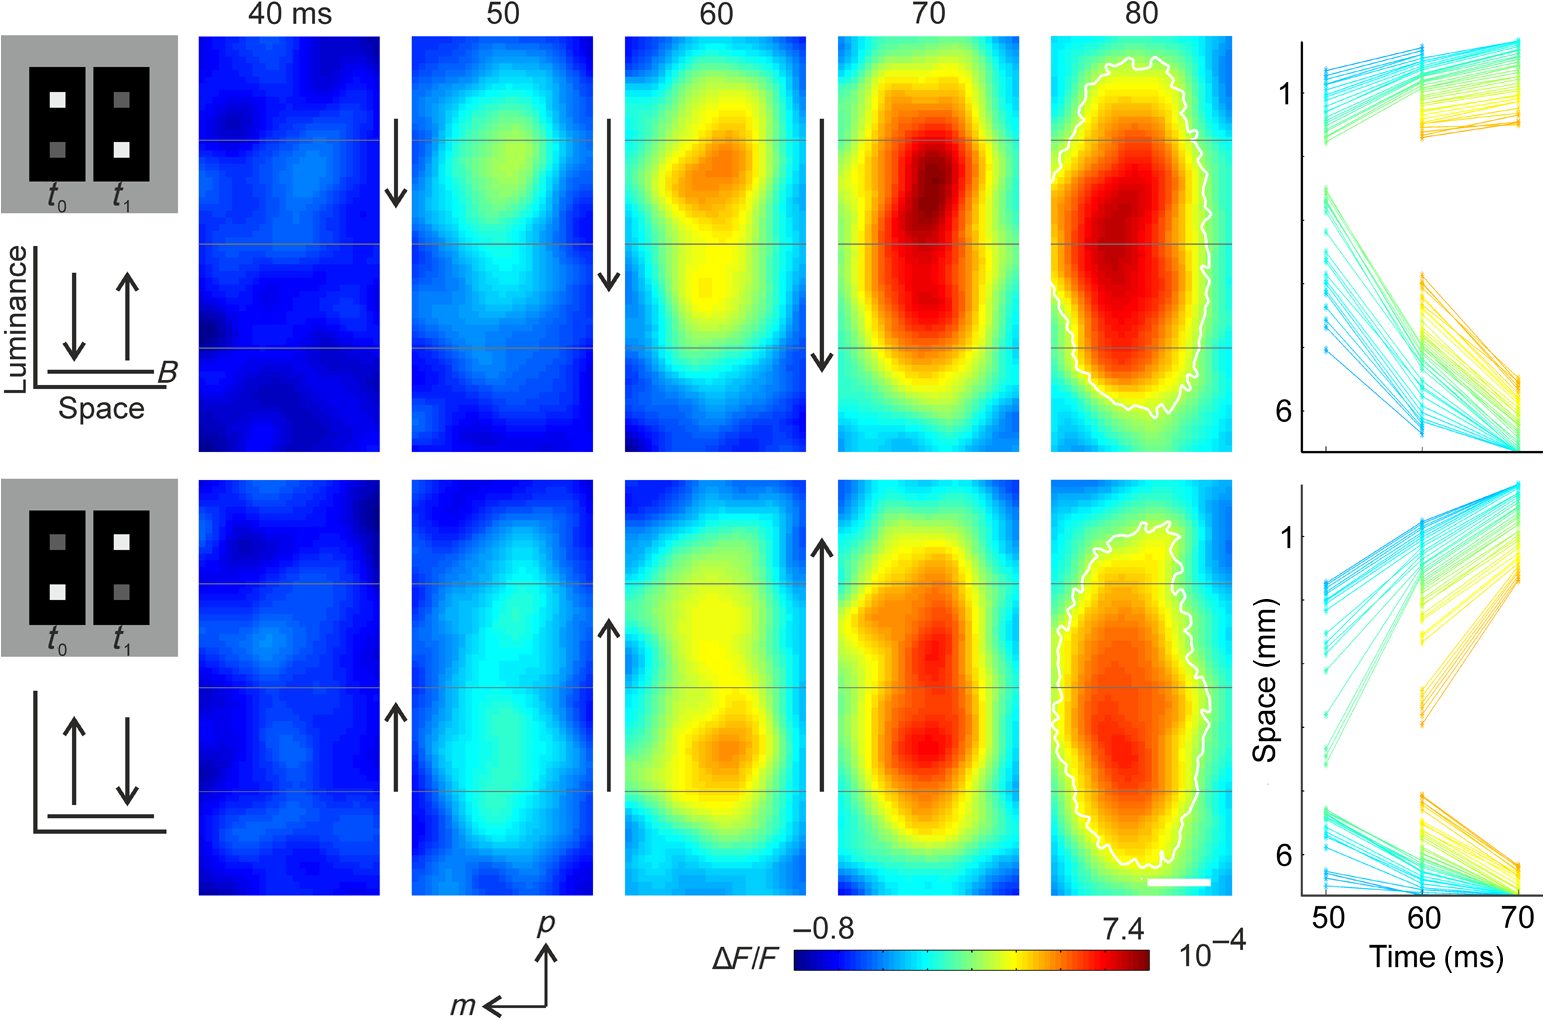 Specifically, we imaged cortical responses after two squares presented at neighboring locations counterchanged luminance at the same time22 (i.e., there was a luminance decrement for one square and a luminance increment for the other; see icons in Fig. 3). The first row in Fig. 3 depicts the case in which the upper square was darkened, whereas the neighboring lower square was brightened. Starting from the initial region of the cortical responses representing the upper square (posterior in the images), activity was successively drawn out toward the cortical location representing the brightened square (as indicated by the downward arrows). Thus, similar to the line-motion condition and as observed with squares moving continuously through visual space at high velocities [Figs. 2(e) and 2(f)], we found an asymmetric propagation of activity that was continuously elongated in the form of a cortical motion streak (for similar observations using subsequently flashed squares in an apparent motion paradigm, see Refs. 23 and 24). When the polarity of the luminance changes was reversed, the trajectory was also reversed (Fig. 3, bottom row). Thus, in both cases, a wavefront of activity propagated from the cortical sites representing the darkened stimulus toward locations representing the brightened stimulus. Because we found faster rise times () and faster decay for the bright to dark than the dark to bright changes, our results suggest that dark and bright spatiotemporal asymmetries25–33 provide a main driving force for this effect. Moreover, we proposed that the observed propagation may play a role in the generation of V1 motion signals that are independent of contrast polarity34 (for review, see Ref. 35). In principle, any feature could create these activation changes36 (e.g., a contrast edge or a bright luminance patch moving from one retinal location [activation decreases] to another [activation increases]). This flexibility provides redundancy that is crucial for perceiving object motion in natural environments when some object features are hard to discriminate from their background. Such flexibility also allows features that contribute to perceiving an object’s motion to become salient for the perception of the object’s shape and the discrimination of the object from others in the scene. Note that the asymmetric propagation occurred within a narrow range of signal amplitudes and could possibly be detected through the VSDI technique only at high signal-to-noise ratios and if the difference in activity between the locations representing the luminance counterchange was steep enough. This observation fits well with the recent discovery that luminance polarity is encoded by modular maps across V1.37–39 Consequently, the steepness of the gradient of activities produced between two cortical locations is critically dependent on where exactly the luminance counterchange occurs (e.g., dark input to a cortical patch that codes for light and vice versa will create only mild gradients). In fact, we speculate that the mechanism might either demand spatial integration over larger parts of a visual scene or that it is most effective at high-contrast stimulus borders where the luminance profile allows for overcoming noise associated with the detection of spatiotemporal gradients—as suggested in theoretical approaches to human motion detection.40,41 To summarize, in both motion examples presented here, the main point in terms of the proposed underlying cortical mechanisms is that delayed input boosted subthreshold spread induced by preceding input. This created a gradual and asymmetrical propagation of mass population activity across retinotopic cortical coordinates, even though no physical (stimulus) motion was present. Interestingly, using a two-stroke apparent motion paradigm and intracellular recordings, facilitation of previously initiated subthreshold spread was demonstrated to be most effective when the stimulus onset asynchrony was as short as 20 milliseconds.42,43 In the case of the line-motion condition, the required asynchrony may be provided by the visual stimulation itself (first the flash, then the bar), whereas in the case of the luminance counterchange condition (synchronous by definition), asynchrony emerges from the intrinsic temporal offset between the processing of stimulus darkening and brightening. Clearly, in both conditions additional suppressive normalization mechanisms are most likely involved,44–48 as significant subadditivity was shown for both examples.20,21 3.Where is Propagation in V1 Decoded and When?The claim that local motion signals in V1 are encoded in terms of retinotopically and asymmetrically propagating activity may appear trivial at first sight. In light of the well-known retinotopic organization of V1,49–51 any shift of a stimulus across receptive fields must lead to propagation of activity at the population level, both in stimulus space52 and in cortical coordinates. For instance, using VSDI to record cortical responses to standard drifting gratings, we visualized (for the first time though) the expected retinotopic propagation of the gratings’ stripes across simultaneously active orientation domaines.31 In addition, and surprisingly, we also found a salient propagation of the gratings’ first harmonics, possibly indicating increased strength of V1 responses for dark versus light stimuli.32,53 Note that such retinotopic waves could be used by higher cortical areas to resolve ambiguities that are inherent to maps formed by solely spatiotemporal filtering of moving stimuli.54,55 More importantly, however, in all cases shown here subthreshold activity spread ahead of thalamic input, enabling cortical neurons to “sense” regions beyond their classical receptive field borders.56 Thus, stimuli moving coherently in visual space generate a wave that activates cortical locations in front of the stimulus’s trajectory [Fig. 2(f)]. This property may become particularly relevant when an object moves quickly, as neuronal processing delays may create the problem of being perceptually offset from their physical position.57,58 Subthreshold spread may, therefore, constitute a possible substrate for preactivation, as has been additionally implied by psychophysical studies in humans.59 As a consequence, cortical processing times may partially be compensated by preactivation to allow for faster spiking for a moving stimulus as compared to a single flash.20,52,60 Such an anticipatory mechanism implies immediate processing which is eventually coupled to immediate awareness (but see Ref. 61). In any case, both examples highlight a second important signature of retinotopic motion signals propagating in V1. That is, following the propagating wavefront, a motion streak was generated. Using a population approach, it has been shown earlier that such cortical streaks contain information about the orientation of an object’s trajectory.62 In other words, a second stimulus feature (here orientation) that was not present instantaneously (and not in the physical stimulus) was formed sequentially through spatiotemporal integration of the motion path. On the one hand, the emergence of motion streaks appears undesirable for sensation and indeed, mechanisms exist to suppress them.60,63–65 In contrast, it has been shown that information about motion axes is still present across neuronal activity and can be extracted from motion streaks.66–70 Thus, motion streaks may be analyzed unconsciously and separately over time71–74 to contribute to further analysis such as form-from-motion at higher processing stages.20,21,62,69,70,75–80 Interactions mediated by propagating waves of cortical population activity across V1 have been demonstrated for a variety of mammalian species (for example, see Refs. 20 and 8182.83.84.85.86.87.88.89.90.–91). Functional implications of these waves have been discussed in different contexts such as plasticity,92,93 contrast normalization,94,95 and feedback from higher brain areas due to apparent motion stimuli.24,96,97 There is no clear answer to where and when these signals are finally integrated to form perception. However, regardless of whether the propagating activity as reported here may directly subserve “perceptual knowledge” or initially “hidden” cortical analysis of motion,71 any retinotopic encoding of motion further downstream through propagating waves must engage mechanisms that emerge from the topography of early cortical areas such as V1.69,98 Indeed, characterizing human motion detectors in space-time coordinates99 led to the discovery of a previously unknown brief increase in detector amplitude at motion onset.100 The perceptual relevance of retinotopic encoding of motion trajectories in V1 (Ref. 101) was, furthermore, demonstrated using a “path-guided” apparent motion paradigm in combination with fMRI.102 The above authors found a curved illusory filling-in of the motion path in V1 that strongly correlated with the observers’ perception.102 Strikingly, in behaving mice, activity trajectories in V1 correlated with bistable perceptual switches using an apparent motion quartet as a stimulus.97 Altogether these results imply that retinotopically propagating activity across V1, as observed in the presented studies, may have implications for the encoding of signatures of motion and may influence perceived shape dependent on the dynamics of the read-out at higher brain stages. 4.Importing VSDI Techniques from Israel to My Lab in GermanyIt is noteworthy to emphasize that Amiram Grinvald’s support and help was most valuable for the adventure of building up an imaging system in my own laboratory, where we used VSDI in a variety of settings. For example, we were the first using VSDI to record V1 population activity patterns in response to natural movies,103 revealing increased sparseness,104,105 a larger fraction of space-time inseparable dynamics,106 and a more effective balance between excitation and inhibition107,108 in comparison to simple grating stimuli.103 Using VSDI, we showed predictive coding in V1 in a strict sense, signifying differences in feature representation (i.e., orientation) of past and present inputs.109 We also pioneered the use of VSDI in pigeons110 and showed that these highly visual animals have no orientation maps in the assumed homolog of mammalian V1. Instead, we demonstrated overrepresentation of vertical orientation, possibly as a result of adaptation to biased input statistics.35,111 Furthermore, we used VSD to image for the first time the trigeminal ganglion of rats, showing the formation of activity pattern in response to various volatile substances.112 Recently, we used VSDI to explore the effects of transcranial magnetic stimulation (TMS) on V1 activity and its induced plastic changes.113 In these settings (i.e., using light as a measure), VSDI has the advantage of being able to avoid interference with the strong TMS-induced electric field. 5.ConclusionsVSDI enables to record neuronal ensemble activity over a wide field of view with high precision. Hence, evoked space-time interdependencies between large pools of cortical neurons can be measured with high spatiotemporal accuracy, as exemplified here. Also information encoded by synchrony114 or decorrelation mechanisms115 within spatiotemporal activity patterns116,117 can be obtained, which may otherwise be detected using only densely spaced multielectrode arrays. Likewise, any systematic mapping (if orthogonal to the image plane) of visual stimulus parameter combinations that are represented across groups of neurons can be tracked instantaneously across cortical coordinates,31 as the optically measured activity provides an immediate link to the functional cortical architecture.118–120 Here, two examples in the visual domain were presented, where propagation of cortical activity emerges from local space-time imbalances in the computation of external input.20,21 The crucial factor for both instances is that local input creates cortical spread, which builds up a gradient of activity—from subthreshold to suprathreshold levels. The initial temporal advance in the generation of precuing activity enables subsequent input to boost asymmetric propagation of suprathreshold activity in V1. The following emergence of cortical motion streaks indicates additional integration processes over time.42,43,62,67,69,103 However, there are some disadvantages of the method worthy of discussion. From a purely technical point of view, besides being restricted to surface cortical regions, the method does not permit the use of freely moving subjects. Thus, head-fixed preparations must be applied, at least at the time of this writing. From a physiological viewpoint, although some recently reported interaction with GABAA receptors121 might be of negligible size,122,123 it remains largely unexplored how far pharmacological side effects might possibly affect the signal.120 In addition, the often found relatively low signal-to-noise ratio (significantly influenced by “biological noise”) frequently requires averaging across repeated trials. However, it should be noted that advanced postprocessing algorithms31,90,124,125 and excellent handling of the method allows single-trial read-outs in anaesthetized, awake, and also in the behaving animal (for example, see Refs. 84, 90, 115, and 116). The fact that the portion of activity originating from distinct (e.g., inhibitory or excitatory) populations of neurons cannot be distinguished is a disadvantage for addressing questions related to interactions between different cell-specific circuitries (note that, on the upside, it avoids biased sampling of neurons and captures net population activity irrespective of preferred feature selectivity, thus providing an accurate picture of the global state of the cortex). Moreover, the wide spread of activity observed with VSDI (up to several millimeters) might include contributions from fibers of passage that shadow spatiotemporal interactions between more closely coupled groups of neurons. Finally, the use of voltage-sensitive dyes requires craniotomy in animal models and in most cases also removal of the dura to obtain proper staining. The staining itself may occupy potential measurement times. Most important, however, is that the invasive nature of the procedure hinders chronic monitoring as it bears the risk of tissue irritation or invoking inflammatory processes. Recently developed genetically encoded voltage indicators (GEVIs) may improve upon such technical shortcomings related to VSDI.126 In particular, GEVIs allow targeting of specific cell populations and, thus, provide the unique property of selective staining of specific cell types. We may await even more exciting times once these methodologies are available in species other than the current dominant mouse model. “For every change, you pay” was a favorite sentence that I heard from Amiram Grinvald whenever I enthusiastically suggested new settings or experimental approaches during my postdoc time in his lab. He certainly knew better than me after having laid the foundation of in vivo wide-field optical imaging of voltage changes across cerebral cortex. AcknowledgmentsThe author was funded by Minerva Fellowship (The German Federal Ministry for Education and Research) and by grants from the Deutsche Forschungsgemeinschaft, SFB-874 (TP A2), German-Israeli Project Cooperation (DIP, JA 945/3-1, SL 185/1-1), SPP 1665 (JA 945/4-1), and the Bundesministerium für Bildung und Forschung, BMBF, Bernstein Group Computational Neuroscience Bochum. ReferencesI. Tasaki et al.,
“Changes in fluorescence, turbidity, and birefringence associated with nerve excitation,”
Proc. Natl. Acad. Sci. U. S. A., 61 883
–888
(1968). http://dx.doi.org/10.1073/pnas.61.3.883 Google Scholar
B. M. Salzberg, H. V. Davila and L. B. Cohen,
“Optical recording of impulses in individual neurones of an invertebrate central nervous system,”
Nature, 246 508
–509
(1973). http://dx.doi.org/10.1038/246508a0 Google Scholar
A. Grinvald et al.,
“Cortical point-spread function and long-range lateral interactions revealed by real-time optical imaging of macaque monkey primary visual cortex,”
J. Neurosci., 14 2545
–2568
(1994). JNRSDS 0270-6474 Google Scholar
G. Blasdel and G. Salama,
“Voltage-sensitive dyes reveal a modular organization in monkey striate cortex,”
Nature, 321 579
–585
(1986). http://dx.doi.org/10.1038/321579a0 Google Scholar
R. A. Fisken, L. J. Garey and T. P. Powell,
“The intrinsic, association and commissural connections of area 17 on the visual cortex,”
Philos. Trans. R. Soc. London Ser. B, Biol. Sci., 272 487
–536
(1975). http://dx.doi.org/10.1098/rstb.1975.0099 Google Scholar
O. D. Creutzfeldt et al.,
“The distribution of degenerating axons after small lesions in the intact and isolated visual cortex of the cat,”
Exp. Brain Res., 27 419
–440
(1977). http://dx.doi.org/10.1007/BF00235514 EXBRAP 0014-4819 Google Scholar
C. D. Gilbert and T. N. Wiesel,
“Morphology and intracortical projections of functionally characterised neurones in the cat visual cortex,”
Nature, 280 120
–125
(1979). http://dx.doi.org/10.1038/280120a0 Google Scholar
K. S. Rockland and J. S. Lund,
“Widespread periodic intrinsic connections in the tree shrew visual cortex,”
Science, 215 1532
–1534
(1982). http://dx.doi.org/10.1126/science.7063863 SCIEAS 0036-8075 Google Scholar
V. Bringuier et al.,
“Horizontal propagation of visual activity in the synaptic integration field of area 17 neurons,”
Science, 283 695
–699
(1999). http://dx.doi.org/10.1126/science.283.5402.695 SCIEAS 0036-8075 Google Scholar
E. H. Ratzlaff and A. Grinvald,
“A tandem-lens epifluorescence macroscope: hundred-fold brightness advantage for wide-field imaging,”
J. Neurosci. Methods, 36 127
–137
(1991). http://dx.doi.org/10.1016/0165-0270(91)90038-2 JNMEDT 0165-0270 Google Scholar
F. Matyas et al.,
“Motor control by sensory cortex,”
Science, 330 1240
–1243
(2010). http://dx.doi.org/10.1126/science.1195797 SCIEAS 0036-8075 Google Scholar
V. Sreenivasan et al.,
“Parallel pathways from whisker and visual sensory cortices to distinct frontal regions of mouse neocortex,”
Neurophotonics, 4 031203
(2017). http://dx.doi.org/10.1117/1.NPh.4.3.031203 Google Scholar
A. Kyriakatos et al.,
“Voltage-sensitive dye imaging of mouse neocortex during a whisker detection task,”
Neurophotonics, 4 031204
(2017). http://dx.doi.org/10.1117/1.NPh.4.3.031204 Google Scholar
Y. Chen, W. S. Geisler and E. Seidemann,
“Optimal temporal decoding of neural population responses in a reaction-time visual detection task,”
J. Neurophysiol., 99 1366
–1379
(2008). http://dx.doi.org/10.1152/jn.00698.2007 JONEA4 0022-3077 Google Scholar
E. Seidemann et al.,
“Dynamics of depolarization and hyperpolarization in the frontal cortex and saccade goal,”
Science, 295 862
–865
(2002). http://dx.doi.org/10.1126/science.1066641 SCIEAS 0036-8075 Google Scholar
A. Gilad and H. Slovin,
“Population responses in V1 encode different figures by response amplitude,”
J. Neurosci., 35 6335
–6349
(2015). http://dx.doi.org/10.1523/JNEUROSCI.0971-14.2015 JNRSDS 0270-6474 Google Scholar
O. Hikosaka, S. Miyauchi and S. Shimojo,
“Focal visual attention produces illusory temporal order and motion sensation,”
Vision Res., 33 1219
–1240
(1993). http://dx.doi.org/10.1016/0042-6989(93)90210-N VISRAM 0042-6989 Google Scholar
M. Von Grünau, L. Racette and M. Kwas,
“Measuring the attentional speed-up in the motion induction effect,”
Vision Res., 36 2433
–2446
(1996). http://dx.doi.org/10.1016/0042-6989(95)00326-6 VISRAM 0042-6989 Google Scholar
S. Han et al.,
“Illusory line motion in onset and offset bars,”
Atten. Percept. Psychophys., 78
(8), 2579
–2611
(2016). http://dx.doi.org/10.3758/s13414-016-1170-z Google Scholar
D. Jancke et al.,
“Imaging cortical correlates of illusion in early visual cortex,”
Nature, 428 423
–426
(2004). http://dx.doi.org/10.1038/nature02396 Google Scholar
S. Rekauzke et al.,
“Temporal asymmetry in dark-bright processing initiates propagating activity across primary visual cortex,”
J. Neurosci., 36 1902
–1913
(2016). http://dx.doi.org/10.1523/JNEUROSCI.3235-15.2016 JNRSDS 0270-6474 Google Scholar
H. S. Hock, L. A. Gilroy and G. Harnett,
“Counter-changing luminance: a non-Fourier, non-attentional basis for the perception of single-element apparent motion,”
J. Exp. Psychol. Hum. Percept. Perform., 28 93
–112
(2002). http://dx.doi.org/10.1037/0096-1523.28.1.93 Google Scholar
B. Ahmed et al.,
“Cortical dynamics subserving visual apparent motion,”
Cereb. Cortex, 18 2796
–2810
(2008). http://dx.doi.org/10.1093/cercor/bhn038 53OPAV 1047-3211 Google Scholar
G. Deco and P. Roland,
“The role of multi-area interactions for the computation of apparent motion,”
Neuroimage, 51 1018
–1026
(2010). http://dx.doi.org/10.1016/j.neuroimage.2010.03.032 NEIMEF 1053-8119 Google Scholar
V. Zemon, J. Gordon and J. Welch,
“Asymmetries in ON and OFF visual pathways of humans revealed using contrast-evoked cortical potentials,”
Visual Neurosci., 1 145
–150
(1988). http://dx.doi.org/10.1017/S0952523800001085 VNEUEY Google Scholar
B. T. Backus and I. Oruc,
“Illusory motion from change over time in the response to contrast and luminance,”
J. Vision, 5 1055
–1069
(2005). http://dx.doi.org/10.1167/5.11.10 1534-7362 Google Scholar
J. Z. Jin et al.,
“On and off domains of geniculate afferents in cat primary visual cortex,”
Nat. Neurosci., 11 88
–94
(2008). http://dx.doi.org/10.1038/nn2029 Google Scholar
H. S. Hock, G. Schöner and L. Gilroy,
“A counterchange mechanism for the perception of motion,”
Acta Psychol., 132 1
–21
(2009). http://dx.doi.org/10.1016/j.actpsy.2009.06.006 Google Scholar
C. I. Yeh, D. Xing and R. M. Shapley,
“‘Black’ responses dominate macaque primary visual cortex v1,”
J. Neurosci., 29 11753
–11760
(2009). http://dx.doi.org/10.1523/JNEUROSCI.1991-09.2009 JNRSDS 0270-6474 Google Scholar
D. Xing, C. I. Yeh and R. M. Shapley,
“Generation of black-dominant responses in V1 cortex,”
J. Neurosci., 30 13504
–13512
(2010). http://dx.doi.org/10.1523/JNEUROSCI.2473-10.2010 JNRSDS 0270-6474 Google Scholar
S. Onat et al.,
“Independent encoding of grating motion across stationary feature maps in primary visual cortex visualized with voltage-sensitive dye imaging,”
Neuroimage, 55 1763
–1770
(2011). http://dx.doi.org/10.1016/j.neuroimage.2011.01.004 NEIMEF 1053-8119 Google Scholar
J. Kremkow et al.,
“Neuronal nonlinearity explains greater visual spatial resolution for darks than lights,”
Proc. Natl. Acad. Sci. U. S. A., 111 3170
–3175
(2014). http://dx.doi.org/10.1073/pnas.1310442111 Google Scholar
K. Liu and H. Yao,
“Contrast-dependent OFF-dominance in cat primary visual cortex facilitates discrimination of stimuli with natural contrast statistics,”
Eur. J. Neurosci., 39 2060
–2070
(2014). http://dx.doi.org/10.1111/ejn.2014.39.issue-12 EJONEI 0953-816X Google Scholar
M. Edwards and D. R. Badcock,
“Global motion perception: interaction of the ON and OFF pathways,”
Vision Res., 34 2849
–2858
(1994). http://dx.doi.org/10.1016/0042-6989(94)90054-X VISRAM 0042-6989 Google Scholar
C. W. Clifford and M. R. Ibbotson,
“Fundamental mechanisms of visual motion detection: models, cells and functions,”
Prog. Neurobiol., 68 409
–437
(2002). http://dx.doi.org/10.1016/S0301-0082(02)00154-5 PGNBA5 0301-0082 Google Scholar
M. Seifert and H. S. Hock,
“The independent detection of motion energy and counterchange: flexibility in motion detection,”
Vision Res., 98 61
–71
(2014). http://dx.doi.org/10.1016/j.visres.2014.03.006 VISRAM 0042-6989 Google Scholar
G. B. Smith, D. E. Whitney and D. Fitzpatrick,
“Modular representation of luminance polarity in the superficial layers of primary visual cortex,”
Neuron, 88 805
–818
(2015). http://dx.doi.org/10.1016/j.neuron.2015.10.019 NERNET 0896-6273 Google Scholar
K. S. Lee, X. Huang and D. Fitzpatrick,
“Topology of ON and OFF inputs in visual cortex enables an invariant columnar architecture,”
Nature, 533 90
–94
(2016). http://dx.doi.org/10.1038/nature17941 Google Scholar
J. Kremkow et al.,
“Principles underlying sensory map topography in primary visual cortex,”
Nature, 533 52
–57
(2016). http://dx.doi.org/10.1038/nature17936 Google Scholar
C. L. Fennema and W. B. Thompson,
“Velocity determination in scenes containing several moving objects,”
Comput. Graphics Image Process., 9 301
–315
(1979). http://dx.doi.org/10.1016/0146-664X(79)90097-2 Google Scholar
D. Marr and S. Ullman,
“Directional selectivity and its use in early visual processing,”
Proc. R. Soc. London B: Biol. Sci., 211 151
–180
(1981). http://dx.doi.org/10.1098/rspb.1981.0001 Google Scholar
F. Gerard-Mercier et al.,
“Synaptic correlates of low-level perception in V1,”
J. Neurosci., 36 3925
–3942
(2016). http://dx.doi.org/10.1523/JNEUROSCI.4492-15.2016 JNRSDS 0270-6474 Google Scholar
M. Lev and U. Polat,
“Temporal asynchrony and spatial perception,”
Sci. Rep., 6 30413
(2016). http://dx.doi.org/10.1038/srep30413 SRCEC3 2045-2322 Google Scholar
D. Ferster,
“Orientation selectivity of synaptic potentials in neurons of cat primary visual cortex,”
J. Neurosci., 6 1284
–1301
(1986). JNRSDS 0270-6474 Google Scholar
S. B. Nelson,
“Temporal interactions in the cat visual system. I. Orientation-selective suppression in the visual cortex,”
J. Neurosci., 11 344
–356
(1991). JNRSDS 0270-6474 Google Scholar
T. D. Albright and G. R. Stoner,
“Contextual influences on visual processing,”
Annu. Rev. Neurosci., 25 339
–379
(2002). http://dx.doi.org/10.1146/annurev.neuro.25.112701.142900 ARNSD5 0147-006X Google Scholar
Y. F. Sit et al.,
“Complex dynamics of V1 population responses explained by a simple gain-control model,”
Neuron, 64 943
–956
(2009). http://dx.doi.org/10.1016/j.neuron.2009.08.041 NERNET 0896-6273 Google Scholar
M. Carandini and D. J. Heeger,
“Normalization as a canonical neural computation,”
Nat. Rev. Neurosci., 13 51
–62
(2012). http://dx.doi.org/10.1038/nrn3136 Google Scholar
D. H. Hubel and T. N. Wiesel,
“Receptive fields, binocular interaction and functional architecture in the cat’s visual cortex,”
J. Physiol., 160 106
–154
(1962). http://dx.doi.org/10.1113/jphysiol.1962.sp006837 Google Scholar
K. Albus,
“A quantitative study of the projection area of the central and the paracentral visual field in area 17 of the cat. I. The precision of the topography,”
Exp. Brain Res., 24 159
–179
(1975). http://dx.doi.org/10.1007/BF00234061 EXBRAP 0014-4819 Google Scholar
R. J. Tusa, L. A. Palmer and A. C. Rosenquist,
“The retinotopic organization of area 17 (striate cortex) in the cat,”
J. Comp. Neurol., 177 213
–235
(1978). http://dx.doi.org/10.1002/cne.901770204 Google Scholar
D. Jancke et al.,
“Shorter latencies for motion trajectories than for flashes in population responses of cat primary visual cortex,”
J. Physiol., 556 971
–982
(2004). http://dx.doi.org/10.1113/jphysiol.2003.058941 Google Scholar
S. J. Komban et al.,
“Neuronal and perceptual differences in the temporal processing of darks and lights,”
Neuron, 82 224
–234
(2014). http://dx.doi.org/10.1016/j.neuron.2014.02.020 NERNET 0896-6273 Google Scholar
A. Basole, L. E. White and D. Fitzpatrick,
“Mapping multiple features in the population response of visual cortex,”
Nature, 423 986
–990
(2003). http://dx.doi.org/10.1038/nature01721 Google Scholar
V. Mante and M. Carandini,
“Visual cortex: seeing motion,”
Curr. Biol., 13 R906
–R908
(2003). http://dx.doi.org/10.1016/j.cub.2003.11.010 CUBLE2 0960-9822 Google Scholar
P. Series, J. Lorenceau and Y. Fregnac,
“The ‘silent’ surround of V1 receptive fields: theory and experiments,”
J. Physiol., 97 453
–474
(2003). http://dx.doi.org/10.1016/j.jphysparis.2004.01.023 JPHYA7 0022-3751 Google Scholar
W. Metzger,
“Versuch einer gemeinsamen Theorie der Phänomene Fröhlichs und Hazelhoffs und Kritik ihrer Verfahren zu Messung der Empfindungszeit,”
Psychol. Res., 16 176
–200
(1932). http://dx.doi.org/10.1007/BF00409732 Google Scholar
R. Nijhawan,
“Motion extrapolation in catching,”
Nature, 370 256
–257
(1994). http://dx.doi.org/10.1038/370256b0 Google Scholar
A. Maiche, R. Budelli and L. Gomez-Sena,
“Spatial facilitation is involved in flash-lag effect,”
Vision Res., 47 1655
–1661
(2007). http://dx.doi.org/10.1016/j.visres.2007.02.008 VISRAM 0042-6989 Google Scholar
D. Jancke, W. Erlhagen,
“Bridging the gap: a model of common neural mechanisms underlying the Fröhlich effect, the flash-lag effect, and the representational momentum effect,”
Space and Time in Perception and Action, Cambridge University Press, Cambridge, United Kingdom
(2010). Google Scholar
D. M. Eagleman and T. J. Sejnowski,
“Motion integration and postdiction in visual awareness,”
Science, 287 2036
–2038
(2000). http://dx.doi.org/10.1126/science.287.5460.2036 SCIEAS 0036-8075 Google Scholar
D. Jancke,
“Orientation formed by a spot’s trajectory: a two-dimensional population approach in primary visual cortex,”
J. Neurosci., 20 RC86
(2000). JNRSDS 0270-6474 Google Scholar
D. Burr,
“Motion smear,”
Nature, 284 164
–165
(1980). http://dx.doi.org/10.1038/284164a0 Google Scholar
K. Kirschfeld and T. Kammer,
“The Frohlich effect: a consequence of the interaction of visual focal attention and metacontrast,”
Vision Res., 39 3702
–3709
(1999). http://dx.doi.org/10.1016/S0042-6989(99)00089-9 VISRAM 0042-6989 Google Scholar
E. Ahissar and A. Arieli,
“Seeing via miniature eye movements: a dynamic hypothesis for vision,”
Front. Comput. Neurosci., 6 89
(2012). http://dx.doi.org/10.3389/fncom.2012.00089 1662-5188 Google Scholar
W. S. Geisler,
“Motion streaks provide a spatial code for motion direction,”
Nature, 400 65
–69
(1999). http://dx.doi.org/10.1038/21886 Google Scholar
W. S. Geisler et al.,
“Motion direction signals in the primary visual cortex of cat and monkey,”
Visual Neurosci., 18 501
–516
(2001). http://dx.doi.org/10.1017/S0952523801184014 VNEUEY Google Scholar
D. C. Burr and J. Ross,
“Direct evidence that ‘speedlines’ influence motion mechanisms,”
J. Neurosci., 22 8661
–8664
(2002). JNRSDS 0270-6474 Google Scholar
X. An et al.,
“Distinct functional organizations for processing different motion signals in V1, V2, and V4 of macaque,”
J. Neurosci., 32 13363
–13379
(2012). http://dx.doi.org/10.1523/JNEUROSCI.1900-12.2012 JNRSDS 0270-6474 Google Scholar
X. An et al.,
“The mechanism for processing random-dot motion at various speeds in early visual cortices,”
PLoS One, 9 e93115
(2014). http://dx.doi.org/10.1371/journal.pone.0093115 POLNCL 1932-6203 Google Scholar
A. M. Derrington, H. A. Allen and L. S. Delicato,
“Visual mechanisms of motion analysis and motion perception,”
Annu. Rev. Psychol., 55 181
–205
(2004). http://dx.doi.org/10.1146/annurev.psych.55.090902.141903 Google Scholar
C. T. Wu et al.,
“The temporal interplay between conscious and unconscious perceptual streams,”
Curr. Biol., 19 2003
–2007
(2009). http://dx.doi.org/10.1016/j.cub.2009.10.017 CUBLE2 0960-9822 Google Scholar
J. Pearson and F. Westbrook,
“Phantom perception: voluntary and involuntary nonretinal vision,”
Trends Cognit. Sci., 19 278
–284
(2015). http://dx.doi.org/10.1016/j.tics.2015.03.004 Google Scholar
M. H. Herzog, T. Kammer and F. Scharnowski,
“Time slices: what is the duration of a percept?,”
PLoS Biol., 14 e1002433
(2016). http://dx.doi.org/10.1371/journal.pbio.1002433 Google Scholar
O. Braddick,
“A short-range process in apparent motion,”
Vision Res., 14 519
–527
(1974). http://dx.doi.org/10.1016/0042-6989(74)90041-8 VISRAM 0042-6989 Google Scholar
J. Lorenceau and D. Alais,
“Form constraints in motion binding,”
Nat. Neurosci., 4 745
–751
(2001). http://dx.doi.org/10.1038/89543 NANEFN 1097-6256 Google Scholar
G. Mather et al.,
“Interactions between motion and form processing in the human visual system,”
Front. Comput. Neurosci., 7 65
(2013). http://dx.doi.org/10.3389/fncom.2013.00065 Google Scholar
M. F. Tang et al.,
“The shape of motion perception: global pooling of transformational apparent motion,”
J. Vision, 13 20
–20
(2013). http://dx.doi.org/10.1167/13.13.20 1534-7362 Google Scholar
P. Sun, C. Chubb and G. Sperling,
“A moving-barber-pole illusion,”
J. Vision, 14 1
–1
(2014). http://dx.doi.org/10.1167/14.5.1 1534-7362 Google Scholar
J. M. Spencer et al.,
“Effects of aging on identifying emotions conveyed by point-light walkers,”
Psychol. Aging, 31 126
–138
(2016). http://dx.doi.org/10.1037/a0040009 Google Scholar
G. B. Ermentrout and D. Kleinfeld,
“Traveling electrical waves in cortex: insights from phase dynamics and speculation on a computational role,”
Neuron, 29 33
–44
(2001). http://dx.doi.org/10.1016/S0896-6273(01)00178-7 NERNET 0896-6273 Google Scholar
A. Benucci, R. A. Frazor and M. Carandini,
“Standing waves and traveling waves distinguish two circuits in visual cortex,”
Neuron, 55 103
–117
(2007). http://dx.doi.org/10.1016/j.neuron.2007.06.017 NERNET 0896-6273 Google Scholar
W. Xu et al.,
“Compression and reflection of visually evoked cortical waves,”
Neuron, 55 119
–129
(2007). http://dx.doi.org/10.1016/j.neuron.2007.06.016 NERNET 0896-6273 Google Scholar
X. Huang et al.,
“Spiral wave dynamics in neocortex,”
Neuron, 68 978
–990
(2010). http://dx.doi.org/10.1016/j.neuron.2010.11.007 NERNET 0896-6273 Google Scholar
M. H. Mohajerani et al.,
“Mirrored bilateral slow-wave cortical activity within local circuits revealed by fast bihemispheric voltage-sensitive dye imaging in anesthetized and awake mice,”
J. Neurosci., 30 3745
–3751
(2010). http://dx.doi.org/10.1523/JNEUROSCI.6437-09.2010 JNRSDS 0270-6474 Google Scholar
F. Chavane et al.,
“Lateral spread of orientation selectivity in V1 is controlled by intracortical cooperativity,”
Front. Syst. Neurosci., 5 4
(2011). http://dx.doi.org/10.3389/fnsys.2011.00004 Google Scholar
X. Gao et al.,
“Interactions between two propagating waves in rat visual cortex,”
Neuroscience, 216 57
–69
(2012). http://dx.doi.org/10.1016/j.neuroscience.2012.04.062 Google Scholar
P. O. Polack and D. Contreras,
“Long-range parallel processing and local recurrent activity in the visual cortex of the mouse,”
J. Neurosci., 32 11120
–11131
(2012). http://dx.doi.org/10.1523/JNEUROSCI.6304-11.2012 JNRSDS 0270-6474 Google Scholar
S. Onat, D. Jancke and P. König,
“Cortical long-range interactions embed statistical knowledge of natural sensory input: a voltage-sensitive dye imaging study,”
F1000Research, 2 51
(2013). http://dx.doi.org/10.12688/f1000research.2-51.v2 Google Scholar
L. Muller et al.,
“The stimulus-evoked population response in visual cortex of awake monkey is a propagating wave,”
Nat. Commun., 5 3675
(2014). http://dx.doi.org/10.1038/ncomms4675 NCAOBW 2041-1723 Google Scholar
Z. Yang et al.,
“Long-range traveling waves of activity triggered by local dichoptic stimulation in V1 of behaving monkeys,”
J. Neurophysiol., 113 277
–294
(2015). http://dx.doi.org/10.1152/jn.00610.2013 JONEA4 0022-3077 Google Scholar
F. Han, N. Caporale and Y. Dan,
“Reverberation of recent visual experience in spontaneous cortical waves,”
Neuron, 60 321
–327
(2008). http://dx.doi.org/10.1016/j.neuron.2008.08.026 NERNET 0896-6273 Google Scholar
G. Palagina, U. T. Eysel and D. Jancke,
“Strengthening of lateral activation in adult rat visual cortex after retinal lesions captured with voltage-sensitive dye imaging in vivo,”
Proc. Natl. Acad. Sci. U. S. A., 106 8743
–8747
(2009). http://dx.doi.org/10.1073/pnas.0900068106 Google Scholar
I. Nauhaus et al.,
“Stimulus contrast modulates functional connectivity in visual cortex,”
Nat. Neurosci., 12 70
–76
(2008). http://dx.doi.org/10.1038/nn.2232 Google Scholar
A. Reynaud, G. S. Masson and F. Chavane,
“Dynamics of local input normalization result from balanced short- and long-range intracortical interactions in area V1,”
J. Neurosci., 32 12558
–12569
(2012). http://dx.doi.org/10.1523/JNEUROSCI.1618-12.2012 JNRSDS 0270-6474 Google Scholar
P. E. Roland et al.,
“Cortical feedback depolarization waves: a mechanism of top-down influence on early visual areas,”
Proc. Natl. Acad. Sci. U. S. A., 103 12586
–12591
(2006). http://dx.doi.org/10.1073/pnas.0604925103 Google Scholar
Q. F. Zhang et al.,
“Priming with real motion biases visual cortical response to bistable apparent motion,”
Proc. Natl. Acad. Sci. U. S. A., 109 20691
–20696
(2012). http://dx.doi.org/10.1073/pnas.1218654109 Google Scholar
J. H. Hedges et al.,
“Dissociation of neuronal and psychophysical responses to local and global motion,”
Curr. Biol., 21 2023
–2028
(2011). http://dx.doi.org/10.1016/j.cub.2011.10.049 CUBLE2 0960-9822 Google Scholar
P. Neri and D. J. Heeger,
“Spatiotemporal mechanisms for detecting and identifying image features in human vision,”
Nat. Neurosci., 5 812
–816
(2002). http://dx.doi.org/10.1038/nn886 NANEFN 1097-6256 Google Scholar
P. Neri,
“Dynamic engagement of human motion detectors across space-time coordinates,”
J. Neurosci., 34 8449
–8461
(2014). http://dx.doi.org/10.1523/JNEUROSCI.5434-13.2014 JNRSDS 0270-6474 Google Scholar
L. Muckli et al.,
“Primary visual cortex activity along the apparent-motion trace reflects illusory perception,”
PLoS Biol., 3 e265
(2005). http://dx.doi.org/10.1371/journal.pbio.0030265 Google Scholar
M. Akselrod, M. H. Herzog and H. Ogmen,
“Tracing path-guided apparent motion in human primary visual cortex V1,”
Sci. Rep., 4 6063
(2014). http://dx.doi.org/10.1038/srep06063 SRCEC3 2045-2322 Google Scholar
S. Onat, P. König and D. Jancke,
“Natural scene evoked population dynamics across cat primary visual cortex captured with voltage-sensitive dye imaging,”
Cereb. Cortex, 21 2542
–2554
(2011). http://dx.doi.org/10.1093/cercor/bhr038 53OPAV 1047-3211 Google Scholar
W. E. Vinje and J. L. Gallant,
“Sparse coding and decorrelation in primary visual cortex during natural vision,”
Science, 287 1273
–1276
(2000). http://dx.doi.org/10.1126/science.287.5456.1273 SCIEAS 0036-8075 Google Scholar
E. Froudarakis et al.,
“Population code in mouse V1 facilitates readout of natural scenes through increased sparseness,”
Nat. Neurosci., 17 851
–857
(2014). http://dx.doi.org/10.1038/nn.3707 NANEFN 1097-6256 Google Scholar
B. R. Cowley et al.,
“Stimulus-driven population activity patterns in macaque primary visual cortex,”
PLoS Comput. Biol., 12 e1005185
(2016). http://dx.doi.org/10.1371/journal.pcbi.1005185 Google Scholar
M. Okun and I. Lampl,
“Instantaneous correlation of excitation and inhibition during ongoing and sensory-evoked activities,”
Nat. Neurosci., 11 535
–537
(2008). http://dx.doi.org/10.1038/nn.2105 NANEFN 1097-6256 Google Scholar
B. Haider et al.,
“Synaptic and network mechanisms of sparse and reliable visual cortical activity during nonclassical receptive field stimulation,”
Neuron, 65 107
–121
(2010). http://dx.doi.org/10.1016/j.neuron.2009.12.005 NERNET 0896-6273 Google Scholar
N. Nortmann et al.,
“Primary visual cortex represents the difference between past and present,”
Cereb. Cortex, 25 1427
–1440
(2015). http://dx.doi.org/10.1093/cercor/bht318 53OPAV 1047-3211 Google Scholar
B. S. Ng et al.,
“Dominant vertical orientation processing without clustered maps: early visual brain dynamics imaged with voltage-sensitive dye in the pigeon visual Wulst,”
J. Neurosci., 30 6713
–6725
(2010). http://dx.doi.org/10.1523/JNEUROSCI.4078-09.2010 Google Scholar
A. R. Girshick, M. S. Landy and E. P. Simoncelli,
“Cardinal rules: visual orientation perception reflects knowledge of environmental statistics,”
Nat. Neurosci., 14 926
–932
(2011). http://dx.doi.org/10.1038/nn.2831 NANEFN 1097-6256 Google Scholar
M. Rothermel et al.,
“Nasal chemosensory-stimulation evoked activity patterns in the rat trigeminal ganglion visualized by in vivo voltage-sensitive dye imaging,”
PLoS One, 6 e26158
(2011). http://dx.doi.org/10.1371/journal.pone.0026158 POLNCL 1932-6203 Google Scholar
V. Kozyrev, U. T. Eysel and D. Jancke,
“Voltage-sensitive dye imaging of transcranial magnetic stimulation-induced intracortical dynamics,”
Proc. Natl. Acad. Sci. U. S. A., 111 13553
–13558
(2014). http://dx.doi.org/10.1073/pnas.1405508111 Google Scholar
I. Ayzenshtat et al.,
“Precise spatiotemporal patterns among visual cortical areas and their relation to visual stimulus processing,”
J. Neurosci., 30 11232
–11245
(2010). http://dx.doi.org/10.1523/JNEUROSCI.5177-09.2010 JNRSDS 0270-6474 Google Scholar
Y. Chen, W. S. Geisler and E. Seidemann,
“Optimal decoding of correlated neural population responses in the primate visual cortex,”
Nat. Neurosci., 9 1412
–1420
(2006). http://dx.doi.org/10.1038/nn1792 NANEFN 1097-6256 Google Scholar
M. H. Mohajerani et al.,
“Spontaneous cortical activity alternates between motifs defined by regional axonal projections,”
Nat. Neurosci., 16 1426
–1435
(2013). http://dx.doi.org/10.1038/nn.3499 NANEFN 1097-6256 Google Scholar
M. Wibral et al.,
“Local active information storage as a tool to understand distributed neural information processing,”
Front. Neuroinf., 8 1
(2014). http://dx.doi.org/10.3389/fninf.2014.00001 Google Scholar
T. Bonhoeffer and A. Grinvald,
“Iso-orientation domains in cat visual cortex are arranged in pinwheel-like patterns,”
Nature, 353 429
–431
(1991). http://dx.doi.org/10.1038/353429a0 Google Scholar
A. Arieli et al.,
“Dynamics of ongoing activity: explanation of the large variability in evoked cortical responses,”
Science, 273 1868
–1871
(1996). http://dx.doi.org/10.1126/science.273.5283.1868 SCIEAS 0036-8075 Google Scholar
A. Grinvald and R. Hildesheim,
“VSDI: a new era in functional imaging of cortical dynamics,”
Nat. Rev. Neurosci., 5 874
–885
(2004). http://dx.doi.org/10.1038/nrn1536 NRNAAN 1471-003X Google Scholar
S. Mennerick et al.,
“Diverse voltage-sensitive dyes modulate GABAA receptor function,”
J. Neurosci., 30 2871
–2879
(2010). http://dx.doi.org/10.1523/JNEUROSCI.5607-09.2010 JNRSDS 0270-6474 Google Scholar
S. Chemla and F. Chavane,
“A biophysical cortical column model to study the multi-component origin of the VSDI signal,”
Neuroimage, 53 420
–438
(2010). http://dx.doi.org/10.1016/j.neuroimage.2010.06.026 NEIMEF 1053-8119 Google Scholar
S. Chemla and F. Chavane,
“Effects of GABAA kinetics on cortical population activity: computational studies and physiological confirmations,”
J. Neurophysiol., 115 2867
–2879
(2016). http://dx.doi.org/10.1152/jn.00352.2015 JONEA4 0022-3077 Google Scholar
S. Chemla and F. Chavane,
“Voltage-sensitive dye imaging: technique review and models,”
J. Physiol. Paris, 104 40
–50
(2010). http://dx.doi.org/10.1016/j.jphysparis.2009.11.009 Google Scholar
K. Takagaki et al.,
“Flow detection of propagating waves with temporospatial correlation of activity,”
J. Neurosci. Methods, 200 207
–218
(2011). http://dx.doi.org/10.1016/j.jneumeth.2011.05.023 JNMEDT 0165-0270 Google Scholar
T. Knöpfel,
“Genetically encoded optical indicators for the analysis of neuronal circuits,”
Nat. Rev. Neurosci., 13 687
–700
(2012). http://dx.doi.org/10.1038/nrn3293 NRNAAN 1471-003X Google Scholar
BiographyDirk Jancke received his PhD in biology from the Faculty of Biology, Ruhr University Bochum, in 1997. He heads the Optical Imaging Group at the Institut für Neuroinformatik, Ruhr University Bochum, Germany. He was mentored by Hubert Dinse and Gregor Schöner and joined Amiram Grinvald’s lab at the Weizmann Institute in Israel from 2000 to 2002 as a postdoc. His research focuses on visual brain functioning using in vivo voltage-sensitive dye imaging in various species. |


