|
Functional near-infrared spectroscopy (fNIRS) was used to examine hemodynamic responses in the prefrontal cortex (PFC) during noxious thermal pain, induced by thermal stimulations over three different body sites over the right forearm, right temporomandibular joint, and left forearm. Functional NIRS measurements were obtained from three groups of healthy volunteers, one group for each body region. Each group was subjected to both low-pain stimulation (LPS) and high-pain stimulation (HPS) by a 16 × 16 mm2 thermode of a temperature-controlled thermal stimulator over the respective three body sites. Our results showed that HPS given at three sites induced significant increases (p < 0.05) in oxy-hemoglobin concentration (ΔHbO) in the PFC with similar temporal patterns in relatively spread PFC areas. In contrast, LPS did not cause any significant ΔHbO in the PFC of any subject group. Our observed PFC activations induced by acute HPS were generally consistent with previous reports by fMRI studies. The study also found a peculiar global trend of postpain deactivation in the PFC, which is attributed to global vasoconstriction due to acute nocuous pain. Overall, these results indicate that hemodynamic activities in PFC exhibit consistent temporal and spatial patterns in response to acute thermal stimulation given across all three body sites. |
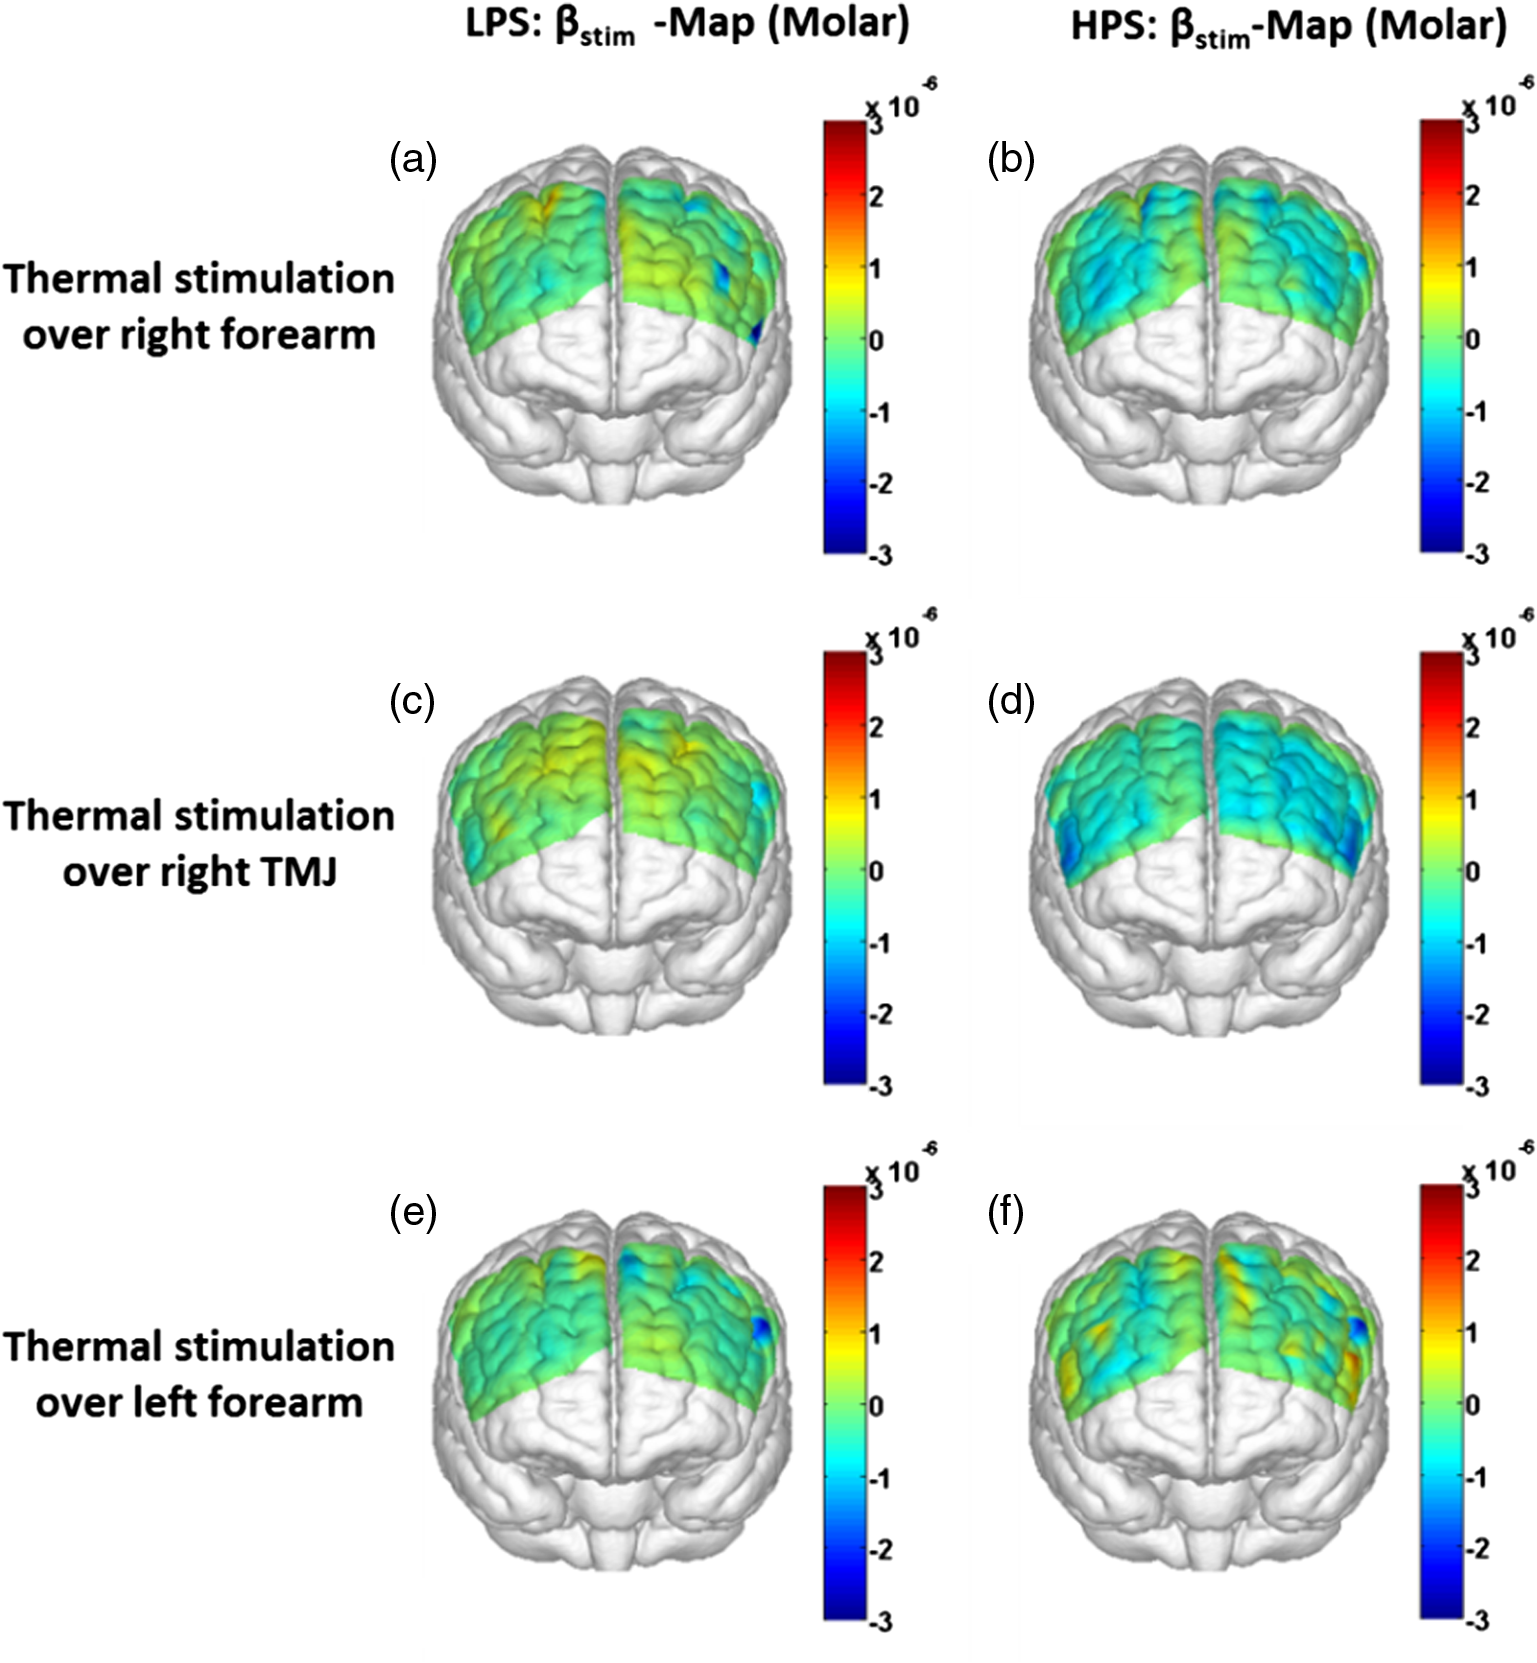
1.Introduction1.1.Relationship Between Pain and the Prefrontal CortexIn order to understand pain processing in humans, functional neuroimaging studies using positron emission tomography (PET) and functional magnetic resonance imaging (fMRI) have been performed on the central nervous system. Such studies have shown that pain processing involves various cortical and subcortical regions of the brain,1,2 which are often grouped together and referred to as the “pain matrix.”3–7 The pain matrix mainly includes the primary (S1) and secondary (S2) somatosensory cortices, which are known to be associated with sensory-discriminative aspects and additional affective/cognitive functions, respectively. Subcortical regions, such as the insular cortex and anterior cingulate cortex (ACC), are often involved in affective-motivational and cognitive aspects of pain, including anticipation, attention, and evaluation.4,5,8,9 Prefrontal cortical and subcortical areas other than ACC are also shown to play a role in secondary-pain effects, namely, conscious awareness and the cognitive evaluation of pain.6,10–14 Although the somatosensory cortex is shown to be primarily responsible for the perception of pain sensations, activity in the prefrontal cortex (PFC) during pain sensation is acknowledged as well.15,16 Recent fMRI studies have reported the role of the medial prefrontal area in pain encoding,15 and the role of the dorsolateral prefrontal area in expected and perceived control over pain.17 Several other neuroimaging studies also demonstrated involvement of prefrontal cortical regions in pain processing, which includes the orbitofrontal gyrus, the dorsolateral prefrontal cortex (DPFC), and the medial PFC during acute pain in multiple chronic pain conditions, such as neuropathic pain and complex regional pain syndromes.18–22 Furthermore, the role of prefrontal regions in pain, placebo analgesia, and their modulations by analgesic drugs is also demonstrated.23,24 These studies provided us with the motivation to further explore the role of the prefrontal cortical regions in cognitive evaluation of pain by using functional near-infrared spectroscopy (fNIRS). 1.2.Motivation of This StudyIn the past two decades, fNIRS, a noninvasive, portable, easy-to-use, cost-effective, optical-imaging method, has been extensively used in the field of neuroimaging for studying human brain functions. This complementary brain imaging modality may have the ability to facilitate a good understanding of pain processing at the cortical regions induced by acute pain. A physiological understanding of temporal and spatial characteristics of pain-induced hemodynamic responses, mainly changes of oxygenated hemoglobin concentration (HbO), might have potential applications in a clinical setting where pain needs to be assessed objectively. Given the portabilty and cost-effectiveness, it is highly desirable to explore whether fNIRS can become a device that can provide biomarkers for objective measures of pain. This has been our overall motivation for this study. In spite of a large amount of fNIRS-based research performed on human brain activities,25 however, very limited pain studies in humans with fNIRS measurements have been reported. First, Becerra et al. found qualitative correlations between thermally-induced pain and temporal characteristics of hemodynamic responses (HbO) in the somatosensory cortex of a group of human subjects.26 In the recent 2 to 3 years, a few other fNIRS-based pain studies (including ours) have reported investigations of (1) prefrontal hemodynamic responses to mechanically induced low back pain27 and thermally stimulated temporomandibular joint (TMJ) pain,28 as well as (2) somatosensory hemodynamic responses to noxious electrical stimulation of the thumb.29 While these studies showed detectable and quantifiable changes of HbO by fNIRS in the human PFC induced by pain stimulation, it is unknown whether such pain-induced HbO signals are detected consistently within similar PFC areas in spite of pain-originating locations (i.e., from different body sites) or pain-inducing types (such as thermal versus mechanical pains). Even within fMRI literature, there is little finding that can provide answers to this question. In this study, we hypothesized that pain-induced HbO signals were detectable by fNIRS consistently at the PFC, while the pain was originated from different body sites. Specifically, we mapped and examined HbO responses in the PFC of three groups of healthy subjects in response to thermal pain stimulations at three different body sites, by applying thermal stimulations over the: right forearm; right TMJ; and left forearm. By the end of this paper, our results proved our hypothesis by showing excellent consistency of PFC hemodynamic activities under acute pain administered at different body parts. The study also revealed that there was a peculiar global trend of deactivation in the PFC during the postpain stimulation period, which needs to be further explored for its physiological mechanism. This study concluded that further investigations are needed to pin-point particular, specific PFC regions that could be potential pain-detection sites for clinical applications. 2.Material and Methods2.1.SubjectsA total of 16 adults (all males, right-handed, ) were recruited to study prefrontal cortical responses to the thermal stimulation given on the right forearm. A total of nine adults (all males, right-handed, ) were recruited to study the prefrontal cortical responses to the thermal stimulation on the right TMJ. A total of nine adults (all males, right-handed, ) were recruited to study prefrontal cortical responses to the thermal stimulation on the left forearm. The protocol used was reviewed and approved by the Institutional Review Board (IRB) of the University of Texas at Arlington (UTA). The methods were carried out according to approved guidelines by the IRB of UTA. Written informed consent was obtained from each of the participants before the thermal stimulation and the fNIRS measurements were performed. 2.2.InstrumentsIn this study, a continuous-wave, multichannel, fNIRS imaging system (Cephalogics, Boston, Massachusetts) was used, consisting of near-infrared light-emitting diode sources (at 750 and 850 nm) and avalanche photodiode detectors.30 A head optode array consisting of 18 source optodes and 18 detector optodes [see Figs. 1(c) and 1(d)] was utilized to probe the human PFC when the participants underwent two levels of (noxious and innocuous) thermal stimulation over three different parts of the body. A temperature-controlled pain generator (MEDOC PATHWAY ATS MODE) was utilized to produce a range of temperatures to evoke various levels of innocuous and noxious thermal stimulations. Fig. 1(a) Experimental paradigm used in this study for thermal stimulation. (b) Selection of 12 clusters for data analysis. Red circles are light sources, and blue circles are light detectors. Solid black arrows at the left bottom () show the six channels (source–detector pairs) grouped as one cluster. The word “Right” marks each subject’s right side. (c) Optical optode array placed on a subject’s head with the geometry shown in Fig. 1(b). (d) Coregistration of the light sources and detectors on a standard human brain template. (e) Placement of the thermode over the right forearm region. Yellow arrow points to the thermode position over right forearm. The stimulation site was about 5 cm away from the right elbow. (f) Placement of the thermode over the right side of each subject’s TMJ region. 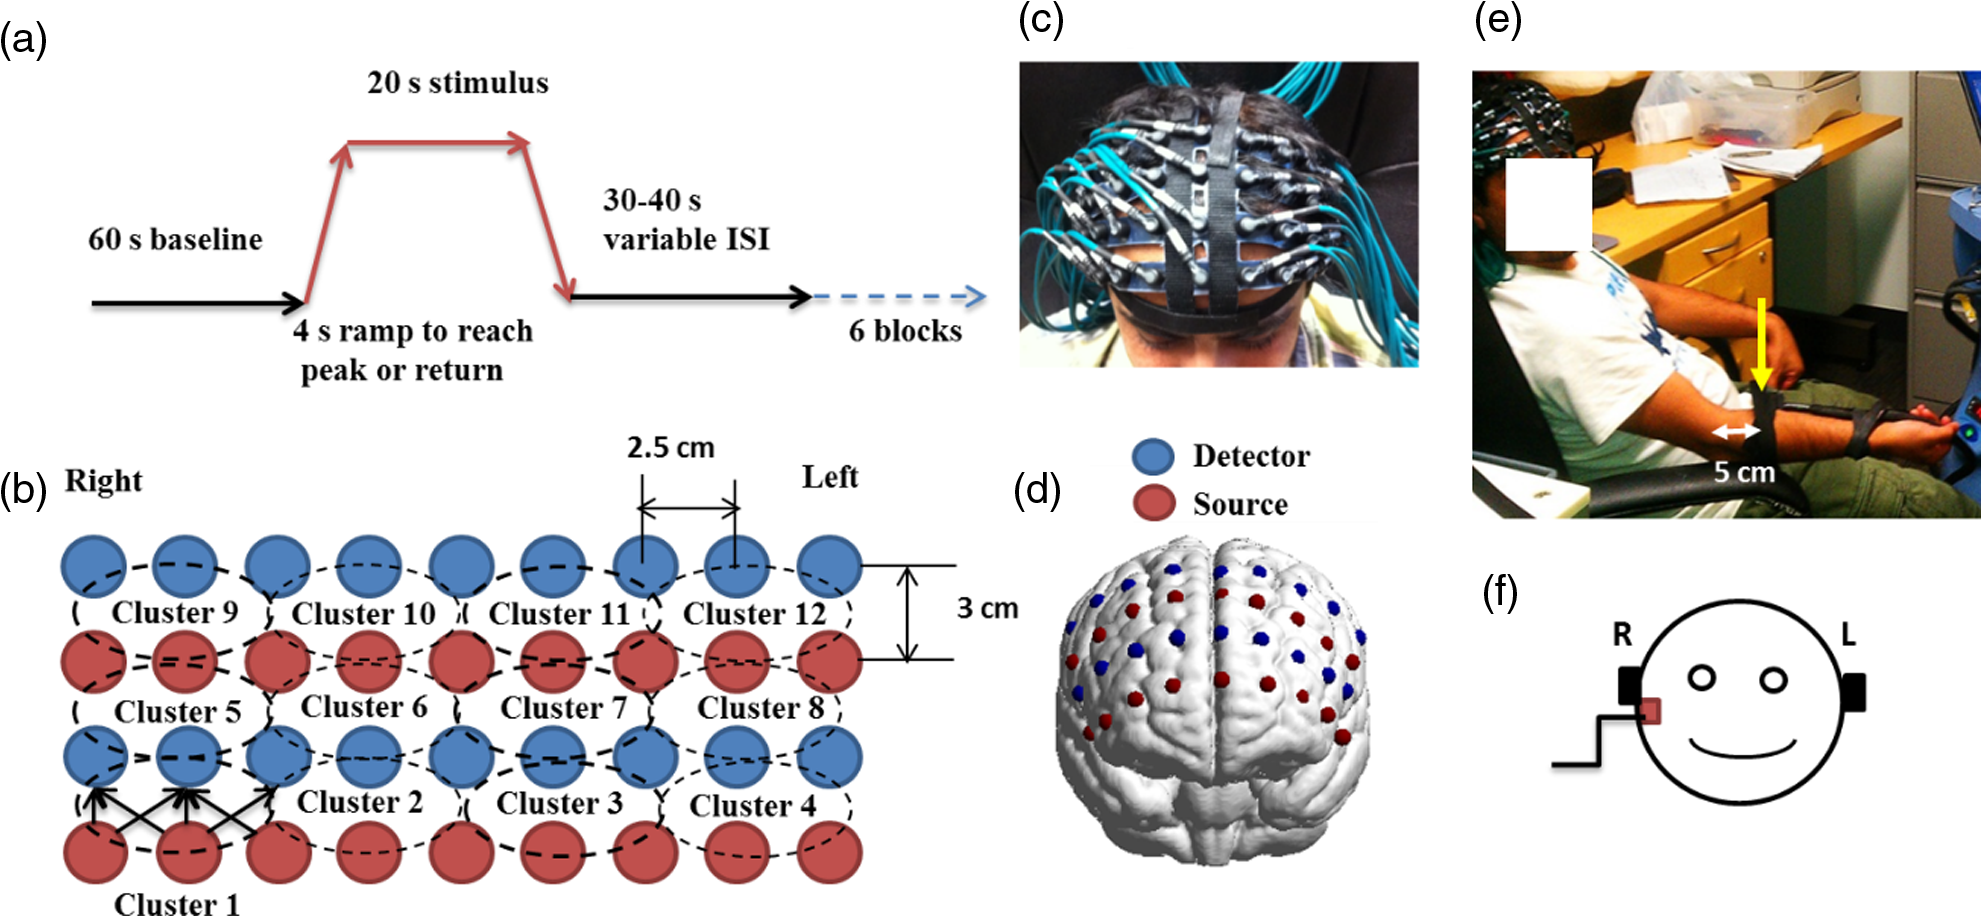 2.3.Experimental ParadigmIn order to estimate the magnitude of thermal pain generated by the thermal stimulator, a thermode of from the stimulator was attached on the surface or skin in the region of interest, such as on the arm or TMJ. Placement of the thermode over the right forearm (over pronator teres muscle) region is shown in Fig. 1(e). Placement of the thermode over the right side of each subject’s TMJ region is shown in Fig. 1(f). Then, the temperature was varied between 41°C and 48°C with an interval of 1°C to generate thermal stimulation, which could be either innocuous or noxious. Next, using the visual analog pain rating scale (0 to 10), each participant was asked to rate the perception of pain before the actual pain-dependent fNIRS measurements were taken. Perception rating levels of 0, 3, 7, and 10 corresponded to no pain, low pain, high pain, and extreme pain conditions, respectively. While taking pain-related fNIRS measurements, two levels of thermal stimuli (one rated at 3 and the other at 7) were used to induce low pain and high pain, which were termed as low-pain stimuli (LPS) and high-pain stimuli (HPS), respectively. For noxious thermal stimulation over the right forearm paradigm, average temperatures over all the subjects () to create the LPS and HPS were and , respectively. For noxious thermal stimulation over the right TMJ paradigm, average temperatures over all the subjects () to create the LPS and HPS were and , respectively. For noxious thermal stimulation over left forearm paradigm, average temperatures over all the subjects () to create the LPS and HPS were and , respectively. The experimental paradigm used in this study was a blocked design and consisted of two separate fNIRS sessions. The first session consisted of six blocks of LPS, followed by the second session which included six blocks of HPS. Intersession interval was 5 min. Since LPS was truly below each subject’s pain threshold level, we did not expect to have pretreatment effects, and thus we did not arrange sessions counterbalanced across participants. Each session had an initial baseline period of 60 s, during which a 27°C temperature was applied, followed by a 4-s ramp increase in temperature to reach the destination stimulus temperature. Subsequently, the temperature remained constant for 20 s, followed by a 4-s ramp decrease in temperature to return to the baseline temperature. The complete protocol consisted of six blocks of stimulus-resting periods, with a 30- to 40-s variable interstimulus intervals between two adjacent blocks [see Fig. 1(a)]. 2.4.Data AcquisitionFor fNIRS data acquisition, an optical optode array, consisting of 18 sources and 18 detectors, was placed on each subject’s PFC region [see Fig. 1(c)]. The distance between source-to-source, as well as detector-to-detector, horizontally was set as 2.5 cm. The nearest distance between source and detector vertically was 3 cm [see Fig. 1(b)]. Using this probe geometry, we were able to obtain fNIRS signals from 75 source–detector pairs (i.e., channels) when the first and second nearest neighbors with 3 and 3.9 cm separations, respectively, were utilized. The total surface area covered by the optode array on the frontal lobe was . A coregistration procedure was applied based on four randomly selected participants to estimate the frontal/prefrontal cortical regions covered by the fNIRS probe.31 After placing the fNIRS optode array on each subject’s forehead [see Fig. 1(c)], positions of five reference cranial landmarks, (i.e., the nasion, inion, left- and right-preauricular points, and vertex), light sources, and detectors, were measured or marked using a motion tracking system (PATRIOT, Polhemus). These cranial landmarks served as reference positions to convert the real-world stereotaxic coordinates of the optodes to the Montreal Neurological Institute (MNI) coordinates used in a standard brain MRI atlas, based on the affine transformation.32 Using NIRS-SPM software,33 each of the Brodmann areas (BA) probed by the fNIRS optode array, and the respective percentage of covered BA over the entire area of the optode array, were identified. It was observed that the optode array mainly examined seven major Brodmann areas: BAs 6, 8, 9, 10, 44, 45, and 46, all of which covered 97.42% of the area interrogated by the optode array. The percentage of optode array covered by the premotor cortex (PMC; BA 6) was 6.03%, the percentage by the frontal eye fields (FEF, BA 8) was 14.60%, percentage by the frontopolar area (FPA; BA 10) was 11.99%, percentage by the DLPFC (BAs 9 and 46) was 39.89%, and percentage by the ventrolateral prefrontal cortex (VLPFC; BAs 44 and 45) was 24.91%. Figure 1(d) shows the registered optode positions (averaged over four participants) on the standard human brain atlas. 2.5.Data Screening and PreprocessingThe temporal profiles of light intensities obtained after fNIRS measurements were screened and preprocessed using a publically available toolbox known as HOMER.34 First, the raw light intensity signals were visually inspected to exclude blocks associated with motion artifacts. Then, the resultant signals free from motion artifacts were low-pass filtered at a cut-off frequency of 0.2 Hz to remove systemic or physiological noise (such as cardiac and respiratory oscillations) and electronic noise, and then high-pass filtered at a cut-off frequency of 0.01 Hz to exclude any possible baseline drift. Using the modified Beer–Lambert law, changes of oxygenated and deoxygenated hemoglobin concentrations (i.e., and , respectively) relative to the baseline were quantified.35 2.6.Data AnalysisTo quantify cortical hemodynamic activities during the thermal stimulation, a model-based statistical analysis tool [namely, general linear model (GLM)] was utilized. Over the last several years, GLM analysis has been extensively used to analyze fNIRS data to identify cortical areas which are significantly activated during a given task.33,36–38 In GLM, a hemodynamic response function (HRF) is used to serve as a model to predict the change in HbO signals due to task stimulation; GLM can be expressed as follows: where In Eq. (1), represents the temporal profile of or change in deoxyhemoglobin concentration () at each measurement channel; is the stimulation-specific predicted response which is expected to match the temporal profiles of measured hemodynamic signals (i.e., or ); is a given HRF; and is the stimulation-specific boxcar function for a given task. Moreover, is the estimated amplitude of , whereas is residual due to the mismatch between the actual data and the predicted model. By fitting Eq. (1) to the temporal profile of obtained or measured from each channel of each participant, we are able to obtain: (a) the estimated amplitude ,(b) its variance, and thus (c) a statistical -value representing the statistical significance of the brain activation with respect to the baseline at each respective channel. In this way, the amplitudes (expressed by values in ) of prefrontal or frontal activations or deactivations in response to thermal stimulation were obtained by fitting the predicted stimulation response function to channel wise, temporal profiles of responses.For group-level hemodynamic analyses, group-level values at each channel were averaged over each group of subjects. Random-effect analysis was performed to generate statistically meaningful quantities at the group level. For each of three measurement groups, it was accomplished by conducting the one-sample -test on values obtained from all subjects at each channel. In this way, a group-level -statistic (expressed by -values) was obtained to show statistically increased and/or decreased brain activations during thermal stimulation compared to the baseline readings. Both -statistic values and -values were derived from the -tests for each channel and used to generate -maps in topographic images. Topographic images of prefrontal activations and/or deactivations were generated using EasyTopo, an optical topography toolbox.32 It overlays 2-D images of HbO or Hb activations/deactivations over a standard human brain MRI atlas after 2-D angular interpolation of the channel-wise activation data in a spherical-coordinate system. The channel-wise -values derived from GLM analysis, and -values from subsequent statistical comparisons were used to generate activation maps (i.e., -maps and -maps) induced by thermal stimulation over different body sites. 3.Results3.1.Channel-Wise HbO Data AnalysisAfter obtaining channel-wise HbO and Hb temporal profiles, spatially dependent hemodynamic responses to the pain stimulation were obtained. Initially, all the channels were grouped into 12 different clusters [see Fig. 1(b)], probing the PFC [see Fig. 1(d)]; each cluster consisted of six channels. Then, using the stimulus timing information, mean and signals from each cluster were further averaged over the six temporal blocks: the block-averaged temporal profile of and had a time span of 68 s, namely 5-s prior to the stimulation, followed by 28-s thermal stimulation, and recovery. For qualitative assessment of group-level temporal hemodynamic responses, profiles were averaged (across six channels) within each cluster for each subject, and then further averaged across all subjects. The group-averaged temporal profiles of for all the clusters in response to both LPS and HPS are shown in Figs. 2Fig. 3–4, respectively, for the stimulations on (1) the right forearm, (2) the right TMJ region, and (3) the left forearm. Clusters are labeled as . Clusters C1, C2, C5, C6, C9, and C10 are located on the right side of the frontal lobe, whereas C3, C4, C7, C8, C11, and C12 are located on the left side of the frontal lobe [see Fig. 1(b)]. In most of the clusters, the temporal profiles of in response to LPS show a slight decrease in HbO concentration during the stimulation period, followed by recovery to baseline, in all the three groups [see Figs. 2–4]. On the other hand, the temporal profiles of in response to HPS show a slight increase in HbO concentration during the stimulation period, followed by a decrease in HbO during the recovery period before returning to baseline. Overall, the temporal characteristics of prefrontal responses were consistent when thermal stimulation was applied to the right forearm, right TMJ region, and left forearm, separately [compare Figs. 2–4]. Fig. 2Group average of temporal profiles of concentration (in microMolar) across 16 subjects under the right forearm thermal stimulation, for all clusters (labeled as ). Gray and black curves represent group-averaged temporal profiles of in response to LPS and HPS, respectively. Error bars are standard errors. Solid black lines on x-axis represent the stimulation period. 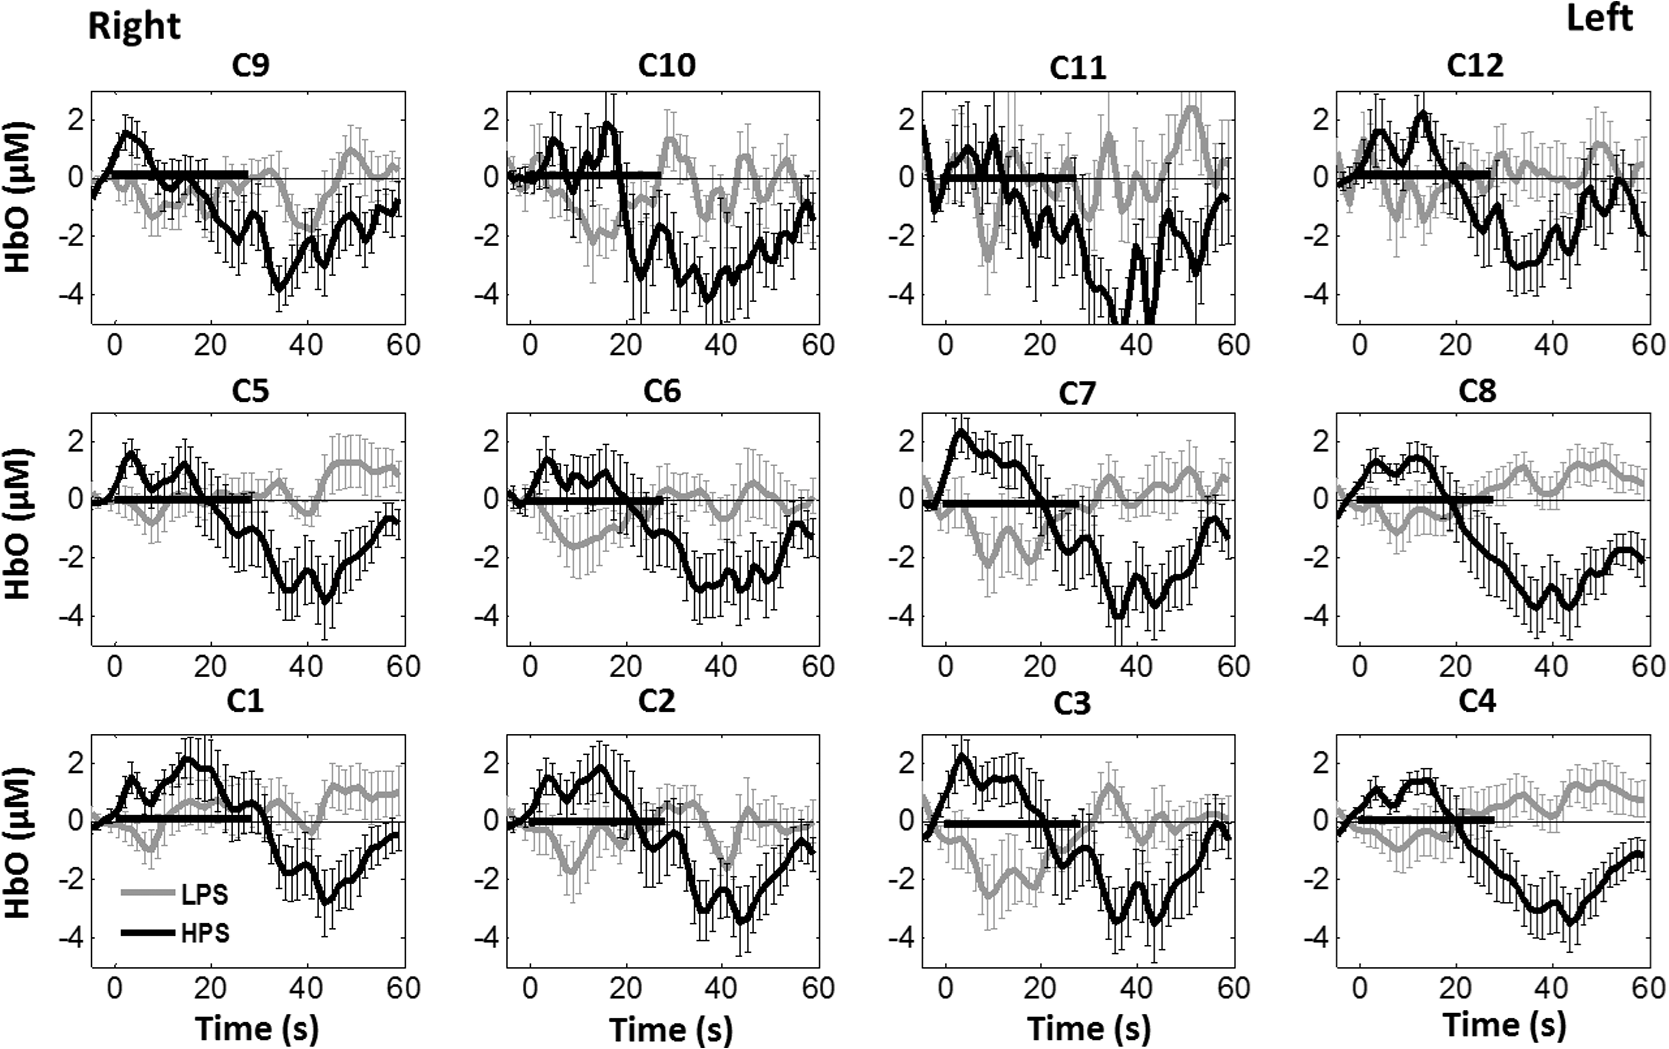 Fig. 3Group average of temporal profiles of concentration (in microMolar) across nine subjects under right TMJ thermal stimulation, for all clusters (labeled as ). Gray and black curves represent group-averaged temporal profiles of in response to LPS and HPS, respectively. Error bars are standard errors. Solid black lines on x-axis represent the stimulation period. 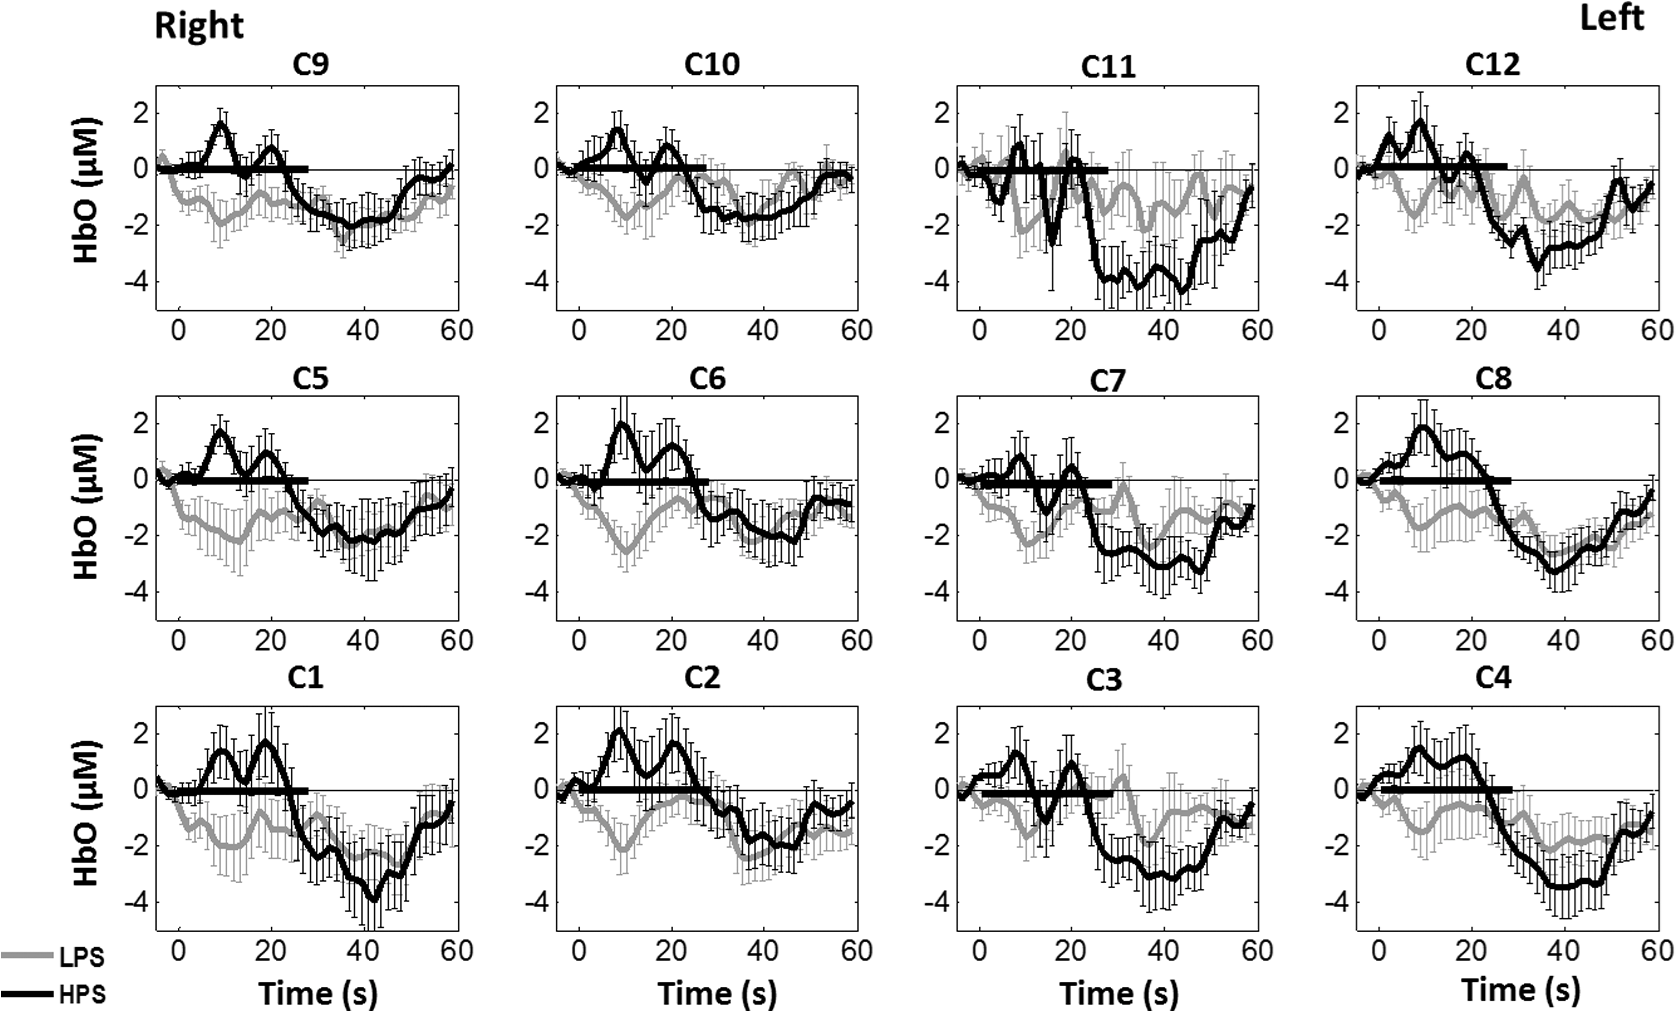 Fig. 4Group average of temporal profiles of concentration (in microMolar) across nine subjects under left forearm thermal stimulation, for all clusters (labeled as ). Gray and black curves represent group-averaged temporal profiles of in response to LPS and HPS, respectively. Error bars are standard errors. Solid black lines on x-axis represent the stimulation period. 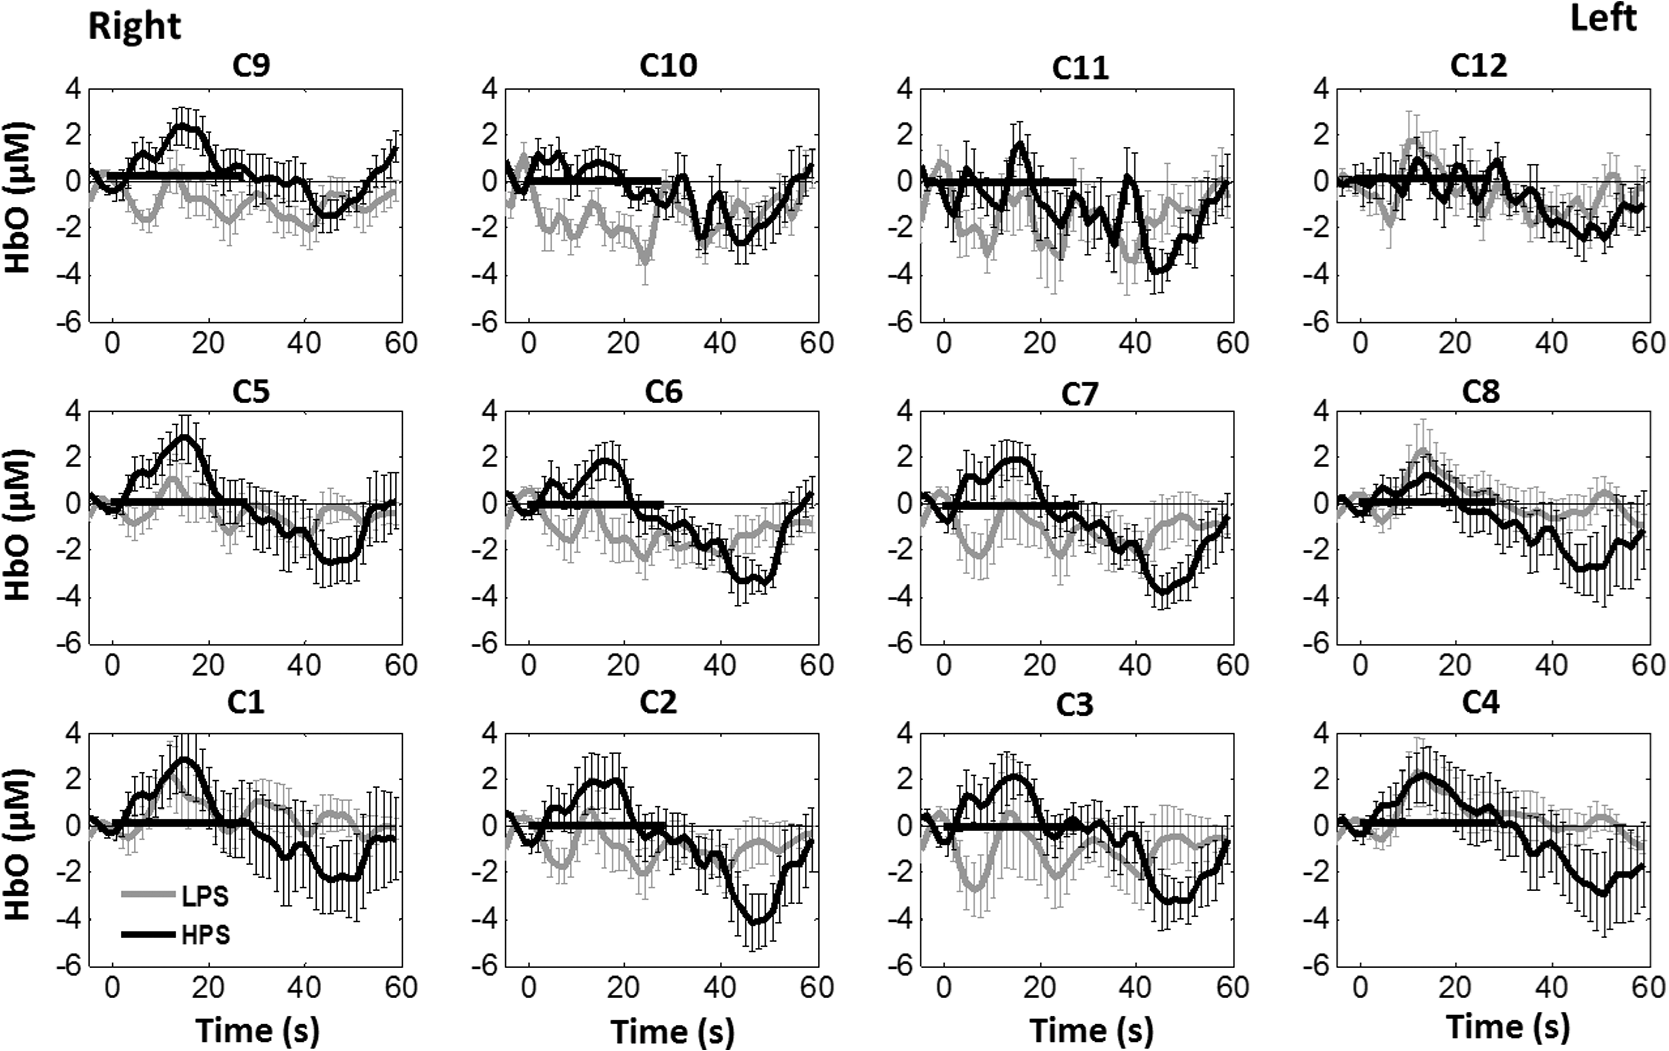 In some studies, was shown reliable39,40 and thus used for data analysis. However, in many other studies, including ours, values were reported to have small amplitudes and often not used for data analysis.32,41,42 In this study, magnitudes of prefrontal activity were relatively small in all three groups under both LPS and HPS, so we did not include HPS- and LPS-induced topographical maps in the main text. They are available in the Appendix for any reader who is interested in results. 3.2.Deactivation of During Post-HPS RecoveryWhile channel-wise data analysis provided excellent temporal profiles for each cluster, it did not afford adequate spatial resolution to mark/map pain-evoked cortical regions with statistical significance. Thus, GLM was used to obtain topographic mapping for each of the three groups for respective thermal stimulation. Because there existed a clear, negative poststimulation phase in responses under either LPS or HPS, we assumed two regressors or predictors to better fit the data by GLM. The first regressor was to reflect in response to the thermal stimulation, and the second was to match the poststimulation recovery phase. Since the duration of this recovery regressor was unknown, we varied the recovery duration and produced a duration-dependent error function (norm of residuals), averaged across all subjects for each of the three groups. Specifically, the recovery regressor duration was varied between 1 and 30 s, with an increment of 1 s, to fit either post-LPS or post-HPS responses. Figures 5(a)–(c) show averaged norms of residuals across all subjects with LPS on the right forearm, right TMJ, and left forearm, respectively. Because the least-fitting errors appeared when the recovery regressor duration was at 1 s in all three groups, this recovery regressor was not needed to fit in response to LPS. On the other hand, Figs. 5(d)–5(f) show averaged norms of residuals across all subjects with HPS on the right forearm, right TMJ, and left forearm, respectively. In the HPS case, the least averaged errors were obtained when the recovery predictor durations were at 19, 17, and 15 s when HPS was given over the right forearm, right TMJ, and left forearm, respectively. Thus, we employed two predictors in the GLM fitting for HPS data, one for high thermal stimulation and another for post-HPS recovery. After GLM analysis, group-averaged -maps and corresponding -maps were generated, with different reference contrasts for statistical comparisons, such as statistical differences in brain activation: (a) between LPS phase and baseline (i.e., LPS-baseline); (b) between HPS phase and baseline (HPS-baseline); and (c) between post-HPS recovery phase and baseline (recovery-baseline). These comparisons are shown in the following subsections. Fig. 5(a)–(c) Group-averaged norms of residuals averaged across respective subjects when the recovery predictor duration was varied (between 1 and 30 s with an increment of 1 s) to fit in response to LPS over the right forearm, right TMJ, and left forearm, respectively. (d)–(f) Group-averaged norms of residuals averaged across respective subjects when the recovery predictor duration was varied to fit in response to HPS over the right forearm, right TMJ, and left forearm, respectively. 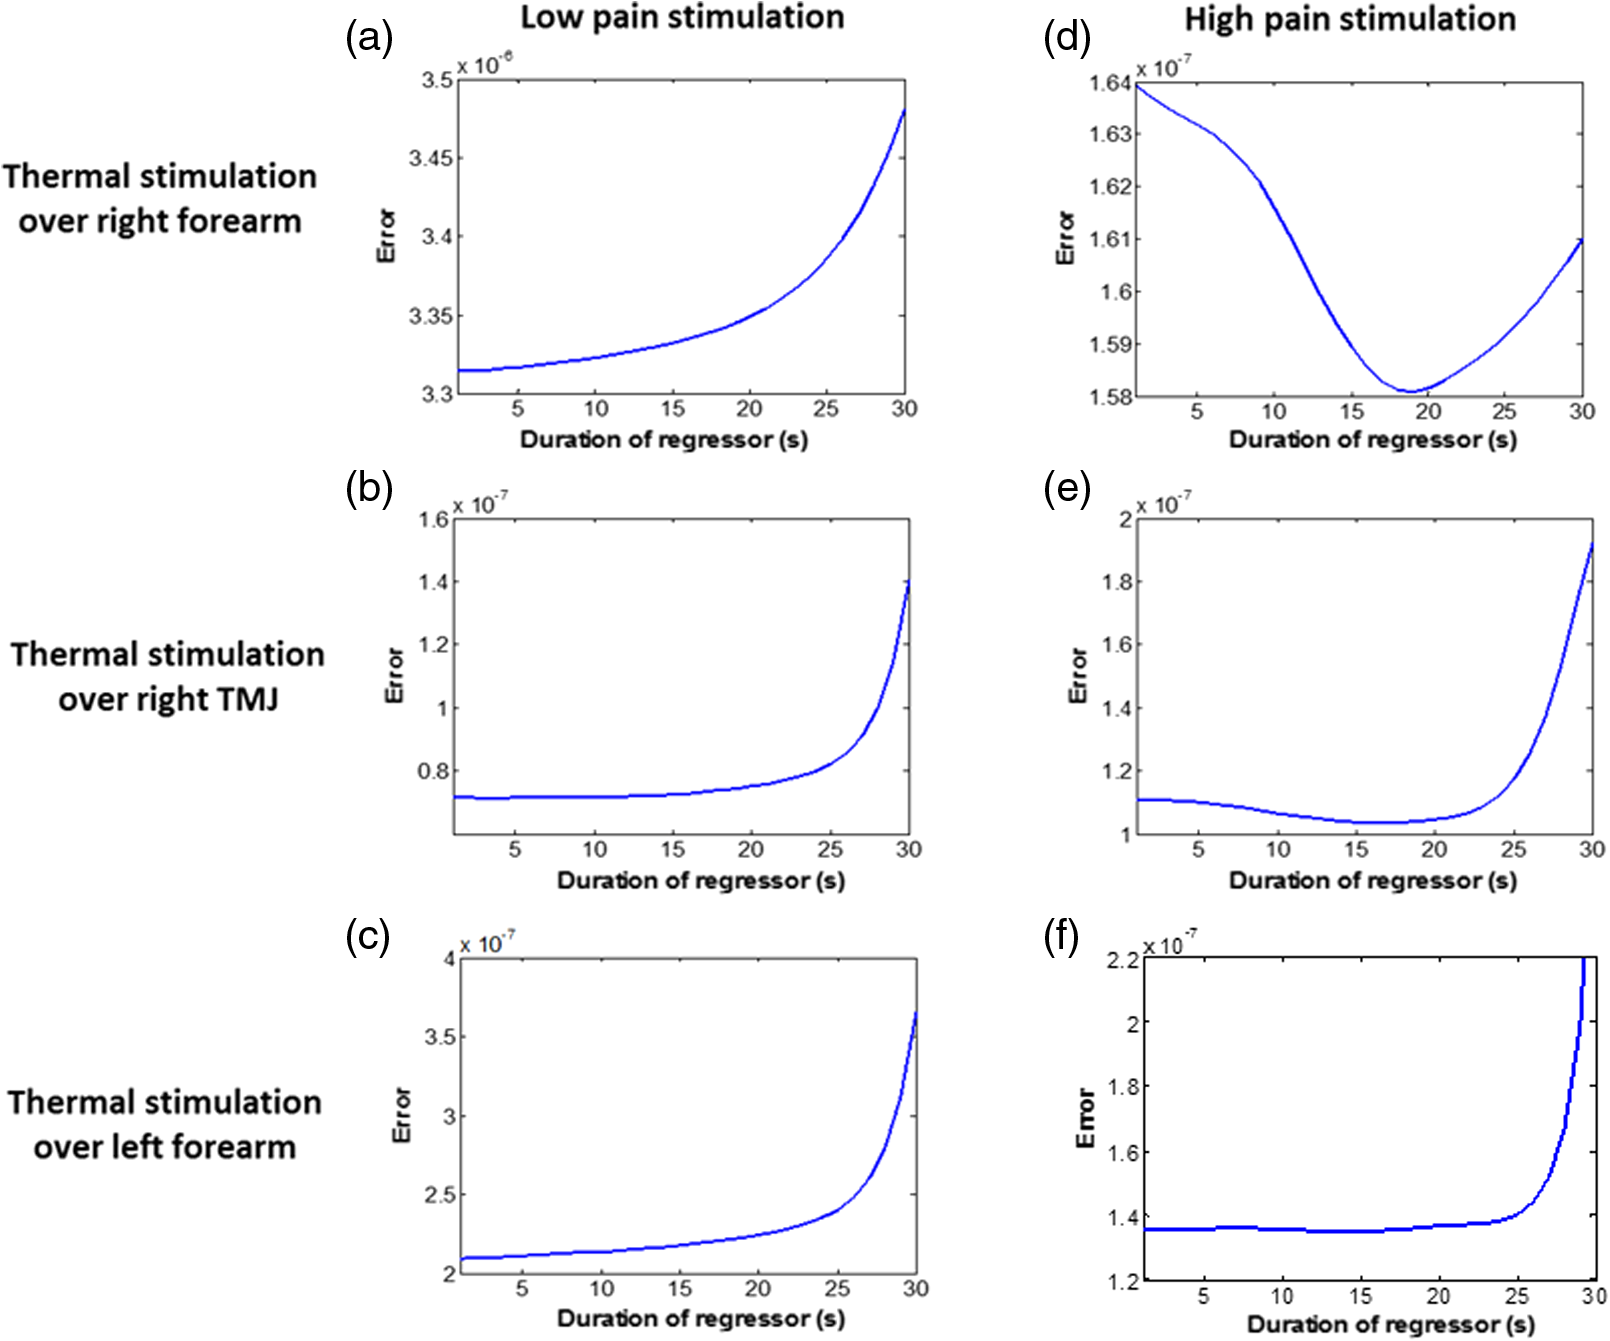 3.3.Changes in HbO Induced by Noxious Thermal Stimulation Given on the Right ForearmFigures 6(a)–6(c) show topographic images of prefrontal responses (-maps) during LPS (-map), HPS (-map), and post-HPS recovery (-map) periods, respectively, when the thermal stimulations were given over the right forearm of the study group (). Correspondingly, Figs. 7(a)–7(c) show respective topographic -maps with significant difference [, false discovery rate corrected]. According to the -map of Fig. 6(a), the prefrontal regions in the left hemisphere were deactivated during LPS over the right forearm. However, none of the regions showed a significant difference from the baseline readings [see Fig. 7(a)]. Fig. 6(a)–(c) Topographic images of group-averaged prefrontal cortical activations and/or deactivations (i.e., -maps derived from ) during LPS, HPS, and post-HPS recovery periods, respectively, with thermal stimulation given on the right forearm. (d)–(f) Topographic images of group-averaged prefrontal cortical activations and/or deactivations (-maps) during LPS, HPS, and post-HPS periods, respectively, with thermal stimulation on the right TMJ region. (g)–(i) Topographic images of group-averaged frontal cortical activations and/or deactivations (-maps) during LPS, HPS, and post-HPS periods, respectively, with thermal stimulation over the left forearm. 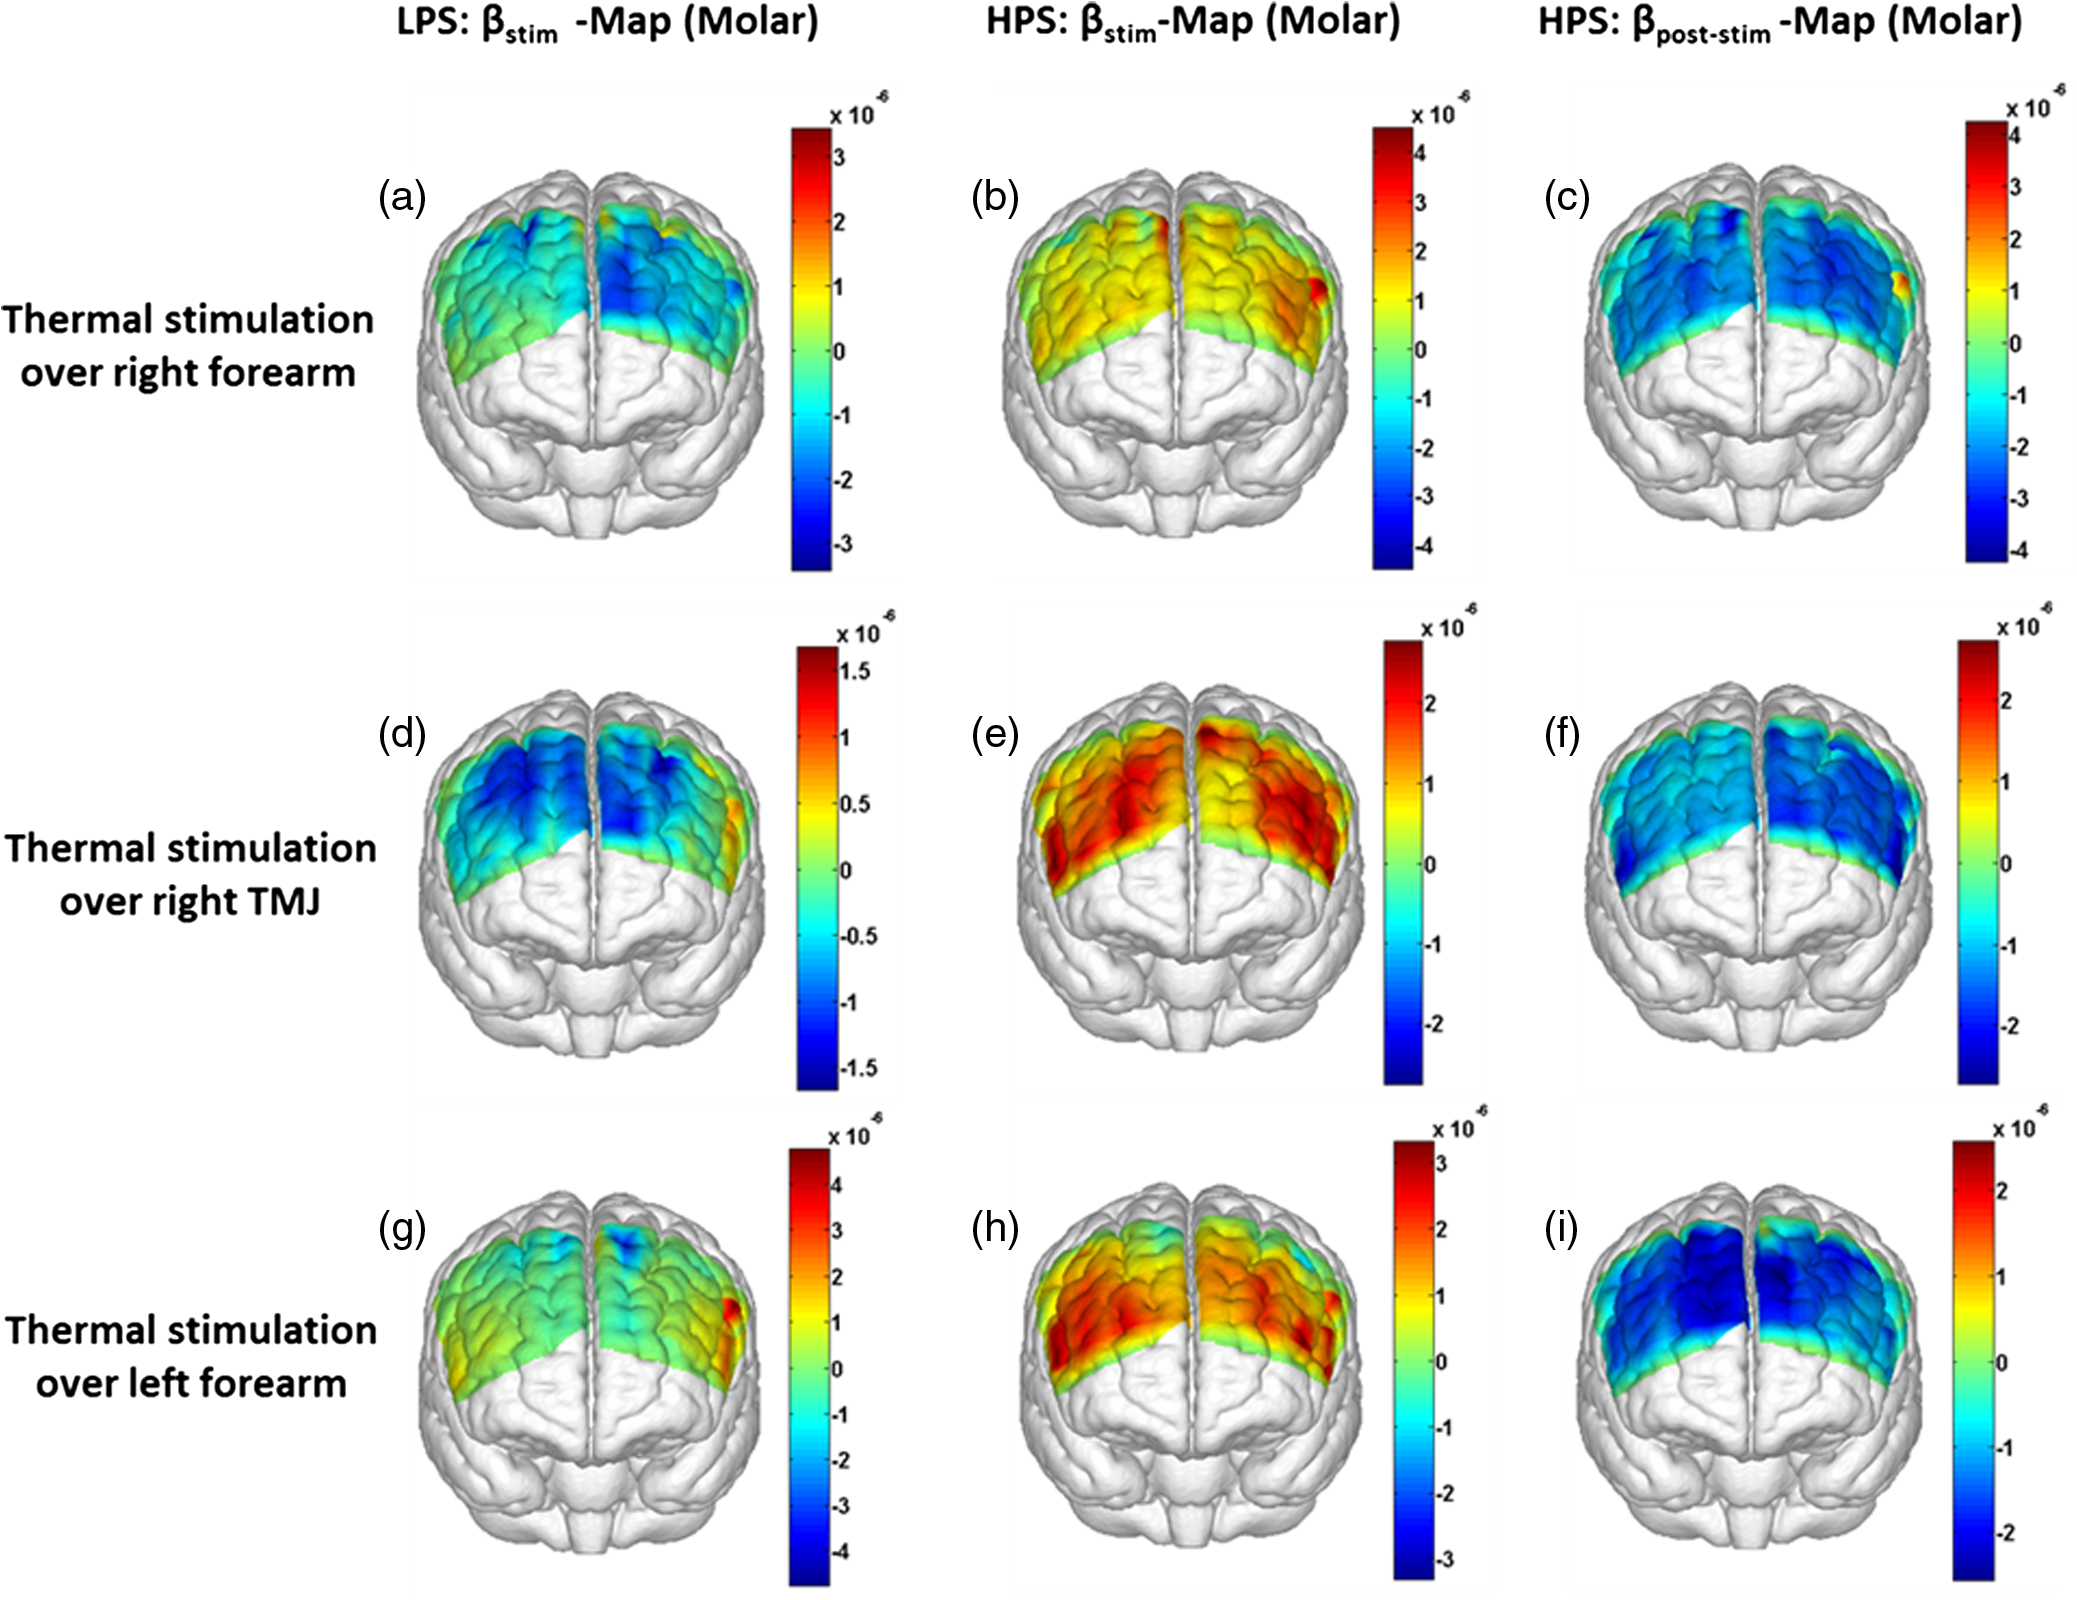 Fig. 7(a)–(c) Topographic images of statistical -maps (, FDR corrected) for LPS versus baseline, HPS versus baseline, and post-HPS recovery versus baseline, respectively, with thermal stimulation given on the right forearm. (d)–(f) Topographic images of -maps (, FDR corrected) for LPS versus baseline, HPS versus baseline, and post-HPS recovery versus baseline, respectively, with thermal stimulation over the right TMJ area. (g)–(i) Topographic images of -maps (, FDR corrected) for LPS versus baseline, HPS versus baseline, and post-HPS recovery versus baseline, respectively, with thermal stimulation over the left forearm. 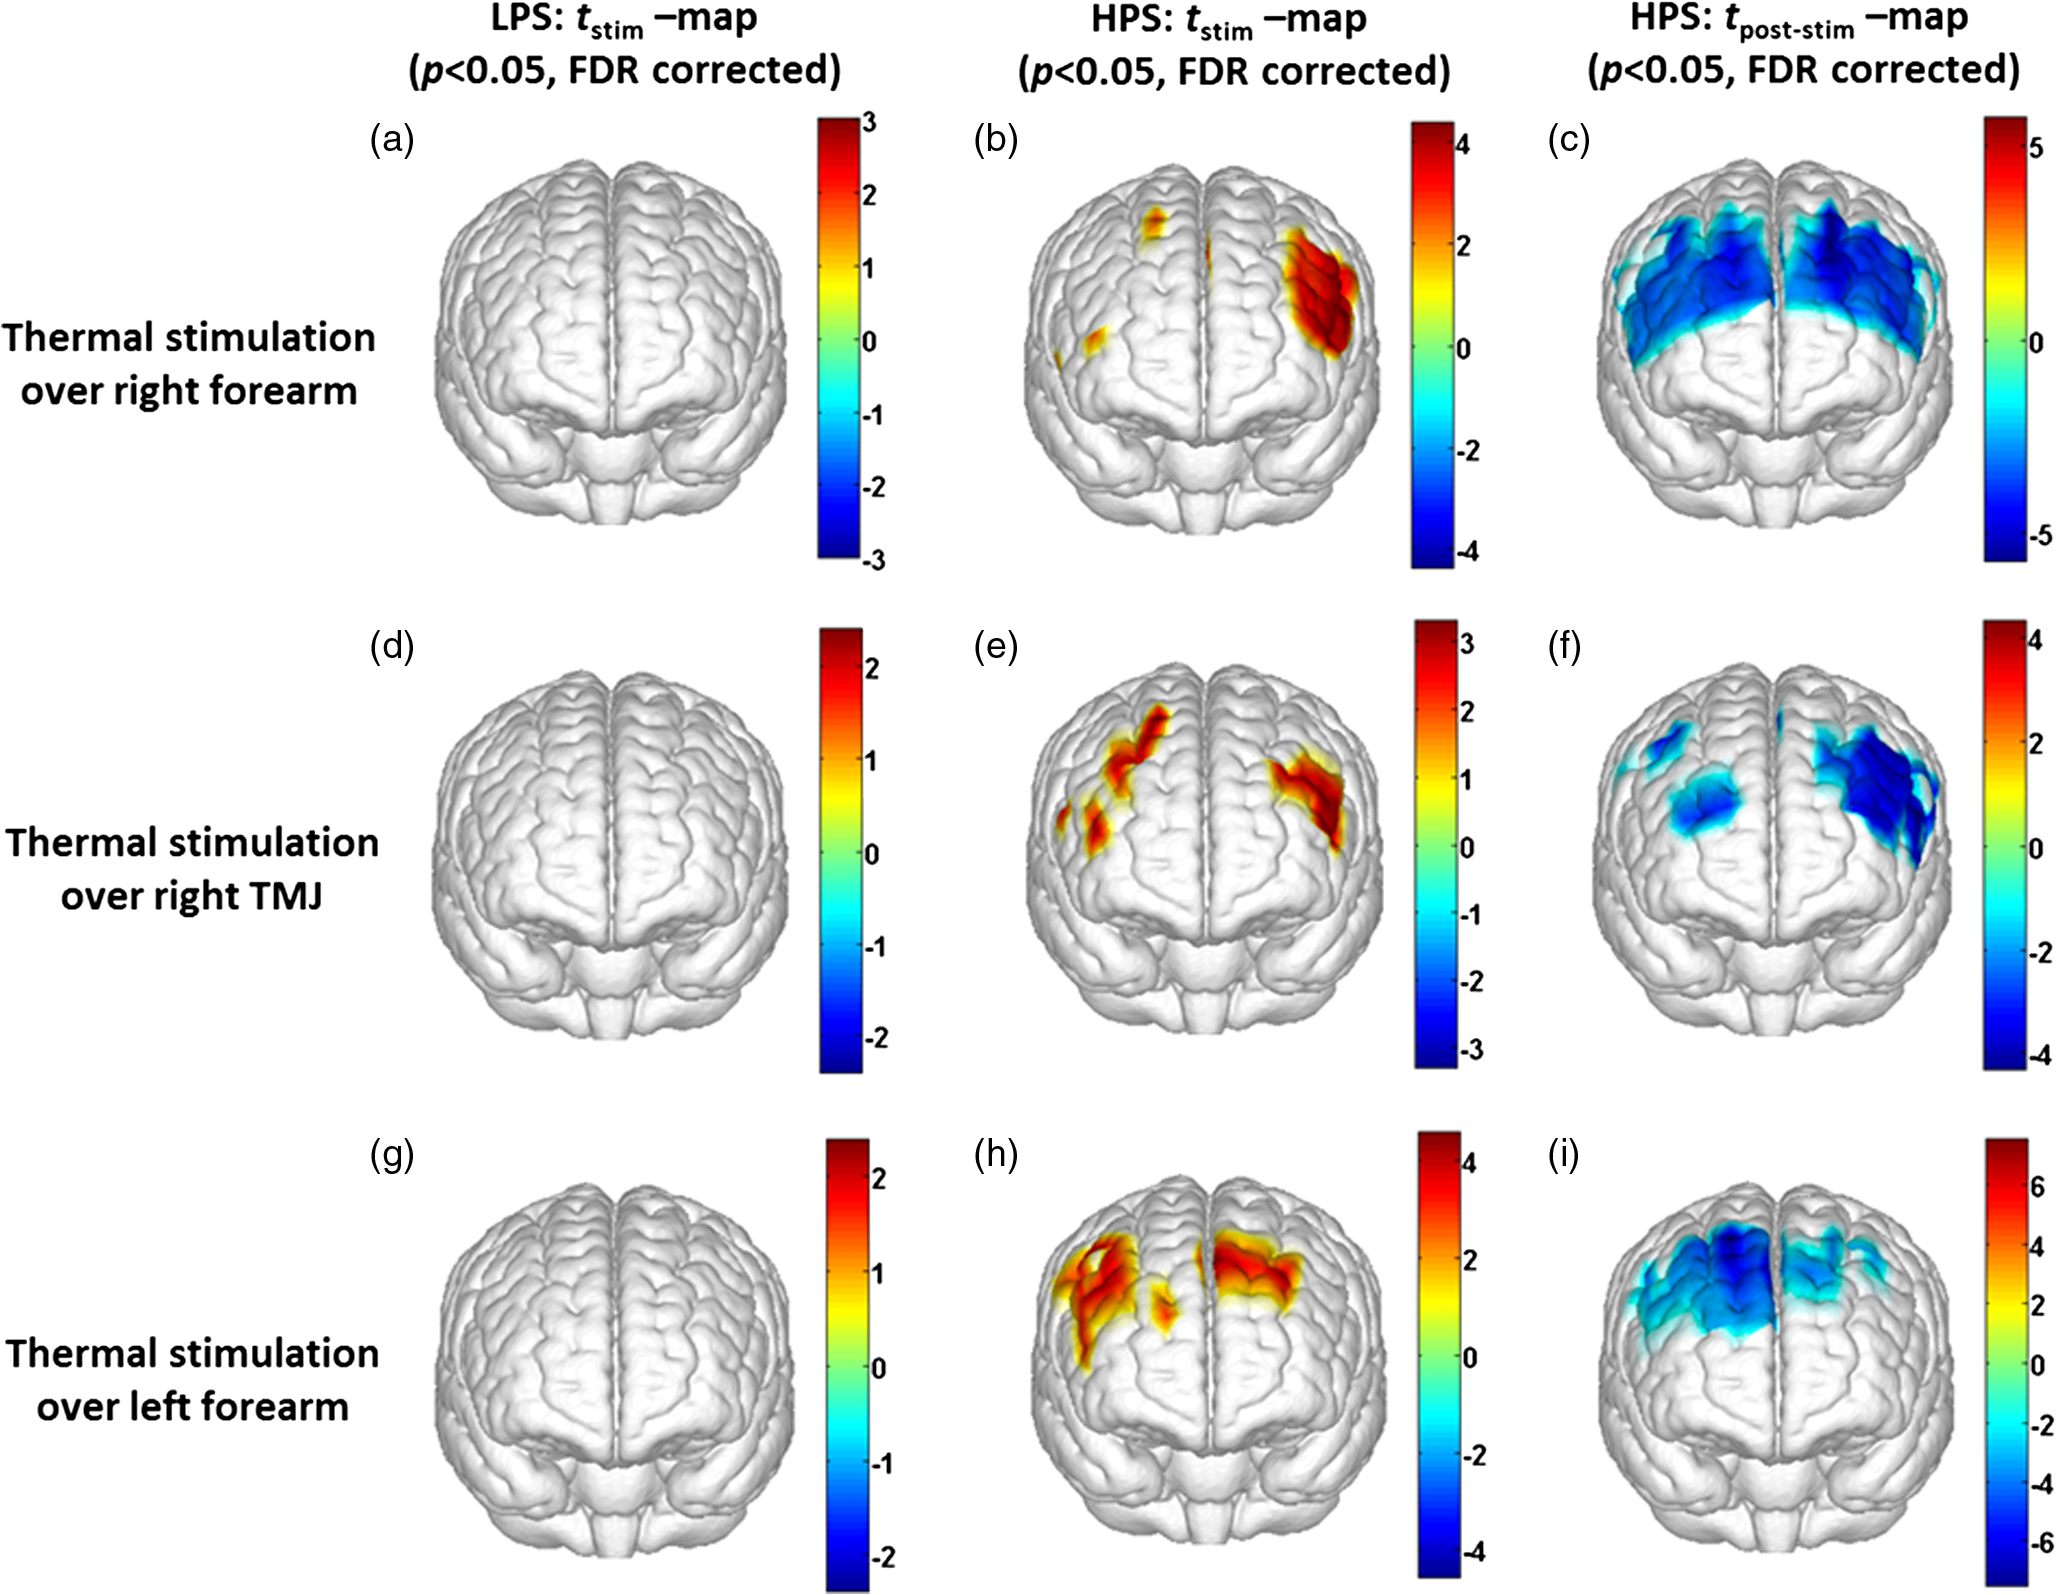 On the other hand, during HPS, 20 out of total 75 channels measured from the PFC were significantly activated with increased responses [Fig. 7(b)]. Out of these 20 activated channels, two channels were located on the left premotor area (PMA; BA 6), seven channels were located on the left DLPFC (BAs 9 and 46), eight channels were located on the left VLPFC (BAs 44 and 45), one channel was located on the right FEF (BA 8), one channel was located on the right VLPFC, and one channel was located on the right DLPFC. These activated regions are all marked or shown by Fig. 7(b). It is clear that the activation was predominant in the left PFC during HPS of the right forearm. Additionally, we observed significant deactivations with decreased , when compared to the baseline, in most of the prefrontal cortical regions during the post-HPS recovery period: 59 out of a total of 75 channels showed significant deactivations in the prefrontal cortical regions measured [see Fig. 7(c)]. It is seen from this figure that the 59 deactivated channels cover the PMA, FEF, DLPFC, VLPFC, and FPA on both hemispheres bilaterally. 3.4.Changes in HbO Induced by Noxious Thermal Stimulation Given Over the Right TMJFigures 6(d)–6(f) show topographic images of prefrontal responses (-maps) during LPS, HPS, and post-HPS recovery periods, respectively, when the thermal stimulations were given over the right TMJ area of the study group (). Correspondingly, Figs. 7(d)–7(f) show respective -maps with significant difference (, FDR corrected) for those contrasts. According to the -map and -map shown in Figs. 6(d) and 7(d), the bilateral prefrontal regions were deactivated during LPS, but none of the regions showed a significant difference from the baseline readings [see Fig. 7(d)]. During HPS over the right TMJ, 14 out of total 75 channels measured from the PFC were significantly activated bilaterally [see Fig. 7(e)]. The 14 activated channels covered the left DLPFC and left VLPFC; on the right hemisphere side, one channel was located on the right FEF, two channels were on the right VLPFC, and four channels were on the right DLPFC. In addition, we observed significant deactivations in most of prefrontal cortical regions during the post-HPS recovery from the thermal stimulation over the right TMJ [see Fig. 7(f)]. During this recovery phase, 29 out of a total of 75 channels showed bilateral deactivation; they covered the left PMA, left DLPFC and left VLPFC, right PMA, right DLPFC, and right FPA. 3.5.Changes in HbO Induced by Noxious Thermal Stimulation Over the Left ForearmFigures 6(g)–6(i) show topographic images of prefrontal responses (-maps) during LPS, HPS, and post-HPS recovery periods, respectively, when the thermal stimulations were given over the left forearm of the study group (). Correspondingly, Figs. 7(g)–7(i) show respective -maps with significant difference (, FDR corrected) for those contrasts. According to the -map and -map shown in Figs. 6(g) and 7(g), the bilateral prefrontal regions did not show significant changes from the baseline readings. During HPS over the left forearm, 17 out of a total of 75 channels from the PFC were significantly activated bilaterally but not symmetrically [see Fig. 7(h)]. The 17 channels covered the left DLPFC, but covered more on the right prefrontal region: one channel on the right PMA, one channel on the right VLPFC, eight channels on the right DLPFC, and one channel on the right FPA. Additionally, we found significant deactivations in most of the prefrontal cortical regions during the post-HPS recovery from the thermal stimulation over the left forearm. During the recovery phase, 29 out of a total of 75 channels showed significant deactivations bilaterally, but not symmetrically [see Fig. 7(i)]. The deactivation areas covered the left FEF, left DLPFC, and left VLPFC, but there were more deactivation channels seen on the right PFC: 5 channels were located on the right FEF, 10 channels on the right DLPFC, and 4 channels on the right FPA. 3.6.Spatial Specificity of in PFC in Response to HPS Induced Over Three Body SitesThrough Secs. 3.3–3.5, we showed topographic images in response to HPS over each of three different body sites and demonstrated that each of these three stimulations resulted in PFC activations in multiple Brodmann areas. It would be important to quantitatively assess spatial specificity of HPS-induced activation regions in relationship with the three different stimulation sites. Given a two-dimensional geometry with 75 channels (or source–detector pairs) of readings and three different stimulation sites at both HPS and LPS levels, we would need multifactor ANOVA for a rigorous analysis approach. To simplify the complexity of this analysis, we decided to analyze or focus on only the HPS case since LPS did not result in significant changes in prefrontal stimulated at any of the three pain-induction sites [see Figs. 7(a), 7(d), and 7(g)]. We performed channel-wise, one-way ANOVA for (or ) values among three HPS conditions (at the three body sites). This analysis reported that none of the 75 channels showed significant difference () among the three activations in response to HPS at the right forearm, right TMJ area, and the left forearm. Next, a power analysis was conducted for each of the 75 channels among the three cases to examine possible Type II errors. However, given that this was a feasibility study with very limited sample sizes ( for TMJ and left forearm groups), the statistical power was low for most of channels (), as expected. More discussion regarding this statistical power is given in Sec. 4.5. Based on this effect size and the standard deviation already obtained from our measurements, an 80% power would require a sample size of to avoid a large Type II error. We will consider this sample size for our future studies. 4.Discussion4.1.Temporal and Spatial Hemodynamic () Characteristics in PFC in Response to HPSThe results presented in Sec. 3 demonstrate that HbO signals in the PFC were significantly increased with respect to the baseline during HPS, followed by a significant decrease from the baseline during the recovery period (see Figs. 2–4). On the other hand, LPS resulted in slight HbO deactivation in the PFC, but not significantly different from the baseline (also see Figs. 2–4). Regarding spatial perturbation in PFC by HPS, we can summarize the following points.
Overall, it is clear that the temporal hemodynamic characteristics obtained from the PFC were consistent during noxious thermal stimulation over the three different body sites, whereas they were stimulated separately. Additionally, high-pain thermal stimulation activated a large portion of the PFC, especially in the left DLPFC (BAs 9 and 46) and left VLPFC (BAs 44 and 45) regions. Furthermore, it is worth pointing out that habituation for thermal stimuli would have possibly occurred in our study although we did not particularly quantify it. We did not particularly notice observable decay of over repetitive stimulation. Based on the results shown in Ref. 43, we did not expect to have a significant effect of habituation on our overall results. Habituation would reduce amplitudes in later stimulation episodes, not delay the fNIRS responses over repetitive stimulation. The reduction of amplitudes would act like a systematic bias across all three HPS protocols, and thus it will not affect the comparative results among them. 4.2.Consistency Between Our Results and Those by fMRIIn recent years, a variety of studies have been conducted using neuroimaging tools to develop a better understanding of complex neurological process and phenomena underlying pain. Several fMRI-based studies have revealed possible interrelationships between pain and brain functions noninvasively. In particular, Kong et al. reported significant activations (i.e., BOLD signal increase from baseline) in several cortical and subcortical regions during high-pain thermal stimulation over the right forearm of a group of controls using fMRI. Some of the activated regions reported included, but were not limited to, the prefrontal (BAs 9, 10, 44, 46) and somatosensory cortices (i.e., S1 and S2 regions).44 Another recent fMRI study also reported significant activations in several cortical and subcortical regions when a high-pain cold stimulus was applied to the thenar surface of the right hand. The activated regions included, but were not limited to, the bilateral anterior insula, bilateral dorsal ACC extending into the presupplementary motor area (BAs 6, 8, 24, 32), and the right lateral PFC (i.e., DLPFC and VLPFC; BAs 9, 10, 44, 45, 46, 47).45 In this study, our results also present similar activations in several prefrontal cortical areas (such as BAs 8, 9, 10, 44, 45, and 46) during high-pain thermal stimulation given at different body sites [see Figs. 6 and 7]. These consistent HPS-evoked activations within the PFC might suggest its critical role in the cognitive evaluation of noxious stimuli. However, this interpretation or expectation needs to be further confirmed by quantitatively correlating hemodynamic responses (i.e., ) with different levels of noxious stimuli (which was not available in this study). An fMRI-based pain study by Freund et al.46 reported that the DLPFC and caudate nucleus were significantly activated when healthy subjects made efforts to disengage from feeling pain during constant thermal stimulation. In addition, they suggested that the caudate nucleus and PFC play a crucial role in initiation and maintenance of suppression of pain, respectively.46 Another fMRI study by a separate group also demonstrated the role of the anterolateral PFC in expected and perceived control over pain.17 Also, a PET-based study of pain reported the influence of DLPFC on pain perception by modulating cortico-subcortical and cortico-cortical pathways.15 All of these published studies suggest that the PFC is one of the key elements in the “pain matrix,” and PFC plays a significant role in pain processing. Our present results are in good agreement with, and strongly support, this overall observation and scientific findings. 4.3.Possible Mechanism of Postpain Deactivation inApart from activations in PFC caused by HPS at three different body sites, we also consistently observed a significant deactivation of in most of the prefrontal cortical regions during the post-HPS recovery period (see Figs. 6 and 7). However, we did not detect any significant deactivation during the post-LPS recovery phase. Regarding possible mechanism of this postpain deactivation in , it is less likely that the negative HbO responses are artifacts caused by band-pass filtering. We have not observed such long-lasting ( to 20 s), strong, poststimulus HbO deactivations in most of our studies (over the last 8 years with papers published); a few examples are given in Refs. 32, 4748.49.50.–51. In those studies, we had used the same band-pass filter in a frequency range of 0.01 to 0.2 Hz across different tasks in either PFC or motor cortex regions. Thus, we believe that this postpain deactivation in must be associated distinctively with cerebral and/or neurophysiological responses to pain stimulations. A recent fNIRS-based pain study showed poststimulus HbO deactivation in the frontal cortex during noxious electrical stimulation of the left thumb.29 Furthermore, another recent fNIRS-based pain study reported a decrease in prefrontal , along with reduced levels of end-tidal , during noxious mechanical stimulation in the low back region.27 The latter study attributed the observed PFC deactivations to pain-related hyperventilation. Hyperventilation can result in reduced levels of end-tidal , which is a reliable estimate of partial pressure of . Since is a known vasodilator, reduction in end-tidal should result in global vasoconstriction. In this study, we observed consistent post-HPS deactivations in most of the frontal cortical regions. Therefore, we attributed our observed post-HPS deactivations in to vasoconstriction, caused by high-pain thermal stimulation. To validate this explanation or expectation, simultaneous measurements of and end-tidal during a selected HPS are essential in future studies. 4.4.Spatial Consistency and Specificity of Responses to HPS Over Three Body SitesFigure 7 appeared to indicate that the HPS-induced brain activity regions depended on the stimulated body sites, especially in the case of right forearm stimulation. However, the one-way ANOVA reported in Sec. 3.6 indicated that the HPS-induced brain activity regions were spatially consistent regardless of the three different pain-originating sites. The results from Fig. 7 and ANOVA are not in conflict. This is because Fig. 7 illustrated significant HbO activations in the PFC with respect to the baselines under each of the three HPS conditions, whereas the ANOVA tested whether the three increased HbO values under the respective HPS were statistically differentiable at each channel. Close and visual inspection of Figs. 6(b), 6(e), and 6(h) may help the reader better understand or interpret the ANOVA results. These three figures exhibit similar spatial patterns of increases, hinting that there is not much (statistical) difference among three of them. On the one hand, our ANOVA results indicated high-spatial consistency of HPS-induced prefrontal activations regardless of thermal stimulation sites. On the other hand, the same results revealed that responses to HPS have relatively low-spatial specificity in the PFC (see Figs. 6 and 7) since the activation regions are quite spread. Further investigations are needed to identify/pin-point particular, specific PFC regions that could be a potential pain-detection site or sites. 4.5.Limitations of the Study and Future WorkSeveral potential limitations of this study should be noted. First, our speculation on reduction of end-tidal during post-HPS could not be investigated because we did not use capnography to measure it while taking fNIRS measurements. Thus, simultaneous measurements of fNIRS with end-tidal are recommended in future pain-related studies, particularly under high-pain stimulations (HPSs). Second, global physiological noises that may contaminate pain-induced HbO changes were not investigated and removed. In future studies, such potential limitations can be minimized. An improved approach is to collect short separation fNIRS measurements as systemic/physiological noise predictors for adaptive noise cancellation.52 Another approach is based on global signal regression by averaging fNIRS signals over the entire measurement channels as a noise predictor to remove global systemic effects.53,54 Third, to prevent habituation and/or pretreatment effects, future studies should be designed with an order of sessions counterbalanced between HPS and LPS across participants. Finally, the norms of residuals on the right forearm [Fig. 5(d)] seem to be different from those on other regions [Figs. 5(e) and 5(f)]. The reason could be related to the sample size. We had 16 subjects for the group with right forearm thermal stimulation, whereas the other two groups had only nine subjects per group. It would be surely beneficial to include more subjects () in future experiments to examine whether the norms of residuals across different stimulation sites will be in good agreements. Furthermore, with a larger sample size, it is more feasible and accurate to estimate a Type II error or statistical power for the spatial discrimination or specificity of in PFC and thus to potentially find specific regions and/or biomarkers for noninvasive, objective measure of pain. 5.ConclusionThis study reported consistent temporal characteristics and cortical mapping of prefrontal hemodynamics in response to noxious thermal stimulation over three body sites by using fNIRS. While the stimulations were given over the right forearm, right TMJ, and left forearm, separately, to three different groups of healthy subjects, changes of HbO in the PFC, especially in the dorsolateral PFC, were significantly increased (, FDR corrected) with similar temporal patterns and spatial localizations. In contrast, low-pain stimulation (LPS) did not result in any significant changes in HbO in the prefrontal regions in any of the three groups. Our observed results were highly consistent with previous reports by other pain-related studies. In addition, we introduced and optimally selected a variable recovery regressor to account for a peculiar global trend of deactivation in the PFC during the post-HPS period. This poststimulation recovery regressor allowed us to identify and map deactivation regions in the PFC, which may be attributed to global vasoconstriction due to induction of acute nocious pain. Overall, this investigation concluded that the temporal and spatial hemodynamic activities in the PFC in response to acute thermal stimulation were consistent regardless of the stimulation sites, and that multichannel fNIRS can be used to reveal such changes quantitatively, and may have great potential for future clinical applications. Further investigations are needed to pin-point particular, specific PFC regions that could be a potential pain-detection site or sites. DisclosuresAll of the authors had no relevant financial or competing interests nor other potential conflicts of interest. AppendicesAppendixThe group-averaged temporal profiles of for all the clusters in response to both LPS and HPS are shown in Figs. 8Fig. 9–10, respectively, for the stimulations on (1) the right forearm, (2) the right TMJ region, and (3) the left forearm. These figures illustrate that in most of the clusters, HPS induced a slight decrease in during the stimulation, followed by a short recovery to baseline, in all three groups. On the other hand, LPS did not induce any obvious change in during the stimulation in all three groups. Furthermore, we employed GLM with a single predictor to quantify prefrontal activations and/or deactivations during the LPS and HPS. Group-averaged topographic images of prefrontal responses to LPS and HPS, respectively, given over the right forearm of the study group () are shown in Figs. 11(a) and 11(b). Similar topographic images of in response to LPS and HPS, respectively, given over the right TMJ of the study group () are shown in Figs. 11(c) and 11(d). Another set of group-averaged images of prefrontal in response to LPS and HPS, respectively, given over the left forearm of the study group () are shown in Figs. 11(e) and 11(f). According to the -maps of Figs. 11(a), 11(c), and 11(e), the prefrontal regions did not show any obvious Hb activations/deactivations by LPS over the three body sites, respectively. In addition, according to the -maps of Figs. 11(b), 11(d), and 11(f), the prefrontal regions showed slight Hb deactivations during HPS over the right forearm, right TMJ, and left forearm, respectively. However, during both LPS and HPS, none of the regions showed a significant Hb difference from the baseline readings, in all three groups (-maps are not shown). Fig. 8Group-averaged temporal profiles of (in microMolar) across 16 subjects under the right forearm thermal stimulation, for all clusters (labeled as ). Gray and black curves represent group-averaged profiles of in response to LPS and HPS, respectively. Error bars are standard errors. Solid black lines mark the stimulation period. 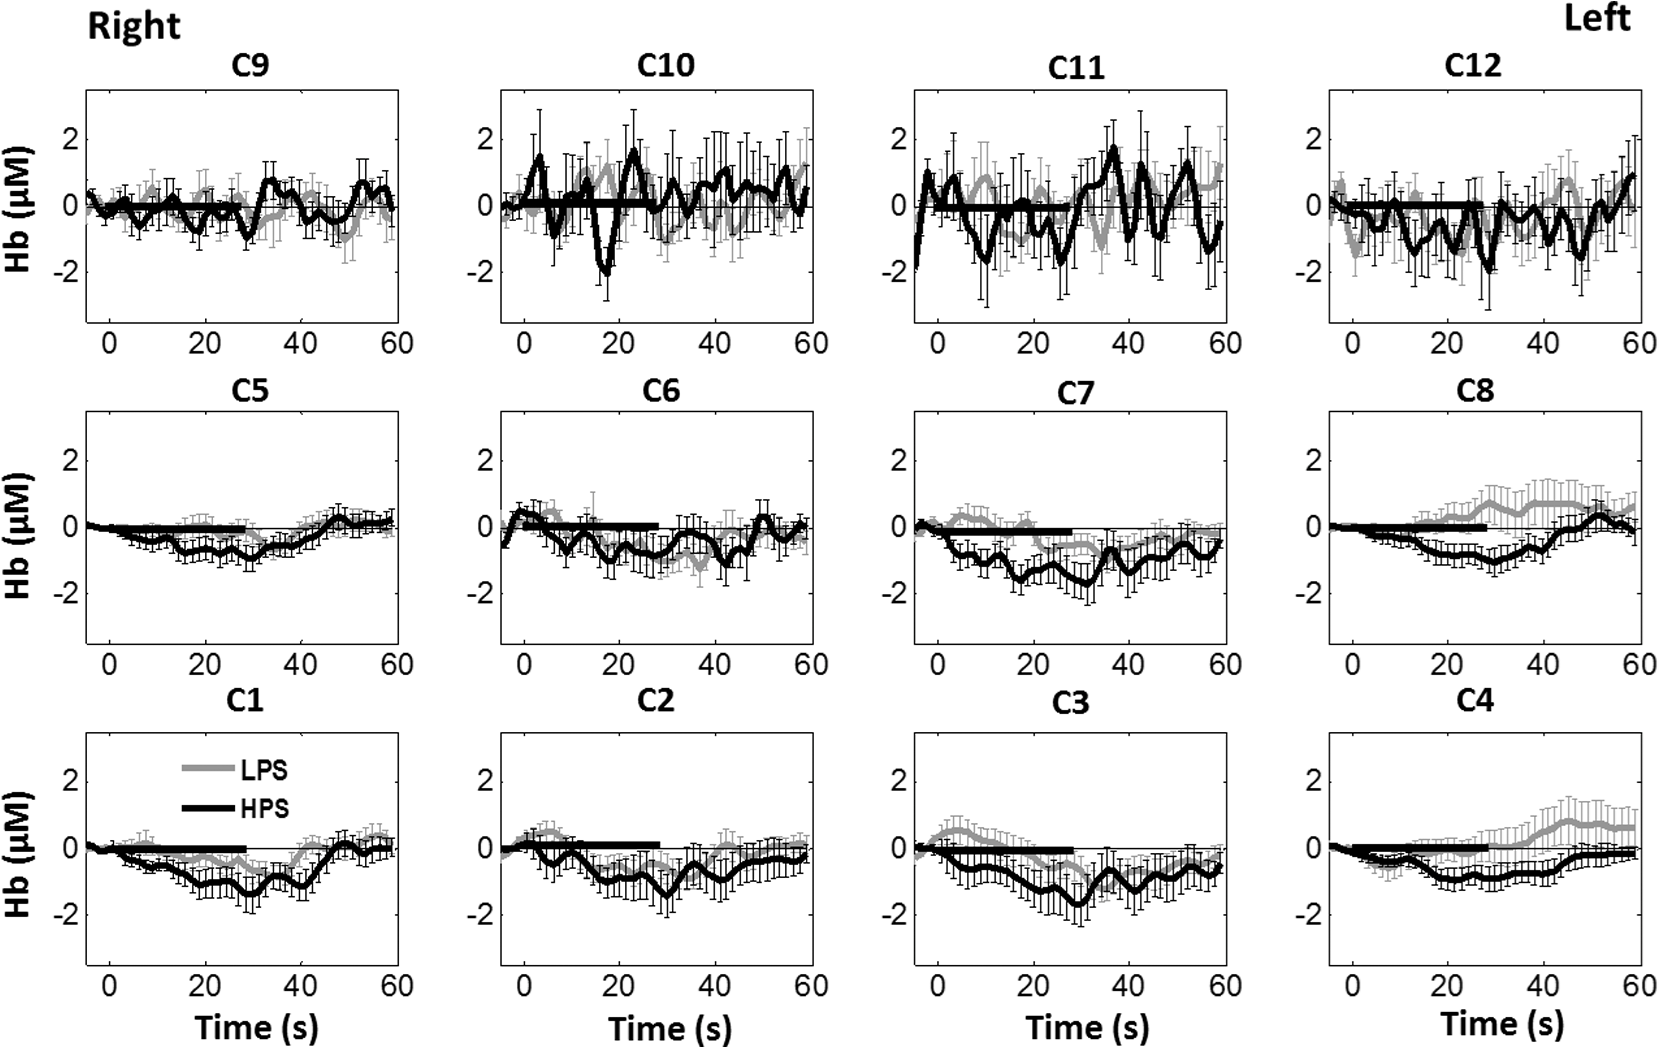 Fig. 9Group-averaged temporal profiles of concentration (in microMolar) across nine subjects under right TMJ thermal stimulation, for all clusters (labeled as ). Gray and black curves represent profiles in response to LPS and HPS, respectively. Error bars are standard errors. Solid black lines represent the stimulation period. 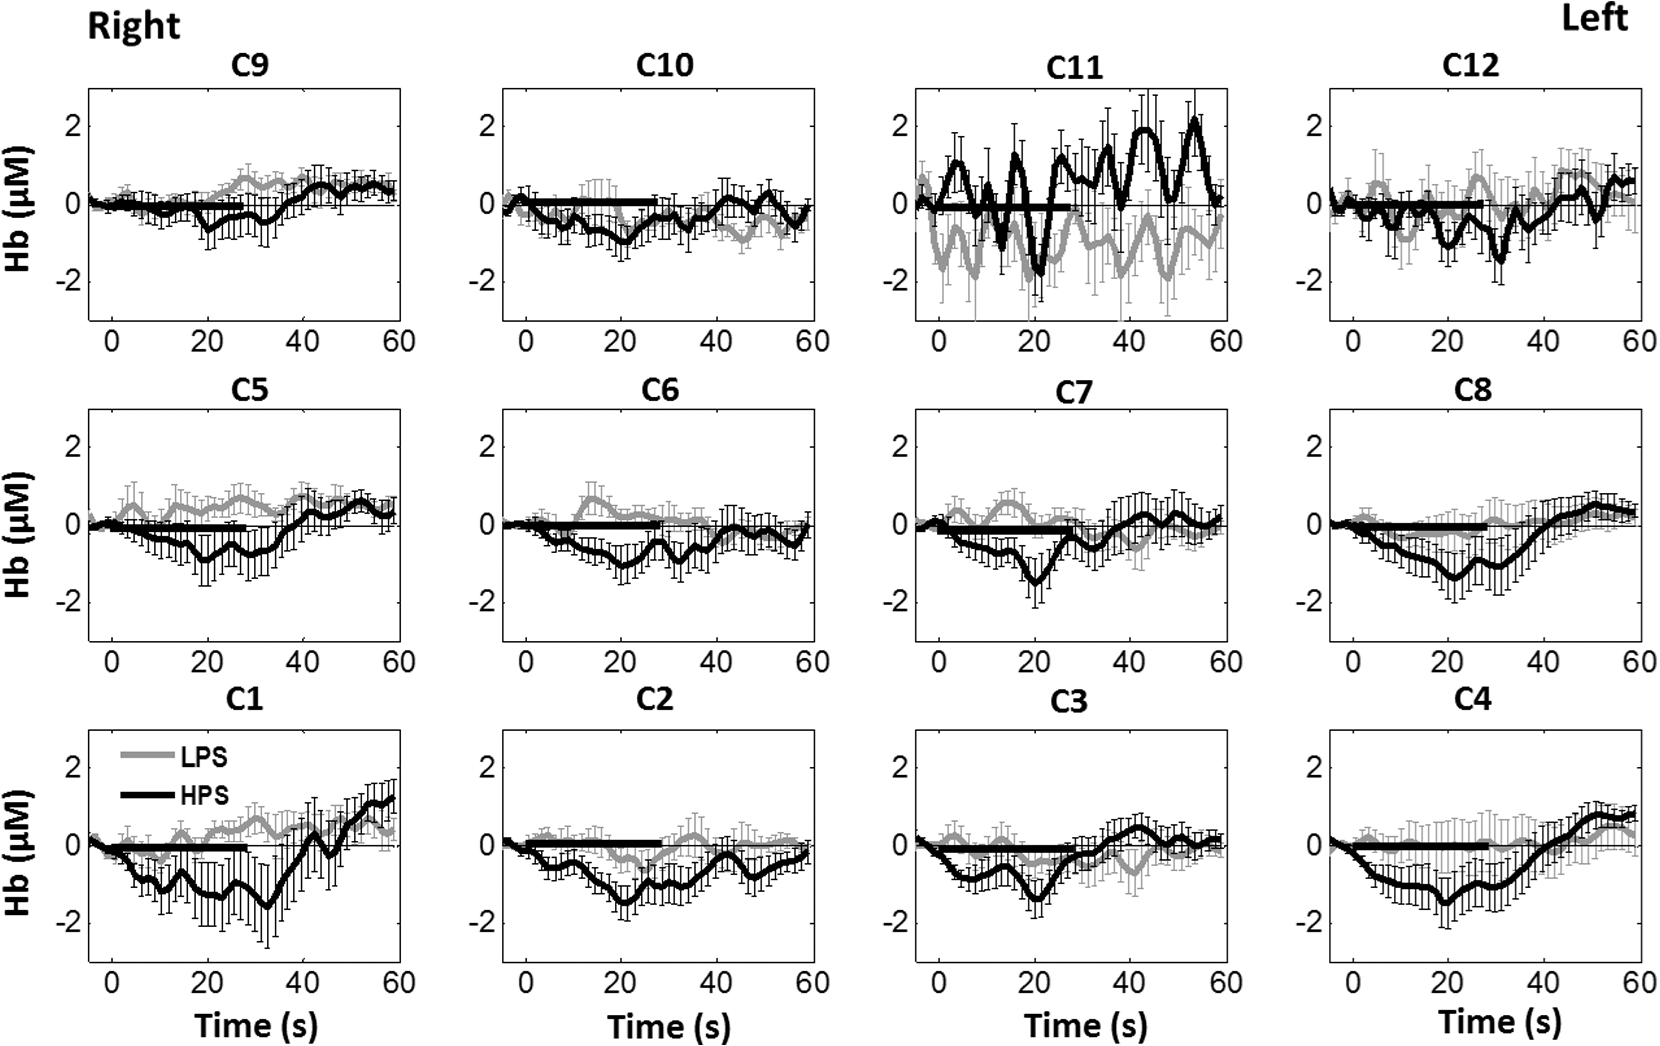 Fig. 10Group-averaged temporal profiles of (in microMolar) across nine subjects under left forearm thermal stimulation, for all clusters (labeled as ). Gray and black curves represent temporal profiles in response to LPS and HPS, respectively. Error bars are standard errors. Solid black lines represent the stimulation period. 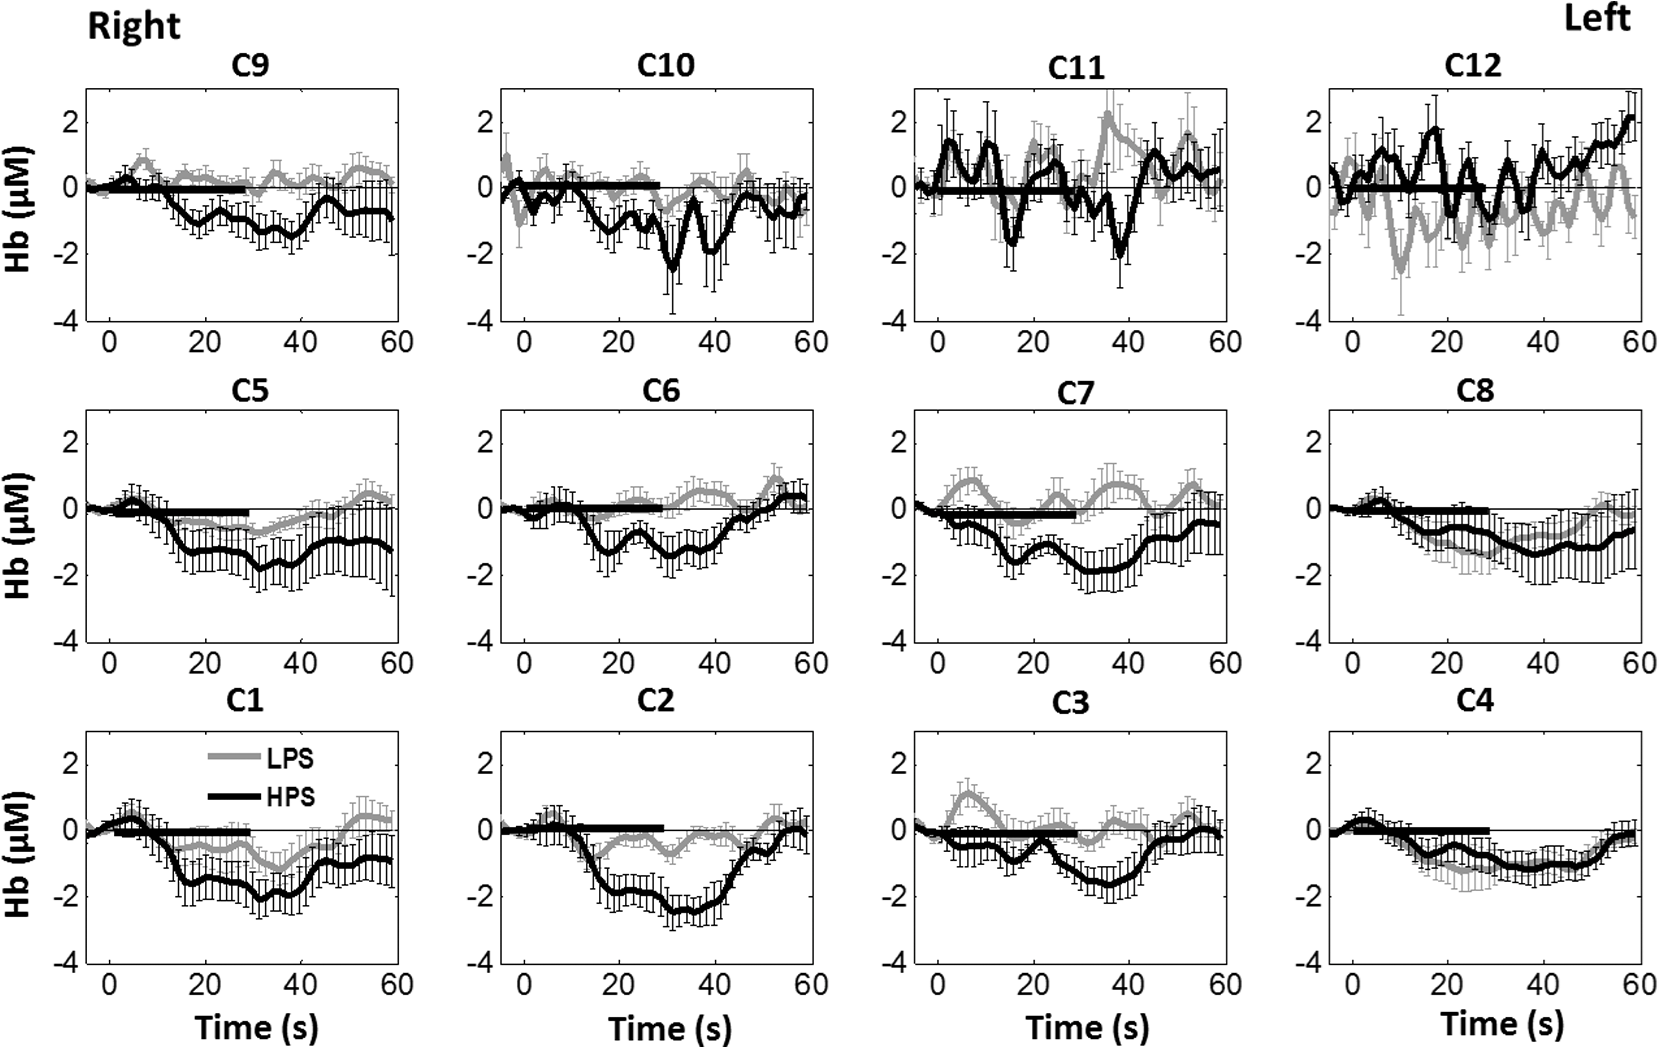 ReferencesK. L. Casey,
“Forebrain mechanisms of nociception and pain: analysis through imaging,”
Proc. Natl. Acad. Sci. U.S.A, 96 7668
–7674
(1999). http://dx.doi.org/10.1073/pnas.96.14.7668 Google Scholar
R. Peyron, B. Laurent and L. Garcia-Larrea,
“Functional imaging of brain responses to pain. A review and meta-analysis (2000),”
Neurophysiol. Clin., 30 263
–288
(2000). http://dx.doi.org/10.1016/S0987-7053(00)00227-6 NCLIE4 0987-7053 Google Scholar
S. C. Mackey and F. Maeda,
“Functional imaging and the neural systems of chronic pain,”
Neurosurg. Clin. N. Am., 15 269
–288
(2004). http://dx.doi.org/10.1016/j.nec.2004.03.001 Google Scholar
V. Neugebauer et al.,
“Forebrain pain mechanisms,”
Brain Res. Rev., 60 226
–242
(2009). http://dx.doi.org/10.1016/j.brainresrev.2008.12.014 BRERD2 0165-0173 Google Scholar
D. A. Seminowicz, D. J. Mikulis and K. D. Davis,
“Cognitive modulation of pain-related brain responses depends on behavioral strategy,”
Pain, 112 48
–58
(2004). http://dx.doi.org/10.1016/j.pain.2004.07.027 PAINDB 0304-3959 Google Scholar
I. Tracey and P. W. Mantyh,
“The cerebral signature for pain perception and its modulation,”
Neuron, 55 377
–391
(2007). http://dx.doi.org/10.1016/j.neuron.2007.07.012 NERNET 0896-6273 Google Scholar
M. Zhuo,
“Cortical excitation and chronic pain,”
Trends Neurosci., 31 199
–207
(2008). http://dx.doi.org/10.1016/j.tins.2008.01.003 TNSCDR 0166-2236 Google Scholar
A. V. Apkarian et al.,
“Human brain mechanisms of pain perception and regulation in health and disease,”
Eur. J. Pain, 9 463
–463
(2005). http://dx.doi.org/10.1016/j.ejpain.2004.11.001 Google Scholar
P. T. Ohara, J. P. Vit and L. Jasmin,
“Cortical modulation of pain,”
Cell Mol. Life Sci., 62 44
–52
(2005). http://dx.doi.org/10.1007/s00018-004-4283-9 CMLSFI 1420-9071 Google Scholar
D. D. Price,
“Psychological and neural mechanisms of the affective dimension of pain,”
Science, 288 1769
–1772
(2000). http://dx.doi.org/10.1126/science.288.5472.1769 SCIEAS 0036-8075 Google Scholar
V. Neugebauer et al.,
“The amygdala and persistent pain,”
Neuroscientist, 10 221
–234
(2004). http://dx.doi.org/10.1177/1073858403261077 NROSFJ 1073-8584 Google Scholar
K. N. Ochsner et al.,
“Neural correlates of individual differences in pain-related fear and anxiety,”
Pain, 120 69
–77
(2006). http://dx.doi.org/10.1016/j.pain.2005.10.014 PAINDB 0304-3959 Google Scholar
G. Ji et al.,
“Pain-related anxiety-like behavior requires CRF1 receptors in the amygdala,”
Mol. Pain, 3 13
(2007). http://dx.doi.org/10.1186/1744-8069-3-13 Google Scholar
B. Kulkarni et al.,
“Arthritic pain is processed in brain areas concerned with emotions and fear,”
Arthritis Rheum., 56 1345
–1354
(2007). http://dx.doi.org/10.1002/(ISSN)1529-0131 Google Scholar
J. Lorenz, S. Minoshima and K. L. Casey,
“Keeping pain out of mind: the role of the dorsolateral prefrontal cortex in pain modulation,”
Brain, 126 1079
–1091
(2003). http://dx.doi.org/10.1093/brain/awg102 BRAIAK 0006-8950 Google Scholar
A. Park,
“Healing the hurt: finding new ways to treat pain,”
Time, 177 64
–68
(2011). TYMEA9 Google Scholar
K. Wiech et al.,
“Anterolateral prefrontal cortex mediates the analgesic effect of expected and perceived control over pain,”
J. Neurosci., 26 11501
–11509
(2006). http://dx.doi.org/10.1523/JNEUROSCI.2568-06.2006 JNRSDS 0270-6474 Google Scholar
L. Becerra et al.,
“Reward circuitry activation by noxious thermal stimuli,”
Neuron, 32 927
–946
(2001). http://dx.doi.org/10.1016/S0896-6273(01)00533-5 NERNET 0896-6273 Google Scholar
M. N. Baliki et al.,
“Chronic pain and the emotional brain: specific brain activity associated with spontaneous fluctuations of intensity of chronic back pain,”
J. Neurosci., 26 12165
–12173
(2006). http://dx.doi.org/10.1523/JNEUROSCI.3576-06.2006 JNRSDS 0270-6474 Google Scholar
L. Becerra et al.,
“Trigeminal neuropathic pain alters responses in CNS circuits to mechanical (brush) and thermal (cold and heat) stimuli,”
J. Neurosci., 26 10646
–10657
(2006). http://dx.doi.org/10.1523/JNEUROSCI.2305-06.2006 JNRSDS 0270-6474 Google Scholar
P. Y. Geha et al.,
“The brain in chronic CRPS pain: abnormal gray-white matter interactions in emotional and autonomic regions,”
Neuron, 60 570
–581
(2008). http://dx.doi.org/10.1016/j.neuron.2008.08.022 NERNET 0896-6273 Google Scholar
A. Lebel et al.,
“fMRI reveals distinct CNS processing during symptomatic and recovered complex regional pain syndrome in children,”
Brain, 131 1854
–1879
(2008). http://dx.doi.org/10.1093/brain/awn123 BRAIAK 0006-8950 Google Scholar
J. G. Craggs et al.,
“Functional brain interactions that serve cognitive-affective processing during pain and placebo analgesia,”
Neuroimage, 38 720
–729
(2007). http://dx.doi.org/10.1016/j.neuroimage.2007.07.057 NEIMEF 1053-8119 Google Scholar
I. H. Lorenz et al.,
“Lornoxicam characteristically modulates cerebral pain-processing in human volunteers: a functional magnetic resonance imaging study,”
Br. J. Anaesth., 100 827
–833
(2008). http://dx.doi.org/10.1093/bja/aen082 BJANAD 0007-0912 Google Scholar
D. A. Boas et al.,
“Twenty years of functional near-infrared spectroscopy: introduction for the special issue,”
Neuroimage, 85
(Pt 1), 1
–5
(2014). http://dx.doi.org/10.1016/j.neuroimage.2013.11.033 NEIMEF 1053-8119 Google Scholar
L. Becerra et al.,
“Diffuse optical tomography activation in the somatosensory cortex: specific activation by painful vs. non-painful thermal stimuli,”
PloS One, 4 e8016
(2009). http://dx.doi.org/10.1371/journal.pone.0008016 POLNCL 1932-6203 Google Scholar
L. Holper et al.,
“Physiological effects of mechanical pain stimulation at the lower back measured by functional near-infrared spectroscopy and capnography,”
J. Integr. Neurosci., 13 121
–142
(2014). http://dx.doi.org/10.1142/S0219635214500071 Google Scholar
A. Yennu et al.,
“A preliminary investigation of human frontal cortex under noxious thermal stimulation over the temporomandibular joint using functional near infrared spectroscopy,”
J. Appl. Biobehav. Res., 18 134
–155
(2013). http://dx.doi.org/10.1111/jabr.2013.18.issue-3 Google Scholar
M. A. Yucel et al.,
“Specificity of hemodynamic brain responses to painful stimuli: a functional near-infrared spectroscopy study,”
Sci. Rep., 5 9469
(2015). http://dx.doi.org/10.1038/srep09469 SRCEC3 2045-2322 Google Scholar
B. W. Zeff et al.,
“Retinotopic mapping of adult human visual cortex with high-density diffuse optical tomography,”
Proc. Natl. Acad. Sci. U.S.A, 104 12169
–12174
(2007). http://dx.doi.org/10.1073/pnas.0611266104 Google Scholar
A. K. Singh et al.,
“Spatial registration of multichannel multi-subject fNIRS data to MNI space without MRI,”
Neuroimage, 27 842
–851
(2005). http://dx.doi.org/10.1016/j.neuroimage.2005.05.019 NEIMEF 1053-8119 Google Scholar
F. Tian et al.,
“Test-retest assessment of cortical activation induced by repetitive transcranial magnetic stimulation with brain atlas-guided optical topography,”
J. Biomed. Opt., 17 116020
(2012). http://dx.doi.org/10.1117/1.JBO.17.11.116020 JBOPFO 1083-3668 Google Scholar
J. C. Ye et al.,
“NIRS-SPM: statistical parametric mapping for near-infrared spectroscopy,”
Neuroimage, 44 428
–447
(2009). http://dx.doi.org/10.1016/j.neuroimage.2008.08.036 NEIMEF 1053-8119 Google Scholar
T. J. Huppert et al.,
“HomER: a review of time-series analysis methods for near-infrared spectroscopy of the brain,”
Appl. Opt., 48 D280
–D298
(2009). http://dx.doi.org/10.1364/AO.48.00D280 APOPAI 0003-6935 Google Scholar
M. Cope et al.,
“Methods of quantitating cerebral near infrared spectroscopy data,”
Adv. Exp. Med. Biol., 222 183
–189
(1988). http://dx.doi.org/10.1007/978-1-4615-9510-6 AEMBAP 0065-2598 Google Scholar
M. M. Plichta et al.,
“Event-related functional near-infrared spectroscopy (fNIRS): are the measurements reliable?,”
Neuroimage, 31 116
–124
(2006). http://dx.doi.org/10.1016/j.neuroimage.2005.12.008 NEIMEF 1053-8119 Google Scholar
M. S. Hassanpour et al.,
“Statistical analysis of high density diffuse optical tomography,”
Neuroimage, 85
(Pt 1), 104
–116
(2014). http://dx.doi.org/10.1016/j.neuroimage.2013.05.105 NEIMEF 1053-8119 Google Scholar
F. Tian and H. Liu,
“Depth-compensated diffuse optical tomography enhanced by general linear model analysis and an anatomical atlas of human head,”
Neuroimage, 85
(Pt 1), 166
–180
(2014). http://dx.doi.org/10.1016/j.neuroimage.2013.07.016 NEIMEF 1053-8119 Google Scholar
S. Telkemeyer et al.,
“Acoustic processing of temporally modulated sounds in infants: evidence from a combined near-infrared spectroscopy and EEG study,”
Front. Psychol., 1 62
(2011). http://dx.doi.org/10.3389/fpsyg.2011.00062 1664-1078 Google Scholar
T. J. Huppert et al.,
“A temporal comparison of BOLD, ASL, and NIRS hemodynamic responses to motor stimuli in adult humans,”
Neuroimage, 29 368
–382
(2006). http://dx.doi.org/10.1016/j.neuroimage.2005.08.065 NEIMEF 1053-8119 Google Scholar
X. P. Ding, G. Fu and K. Lee,
“Neural correlates of own- and other-race face recognition in children: a functional near-infrared spectroscopy study,”
Neuroimage, 85
(Pt 1), 335
–344
(2014). http://dx.doi.org/10.1016/j.neuroimage.2013.07.051 NEIMEF 1053-8119 Google Scholar
M. Cazzell et al.,
“Comparison of neural correlates of risk decision making between genders: an exploratory fNIRS study of the balloon analogue risk task (BART),”
Neuroimage, 62 1896
–1911
(2012). http://dx.doi.org/10.1016/j.neuroimage.2012.05.030 NEIMEF 1053-8119 Google Scholar
M. A. Yucel et al.,
“Short separation regression improves statistical significance and better localizes the hemodynamic response obtained by near-infrared spectroscopy for tasks with differing autonomic responses,”
Neurophotonics, 2 035005
(2015). http://dx.doi.org/10.1117/1.NPh.2.3.035005 Google Scholar
J. Kong et al.,
“Exploring the brain in pain: activations, deactivations and their relation,”
Pain, 148 257
–267
(2010). http://dx.doi.org/10.1016/j.pain.2009.11.008 PAINDB 0304-3959 Google Scholar
C. E. Wilcox et al.,
“The subjective experience of pain: an FMRI study of percept-related models and functional connectivity,”
Pain Med., 16 2121
–2133
(2015). http://dx.doi.org/10.1111/pme.12785 Google Scholar
W. Freund et al.,
“Perception and suppression of thermally induced pain: a fMRI study,”
Somatosens. Mot. Res., 26 1
–10
(2009). http://dx.doi.org/10.1080/08990220902738243 SMOREZ 1369-1651 Google Scholar
A. Yennu et al.,
“Prefrontal responses to Stroop tasks in subjects with post-traumatic stress disorder assessed by functional near infrared spectroscopy,”
Sci. Rep., 6 30157
(2016). http://dx.doi.org/10.1038/srep30157 SRCEC3 2045-2322 Google Scholar
F. Tian et al.,
“Prefrontal responses to digit span memory phases in patients with post-traumatic stress disorder (PTSD): a functional near infrared spectroscopy study,”
Neuroimage Clin., 4 808
–819
(2014). http://dx.doi.org/10.1016/j.nicl.2014.05.005 Google Scholar
J. D. Schaeffer et al.,
“An fNIRS investigation of associative recognition in the prefrontal cortex with a rapid event-related design,”
J. Neurosci. Methods, 235 308
–315
(2014). http://dx.doi.org/10.1016/j.jneumeth.2014.07.011 JNMEDT 0165-0270 Google Scholar
X. Wang et al.,
“Interplay between up-regulation of cytochrome-c-oxidase and hemoglobin oxygenation induced by near-infrared laser,”
Sci. Rep., 6 30540
(2016). http://dx.doi.org/10.1038/srep30540 SRCEC3 2045-2322 Google Scholar
F. Tian et al.,
“Quantification of functional near infrared spectroscopy to assess cortical reorganization in children with cerebral palsy,”
Opt. Express, 18 25973
–25986
(2010). http://dx.doi.org/10.1364/OE.18.025973 OPEXFF 1094-4087 Google Scholar
F. Tian et al.,
“Enhanced functional brain imaging by using adaptive filtering and a depth compensation algorithm in diffuse optical tomography,”
IEEE Trans. Med. Imaging, 30 1239
–1251
(2011). http://dx.doi.org/10.1109/TMI.2011.2111459 ITMID4 0278-0062 Google Scholar
K. Murphy et al.,
“The impact of global signal regression on resting state correlations: are anti-correlated networks introduced?,”
Neuroimage, 44 893
–905
(2009). http://dx.doi.org/10.1016/j.neuroimage.2008.09.036 NEIMEF 1053-8119 Google Scholar
R. C. Mesquita, M. A. Franceschini and D. A. Boas,
“Resting state functional connectivity of the whole head with near-infrared spectroscopy,”
Biomed. Opt. Express, 1 324
–336
(2010). http://dx.doi.org/10.1364/BOE.1.000324 BOEICL 2156-7085 Google Scholar
BiographyAmarnath Yennu received his Bachelor of Engineering degree in biomedical engineering from Jawahar Lal Nehru Technological University, India, in May 2008, and his MS and PhD degrees in biomedical engineering from the joint program between the University of Texas at Arlington and University of Texas Southwestern Medical Center at Dallas, Texas, USA. His research expertise is in functional near-infrared spectroscopy, medical image processing, and signal processing, for applications in medical diagnostics and therapy. Fenghua Tian received his BS and PhD degrees in biomedical engineering from Tsinghua University, Beijing, China. Currently, he is a research assistant professor in the Department of Bioengineering at UT Arlington. His research interests focus on optical neuroimaging, cerebrovascular and cardiovascular functions, and bedside neuroprotection. The technologies used in his research include near-infrared spectroscopy, diffuse optical tomography, diffuse correlation spectroscopy, and transcranial Doppler. He is a senior member of SPIE. Robert J. Gatchel received his MS and PhD degrees in clinical psychology from the University of Wisconsin, Madison. He currently is the Nancy P. & John G. Penson Endowed Professor of clinical health psychology and is an expert in etiology, assessment, and treatment of chronic pain behavior, as well as in the area of comorbidity of physical and mental health conditions. He has published more than 400 scientific papers, and has received numerous awards. Hanli Liu received her MS and PhD degrees in physics from Wake Forest University, followed by postdoctoral training at the University of Pennsylvania in tissue optics. She is a full professor of bioengineering at the University of Texas at Arlington. Her current expertise lies in the field of near-infrared spectroscopy of tissues, optical sensing for cancer detection, and diffuse optical tomography for functional brain imaging, all of which are related to clinical applications. |