
|
|
1.IntroductionInteractions between sensory and frontal cortices are likely important for sensory perception and motor control.1–5 Sensory information is often actively acquired through self-generated movements of sensors to specific locations to gather selected sensory input. For example, we make eye and head movements to foveate regions of interest in the world around us, and we reach out to touch objects to feel their shape and texture. Conversely, sensory information is typically used to inform motor control allowing precise movements guided by sensory feedback. The mouse whisker and visual systems appear useful for the detailed study of sensorimotor interactions underlying active sensing.6–10 Although functional maps in sensory cortices are increasingly becoming understood, much less is known about the organization of mouse frontal cortex.2,11–13 Previous studies of the mouse whisker system have found functionally important projections from primary whisker somatosensory barrel cortex (wS1) to a frontal region, termed the primary whisker motor cortex (wM1).1,10,14–18 Here, we investigate the functional and anatomical organization of signaling from visual cortex to frontal cortex in comparison to the whisker system through voltage-sensitive dye imaging19 and anatomical labeling of axonal projections. 2.Materials and MethodsAll experiments were carried out in accordance with protocols approved by the Swiss Federal Veterinary Office. 2.1.Voltage-Sensitive Dye ImagingC57BL6J mice aged from 6 to 9 weeks were implanted with a metallic head-holder under deep isoflurane anesthesia. Two days after implantation, mice were gradually habituated to head-restraint over three daily sessions. The bone overlying the dorsal sensorimotor cortex was removed, and extreme care was taken not to damage the cortex. The voltage-sensitive dye RH1691 (Optical Imaging)20 was then topically applied to the brain at in Ringer’s solution having first removed1 or dried21 the dura for 1 to 2 h. The craniotomy was covered with 1% agarose and a coverslip was placed on top. Voltage-sensitive dye imaging was carried out using a custom made macroscope, which provided 630 nm excitation light from a 100-W halogen lamp, gated by a shutter (Vincent Associates) under computer control via an ITC18, communicating with custom software running within IgorPro (Wavemetrics). The excitation light was reflected via a 650-nm dichroic mirror and focused on the cortical surface with a 50-mm camera lens (Nikon). Emitted fluorescence was collected via the same path but without the reflection of the dichroic, long-pass filtered (), and focused on the sensor of a high-speed Micam Ultima CMOS camera (Scimedia) via a second 50-mm camera lens (Nikon). Images were collected with a temporal resolution of 2 ms, and was analyzed offline using custom-written routines in IgorPro. Bleaching of fluorescence was corrected by subtraction of averaged sweeps recorded without whisker or visual stimuli. Iron particles were attached to the C2 whisker and whisker deflections were driven by single 1-ms magnetic pulses generated by an electromagnetic coil placed below the mouse.22 Visual-evoked responses were driven by a single brief flash of a green light emitting diode (LED) placed in the binocular (in front of the animal) or in the monocular (90 deg from the binocular position, perpendicular to the antero-lateral body axis of the mouse) field of view at eye level at 5 to 10 cm distance from the mouse. The duration of the LED flash was 50 or 100 ms, varying across different experiments. Amplitudes of were calculated on averaged trials. Contours were calculated on Gaussian-filtered images of the earliest S1, V1, and frontal cortex voltage-sensitive dye signals, from which we obtained the center of mass of the early spots. 2.2.Viral Tracing of Long-Range ProjectionsWe injected adeno-associated viruses encoding enhanced green fluorescent protein (EGFP) and Turbo red fluorescent protein (TurboRFP) under control of the synapsin promoter (AAV2/1.hSynapsin.EGFP.WPRE.bGH and AAV2/1.hSynapsin.TurboRFP.RBG made by the Penn Vector Core) to label axons from two different cortical locations with green and red fluorescence. The location of each injection in the C2 whisker representation in S1 and the right monocular V1 was targeted through intrinsic signal optical imaging.23–25 The position of wM1 was taken as 1-mm anterior and 1-mm lateral to Bregma. The position of Cg-M2 was taken as the midline cortex at 0-mm anterior to Bregma. Two injections were made at each location, targeted to both superficial and deep layers. The injection volume at each depth was 50, 100, or 200 nl in different experiments. After 4 weeks of expression, the brains were fixed with 4% paraformaldehyde and were first imaged for EGFP and TurboRFP fluorescence under a stereomicroscope. They were then cut into thick coronal sections and immunostained with primary antibodies against green fluorescent protein (GFP) (1:5000; rabbit; Abcam) and RFP (1:1000; rat; Chromotek) followed by secondary antibody solution containing goat-anti-rabbit IgG conjugated to Alexa 488 (1:200, Invitrogen) and donkey-anti-rat IgG conjugated to Alexa 594 (1:100, Invitrogen). 2.3.Statistical AnalysisAll data are presented as . Normality of data distributions were assessed using the Anderson–Darling normality test. Statistical significance was assessed with Student’s -test for paired or unpaired observations of normally distributed data. For nonnormally distributed data, we used Wilcoxon’s signed rank and rank sum for paired and unpaired comparisons, respectively. 3.Results3.1.Voltage-Sensitive Dye Imaging of Mouse Sensorimotor CortexWe first mapped the dynamic spatiotemporal sensory responses across the dorsal cortex of awake head-restrained mice using voltage-sensitive dye imaging, which provides millisecond temporal resolution and spatial resolution.19 Tactile stimuli consisted of single 1-ms whisker deflections of the C2 whisker [Fig. 1(a) and Movie 1]. Visual stimuli consisted of brief (50 or 100 ms) light flashes of a green LED placed either at 90 deg on the right of the mouse to deliver a monocular stimulus [Fig. 1(b) and Movie 2] or at 0 deg in front of the mouse to deliver a binocular stimulus [Fig. 1(c) and Movie 3]. The earliest evoked activities mapped to well-defined points across the sensory cortex. Whisker deflection evoked localized activity first in contralateral wS1 (latency , peak amplitude , mice), with a subsequent lateral spread over the next milliseconds [Fig. 1(a)].1,15,17,25–29 Light flashes evoked activity first in the primary visual cortex (V1) with the expected retinotopy30 for monocular stimuli (latency , peak amplitude , mice) and binocular stimuli (latency , peak amplitude , mice). The initially localized visually evoked depolarization in V1 subsequently spread to invade the surrounding secondary visual cortices [Figs. 1(b) and 1(c)].31–36 Fig. 1Voltage-sensitive dye imaging of visual- and whisker-evoked sensory responses in awake head-restrained mice. (a) VSD imaging of the cortical response to a single 1-ms deflection of the right C2 whisker. The time-courses of fluorescence changes in color-coded selected regions of interest are shown on the right. Movie 1 shows the frame-by-frame dynamics, with the upper right number showing the frame counter with each frame being 2 ms in duration, and stimulus onset occurring in frame 971. (b) Same experiment showing response to a 50-ms monocular visual stimulus delivered at 90 deg to the right. Movie 2 shows the frame-by-frame dynamics, with the upper right number showing the frame counter with each frame being 2 ms in duration, and stimulus onset occurring in frame 971. (c) Same experiment, for a 50-ms binocular stimulus presented to the frontal visual field. Movie 3 shows the frame-by-frame dynamics, with the upper right number showing the frame counter with each frame being 2 ms in duration, and stimulus onset occurring in frame 971. (d) Contour analysis from the same experiment showing the early (above) and late (below) somatosensory and visual evoked responses. (e) Superposition of the localized contour plots of early activity in S1, monocular V1, wM1, and Cg-M2 across all mice, spatially aligned on the early response evoked by C2 whisker deflection. (f) Center of mass analysis of the early response contours across all mice. Gray lines link individual experiments for within mouse comparisons. Black data points with error bars show . (g) Center of mass analysis including binocular visual responses. (h) Schematic representation of signaling from sensory to frontal cortex. Movie 1 (Quicktime mov file, 1.1 MB) [URL: http://dx.doi.org/10.1117/1.NPH.4.3.031203.1], Movie 2 (Quicktime mov file, 1.5 MB) [URL: http://dx.doi.org/10.1117/1.NPH.4.3.031203.2], and Movie 3 (Quicktime mov file, 1.3 MB) [URL: http://dx.doi.org/10.1117/1.NPH.4.3.031203.3]. 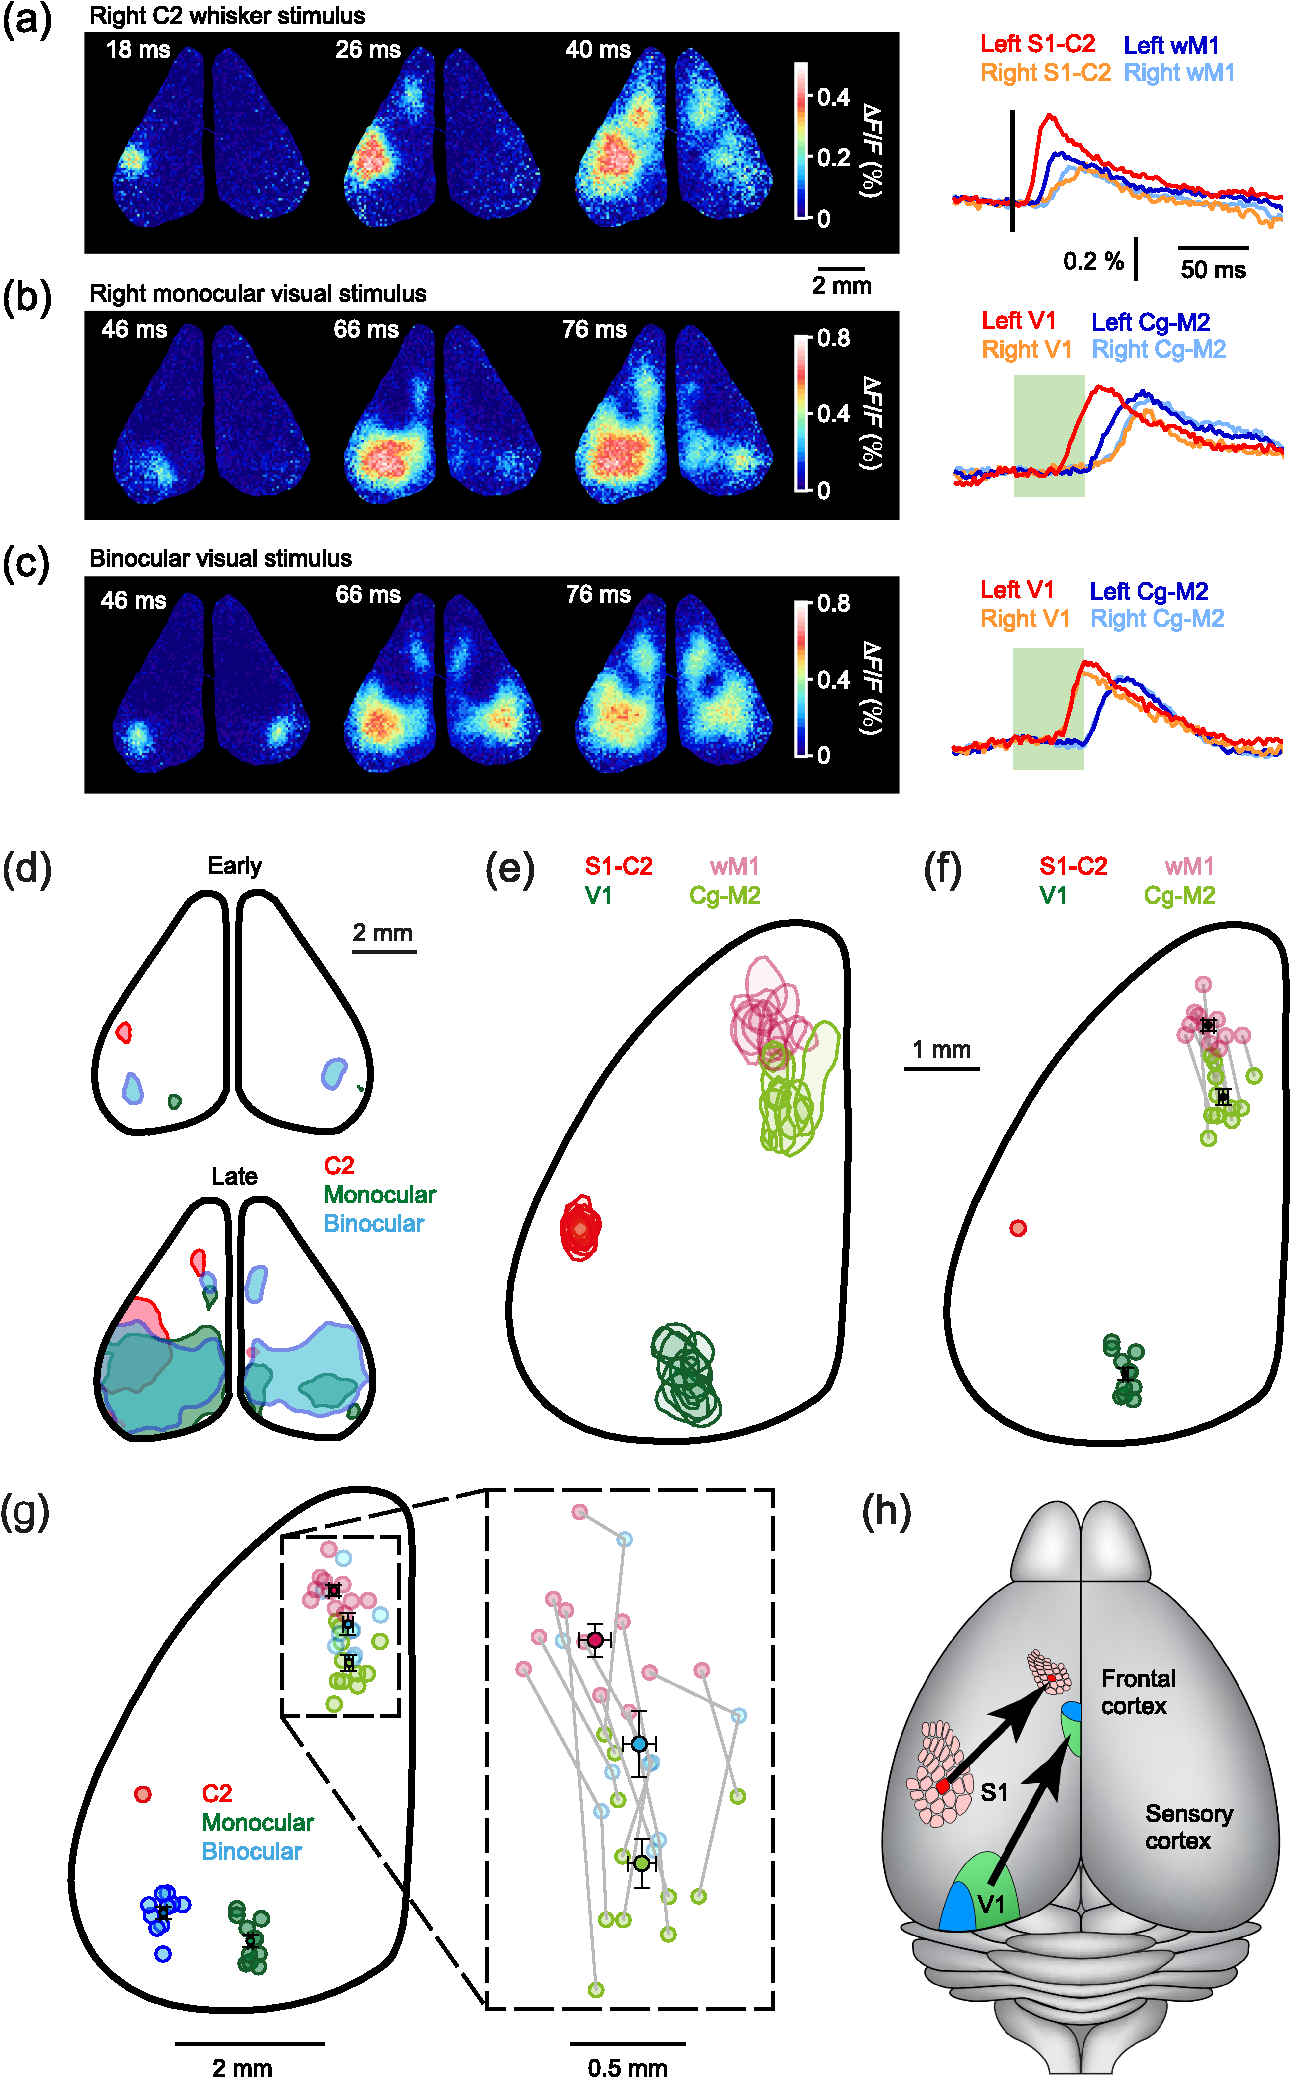 Shortly after the initial whisker-deflection-evoked activity in wS1, we observed a second localized hot-spot of frontal activity in wM1, with a latency of relative to the whisker stimulus and a peak response amplitude of ( mice) [Fig. 1(a)].1,15,17 Interestingly, a strikingly similar pattern of frontal activity was evoked by visual stimulation. Within tens of milliseconds after the first activity evoked in V1, a second localized hot-spot was seen in the frontal cortex (monocular stimulus: latency , peak amplitude , mice; binocular stimulus: latency , peak amplitude , mice) [Figs. 1(b) and 1(c)].17 The frontal visual region was significantly more posterior than wM1 (monocular stimulus: posterior of wM1, , Student’s paired -test, mice; binocular stimulus: posterior of wM1, , Student’s paired -test, mice) and significantly more medial than wM1 (monocular stimulus: medial to wM1, , Wilcoxon’s signed rank, mice; binocular stimulus: medial to wM1, , Student’s paired -test, mice) [Figs. 1(d)–1(f)]. The monocular frontal visual region was significantly posterior to the binocular frontal visual region (, Student’s paired -test, mice) [Figs. 1(g) and 1(h)]. This frontal visual area is commonly labeled as the cingulate cortex or secondary motor cortex (Cg-M2).37 Overall, our voltage-sensitive dye (VSD) imaging results are in excellent agreement with previous pioneering work showing extensive spread of sensory signals across the dorsal surface of the rodent neocortex.17,26,27 3.2.Anatomical Pathways for Signaling from Sensory to Frontal CortexThe most direct signaling route from sensory cortex to frontal cortex would be via monosynaptic long-range axonal projections. To visualize axonal output of the primary sensory cortical areas, we injected adeno-associated viral (AAV) vectors coding for EGFP and TurboRFP into S1 and V1 finding consistent results across four mice. Wide-field fluorescence imaging of fixed brains revealed two segregated hot-spots of axons in the frontal cortex [Fig. 2(a)]. The frontal innervation from V1 was located postero-medial with respect to the wS1 projection to wM1. Fig. 2Parallel axonal projections from S1 and V1 to frontal cortex. (a) Widefield epifluorescence image of a fixed brain expressing GFP in V1 and RFP in S1. Blue dotted frame indicates the area in frontal cortex shown enlarged on the right, in which the axonal innervations of frontal cortex by S1 and V1 are revealed (yellow dotted line indicates the midline). (b) Coronal section through V1 showing the injection site in green (left). GFP labeled cells in V1 (right). (c) Coronal section through S1 showing the injection site in red (left). RFP labeled cells in S1 (right). (d) Coronal section through a region of the frontal cortex showing dense innervation of Cg-M2 by V1 axons, while the S1 axons are still travelling (left). Higher magnification image of the V1 axons in Cg-M2 (right). (e) Coronal section through a region of the frontal cortex showing dense innervation of wM1 by S1 axons, while the innervation from V1 is relatively weak at this anterior level (left). Higher magnification image of the S1 axons in wM1 (right). Schematic drawings (middle) in panels (b)–(e) are modified from Paxinos and Franklin (2001). 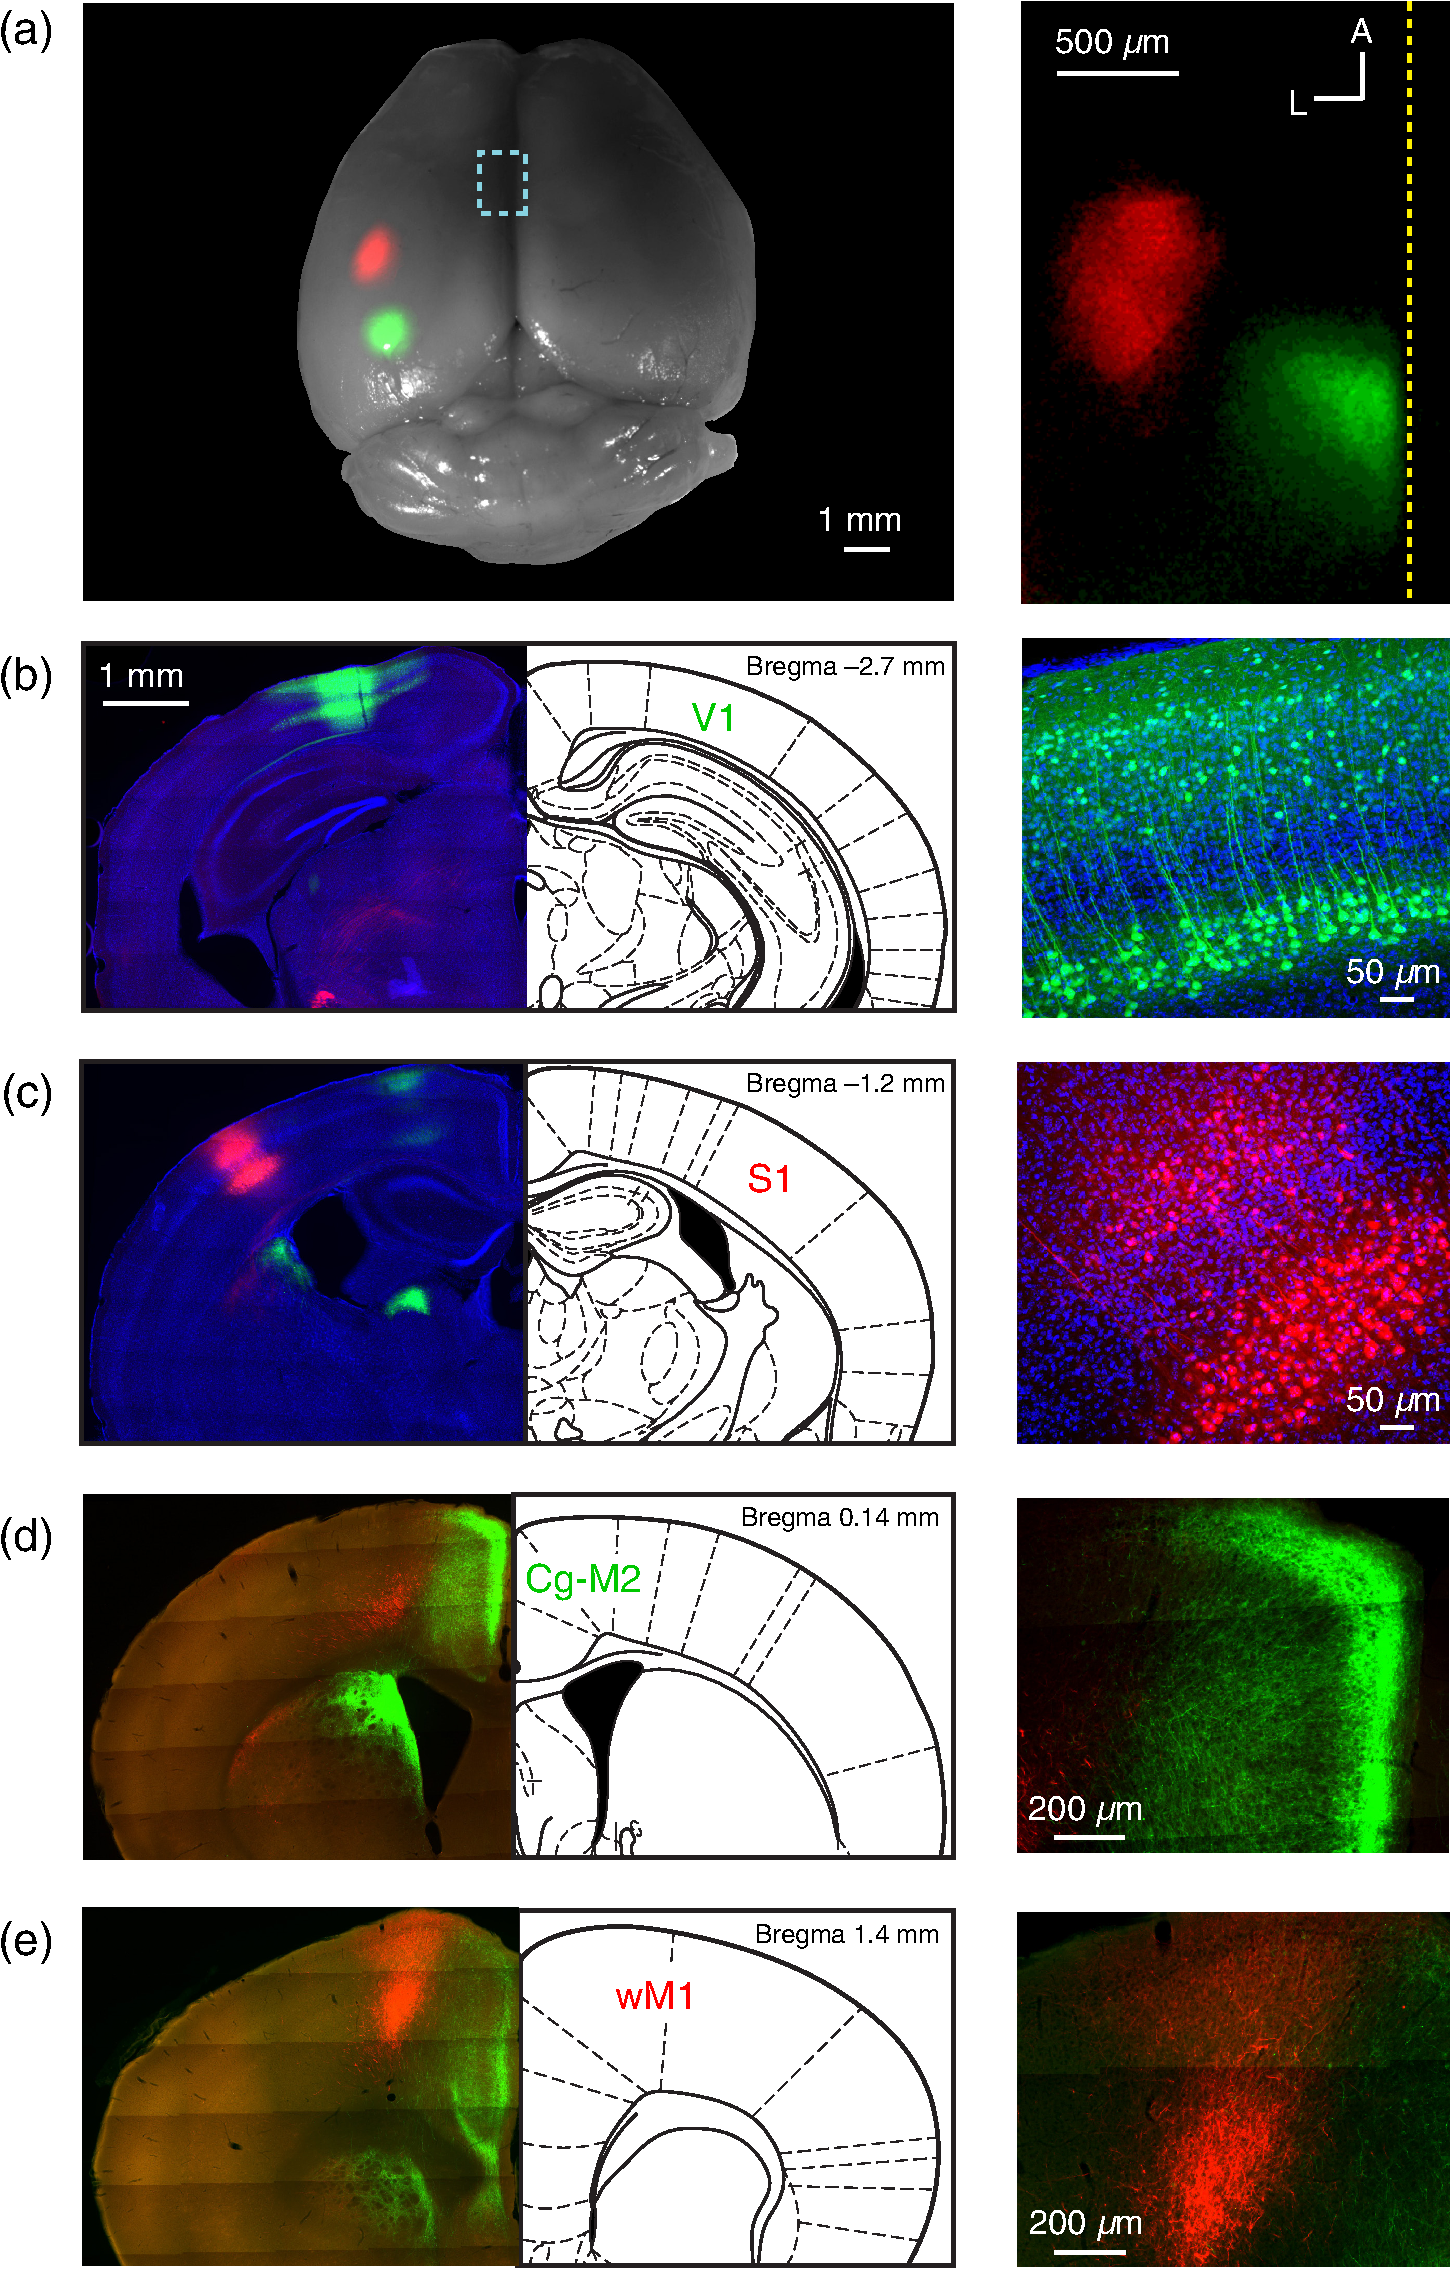 Coronal sections showed that cell bodies of fluorescent neurons were localized to the respective injection sites in V1 [Fig. 2(b)] and S1 [Fig. 2(c)]. In coronal sections of the frontal cortex, the V1 axons densely innervated both the superficial and deeper layers of the midline cortical area Cg-M2 around the anterior–posterior level of Bregma [Fig. 2(d)].38 At this anterior–posterior level around Bregma, the S1 axons were travelling or just starting to ascend. Frontally projecting S1 axons innervated wM1, located anterior and lateral to Bregma [Fig. 2(e)].1,15,16,18 At this level ( anterior to Bregma), V1 innervation was much weaker. These anatomical projections from sensory to frontal cortex (Fig. 2) might contribute to evoking the sensory response in frontal cortex visualized with voltage-sensitive dye imaging (Fig. 1). 3.3.Projections from Frontal Cortex to Sensory Cortex, Striatum, Superior Colliculus, and BrainstemWe next investigated the axonal projections from the frontal cortical areas wM1 and Cg-M2 through injecting AAV into these regions. In neocortex, we found prominent reciprocal innervation of the respective ipsilateral sensory cortex, such that wM1 innervated wS1 (and surrounding somatosensory cortex) and Cg-M2 innervated V1 (and surrounding secondary visual cortex along with prominent innervation of retrosplenial cortex) [Fig. 3(a)]. Fig. 3Axonal projections from Cg-M2 and wM1 to sensory cortex, striatum, superior colliculus, and brainstem. (a) Corticocortical axons from wM1 (red) prominently innervate layers 1, 5, and 6 of S1 barrel cortex, as well as surrounding somatosensory cortex. Cg-M2 axons (green) innervate layers 1, 5, and 6 of primary visual cortex (V1), secondary visual cortices (V2), and retrosplenial cortex (RS). (b) Corticostriatal projections from wM1 (red) innervate a more lateral region compared to Cg-M2 axons (green) in the dorsal striatum (Str). (c) Projections from Cg-M2 (green) and wM1 (red) innervate the ventral region of the superior colliculus (SC). (d) Coronal sections of the brainstem showing wM1 projections (red) in the facial nucleus (FN) and brainstem reticular (Rt) nuclei: gigantocellular reticular formation (GiRt), intermediate reticular formation (IRt), and parvocellular reticular formation (PCRt). Cg-M2 axons (green) innervate the central gray (CG) and vestibular nuclei (Ves). Corresponding schematic drawings are modified from Paxinos and Franklin (2001). 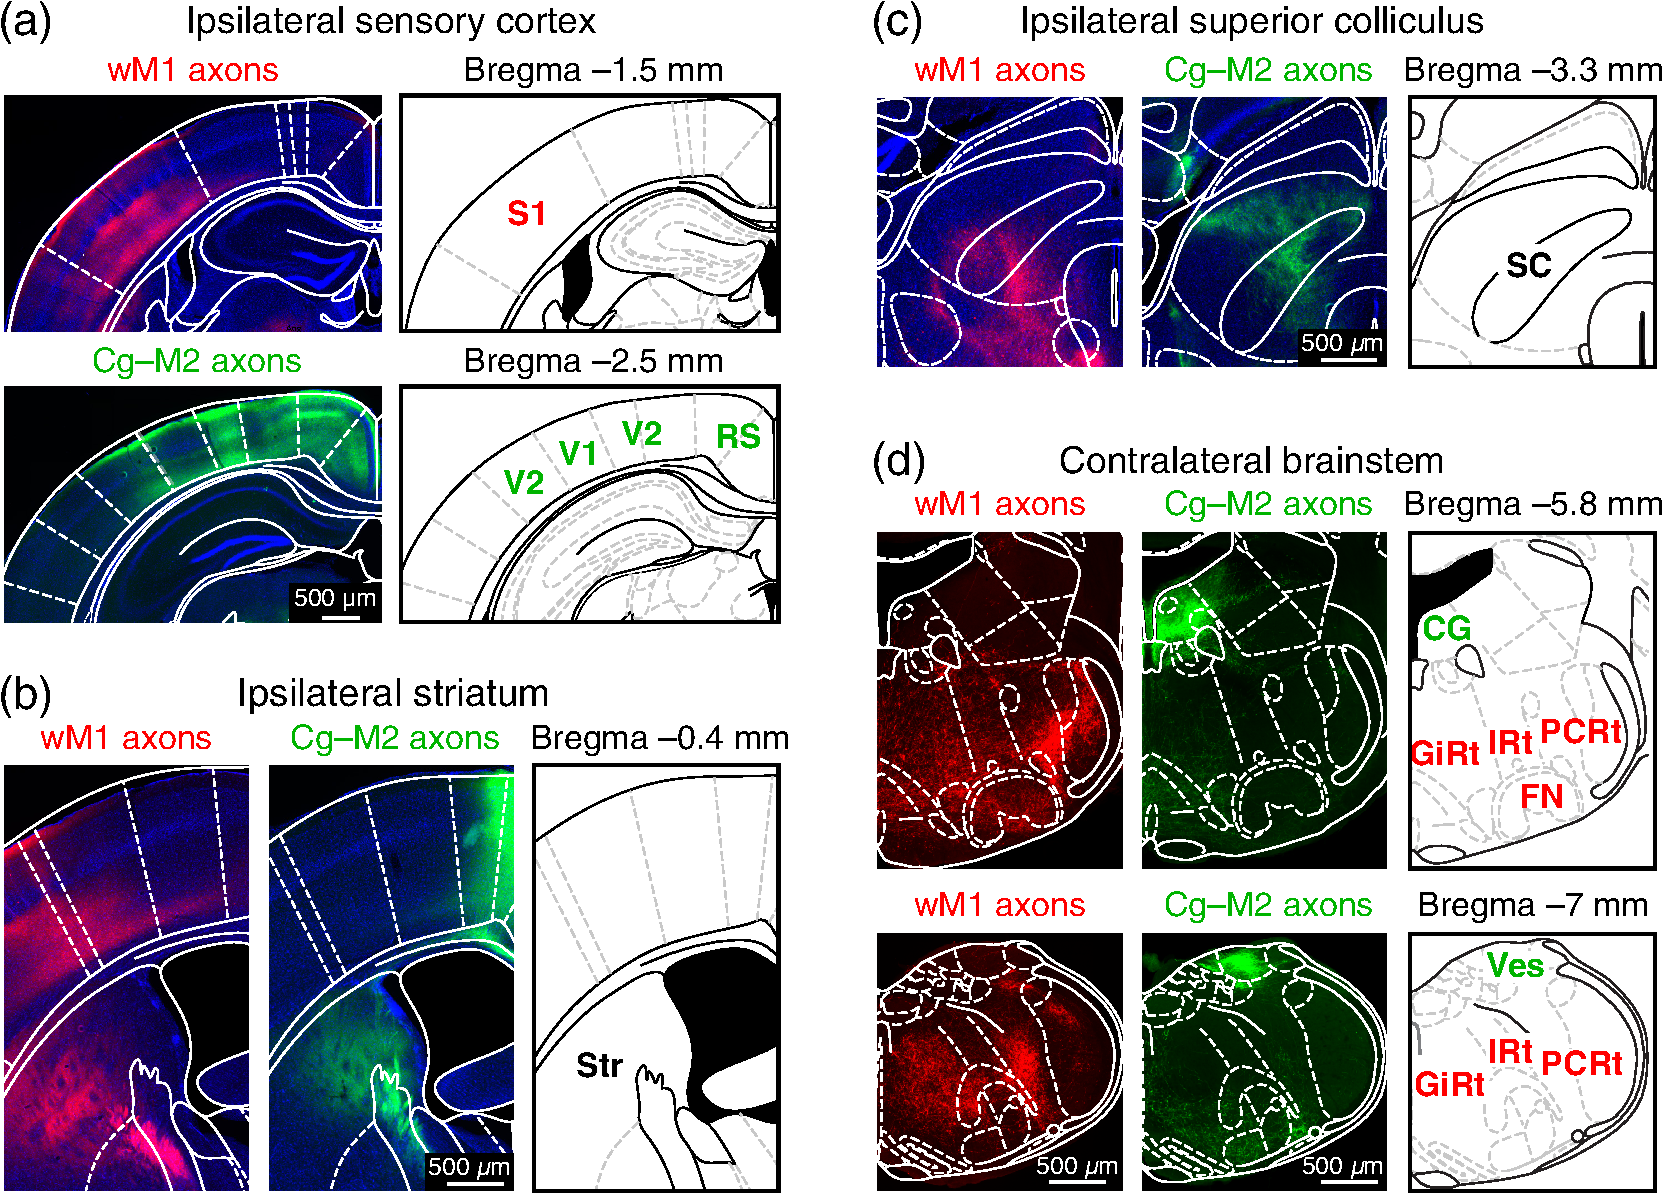 Cortical neurons evoke movements by communicating with subcortical brain areas. Across three mice, we consistently found that both wM1 and Cg-M2 innervate nearby regions of dorsal striatum [Fig. 3(b)], superior colliculus [Fig. 3(c)], and brainstem [Fig. 3(d)], all of which have been implicated in different aspects of motor control. wM1 innervates a more lateral portion of the ipsilateral dorsal striatum compared to the region innervated by Cg-M2 [Fig. 3(b)]. Both Cg-M2 and wM1 innervate the ventral region of the superior colliculus [Fig. 3(c)]. In the brainstem, we found that wM1 projects to regions closely associated with whisker movement including facial nucleus39,40 and a strong innervation of brainstem reticular formation15,40–42 [Fig. 3(d)]. In contrast, Cg-M2 axons only weakly innervated these areas but strongly innervated the central gray43 and brainstem vestibular nuclei [Fig. 3(d)]. 4.Discussion4.1.Sensory Maps in Frontal CortexThrough voltage-sensitive dye imaging in awake mice (Fig. 1) and through anatomical labeling of long-range axonal projections (Fig. 2), we find that S1 and V1 appear to signal to distinct neighboring regions of frontal cortex. The spatial organization of the direct excitatory glutamatergic axonal projections from sensory cortex to frontal cortex is consistent with the locations of the secondary sensory responses in the frontal cortex. Direct signaling from sensory cortex to frontal cortex might thus contribute to driving the responses observed by voltage-sensitive dye in frontal cortex upon sensory stimulation, but it is important to note that there are many alternative, more complex polysynaptic pathways that could also contribute. Previous investigations revealed an orderly sensory map of the representations of different whiskers in wM1,1 and also an anatomical somatotopic map of wS1 projections innervating wM1.16 The sensory whisker map in wM1 is compressed and mirror-reflected relative to the S1 somatotopic map.1 Here, our VSD data (Fig. 1) suggest that the frontal visual area in Cg-M2 may also have some aspects of a retinotopic map, with monocular responses being posterior relative to binocular responses (Figs. 1(g) and 1(h)]. Future studies should investigate such a possible retinotopic map (or other organizing principles) in Cg-M2 in detail. 4.2.Functional Roles of Frontal CortexWhisker-related sensory signals from wS1 to wM1 might contribute to controlling whisker movement. Stimulation of wM1 evokes short-latency rhythmic whisker protraction.15,40 wM1 directly innervates facial nucleus39,40 and prominently innervates brainstem reticular regions, which contain premotor neurons related to whisker movements.40–42 These pathways, and others including those via superior colliculus and striatum (Fig. 3), might contribute to translating action potential firing in wM1 into rhythmic whisker protraction. One role of the whisker sensory input to wM1 may, therefore, be to initiate or change whisker movements to optimize acquisition of sensory information. However, it is also interesting to note that the region anterior and 1 mm lateral to Bregma in the mouse (which we here label as wM1) and its likely equivalent area in the rat have been proposed to be involved in many diverse brain functions. Indeed, this area has been suggested to be analogous to the frontal eye field (FEF) of primates, and might thus be part of a rodent frontal orienting field (FOF).13,44–46 By analogy to the whisker sensorimotor signaling pathway, we speculate that the visual sensory responses in Cg-M2 might also participate in sensory-guided motor control. Cg-M2 densely innervates the central gray and vestibular nuclei (Fig. 3), both of which have been implicated in eye motor control.47–50 The innervation of striatum and superior colliculus by Cg-M2 may also play important roles in motor control. Visual sensory information arriving in Cg-M2 could, therefore, contribute to driving saccadic eye movements and opening of eye-lids in a stimulus-dependent manner. Future experiments must therefore investigate what types of movement are elicited by stimulation of Cg-M2, and what the distinct output pathways might contribute. It is also important to note that both wM1 and Cg-M2 strongly innervate, respectively, wS115,16,51,52 and V1,53 presumably providing an important feedback signal and perhaps also providing top-down control of sensory processing3–5 (Fig. 3). Through reciprocal excitatory synaptic interactions with the respective primary sensory area, frontal areas could thus be involved in selective amplification of specific sensory signals, which could relate to their proposed role in the control of attention.3,4,44 5.ConclusionHere, we find evidence for apparently parallel signaling pathways from wS1 and V1 to wM1 and Cg-M2, respectively. Our data suggest that sensory cortex maps in a modality specific manner onto frontal cortex, which might allow appropriate sensorimotor integration. However, much further research is necessary to understand the functional organization of frontal cortex. In future experiments, it will clearly be important to make fine-scale motor maps of frontal cortex, quantifying evoked movements of whisker, eye, and other body parts, in the context of the sensory maps of the frontal cortex. Inactivation of downstream regions will be of critical importance for causal analysis of different motor signaling pathways. It will also be interesting to study changes in motor maps in different contexts, e.g., during task learning, and in freely moving mice. AcknowledgmentsThis work was funded by grants from the European Molecular Biology Organisation (A.K.), Human Frontier Science Program Long-Term Fellowship (A.K.), Human Frontier Science Program Grant (C.C.H.P.), Swiss National Science Foundation (C.C.H.P.), SystemsX.ch (C.C.H.P.) and European Research Council (C.C.H.P.). We are grateful to Emory College of Arts and Sciences for supporting the sabbatical visit of Dieter Jaeger. ReferencesI. Ferezou et al.,
“Spatiotemporal dynamics of cortical sensorimotor integration in behaving mice,”
Neuron, 56 907
–923
(2007). http://dx.doi.org/10.1016/j.neuron.2007.10.007 NERNET 0896-6273 Google Scholar
Z. V. Guo et al.,
“Flow of cortical activity underlying a tactile decision in mice,”
Neuron, 81 179
–194
(2014). http://dx.doi.org/10.1016/j.neuron.2013.10.020 NERNET 0896-6273 Google Scholar
D. M. Schneider, A. Nelson and R. Mooney,
“A synaptic and circuit basis for corollary discharge in the auditory cortex,”
Nature, 513 189
–194
(2014). http://dx.doi.org/10.1038/nature13724 Google Scholar
S. Zhang et al.,
“Selective attention. Long-range and local circuits for top-down modulation of visual cortex processing,”
Science, 345 660
–665
(2014). http://dx.doi.org/10.1126/science.1254126 SCIEAS 0036-8075 Google Scholar
S. Manita et al.,
“A top-down cortical circuit for accurate sensory perception,”
Neuron, 86 1304
–1316
(2015). http://dx.doi.org/10.1016/j.neuron.2015.05.006 Google Scholar
S. Crochet and C. C. H. Petersen,
“Correlating whisker behavior with membrane potential in barrel cortex of awake mice,”
Nat. Neurosci., 9 608
–610
(2006). http://dx.doi.org/10.1038/nn1690 NANEFN 1097-6256 Google Scholar
C. M. Niell and M. P. Stryker,
“Modulation of visual responses by behavioral state in mouse visual cortex,”
Neuron, 65 472
–479
(2010). http://dx.doi.org/10.1016/j.neuron.2010.01.033 NERNET 0896-6273 Google Scholar
D. Kleinfeld and M. Deschênes,
“Neuronal basis for object location in the vibrissa scanning sensorimotor system,”
Neuron, 72 455
–468
(2011). http://dx.doi.org/10.1016/j.neuron.2011.10.009 NERNET 0896-6273 Google Scholar
G. B. Keller, T. Bonhoeffer and M. Hübener,
“Sensorimotor mismatch signals in primary visual cortex of the behaving mouse,”
Neuron, 74 809
–815
(2012). http://dx.doi.org/10.1016/j.neuron.2012.03.040 NERNET 0896-6273 Google Scholar
C. C. H. Petersen,
“Cortical control of whisker movement,”
Annu. Rev. Neurosci., 37 183
–203
(2014). http://dx.doi.org/10.1146/annurev-neuro-062012-170344 ARNSD5 0147-006X Google Scholar
R. D. Hall and E. P. Lindholm,
“Organization of motor and somatosensory neocortex in the albino rat,”
Brain Res., 66 23
–38
(1974). http://dx.doi.org/10.1016/0006-8993(74)90076-6 Google Scholar
M. Brecht et al.,
“Organization of rat vibrissa motor cortex and adjacent areas according to cytoarchitectonics, microstimulation, and intracellular stimulation of identified cells,”
J. Comp. Neurol., 479 360
–373
(2004). http://dx.doi.org/10.1002/(ISSN)1096-9861 JCNEAM 0021-9967 Google Scholar
J. C. Erlich, M. Bialek and C. D. Brody,
“A cortical substrate for memory-guided orienting in the rat,”
Neuron, 72 330
–343
(2011). http://dx.doi.org/10.1016/j.neuron.2011.07.010 NERNET 0896-6273 Google Scholar
E. Welker, P. V. Hoogland and H. Van der Loos,
“Organization of feedback and feedforward projections of the barrel cortex: a PHA-L study in the mouse,”
Exp. Brain Res., 73 411
–435
(1988). Google Scholar
F. Matyas et al.,
“Motor control by sensory cortex,”
Science, 330 1240
–1243
(2010). http://dx.doi.org/10.1126/science.1195797 SCIEAS 0036-8075 Google Scholar
T. Mao et al.,
“Long-range neuronal circuits underlying the interaction between sensory and motor cortex,”
Neuron, 72 111
–123
(2011). http://dx.doi.org/10.1016/j.neuron.2011.07.029 NERNET 0896-6273 Google Scholar
M. H. Mohajerani et al.,
“Spontaneous cortical activity alternates between motifs defined by regional axonal projections,”
Nat. Neurosci., 16 1426
–1435
(2013). http://dx.doi.org/10.1038/nn.3499 NANEFN 1097-6256 Google Scholar
T. Yamashita et al.,
“Membrane potential dynamics of neocortical projection neurons driving target-specific signals,”
Neuron, 80 1477
–1490
(2013). http://dx.doi.org/10.1016/j.neuron.2013.10.059 NERNET 0896-6273 Google Scholar
A. Grinvald and R. Hildesheim,
“VSDI: a new era in functional imaging of cortical dynamics,”
Nat. Rev. Neurosci., 5 874
–885
(2004). http://dx.doi.org/10.1038/nrn1536 NRNAAN 1471-003X Google Scholar
D. Shoham et al.,
“Imaging cortical dynamics at high spatial and temporal resolution with novel blue voltage-sensitive dyes,”
Neuron, 24 791
–802
(1999). http://dx.doi.org/10.1016/S0896-6273(00)81027-2 NERNET 0896-6273 Google Scholar
M. T. Lippert et al.,
“Methods for voltage sensitive dye imaging of rat cortical activity with high signal to noise ratio,”
J. Neurophysiol., 98 502
–512
(2007). http://dx.doi.org/10.1152/jn.01169.2006 JONEA4 0022-3077 Google Scholar
S. Sachidhanandam et al.,
“Membrane potential correlates of sensory perception in mouse barrel cortex,”
Nat. Neurosci., 16 1672
–1677
(2013). http://dx.doi.org/10.1038/nn.3532 NANEFN 1097-6256 Google Scholar
A. Grinvald et al.,
“Functional architecture of cortex revealed by optical imaging of intrinsic signals,”
Nature, 324 361
–364
(1986). http://dx.doi.org/10.1038/324361a0 Google Scholar
S. A. Masino et al.,
“Characterization of functional organization within rat barrel cortex using intrinsic signal optical imaging through a thinned skull,”
Proc. Natl. Acad. Sci. U. S. A., 90 9998
–10002
(1993). http://dx.doi.org/10.1073/pnas.90.21.9998 Google Scholar
I. Ferezou, S. Bolea and C. C. H. Petersen,
“Visualizing the cortical representation of whisker touch: voltage-sensitive dye imaging in freely moving mice,”
Neuron, 50 617
–629
(2006). http://dx.doi.org/10.1016/j.neuron.2006.03.043 NERNET 0896-6273 Google Scholar
H. S. Orbach, L. B. Cohen and A. Grinvald,
“Optical mapping of electrical activity in rat somatosensory and visual cortex,”
J. Neurosci., 5 1886
–1895
(1985). JNRSDS 0270-6474 Google Scholar
D. Kleinfeld and K. R. Delaney,
“Distributed representation of vibrissa movement in the upper layers of somatosensory cortex revealed with voltage-sensitive dyes,”
J. Comp. Neurol., 375 89
–108
(1996). http://dx.doi.org/10.1002/(ISSN)1096-9861 JCNEAM 0021-9967 Google Scholar
D. Derdikman et al.,
“Imaging spatiotemporal dynamics of surround inhibition in the barrels somatosensory cortex,”
J. Neurosci., 23 3100
–3105
(2003). JNRSDS 0270-6474 Google Scholar
C. C. H. Petersen, A. Grinvald and B. Sakmann,
“Spatiotemporal dynamics of sensory responses in layer 2/3 of rat barrel cortex measured in vivo by voltage-sensitive dye imaging combined with whole-cell voltage recordings and anatomical reconstructions,”
J. Neurosci., 23 1298
–1309
(2003). JNRSDS 0270-6474 Google Scholar
S. Schuett, T. Bonhoeffer and M. Hübener,
“Mapping retinotopic structure in mouse visual cortex with optical imaging,”
J. Neurosci., 22 6549
–6559
(2002). JNRSDS 0270-6474 Google Scholar
Q. Wang and A. Burkhalter,
“Area map of mouse visual cortex,”
J. Comp. Neurol., 502 339
–357
(2007). http://dx.doi.org/10.1002/(ISSN)1096-9861 JCNEAM 0021-9967 Google Scholar
J. H. Marshel et al.,
“Functional specialization of seven mouse visual cortical areas,”
Neuron, 72 1040
–1054
(2011). http://dx.doi.org/10.1016/j.neuron.2011.12.004 NERNET 0896-6273 Google Scholar
P. O. Polack and D. Contreras,
“Long-range parallel processing and local recurrent activity in the visual cortex of the mouse,”
J. Neurosci., 32 11120
–11131
(2012). http://dx.doi.org/10.1523/JNEUROSCI.6304-11.2012 JNRSDS 0270-6474 Google Scholar
T. K. Sato, I. Nauhaus and M. Carandini,
“Traveling waves in visual cortex,”
Neuron, 75 218
–229
(2012). http://dx.doi.org/10.1016/j.neuron.2012.06.029 NERNET 0896-6273 Google Scholar
L. L. Glickfeld et al.,
“Cortico-cortical projections in mouse visual cortex are functionally target specific,”
Nat. Neurosci., 16 219
–226
(2013). http://dx.doi.org/10.1038/nn.3300 NANEFN 1097-6256 Google Scholar
A. Stroh et al.,
“Making waves: initiation and propagation of corticothalamic Ca2+ waves in vivo,”
Neuron, 77 1136
–1150
(2013). http://dx.doi.org/10.1016/j.neuron.2013.01.031 NERNET 0896-6273 Google Scholar
G. Paxinos and K. Franklin, The Mouse Brain in Stereotaxic Coordinates, 2nd ed.Academic Press, San Diego
(2001). Google Scholar
M. W. Miller and B. A. Vogt,
“Direct connections of rat visual cortex with sensory, motor, and association cortices,”
J. Comp. Neurol., 226 184
–202
(1984). http://dx.doi.org/10.1002/(ISSN)1096-9861 JCNEAM 0021-9967 Google Scholar
V. Grinevich, M. Brecht and P. Osten,
“Monosynaptic pathway from rat vibrissa motor cortex to facial motor neurons revealed by lentivirus-based axonal tracing,”
J. Neurosci., 25 8250
–8258
(2005). http://dx.doi.org/10.1523/JNEUROSCI.2235-05.2005 JNRSDS 0270-6474 Google Scholar
V. Sreenivasan et al.,
“Parallel pathways from motor and somatosensory cortex for controlling whisker movements in mice,”
Eur. J. Neurosci., 41 354
–367
(2015). http://dx.doi.org/10.1111/ejn.12800 EJONEI 0953-816X Google Scholar
J. Takatoh et al.,
“New modules are added to vibrissal premotor circuitry with the emergence of exploratory whisking,”
Neuron, 77 346
–360
(2013). http://dx.doi.org/10.1016/j.neuron.2012.11.010 NERNET 0896-6273 Google Scholar
J. D. Moore et al.,
“Hierarchy of orofacial rhythms revealed through whisking and breathing,”
Nature, 497 205
–210
(2013). http://dx.doi.org/10.1038/nature12076 Google Scholar
S. G. Hardy and G. R. Leichnetz,
“Frontal cortical projections to the periaqueductal gray in the rat: a retrograde and orthograde horseradish peroxidase study,”
Neurosci. Lett., 23 13
–17
(1981). http://dx.doi.org/10.1016/0304-3940(81)90183-X NELED5 0304-3940 Google Scholar
T. M. Barth, S. M. Parker and H. M. Sinnamon,
“Unilateral lesions of the anteromedial cortex in the rat impair approach to contralateral visual cues,”
Physiol. Behav., 29 141
–147
(1982). http://dx.doi.org/10.1016/0031-9384(82)90378-X PHBHA4 0031-9384 Google Scholar
D. P. Crowne and M. N. Pathria,
“Some attentional effects of unilateral frontal lesions in the rat,”
Behav. Brain Res., 6 25
–39
(1982). http://dx.doi.org/10.1016/0166-4328(82)90079-1 BBREDI 0166-4328 Google Scholar
H. M. Sinnamon and B. S. Galer,
“Head movements elicited by electrical stimulation of the anteromedial cortex of the rat,”
Physiol. Behav., 33 185
–190
(1984). http://dx.doi.org/10.1016/0031-9384(84)90098-2 PHBHA4 0031-9384 Google Scholar
A. M. Graybiel and E. A. Hartwieg,
“Some afferent connections of the oculomotor complex in the cat: an experimental study with tracer techniques,”
Brain Res., 81 543
–551
(1974). http://dx.doi.org/10.1016/0006-8993(74)90850-6 Google Scholar
C. Sekirnjak and S. Du Lac,
“Physiological and anatomical properties of mouse medial vestibular nucleus neurons projecting to the oculomotor nucleus,”
J. Neurophysiol., 95 3012
–3023
(2006). Google Scholar
R. Wasicky, A. K. Horn and J. A. Buttner-Ennever,
“Twitch and nontwitch motorneurons subgroups in the oculomotor nucleus of monkeys receive different afferent projections,”
J. Comp. Neurol., 479 117
–129
(2004). http://dx.doi.org/10.1002/cne.v479:2 JCNEAM 0021-9967 Google Scholar
F. VanderWerf et al.,
“A retrograde double fluorescent tracing study of the levator palpebrae superioris muscle in the cynomolgus monkey,”
Exp. Brain Res., 113 174
–179
(1997). http://dx.doi.org/10.1007/BF02454155 EXBRAP 0014-4819 Google Scholar
L. Petreanu et al.,
“Activity in motor-sensory projections reveals distributed coding in somatosensation,”
Nature, 489 299
–303
(2012). http://dx.doi.org/10.1038/nature11321 Google Scholar
E. Zagha et al.,
“Motor cortex feedback influences sensory processing by modulating network state,”
Neuron, 79 567
–578
(2013). http://dx.doi.org/10.1016/j.neuron.2013.06.008 NERNET 0896-6273 Google Scholar
F. Condé et al.,
“Afferent connections of the medial frontal cortex of the rat. II. Cortical and subcortical afferents,”
J. Comp. Neurol., 352 567
–593
(1995). http://dx.doi.org/10.1002/cne.v352:4 JCNEAM 0021-9967 Google Scholar
BiographyVarun Sreenivasan received his Bachelor of Science degree in life sciences from St. Xavier’s College, India, and his master’s degree in life sciences from the Ecole Polytechnique Federale de Lausanne, Switzerland. He then joined the Laboratory of Prof. Carl Petersen at the Ecole Polytechnique Federale de Lausanne, where he obtained a PhD, investigating motor control in the mouse whisker system. He is currently a postdoctoral researcher in Prof. Oscar Marin’s Laboratory, King’s College London, UK. Alexandros Kyriakatos received his Bachelor of Arts and Sciences degree in psychology from the American College of Greece, and his PhD in neuroscience from the Karolinska Institute, Sweden, investigating neuromodulation of spinal locomotor networks. As a postdoctoral fellow, he then joined the Laboratory of Prof. Carl Petersen, Ecole Polytechnique Federale de Lausanne, Switzerland, to investigate cortical sensorimotor processing in mice using voltage-sensitive dye imaging. Celine Mateo received her master’s degree in neuroscience from Louis Pasteur University, Strasbourg, France, and her PhD from the Ecole Polytechnique Federale de Lausanne, Switzerland, studying the effect of ongoing neuronal activity on synaptic transmission in sensory processing. She is a postdoctoral fellow at the University of California, San Diego, USA, where she investigates the biophysical basis of fMRI and neurovascular coupling. Her technical approaches combine optogenetics, imaging and electrophysiology in rodents. Dieter Jaeger received his PhD in neuroscience from the University of Michigan in 1990 with a thesis on basal ganglia recordings from awake primates. He was a postdoc at Caltech from 1991 to 1996, where he specialized in cerebellar Purkinje cell intracellular recordings and modeling. Since 1997, he has been a professor of biology at Emory University, where he continues to use modeling and electrophysiological approaches to study synaptic integration in cerebellar and basal ganglia circuits. Carl C. H. Petersen is a professor of neuroscience at the Ecole Polytechnique Federale de Lausanne, Switzerland, where he investigates sensory perception in mice using electrophysiological and optical techniques. After investigating calcium signaling during his PhD in Cambridge, UK, supervised by Prof. Sir Michael Berridge, he trained in neurophysiology with Prof. Roger Nicoll at the University of California, San Francisco, USA, and Prof. Bert Sakmann at the Max Planck Institute for Medical Research, Heidelberg, Germany. |


