|
|
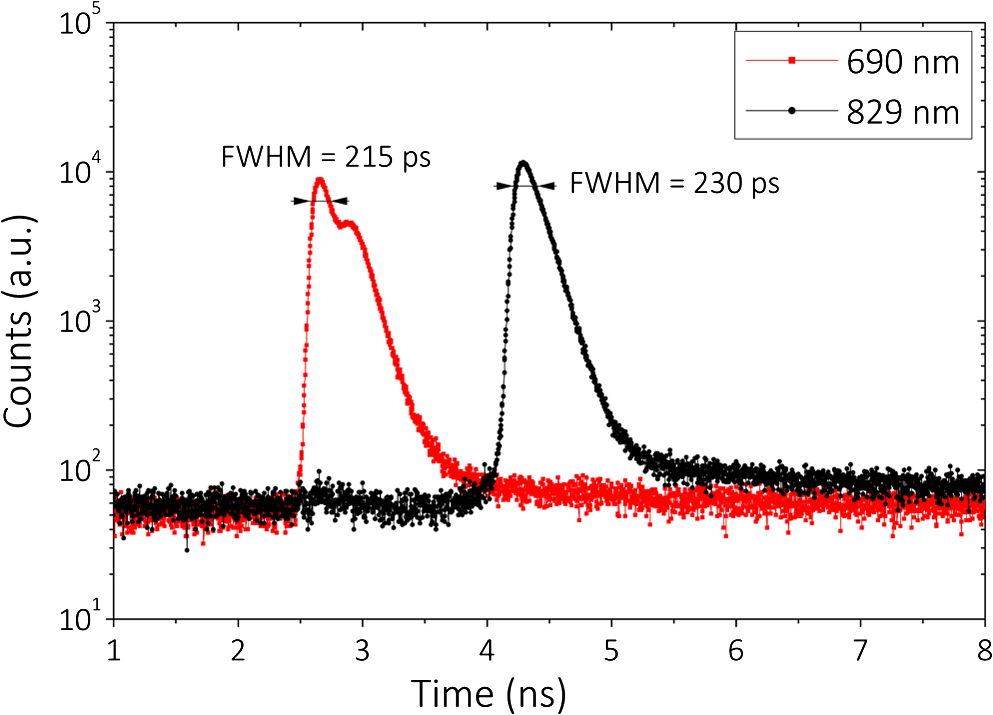
1.IntroductionCurrently, functional near-infrared spectroscopy (fNIRS) is used for research and for preliminary clinical tests for the noninvasive assessment of tissue (e.g., muscle and brain cortex) hemodynamic parameters such as oxy-hemoglobin concentration () and deoxy-hemoglobin concentration (HHb).1,2 Because of its relatively low cost and compactness with respect to conventional neuroimaging methods such as functional magnetic resonance imaging (fMRI) and the possibility to be implemented in portable and wearable devices, fNIRS has the potential to be used in both normal life conditions and clinical settings. Typically, fNIRS measurements are performed by placing optical fibers in contact with the skin for signal delivery and collection. Optical fibers are indeed useful for many aspects since they can be light and flexible, and they can be used to electrically isolate the subject under measurement, or whenever the fNIRS instrument has to be placed at a certain distance from the subject (e.g., when performing simultaneous fMRI and fNIRS measurements). However, optical fibers can also introduce constraints that might reduce the performances of an fNIRS device. For example, one of the problems can be to keep a stable coupling between the optical fibers and the tissue, avoiding the ambient light noise. To this purpose, 90-deg bent fibers can be used, but these introduce excess losses due to the bending system, causing a significant decrease in the detected signal. Alternatively, spring loaded fibers can be used, also coupled to a proper support system,3 which can guarantee a good coupling and the subject comfort. In this case, since the fibers have to be suspended above the subject’s head, we lose the advantages of portability of fNIRS devices, which can be used only in the laboratory environment. The use of fiber introduces additional crucial limitations for time-domain (TD) fNIRS.4 In addition to light harvesting capability that is crucial for all fNIRS systems, the overall performances of a TD fNIRS system rely on the temporal resolution, since TD fNIRS measures the photon distribution of time of flight (DTOF) at the picosecond scale. Large core, high numerical aperture (NA) fibers are needed to maximize light harvesting from the tissue. Typically, step index (SI) optical fibers or bundles of SI optical fibers are used. However, these solutions introduce significant broadening in the light pulses due to the modal dispersion.5,6 The use of graded index (GI) optical fibers is therefore recommended to reduce modal dispersion in the TD fNIRS system. Unfortunately, large core glass GI fibers are not available, or they are too rigid to be easily employed. Further, bundles of small core GI optical fibers are characterized by a reduced harvesting capability due to the very low fill factor (the cladding diameter is in fact much larger than for SI fiber). Recently, GI plastic optical fibers have been proposed with large core (0.9 mm) and acceptable flexibility.7 However, the attenuation is very high (almost two orders of magnitude) as compared to glass GI fiber, therefore reducing the overall light harvesting efficiency. Indeed, the ideal solution should be to place the detector directly in contact with the skin to avoid the use of optical fiber. This solution has been implemented in a few continuous wave fNIRS devices,2 and it has been explored in TD fNIRS only in a pilot test at research level with a classical photomultiplier (PMT).5 The use of PMT is impractical in real-life operations since they are bulky and fragile. Recently, the use of solid-state detectors, such as the single-photon avalanche diode (SPAD), has been effectively proposed by Dalla Mora et al.8 Again this solution is not optimal since the detector area is very small (). During last year, silicon photomultipliers (SiPMs), initially developed as a photon-number resolving detector for high-energy physics applications (e.g., positron emission tomography scanners, Cherenkov telescopes, and so on),9 found exploitations, such as in fluorescence and Raman spectroscopy,10 where the time-resolved detection of light at the single-photon level is required. In 2015, we demonstrated the possibility of employing SiPMs for TD diffuse optics,8,11,12 obtaining timing resolutions down to 57 ps full-width at half maximum (FWHM). Since it was used in contact with the sample, we obtain high diffused photon harvesting efficiency thanks principally to the possibility of avoiding cumbersome fibers and lenses, thus exploiting the whole device NA (close to 1). The high quantum efficiency ( at 690 nm), the broad spectral coverage (350 to 1000 nm), and the good responsivity ( at 690 nm) make SiPM detectors good candidates for TD fNIRS. As additional advantages, SiPMs are inexpensive and require very compact and cheap front-end electronics, thus allowing the possibility of directly integrating the detector together with the electronics on the probe. In this way, the detection chain of the instrument can be very compact, rugged, easy to use, and low cost. Recently, Fujisaka et al.13 integrated two time-resolved SiPMs in a prototype of clinical system for in vivo brain oximetry. However, in that case, the system was still based on optical fibers to collect light from human tissues, thus limiting the photon collection efficiency, and the temporal width of the instrument response function (IRF) was larger than 1.5 ns. In this paper, we present and validate, on both phantoms and volunteers, the use of SiPM detectors hosted in a fiber-free probe to be placed directly in contact with the sample. In particular, with respect to our previous probe,11 we directly integrated an avalanche signal amplification stage close to the SiPM, thus further reducing the size of the detection channel and improving the signal immunity to electromagnetic interferences. The whole electronics was packaged inside a plastic screw holder compatible with the electroencephalography (EEG) standard cap for measurement of the brain. The presence of a resin avoids the direct contact of the scalp with the 100-V bias voltage and guarantees the electrical isolation. In this way, it is possible to integrate in a safe and easy way the SiPM detector with the clinical standards methods for 10 to 20 electrode/optode positioning. In this work, at first, we present the structure of the SiPM detector and its integration in a TD system already built in our laboratories (Sec. 2). In Sec. 3, the characterization of the SiPM detector in terms of temporal resolution, responsivity, linearity, and capability to detect deep absorption changes is reported. In Sec. 4, we present preliminary in vivo measurements on the adult arm during venous and arterial cuff occlusions and on adult motor cortex during a finger tapping exercise in order to demonstrate the capability of the whole system, employing fiber-free SiPM detectors, to noninvasively monitor human tissue’s hemodynamics changes. 2.System Setup2.1.Optical Fiber-Free Silicon PhotomultiplierAn SiPM is basically an array of hundreds of thousands fully independent microcells with a very high fill factor (typically ), each one consisting of a silicon SPAD, together with an integrated quenching resistor. Cells are connected in parallel, thus sharing a single common anode and a single common cathode. As a photon hits the detector active area, it generates an electron–hole pair inside the high electric field region (above the breakdown level). The pair triggers an avalanche current pulse, thus giving rise to a voltage pulse across the integrated quenching resistor and marking the photon arrival time. The block scheme of an SiPM-based detection channel is shown in Fig. 1(a), where the photodetector is directly coupled to an RF amplifier to provide a macroscopic voltage pulse with low additional time jitter, which can be easily used as a synchronism to a time-correlated single-photon counting (TCSPC) board. An external power supply is needed to provide the detector biasing and the amplifier operating voltage. Fig. 1(a) Block schematic of a detection channel, (b) designed SiPM-based detection channel (bottom in the picture) and the same detector, hosted into a plastic screw holder (top), and (c) EEG standard cap. 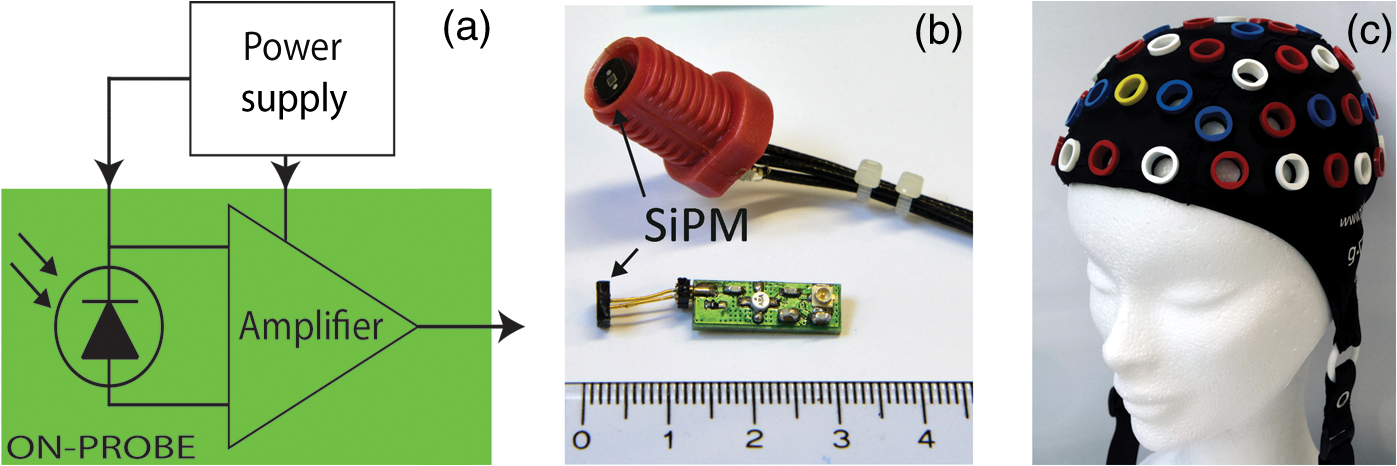 We designed two miniaturized printed circuit boards (PCBs) each one hosting a SiPM (C30742-11-050, Excelitas Technologies, Canada) and all the required front-end and amplification electronic circuits, still keeping a very small PCB dimension [, Fig. 1(b) bottom]. The probe was designed to be placed directly in contact with the head avoiding the use of optical fibers and to be hosted into a plastic screw holder [see Fig. 1(b) top] to be compatible with the EEG standard caps (g.EEGcap, g.tec medical engineering GmbH, Austria), shown in Fig. 1(c). In this way, the probe is very easy to handle and place. The large hole in the cap allows for easy removal of hairs. 2.2.System ArchitectureTo test the performances of the SiPMs detectors, we integrated them into a two-channel TD fNIRS system, presented in Ref. 14. It employs two pulsed diode laser heads, operating at two wavelengths around the isosbestic point (690 and 829 nm), with 80-MHz repetition rate (PDL, Picoquant GmbH, Germany). Multimode GI fibers () and a fiber optical switch are used to inject light pulses into the sample. We replaced the step-index fiber bundles and the PMTs of the original system with the two SiPMs in direct contact with the sample. Two boards for TCSPC (SPC130, Becker&Hickl GmbH, Germany), hosted in a peripheral component interconnect box (PCI-Cardbox 2F, IBP Instruments Gmbh, Germany) connected to a laptop are used for the parallel acquisition of the two photon DTOF in the two channels. The overall system is controlled by a home-made software, written in the C language, interfaced to a microcontroller unit (dsPIC30F2010, Microchip Technology Inc., Arizona), which provides a trigger signal to synchronize the optical switch and the data acquisition of the TCSPC boards. The laser power delivered to the sample under investigation was 1.5 and 0.4 mW, respectively, at 690 and 829 nm, which gives IRF with an FWHM of less than 230 ps in both cases, as shown in Fig. 2. 3.System CharacterizationThe SiPM-based system was characterized on solid tissue phantoms to assess: (i) light harvesting capability (Sec. 3.1), (ii) linearity and accuracy in retrieving the optical properties of a homogeneous diffusive medium (Sec. 3.2), (iii) capability to detect localized absorption changes within medium (Sec. 3.3), and (iv) long- and short-term stabilities (Sec. 3.4). 3.1.Light Harvesting CapabilityTo test the light harvesting efficiency of our single-photon detector, we measured the responsivity parameter for diffuse optics instruments as described in the basic instrument performance (BIP) assessment protocol.15 This figure is meant to quantify the overall photon harvesting efficiency when dealing with a distributed quasi-Lambertian source and accounts for both the electronic photon detection efficiency and the optical chain collection efficiency. Being designed to be used in contact with the sample under investigation, we placed the detector directly on the reference phantom surface (described in Ref. 15), thus exploiting the whole detector NA. In Table 1, the results for one SiPM detector at the two wavelengths are presented. Table 1Responsivity values for different detection systems.
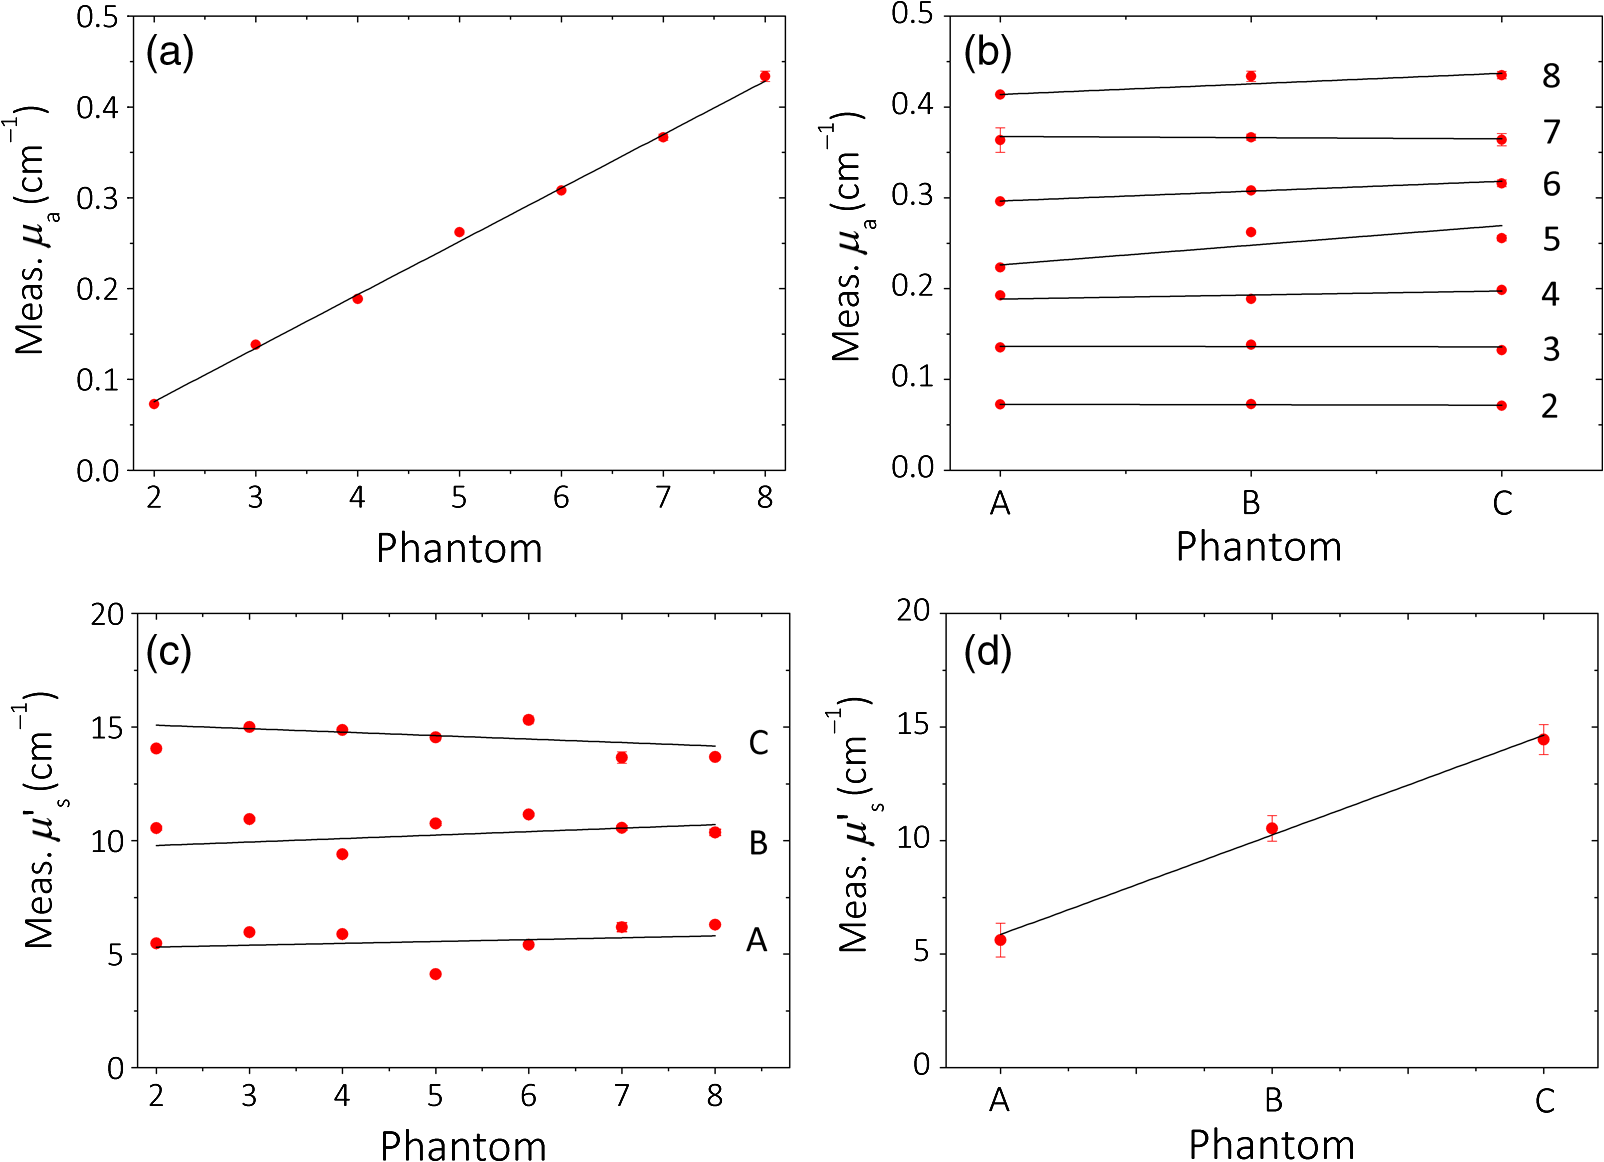
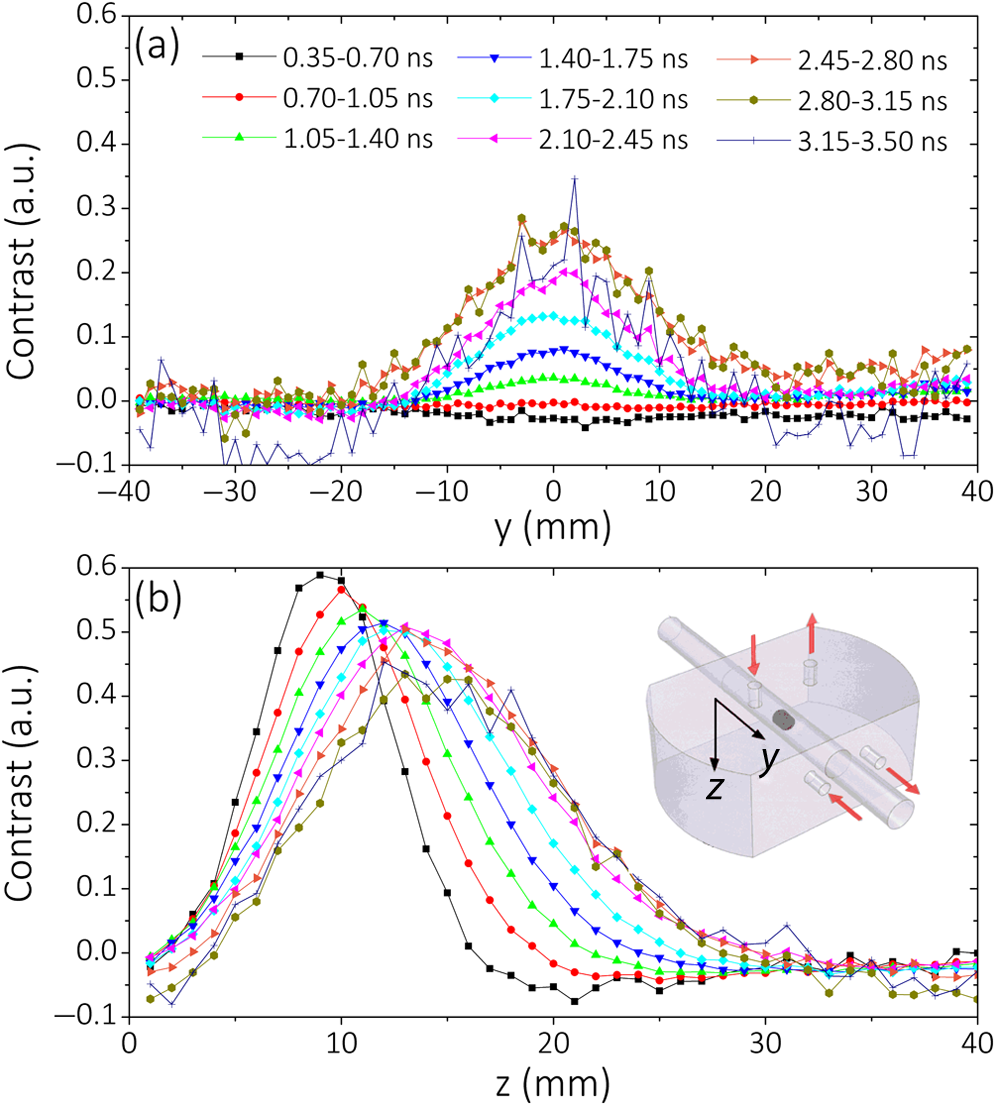
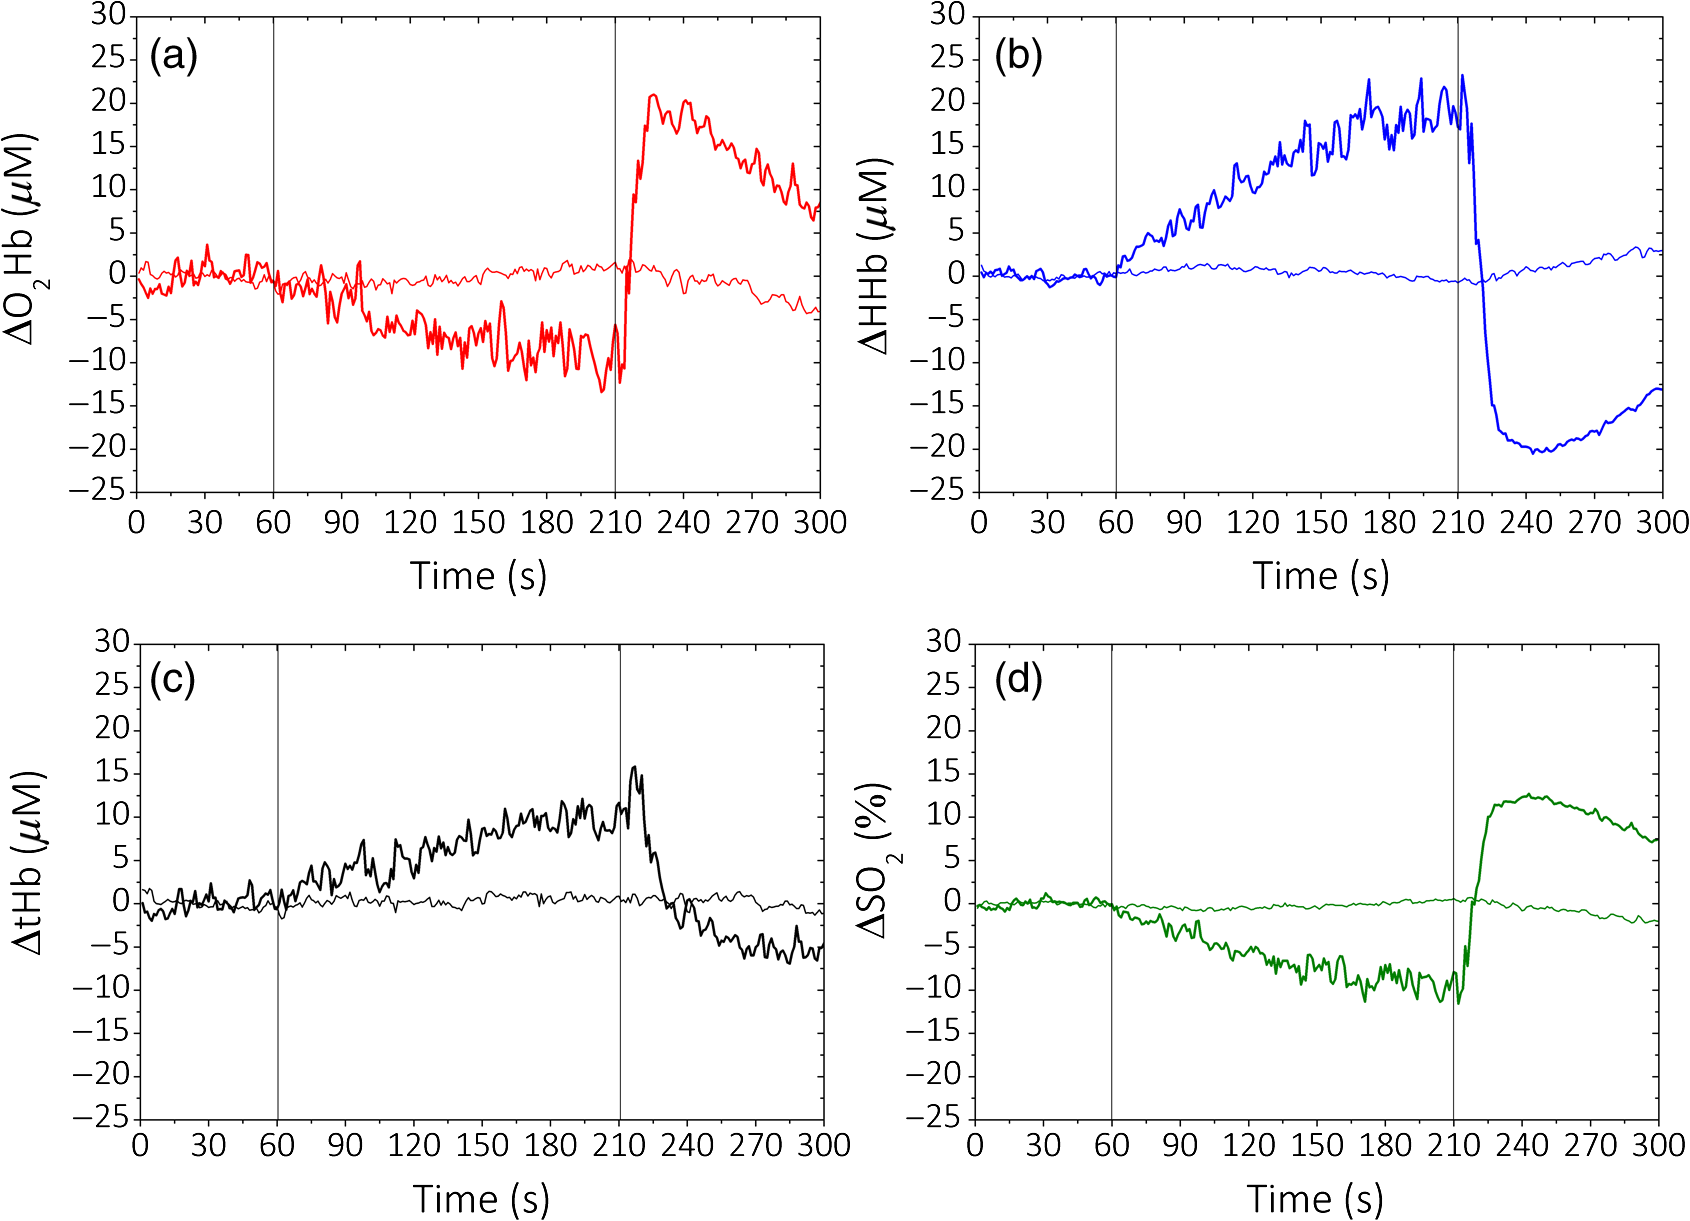
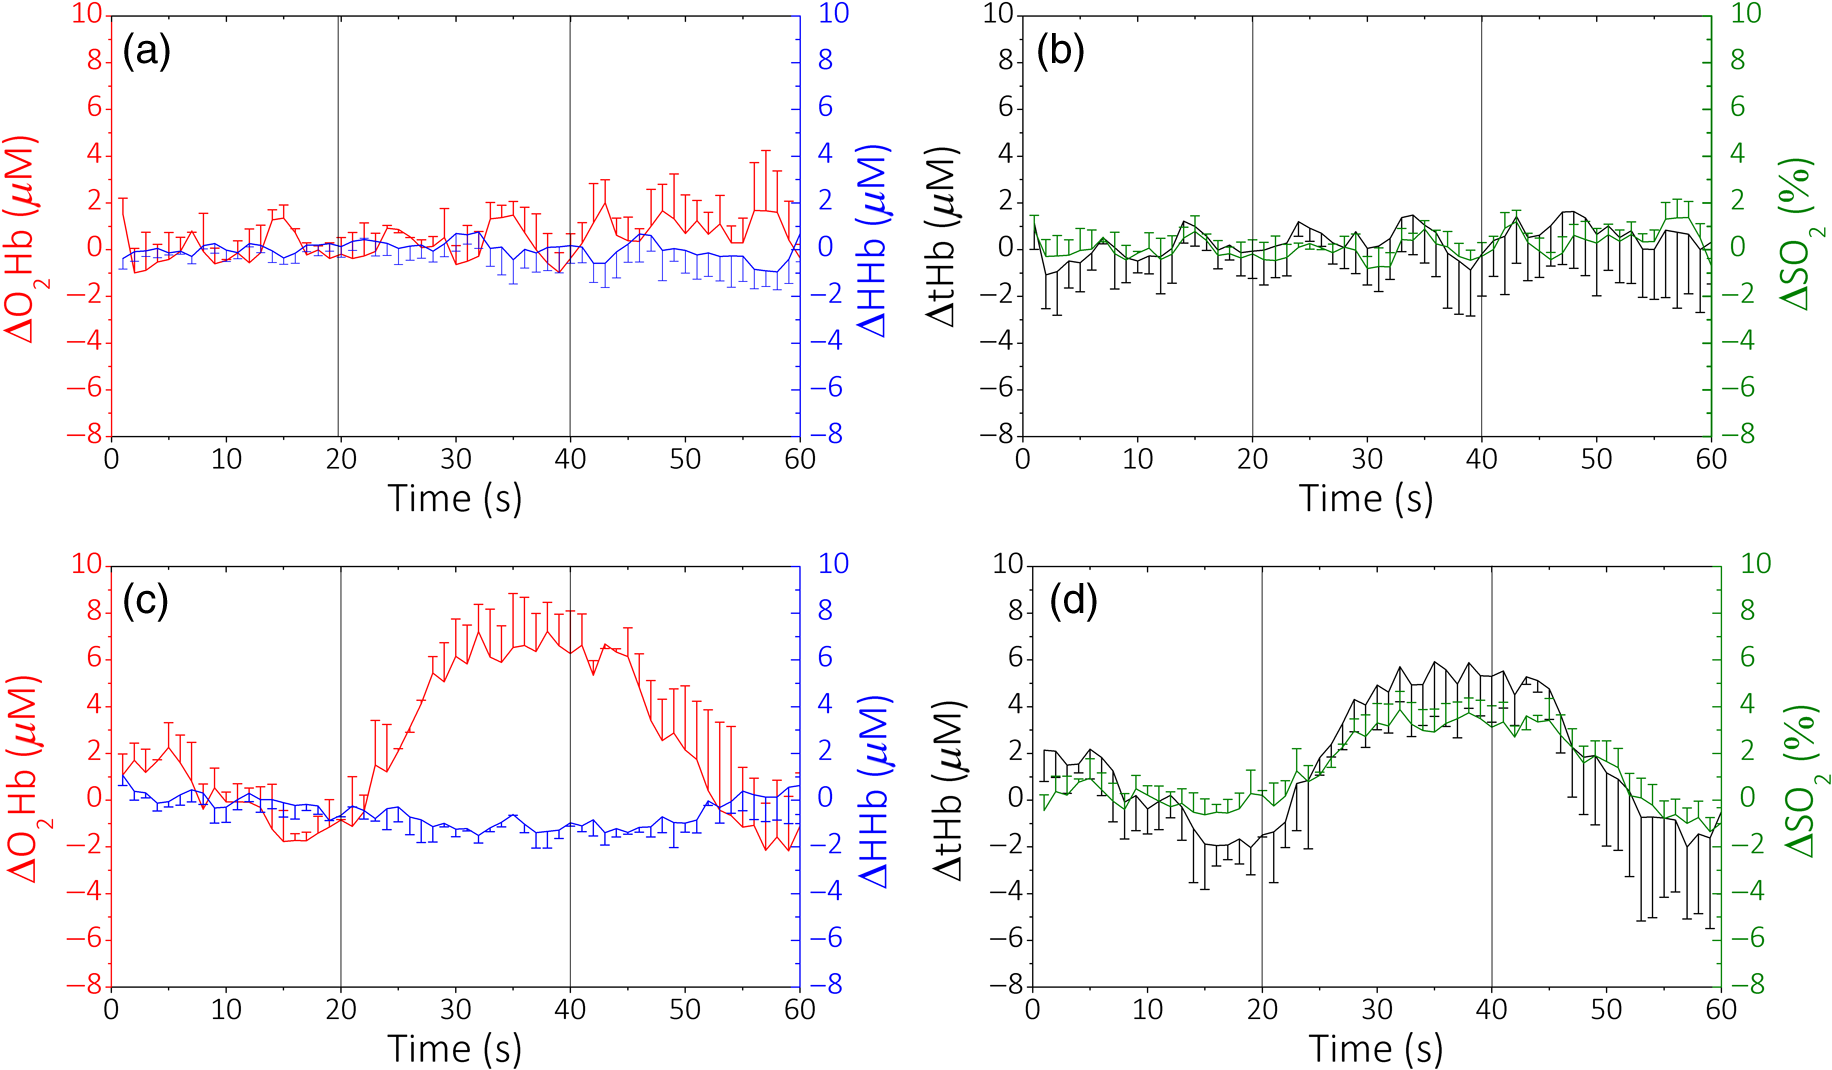
The values obtained are consistent with the ones already measured by Dalla Mora et al.11 We then compare these results with a standard PMT tube (PMT, PMC-100, Becker&Hickl GmbH, Germany), which is often employed in TD fNIRS instruments.14 In this case, light from the sample was coupled with the detector’s active area (8-mm cathode diameter) with a glass optical fiber bundle (Loptek Glasfasertechnick GmbH, Germany) with an inner diameter of 3 mm and an NA of 0.57. The PMT’s responsivity is of the same order of magnitude compared to the SiPM one, but the PMT’s active area is much bigger than the SiPM one. We have also compared these findings with another detector, which was used in a TD fNIRS system:16 a hybrid PMT (HPM-100-50, Becker&Hickl GmbH, Germany) with 3-mm cathode’s diameter and which employ the same fiber bundle described for the PMT. In this case, the calculated responsivity was one order of magnitude smaller. The increase in the responsivity values provided by SiPM with respect to hybrid-PMT is mainly due to a theoretical NA of 1, together with the absence of optical fibers and lenses that usually attenuate the signal. We can also compare our results with the ones shown in Ref. 15, where the responsivity values, for the brain imagers present in some research’s laboratories until 2014, are reported. Here, we can find responsivity of the same order of magnitude or smaller than the ones found with the SiPM detector. Since the active areas of the detectors listed are larger, we can affirm that we have a clear improvement in this parameter. 3.2.Linearity and AccuracyThe MEDPHOT protocol17 allows one to assess the system performances on homogeneous diffusive media and to compare different photon migration instruments. In the present study, we specifically apply two MEDPHOT tests to ascertain the “linearity” and “accuracy” of the system to retrieve the absorption () and reduced scattering () coefficient in homogeneous media. The tests are performed on homogeneous solid phantoms with different optical properties, labeled with a letter (A to C) and a number (2 to 8) representing, respectively, the nominal (5 to , steps) and the nominal (0.07 to , steps) at 660 nm. The and values are obtained mixing the proper quantity of and toner powder inside an epoxy resin mould. The measurements were performed with both the detection channels, in a reflectance geometry (3-cm source–detector distance) with an acquisition time of 1 s for each wavelength, with five repetitions for each wavelength and channel. To calculate the and , we performed a fitting procedure between the time-resolved reflectance curve and the analytical solution of the diffusion equation in an infinite homogeneous slab18 geometry previously convoluted with the IRF. In Fig. 3, the results at 690 nm for one channel are shown. In Figs. 3(a) and 3(d), the measured and versus their conventional true values are plotted, respectively. The conventional values have been measured by means of a TD NIRS instrument,19 which guarantees a good estimate of the optical parameters thanks to a narrow (), clean, and stable IRF.20 The points represent the average values over the different scattering phantoms for each absorption value (a) and over the different absorption phantoms for each scattering value (d). The error bars are the corresponding standard deviations. The solid lines are the linear fit of the whole measurement points. We can notice how the experimental points are well aligned along these lines (goodness of the fit: for and for ) showing a good linearity.21 In Figs. 3(b) and 3(c), the measured and versus the conventional true and , for the different phantoms are plotted, respectively. The solid lines are the linear fit of the whole measurement points. For [Fig. 3(b)], we have a good fit until phantom 3 (), while with the increasing of the absorption value, we have a decrease in the goodness of the fit (), with the exception of phantom 7, where . For [Figs. 3(c)], we can see that the points are always well aligned with the fit lines () except for phantom 3, where . Similar results were obtained for the 829-nm wavelength and for the other detection channel (data not shown). 3.3.Detection of Deep Absorption ChangesTo validate the application of the instrument in clinical problems related to a localized change in absorption properties, such as functional brain imaging or muscle metabolism monitoring, we performed measurements applying the nEUROPT protocol.22 In particular, we assessed the “sensitivity,” expressed by the contrast as a function of depth, and the “spatial resolution,” based on a lateral scan. The nEUROPT tests were taken on an inhomogeneous solid phantom with switchable black polyvinyl chloride inclusions of different dimensions, which mimics a realistic absorption perturbation.23 The inclusions (black cylinders with diameter and height of 3, 4, 5, and 7 mm, corresponding to an equivalent absorption variation of 0.05, 0.10, 0.17, and , for a volume of , respectively) were placed inside a movable cylinder (solid epoxy resin with same optical properties of the host phantom). Both lateral (Y-scan, measuring surface parallel to the inclusion movement) and depth scans (Z-scan, measuring surface perpendicular to the inclusion movement) were performed in 1-mm steps. The time-dependent contrast as a function of the inclusion position , at 690 nm, was calculated as where represents the photon counts in the time windows located at time delay , with respect to the IRF peak, and width of 350 ps; is either the lateral or depth coordinate in the Y- or Z-scan, respectively; and is the photons’ count in the same time window with the inclusion at the reference position (i.e., outside the sensitivity region of the technique). The contrast in the time windows at short temporal delays (early gates) represents early detected photons, which traveled principally on the surface of the samples (UP layer). Conversely, with longest delays (late gates), we are considering late detected photons, which probed the sample more in depth (DW layer).The contrast for the Y- and Z-scan for the 5-mm black inclusion is shown in Figs. 4(a) and 4(b), respectively. The contrast was calculated in 10 different time delays (0 to 3.50 ns, 0.35-ns step), but in the figure in the first one (0 to 0.35 ns), it is not shown since the noise was much bigger than the signal in this temporal window. During the Y-scan, we can see that at the zero point position, where the inclusion is exactly under the source–detector pair’s plane, the contrast has a maximum, while it decreases with the progressive estrangement of the inclusion. Upon increasing the time delay, an enhancement of the contrast is observed. No contrast is observed in the early gates (0.35 to 1.05 ns), which are related to the region close to the phantom surface. The last temporal delay (3.15 to 3.50 ns) is noisier, indicating that the signal, in this part of the curve, is lower. In the Z-scan (b), the starting position corresponds to the inclusion border coincident with the entrance surface, just outside the bulk phantom. The peak in the contrast for both the late and early gates is now reached at different positions, which are farther from the injection surface if the time delay is higher. These results show the excellent capability of this measurement setup to detect local changes of absorption, thus validating the SiPM detector as a very great candidate for TD fNIRS in vivo measurement. For the other inclusions with different diameters, we found similar results with an increased contrast for the larger inclusions. 3.4.Long- and Short-Term StabilitiesThe IRF stability test (foreseen in the BIP protocol15) is an important factor for determining how quickly the whole system reaches the thermal equilibrium, to quantify the system warm-up time and for understanding how long this stability is maintained. We recorded the system IRFs for the two channels and the two wavelengths, starting from the system power-on for 5 h, collecting 10 measurements of 1 s every 1 min. After the constant background subtraction (dark count rate), the total photon counts and the IRF time position (as identified by its barycenter) were calculated. For the photon counts at 690 nm, obtained integrating the IRF waveform, to enter into the () range of the average of the last 30 min (long-term stability), it is necessary to wait about 120 min (210 min). For the time position of the IRF, it is necessary to wait only 10 min (50 min) to enter into the () range of the average of the last 30 min. Since during in vivo recordings, the measurements performed are often no longer than 30 min, we have therefore evaluated the short-term stability by dividing the whole 5-h long stability, in 10 different intervals of 30 min each, and by calculating the variation of photon counts and time position of the IRF within these short periods. Only in the first time interval (soon after turning on the system), the percentage of intensity variation is around 2.5% (calculated as the standard deviation in the period). For the following intervals and for the IRF barycenter, it is always lower than the 1%. This fact suggests that it is possible to use the system after 30 min of warm-up. To disentangle the contribution of the detector and of the laser during the warm-up period, we performed another stability measurement, in which the lasers were already kept on for 3 h, which allows us to consider them stable within 1%. In this case, to enter into the () range of the average of the last 30 min (total measurement length: 4 h), it is necessary to wait about 70 min (170 min) for the data counts and 5 min (30 min) for the barycenter. Similar results were found for the other detector and wavelength. These results show that some thermal instability can be effectively ascribed to the SiPM front-end, probably due to an ineffective heat dissipation strategy. 4.In Vivo TrialsPreliminary in vivo measurements during well-established protocols were performed to test the applicability of the SiPM detectors. In particular, we monitored the hemodynamic parameters [, HHb, total hemoglobin , and saturation ] in the arm muscle and in the brain cortex during an arterial arm cuff occlusion (Sec. 4.1) and during finger tapping exercises (Sec. 4.2), respectively. and HHb can be easily calculated by means of the extinction coefficients.24 To remove the contribution of the more superficial layers, i.e., lipid in the muscle and skull in the head, we applied a correction method based on the refined computation of the path lengths traveled by photons in a two-layer medium.25,26 The a-priori knowledge of the thickness of the UP layer is necessary and it was measured or estimated for each subject. Measurements were performed with the preprototype described in the previous sections, designed and developed by the research group involved in the study. A risk analysis has been conducted and risk management procedures have been adopted to ensure that, according to the existing directives and regulations, all safety procedures were followed and possible residual risks were considered negligible during the use of the instrumentation by the operator and during the measurements on volunteers. Before using the instrument on humans, the performances of the instrument had been thoroughly tested. All the volunteers gave the informed consent before the experiments. 4.1.Arterial Arm OcclusionWe performed an arterial (300 mmHg) cuff occlusion of the right arm muscle of a male adult volunteer. We employed two different measurement channels (i.e., source–detectors couples), one for the occluded arm and one for the other, which was kept in a basal condition for the whole experiment. The detectors were placed directly in contact with the arms by means of a black rubber pad probe, with a source–detector separation of 3 cm. The protocol consisted of 60 s of baseline, where the basal hemodynamic condition was registered, 150 s of occlusion, and 90 s of final recovery. The sampling rate was set at 1 s. The thicknesses of the superficial layer for the left and right arm were measured with a skin folder caliper and were set at 2 and 3 mm, respectively. The baseline average values for the hemodynamic parameters for left (right) arm were: , , , and (68)%. In Fig. 5, the variations of the time course of , HHb and tHb concentrations, and of percentage with respect to the baseline during the arterial occlusion are shown. A median filter of the third order was applied, since it represents a good means to remove the noisy spikes without smoothing too much the signal causing a loss of information. In Fig. 5, data for the left (light line), not occluded, arm and right (thick line), occluded one, are presented, respectively. During the arterial occlusion, since both the arteries and the veins are closed, we can observe, for the occluded arm, in Fig. 5(b), an increase of HHb, and in Fig. 5(a), a decrease of . Since no new oxygenated blood can reach the arm and no deoxygenated can go outside it, but the muscular metabolism continues, decreases and tHb increases during the occlusion period, as shown in Figs. 5(d) and 5(c), respectively. When the cuff is released (around 210 s), the typical hyperemia peak is present. No significant changes in the left arm are observed. 4.2.Brain Motor Cortex ActivationWe performed two motor task experiments consisting of a finger-tapping exercise with the right and left hand, respectively, involving one adult male volunteer. The two measurement channels were placed around the C3 and C4 positions according to the EEG international system, in order to monitor the hemodynamic changes in both the ipsi- and contralateral brain motor cortex. The protocol was based on four repeated blocks consisting of: 20 s of rest, 20 s of task, and 20 s of recovery, for 240 s of total experiment length. The acquisition rate was set at 1 s and the source–detector separation was fixed at 3 cm. The detector and the injection fibers were put in contact with the scalp by means of a standard EEG cap (EEGcap, g-TEC, Austria), as the one shown in Fig. 2(c), according to the EEG international standard. The baseline average values for the hemodynamic parameters for left (right) hemisphere were: , , , and (68) %. In Figs. 6(a)–6(d), the time course of , , , and , calculated with respect to the baseline values, respectively, for the left and right hemispheres during a right-hand finger-tapping task, are shown. The average over the four repetitions is shown and the error bars represent the standard deviation over the repetitions. A median filter of the third order was applied. For this subject, we considered a thickness of the UP layer of 1.25 cm that was manually estimated by looking at the anatomical MRI images. In the contralateral hemisphere, we can notice an evident cortical activation, i.e., an increase of and a contextual decrease of HHb [Fig. 6(a)] that yield to an increase of tHb and of [Fig. 6(b)]. In the ipsilateral hemisphere [Figs. 6(c) and 6(d)], no activation is shown ( and have non task-related fluctuations around zero), as expected during a motor cortex activity. Fig. 6Right-hand finger tapping. Variations of the hemodynamic parameters with respect to the baseline for (a and b) the left and (c and d) right hemispheres. The error bars are the standard deviations over the four task repetitions. 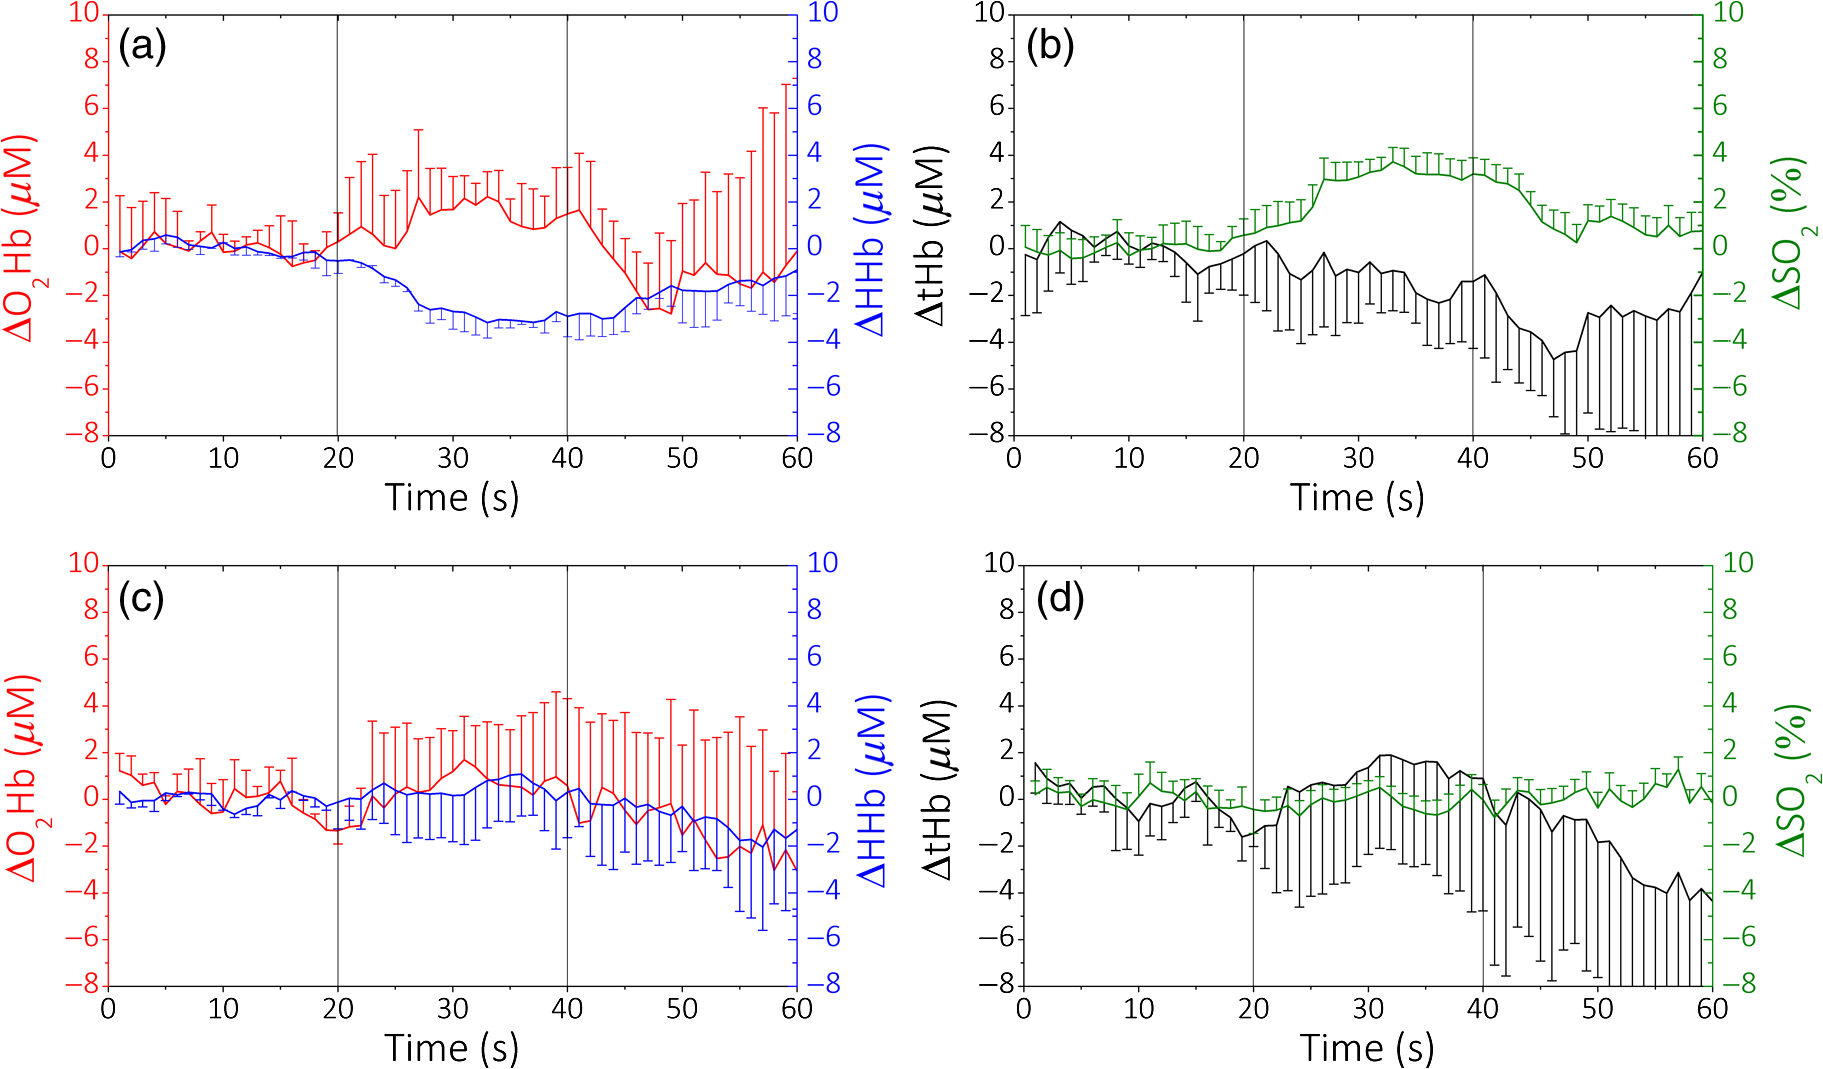 In Fig. 7, the left-hand finger-tapping task is shown. The graphs were obtained in the same way as for the previous ones. Again, we can clearly observe the activation in the contralateral hemisphere, with a slight increase of and a corresponding decrease of HHb [Fig. 7(c)], with an increase of and tHb [Fig. 7(d)]. In the ipsilateral hemisphere [Figs. 7(a) and 7(b)], we notice instead an increase in and an almost constant HHb. These results can be ascribed to a task related physiological response not involving a cortical activation. 5.Discussion and ConclusionIn this paper, we have reported, for the first time, the possibility of employing fiber-free SiPM detectors for in vivo TD fNIRS acquisitions. These detectors can pave the way to a generation of TD fNIRS systems, where most of the problems related to the traditional, bulky, PMT-based architecture are solved. SiPMs offer very good timing resolution ( to 60 ps) and can be easily put in contact with the patient’s skin, avoiding the use of optical fibers, which broaden the temporal response of the TD system, have a reduced collection capability and attenuate the collected signal. These detectors have a better responsivity () as compared to other TD detectors thanks to the high NA and high spectral efficiency. In Sec. 3, the standard characterization on phantoms for a TD fNIRS system, SiPM based, showed a good behavior in terms of linearity and capability in finding deep absorption changes (at a depth of about 2 to 3 cm). The application of SiPM detectors to in vivo measurements on the arm muscle and on brain cortex was demonstrated in Sec. 4. The optical variations related to physiological changes, which reflect in hemodynamic changes are well recognized and their amplitude variations suggest the reliability of SiPMs in terms of signal-to-noise ratio also during in vivo measurement. The constrained dimensions of these detectors can allow their embedding with all the control electronics easily, thus obtaining very compact probes, easy to parallelize for a multichannel, dense approach. This aspect is crucial for the employment of the TD fNIRS system in some hospital wards such as an ICU, where the available space is often limited and smart compact devices are required. In addition, the possibility to obtain wearable instruments is suitable for all the steps of the rehabilitation processes or sport training, where a monitoring of the muscular tissue hemodynamic progress is necessary.27 As discussed in Sec. 3.4, for the future, it is necessary to properly address the issue of the thermal stability of the detection probe, in particular by employing proper heat management strategies due to the presence of the radiofrequency avalanche signal amplifier. Additionally, the replacement of this amplifier with an application-specific integrated circuit for the signal conditioning of the avalanche pulse can further improve costs, dimension, and immunity to electromagnetic interferences. AcknowledgmentsAll the authors declare that there are no conflicts of interest regarding this paper. ReferencesM. Ferrari and V. Quaresima,
“A brief review on the history of human functional near-infrared spectroscopy (fNIRS) development and fields of application,”
NeuroImage, 63
(2), 921
–935
(2012). http://dx.doi.org/10.1016/j.neuroimage.2012.03.049 NEIMEF 1053-8119 Google Scholar
F. Scholkmann et al.,
“A review on continuous wave functional near-infrared spectroscopy and imaging instrumentation and methodology,”
NeuroImage, 85
(1), 6
–27
(2014). http://dx.doi.org/10.1016/j.neuroimage.2013.05.004 NEIMEF 1053-8119 Google Scholar
A. T. Eggebrecht et al.,
“Mapping distributed brain function and networks with diffuse optical tomography,”
Nat. Photonics, 8
(6), 448
–454
(2014). http://dx.doi.org/10.1038/nphoton.2014.107 NPAHBY 1749-4885 Google Scholar
A. Torricelli et al.,
“Time domain functional NIRS imaging for human brain mapping,”
NeuroImage, 85
(1), 28
–50
(2014). http://dx.doi.org/10.1016/j.neuroimage.2013.05.106 NEIMEF 1053-8119 Google Scholar
A. Liebert et al.,
“Fiber dispersion in time domain measurements compromising the accuracy of determination of optical properties of strongly scattering media,”
J. Biomed. Opt., 8
(3), 512
–516
(2003). http://dx.doi.org/10.1117/1.1578088 JBOPFO 1083-3668 Google Scholar
D. Milej et al.,
“Estimation of light detection efficiency for different light guides used in time-resolved near-infrared spectroscopy,”
Biocybern. Biomed. Eng., 35
(4), 227
–231
(2015). http://dx.doi.org/10.1016/j.bbe.2015.05.003 Google Scholar
, “Graded-index POF–PMMA,”
(2016) http://www.fiberfin.com/index.php/products/fiber-and-cable/graded-index-pof-12/pmma.html October ). 2016). Google Scholar
A. Dalla Mora et al.,
“Towards next-generation time-domain diffuse optics for extreme depth penetration and sensitivity,”
Biomed. Opt. Express, 5
(6), 1750
(2015). http://dx.doi.org/10.1364/BOE.6.001.1749 BOEICL 2156-7085 Google Scholar
P. Buzhan et al.,
“Silicon photomultiplier and its possible applications,”
Nucl. Instrum. Methods Phys. Res. A, 504
(1–3), 48
–52
(2003). http://dx.doi.org/10.1016/S0168-9002(03)00749-6 Google Scholar
C. Zhang et al.,
“Time-correlated Raman and fluorescence spectroscopy based on a silicon photomultiplier and time-correlated single photon counting technique,”
Appl. Spectrosc., 67
(2), 136
–140
(2013). http://dx.doi.org/10.1366/12-06736 APSPA4 0003-7028 Google Scholar
A. Dalla Mora et al.,
“Fast silicon photomultiplier improves signal harvesting and reduces complexity in time-domain diffuse optics,”
Opt. Express, 23
(11), 13937
–13946
(2015). http://dx.doi.org/10.1364/OE.23.013937 OPEXFF 1094-4087 Google Scholar
E. Martinenghi et al.,
“Spectrally resolved single-photon timing of silicon photomultipliers for time-domain diffuse spectroscopy,”
IEEE Photonics J., 4
(7), 6802512
(2015). http://dx.doi.org/10.1109/JPHOT2015.2456070 Google Scholar
S. Fujisaka et al.,
“A clinical tissue oximeter using NIR time-resolved spectroscopy,”
in Proc. of the 43rd Annual Meeting of the Int. Society on Oxygen Transport to Tissue (ISOTT’16),
(2016). Google Scholar
R. Re et al.,
“A compact time-resolved system for near infrared spectroscopy based on wavelength space multiplexing,”
Rev. Sci. Instrum., 81 113101
(2010). http://dx.doi.org/10.1063/1.3495957 RSINAK 0034-6748 Google Scholar
H. Wabnitz et al.,
“Performance assessment of time domain optical brain imagers, part 1: basic instrumental performance protocol,”
J. Biomed. Opt., 19
(8), 086010
(2014). http://dx.doi.org/10.1117/1.JBO.19.8.086010 JBOPFO 1083-3668 Google Scholar
R. Re et al.,
“Multi-channel medical device for time domain functional near infrared spectroscopy based on wavelength space multiplexing,”
Biomed. Opt. Exp., 4
(10), 2231
(2013). http://dx.doi.org/10.1364/BOE.4.002231 BOEICL 2156-7085 Google Scholar
A. Pifferi et al.,
“Performance assessment of photon migration instruments: the MEDPHOT protocol,”
Appl. Opt., 44
(11), 2104
–2114
(2005). http://dx.doi.org/10.1364/AO.44.002104 APOPAI 0003-6935 Google Scholar
D. Contini, F. Martelli and G. Zaccanti,
“Photon migration through a turbid slab described by a model based on diffusion approximation. I. Theory,”
Appl. Opt., 36
(19), 4587
–4599
(1997). http://dx.doi.org/10.1364/AO.36.004587 APOPAI 0003-6935 Google Scholar
A. Torricelli et al.,
“Non-destructive optical assessment of photon path lengths in fruit during ripening: implications on design of continuous-wave sensors,”
in Int. Conf. of Agricultural Engineering, CIGR-AgEng2012,
(2012). Google Scholar
L. Spinelli et al.,
“Accuracy of the nonlinear fitting procedure for time-resolved measurements on diffusive phantoms at NIR wavelengths,”
Proc. SPIE, 7174 717424
(2009). http://dx.doi.org/10.1117/12.808997 PSISDG 0277-786X Google Scholar
R. Cubeddu et al.,
“Experimental test of theoretical models for time‐resolved reflectance,”
Med. Phys., 23 1625
(1996). http://dx.doi.org/10.1118/1.597739 MPHYA6 0094-2405 Google Scholar
H. Wabnitz et al.,
“Performance assessment of time-domain optical brain imagers, part 2: nEUROPt protocol,”
J. Biomed. Opt., 19
(8), 086012
(2014). http://dx.doi.org/10.1117/1.JBO.19.8.086012 JBOPFO 1083-3668 Google Scholar
A. Pifferi et al.,
“Mechanically switchable solid inhomogeneous phantom for performance tests in diffuse imaging and spectroscopy,”
J. Biomed. Opt., 20
(12), 121304
(2015). http://dx.doi.org/10.1117/1.JBO.20.12.121304 JBOPFO 1083-3668 Google Scholar
L. Zucchelli et al.,
“Method for the discrimination of superficial and deep absorption variations by time domain fNIRS,”
Biomed. Opt. Express, 4
(12), 2893
–2910
(2013). http://dx.doi.org/10.1364/BOE.4.002893 BOEICL 2156-7085 Google Scholar
R. Re et al.,
“Effect of a thin superficial layer on the estimate of hemodynamic changes in a two-layer medium by time domain NIRS,”
Biomed. Opt. Express, 7
(2), 264
–278
(2016). http://dx.doi.org/10.1364/BOE.7.000264 BOEICL 2156-7085 Google Scholar
A. Pifferi et al.,
“New frontiers in time-domain diffuse optics, a review,”
J. Biomed. Opt., 21
(9), 091310
(2016). http://dx.doi.org/10.1117/1.JBO.21.9.091310 JBOPFO 1083-3668 Google Scholar
BiographyRebecca Re received her MS degree in physical engineering and her PhD in physics from Politecnico di Milano, Italy, in 2008 and 2012, respectively. She is a post-PhD researcher at the Department of Physics, Politecnico di Milano. Her research interests focus on photon migration in diffusive media, the development of instruments for time-domain functional near-infrared spectroscopy (TD fNIRS), and their application in clinical settings. Edoardo Martinenghi received his master’s degree in electronics engineering from the Politecnico di Milano, Italy, in 2013, where he is currently working toward his PhD. Currently, his research activity concerns the design of TD diffuse spectroscopy instrumentations and their applications to biomedical diagnosis. Alberto Dalla Mora graduated summa cum laude in electronics engineering from the Politecnico di Milano, Italy, in 2006 and received his PhD summa cum laude in information and communication technology from the same university in 2010. Since 2011, he has been an assistant professor at the Department of Physics, Politecnico di Milano. He authored more than 30 papers on international peer-reviewed journals. Currently, his research interests include time-resolved diffuse spectroscopy instrumentations and applications for biomedical diagnosis. Davide Contini received his MS degree in electronic engineering and his PhD in physics from the Politecnico di Milano, Italy, in 2004 and 2007, respectively. He is an associate professor at the Department of Physics, Politecnico di Milano. He is the author of more than 100 papers in international peer-reviewed journals and conference proceedings. His research activity is focused on time-resolved spectroscopy of highly diffusive media for applications in biology and medicine. Antonio Pifferi received his MS degree in nuclear engineering from the Politecnico di Milano, Italy, in 1991 and his PhD in physics from the Politecnico di Torino in 1995. He is a full professor at the Department of Physics, Politecnico di Milano. His research is directed toward the development of laser techniques and instrumentation for diagnosis and the study of light propagation in diffusive media, with applications to optical biopsy, optical mammography, and functional brain imaging. Alessandro Torricelli received his MS degree in electronic engineering from the Politecnico di Milano, Italy, in 1994 and his PhD in physics from the Politecnico di Torino in 1999. He is an associate professor at the Department of Physics, Politecnico di Milano. He is the author of more than 100 papers in international peer-reviewed journals. His current research interests include photon migration in diffusive media, fNIRS, and noninvasive diffuse spectroscopy with TD systems. |