|
|
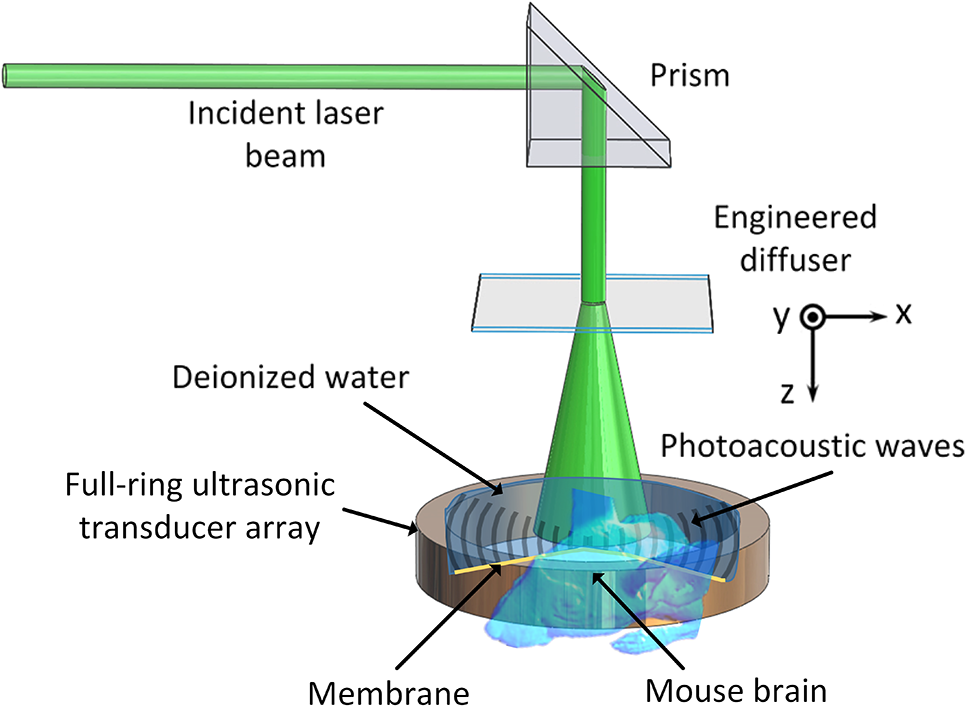
1.IntroductionRevealing how the brain works is a grand challenge worth our every effort. It will provide the key to understand and treat neurological diseases.1 Over the last few decades, various functional and structural brain imaging techniques have been developed, and some can image both structures and functions using the same modality. For instance, magnetic resonance imaging (MRI) using the T1 and T2 contrasts can image the structure of the brain over a large volume. Using the diffuse tensor method, it can also reveal fractional anisotropy, three-dimensional (3-D) diffusivity, and connection information. Functional MRI can also be achieved based on the blood-oxygen-level dependent contrast. However, MRI works on time scales of minutes2,3 and requires a costly magnetic field to achieve high spatial resolution ().4–6 Microscopic MRI of the mouse brain requires additional tissue staining and takes more than 1 day for data acquisition.7,8 Optical imaging techniques, such as confocal fluorescence microscopy and two-photon microscopy, are other powerful tools for both structural and functional brain imaging.9–12 Various bio-molecules, such as hemoglobin, cytochrome, melanin, and lipid,13–15 possess different optical properties, which provide contrast for structural brain imaging. Using endogenous and exogenous contrasts, light can also be used to monitor functional dynamics, such as hemodynamics and neuron activities.11,16,17 However, deep-tissue optical imaging at high spatial resolution is a major challenge because of tissue’s strong optical scattering. Thus, most optical imaging techniques can image only 1 mm deep into the brain.1 Fortunately, by converting photons into ultrasonic waves, which are orders of magnitude less scattered than light, photoacoustic (PA) tomography (PAT) can form images by detecting the pressure waves induced by the thermoelastic expansion of light-absorbing objects.18–21 PAT can break through the optical diffusion limit ( depth) by capitalizing on the low-acoustic scattering in tissue. Moreover, the scalability of PAT provides an unprecedented opportunity to bridge the gap between microscopic and macroscopic images. PAT is capable of anatomical, functional, molecular, and metabolic imaging of small animals, with highly scalable spatial resolution and penetration depth.21–23 Photoacoustic-computed tomography (PACT), a major implementation of PAT, provides fast data acquisition, submillimeter resolution, and deep penetration beyond the optical diffusion limit.22–25 Noninvasive, label-free, and functional PACT of the brains of small animals has been demonstrated by accurately mapping brain lesions and cerebral hemodynamics.26 Also, Functional imaging of brain metabolism and hemodynamic changes has been done by PACT.27 Here, for the first time, we experimentally demonstrate that PACT is able to provide label-free imaging of structures in the whole mouse brain. PACT complements magnetic resonance microscopy (MRM) for imaging small-animal brain structures by providing optical contrast. With lateral resolution and elevational resolution, most deep brain anatomical structures have been clearly resolved through the entire brain. We also found by spectral analysis that the structural contrast comes mainly from cytochrome and lipid. 2.Materials and Methods2.1.Full-Ring Photoacoustic-Computed Tomography SystemFigure 1 is a schematic of the PACT system setup. To provide illumination in the visible band (from 420 to 680 nm), an optical parametric oscillator laser (BasiScan 120, Spectra-Physics) is pumped by an Nd:YAG laser (Brilliant B, Quantel) with a third-harmonic generator (355 nm). The laser pulse width is 6 ns, and the pulse repetition rate is 10 Hz. The incident laser beam, reflected by a right-angle prism (PS912, Thorlabs), is homogenized through an engineered diffuser (EDC-5, RPC Photonics) to provide uniform illumination over the mouse brain. The maximum laser fluence on the scalp is , which is well below the American National Standards Institute safety limit ( in the visible spectral region). The photoacoustic signals are detected by a 5-cm diameter full-ring ultrasonic transducer array (Imasonic Inc.) with 512 elements, 5-MHz central frequency, and more than 80% one-way bandwidth. Each element (10-mm high, 0.3 mm in pitch, and 0.1-mm interelement spacing) is cylindrically focused to produce an axial focal distance of 19.8 mm (acoustic NA of 0.25). The combined foci of all elements form a uniform imaging region of 20-mm diameter and 1- mm thickness.25 Within this region, the radial resolution is 100 μm and the tangential resolution is 100 to .28 The data acquisition system has 64 channels with eight-fold multiplexing. After a complete data acquisition from all 512 elements, the raw data are used to reconstruct an image based on the universal back-projection algorithm.29 Due to the bandwidth limit of the detectors, the reconstructed images manifest bipolar contrast. For images selected for quantitative studies, to mitigate errors (the bipolar effect) in reconstructed images, we applied a joint reconstruction method,30 where iterative reconstruction with a nonnegativity constraint was employed to solve the minimization problem. This approach seeks to refine the measured transducer responses during the process of reconstructing the sought-after absorbed optical energy density. 3-D images can be obtained by scanning the sample along the elevational direction (-axis direction in Fig. 1). The imaging speed of the full-ring PACT system is 1.6 s per frame (per cross-section). 2.2.Label-Free Photoacoustic ImagingBased on the photoacoustic effect, if all absorbed optical energy is converted into heat, the initial pressure is given by31 where is the optical fluence (), is the optical absorption coefficient (), and Γ is the Grueneisen parameter. It follows from Eq. (1) that PAT is exquisitely sensitive to optical absorption. In fact, among all optical imaging modalities, PAT has the highest sensitivity to optical absorption because it converts a small change in the optical absorption coefficient to an equal fractional change in the ultrasound signal, tantamount to a relative sensitivity of 100%.18In principle, PAT can be used to image and quantify the concentration of any molecule, based on its absorption spectrum. For instance, PAT has been used to image oxy- and deoxy-hemoglobin,21,32–34 melanin,35,36 water,37,38 lipids,39–41 DNA and RNA,42–44 and cytochromes.45,46 Figure 2(a) indicates that hemoglobin is the most optically absorbing contrast for wavelengths below 1000 nm. In the visible spectral region, its absorption coefficient can exceed that of other chromosphores by more than two orders of magnitude. While hemoglobin allows acquisition of stunning vascular images, it also obscures PA signals from other endogenous chromosphores, such as cytochromes and lipid. Fig. 2Label-free PA imaging. (a) Absorption coefficient spectra of endogenous tissue chromophores at typical concentrations in the human body (adapted from Refs. 47 and 48). (b) In vivo imaging of the mouse brain cortex through the intact skull (imaging depth: 0.5 mm beneath the skull surface). (c) In vivo imaging of the deep mouse brain (imaging depth: 3.0 mm beneath the skull surface). 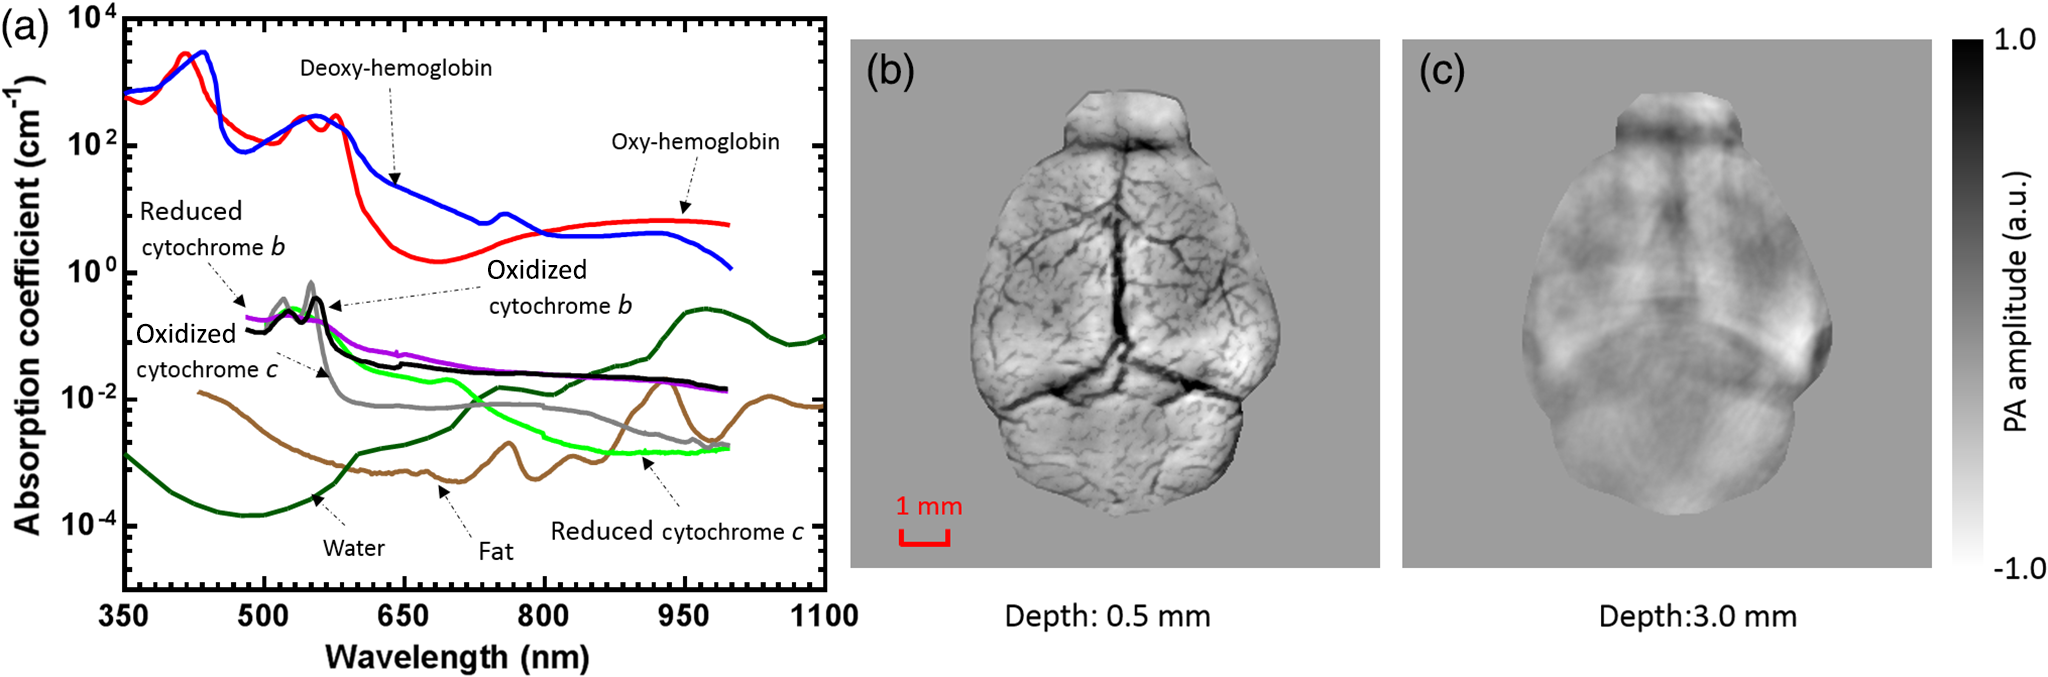 The in vivo performance of label-free PACT was tested in a nude mouse brain (Hsd: ND4, Harlan, 2-month-old, 20 to 24 g). All experimental procedures were carried out in conformity with laboratory animal protocols approved by the Animal Studies Committee at Washington University in St. Louis. Throughout the experiment, the mouse was maintained under anesthesia with 1.5% vaporized isoflurane. Before imaging, the hair on the mouse’s head was removed with a depilatory. The mouse was then taped to a lab-made motorized animal holder, which was then mounted to the PACT system. Instead of being fully immersed in water, the animal was supported from below, with the head being covered by a flexible membrane. As shown in Fig. 2(b), with 600-nm light illumination, a PACT image acquired on the brain surface shows rich cortical vasculature. Signals from major vessels, such the superior sagittal sinus, are so strong that their shadows even appear in the deep brain image [Fig. 2(c)]. Nevertheless, the skull strongly attenuates and distorts the acoustic signal. Consequently, even though different brain structures have different cytochrome and lipid concentrations, which might provide us with structural contrast, we still cannot differentiate them in the deep brain image. 2.3.Saline-Perfused Mouse Brain Imaging by Photoacoustic-Computed TomographyFrom Fig. 2(a), we can see that if hemoglobin is removed from tissue, cytochrome becomes the dominant absorber in the visible region. In a mouse brain, by dry weight, gray matter has 55% protein and 33% lipid, white matter has 55% lipid and 40% protein, and myelin has 70% lipid and 29% protein.49 Thus, the difference in protein/lipid concentrations can be utilized to differentiate the brain structures. To remove the hemoglobin, we used saline perfusion. Saline-perfused mice were prepared by the Hope Center Animal Surgery Core at Washington University, following the standard mouse transcardial perfusion protocol. Blood was removed from the body tissues by pumping phosphate buffered saline into the left ventricle and draining the blood from the aorta, which was cut with scissors. After 4 to 5 min, the fluid exiting the aorta was clear and the liver had turned white. At this point most of the blood in the body had been replaced with saline. We then dissected the head and placed it into 10% paraformaldehyde (PFA) solution for preservation. After 24 h of fixation in 10% PFA, we embedded the head in 3% agar gel for imaging. 3.Results3.1.Photoacoustic-Computed Tomography of Mouse Brain StructuresSaline-perfused mouse heads with skull intact were imaged with 600-nm laser illumination. Video 1(a) [Fig. 3(a)] shows cross-sectional images at different depths. Without the dominant hemoglobin absorption, this image looks totally different from Fig. 2(b). However, we still cannot clearly identify the structure of the brain, possibly due to light attenuation from the top skulls and acoustic distortion from the side skulls. To study the two effects, we first removed the top skulls. The resulting image [Fig. 3(b)] does not show much improvement, which indicates that light attenuation from the skull is negligible. We further removed the side skulls and acquired another image, which shows different brain structures with remarkable clarity [Fig. 3(c)]. To our knowledge, this is the first time that PAT has revealed deep structures of the brain in such detail based on endogenous contrast. Next, we removed the entire mouse brain from the rest of the skulls and acquired an image of the brain [Fig. 3(d)]. As can be seen by comparing Figs. 3(d) with 3(c), the image clarity was further improved by removing the mouth and nasal cavities, which interfere with acoustic propagation. Fig. 3PACT of the saline-perfused brain with and without the skull. (a) Image of in situ brain with skull intact at depth of 2.8 mm [Video 1(a)]. (b) Image of brain with top skulls removed at depth of 2.8 mm [Video 1(b)]. (c) Image of brain with top and side skulls removed at depth of 2.8 mm [Video 1(c)]. (d) Image of brain with all of the skulls removed at depth of 2.8 mm [Video 1(d), MOV, 414 KB] [URL: http://dx.doi.org/10.1117/1.NPh.3.3.035001.1]. 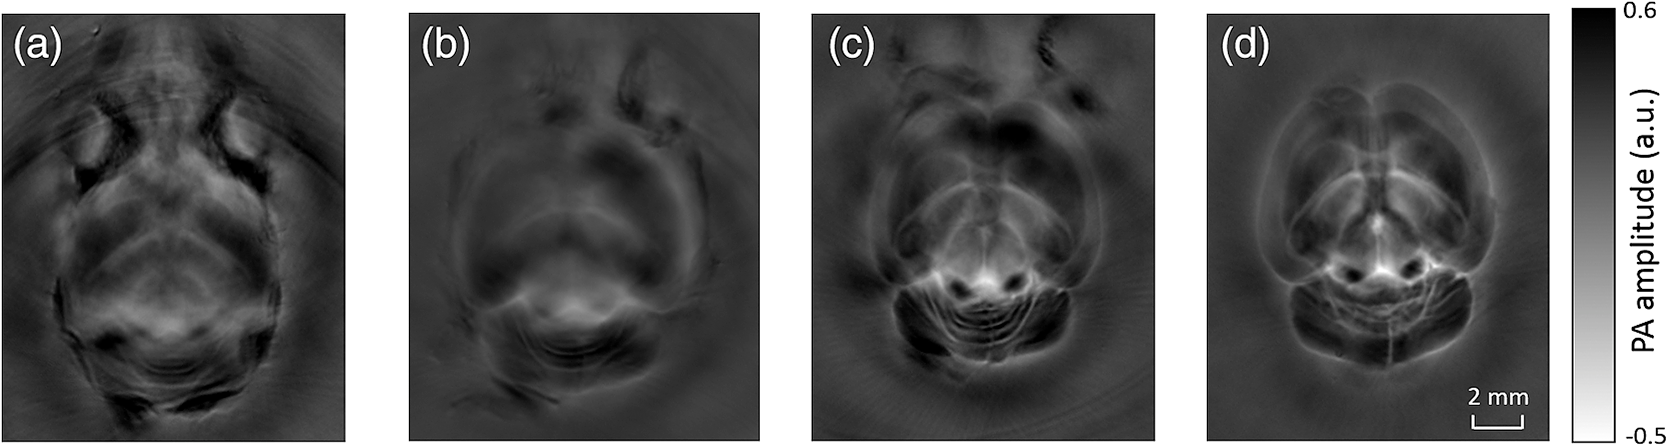 Figure 4(a) shows a label-free PACT image (acquired 2.8 mm below the brain surface) of another saline-perfused mouse brain, where the olfactory bulb was preserved. Images at other depths are shown in Video 2, from which we can see that PACT can image through the entire brain as deep as 5.0 mm in the absence of the side skulls. To better illustrate different regions, we segmented Fig. 4(a) based on the PA amplitude and labeled different segmentations [Fig. 4(b)]. For comparison, we chose one slice of a 3-D high-resolution ( in-plane resolution) MRM image, with its structural segmentation superimposed as colored lines [Fig. 4(c)],50 as a gold standard. The mouse brain PACT image shows a nearly perfect match with the MRM image. Different brain structures are clearly identified, including the central gray, cerebellum, cerebral aqueduct, corpus callosum, hippocampus, hypothalamus, inferior colliculus, neocortex, olfactory bulb, and ventricles. To our knowledge, this is the first time that PACT has clearly shown deep structures of the brain with rich contrast among different brain tissues, with the brain intact and without any labeling. Such deep brain structures have not been shown by other photoacoustic imaging techniques or optical imaging modalities. Fig. 4Validation of the PACT image of the saline-perfused mouse brains without the skull. (a) Cross-sectional PACT image of the mouse brain at 2.8-mm depth, clearly resolving the structure of the brain. (b) Segmented and annotated image from Fig. 4(a). (c) One slice of a 3-D high-resolution MRM image with its structural segmentation superimposed as colored lines, chosen as a gold standard for validation of PACT50 (courtesy of Frontiers in Neuroscience) (Video 2, MOV, 135 KB) [URL: http://dx.doi.org/10.1117/1.NPh.3.3.035001.2]. 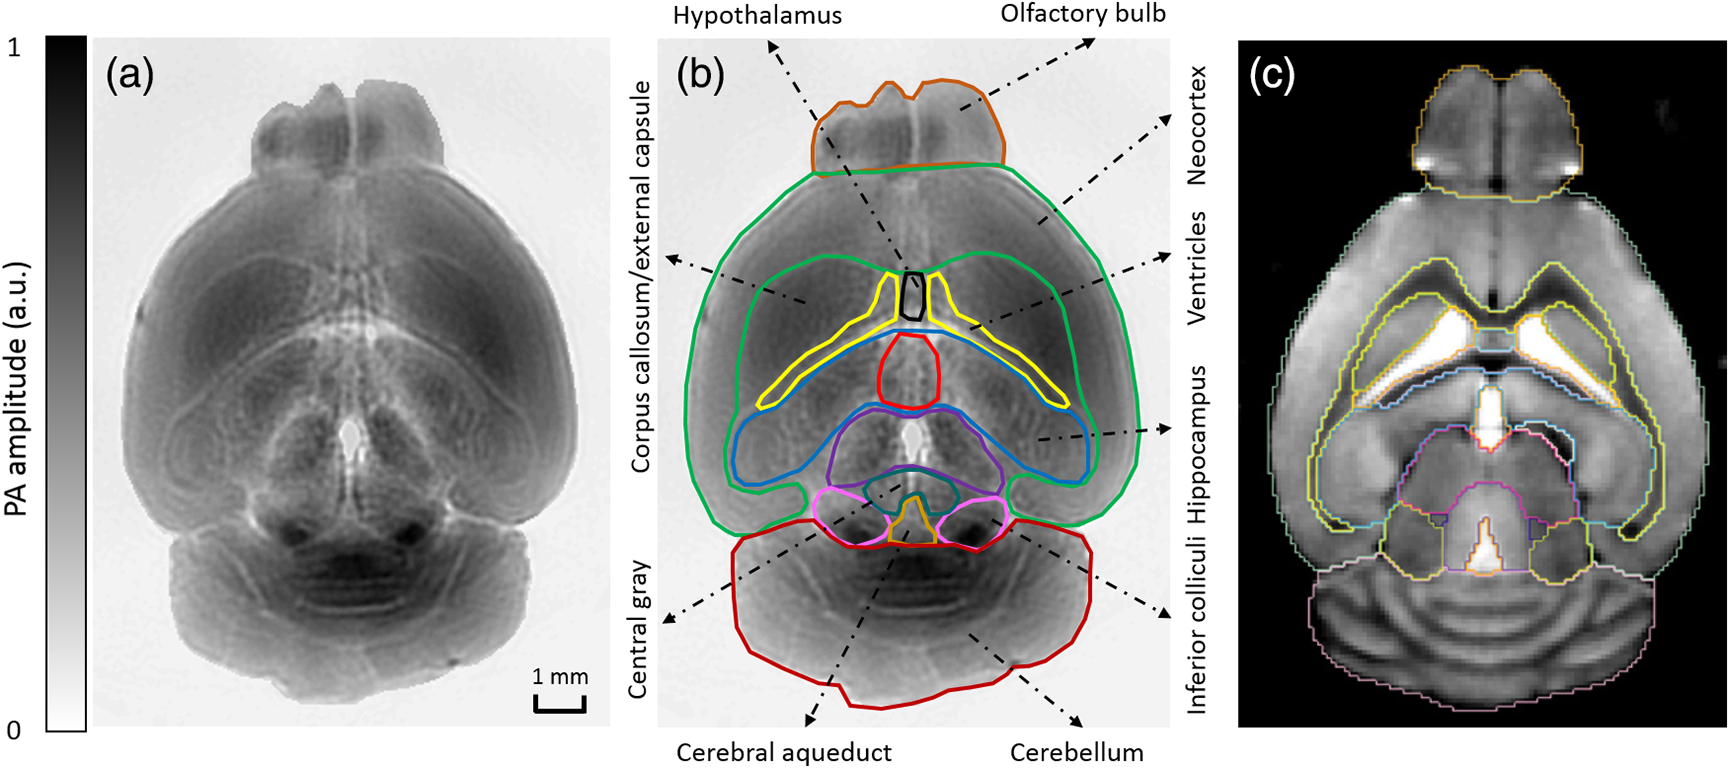 3.2.Spectral ImagingTo find the optimal wavelength for imaging brain structures and to verify the origin of contrasts, we varied the laser wavelength from 480 to 680 nm with a 20-nm interval. Figure 5 shows the spectral PACT images of a mouse brain at one selected depth (2.8 mm below the brain surface), and Video 3 shows cross-section images at varied depths for each wavelength used (from 480 to 680 nm). A quantitative spectral analysis is discussed in detail in Sec. 4. Fig. 5Spectral PACT of a mouse brain at 2.8-mm depth (Video 3, MOV, 1.17 MB) [URL: http://dx.doi.org/10.1117/1.NPh.3.3.035001.3]. 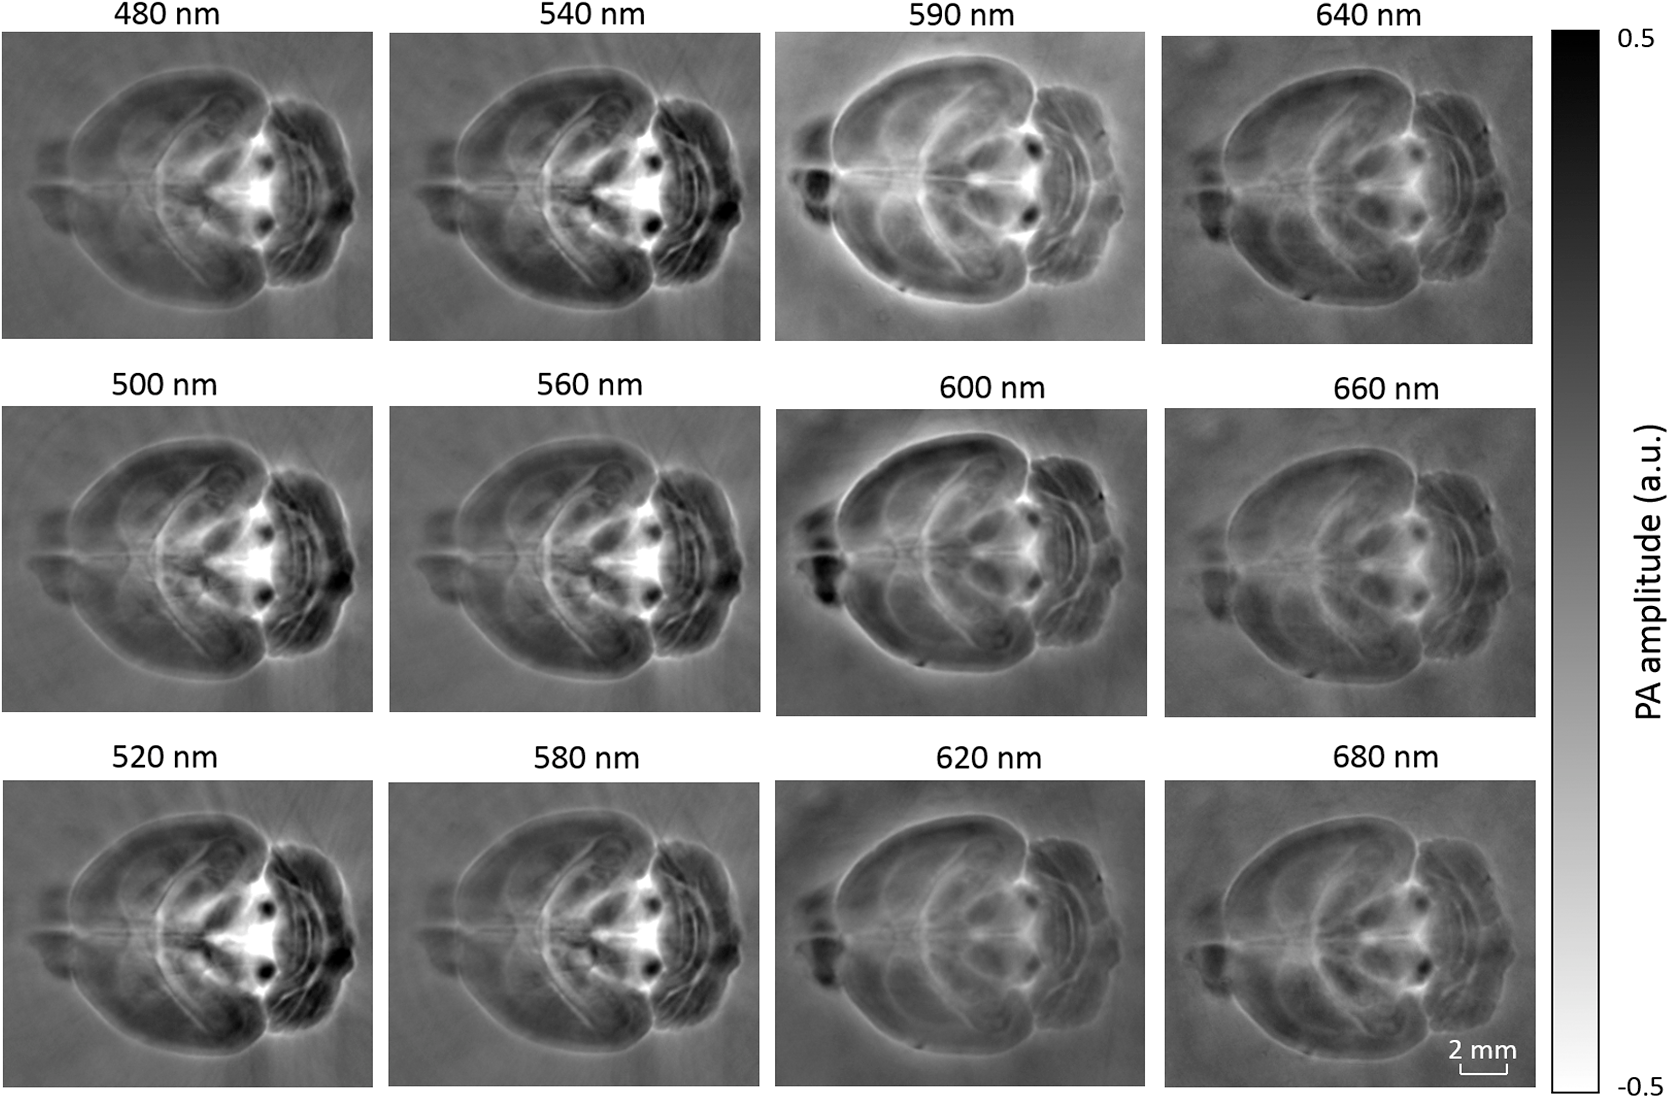 4.DiscussionAfter the removal of blood, the remaining dominant chromophores are nuclei (DNA and RNA), water, cytochrome, and lipid. DNA and RNA have a strong absorption in the ultraviolet band (240 to 280 nm). However, in the visible light band (420 to 680 nm), their absorption is negligible and is to times weaker than that of cytochrome.51 Water contents in various brain tissues are very similar52 and, thus, probably provide a relatively constant background in PACT images. Thus, the structural contrast should mainly come from cytochrome/lipid distribution. Each pixel in a single-wavelength PACT image represents a combined contribution from optical absorbers with known molar extinction coefficient spectra and unknown concentrations (). Then, the spectral decomposition equation can be expressed as where is the th wavelength used for PA excitation. Based on the known extinction coefficients, the concentrations of the optical absorbers can be quantified. In the following spectral analysis, we assume that differences between the Grüneisen parameters of different types of cytochromes are negligible, which was validated in a previous report.46In mammals, the brain performs numerous computationally intensive tasks, such as information processing, perception, motion control, and learning, and, thus, consumes a large amount of energy in proportion to its volume. Mitochondria, the energy source, populate the cytoplasm of mammalian cells, including neurons, which rely on mitochondrial energy production for survival.53 The absorption sources of the mitochondria are mainly cytochromes and .46,54 Moreover, myelin has a high concentration of lipid, which has orders of magnitude weaker absorption than that of cytochrome over the spectral range of 480 to 680 nm. Thus, the existence of myelin would further sharpen the contrast of cytochrome. Therefore, the distributions of chromophores map the brain with vivid contrast in PACT images. Figure 6(a) shows the optical absorption contrast in one cross section (2.8 mm below the brain surface) based on the joint reconstruction approach. The spectral PA responses (normalized by the laser fluence) of the neocortex area encircled by the red line in Fig. 6(a) are plotted in Fig. 6(b) (labeled by circles). The neocortex consists of gray matter, or neuronal cell bodies and unmyelinated fibers. The high concentration of mitochondria in neuronal cell bodies might be responsible for the optical absorption. As the absorption sources in mitochondria are mainly cytochromes and ,46,54 the PA spectrum of the red outlined area was fitted according to Eq. (2) with a mixture of (molar ratio, cytochrome and cytochrome , which is in agreement with the measured concentration of cytochrome in mitochondria.46 The squared 2-norm of the residual is 0.003. The accuracy of spectral analysis, however, is subject to the possible presence of other neglected absorbing proteins (such as cytochrome p450, nitric-oxide synthases, and myeloperoxidase) with similar spectra. Absorption from other sources, such as water, flavoproteins, nicotinamide adenine dinucleotide, or other neglected hemeproteins, is orders of magnitude weaker than cytochrome, and was removed as a constant background during the fitting. A hematoxylin and eosin (H&E) stained histology image [Fig. 6(c)] of a horizontal brain section is presented as a validation of the optical absorber, where pink represents the proteins in the cytoplasm and blue represents DNA/RNA in nuclei. In the H&E stained histology image, the brain structure contrast from cytoplasm distribution matches with the absorption contrast-based PACT brain structure image, whereas the optical absorption from DNA/RNA is negligible under visible light illumination. This comparison between our PACT image and the H&E stained histology image further validates that the structural contrast is mainly caused by proteins in cytoplasm. Fig. 6Spectral analysis of the origin of optical absorption in the brain. (a) Cross-section imaged at 600-nm wavelength at 2.8-mm depth as part of the 3-D brain imaging, with red outlined areas segmented for analysis. (b) Measured PA spectrum and least-squares fit with a mixture of cytochromes and . (c) Histology image of one horizontal section slice stained with H&E.  To further confirm that structural contrast comes mainly from cytochrome and lipid, another area in the cerebellum [Fig. 7(a)] was segmented for spectral analysis. In a close-up image [Fig. 7(b)], white and black stripes correspond to cerebellar white matter and the granular layer, respectively.55,56 The cerebellar white matter, made up largely of myelinated nerve fibers, has high concentration of lipid, and the granular layer has a high concentration of cytochrome. We calculated the absorption ratio (AR) between the granular cell layer and the cerebellar white matter as follows: where is the PA amplitude of the cerebellar white matter region and is the PA amplitude of the granular layer region. We compare the result with the AR of cytochrome to lipid, which is obtained by taking the ratio point by point between the cytochrome absorption spectrum and the lipid absorption spectrum shown in Fig. 2(a). The two results match well with each other [Fig. 7(c)], which indicates that the contrast of the PACT image of the saline-perfused brain comes mainly from cytochrome and lipid. To confirm the presence of lipid, a horizontal brain section was stained with luxol fast blue [Fig. 7(d)], which is a commonly used to observe myelin. Comparing the cerebellum of the mouse brain in Fig. 7(a) and 7(b) with 7(d) and 7(e), the cerebellar white matter structures match well with each other. Combined with the conclusion from Fig. 6, Fig. 7(d) tells us that the absorption difference between myelin and cytochrome sharpens PACT image contrast. A potential future study would focus on directly imaging lipid in the mouse brain by employing infrared light around 1200 and 1700 nm, which are the C–H bond absorption peaks.57Fig. 7Analysis of the origins of the contrast. (a) Cross-section imaged at 600-nm wavelength at 2.8-mm depth selected from the 3-D brain images, with brown outlined areas segmented for analysis. (b) Close-up of the region inside the brown square in Fig. 7(a). (c) Comparison of the measured AR between the granular cell layer and the cerebellar white matter and the AR between cytochrome and fat. (d) Histology image of one horizontal section slice stained with luxol fast blue. (e) Close-up of the region inside the brown square in Fig. 7(d). 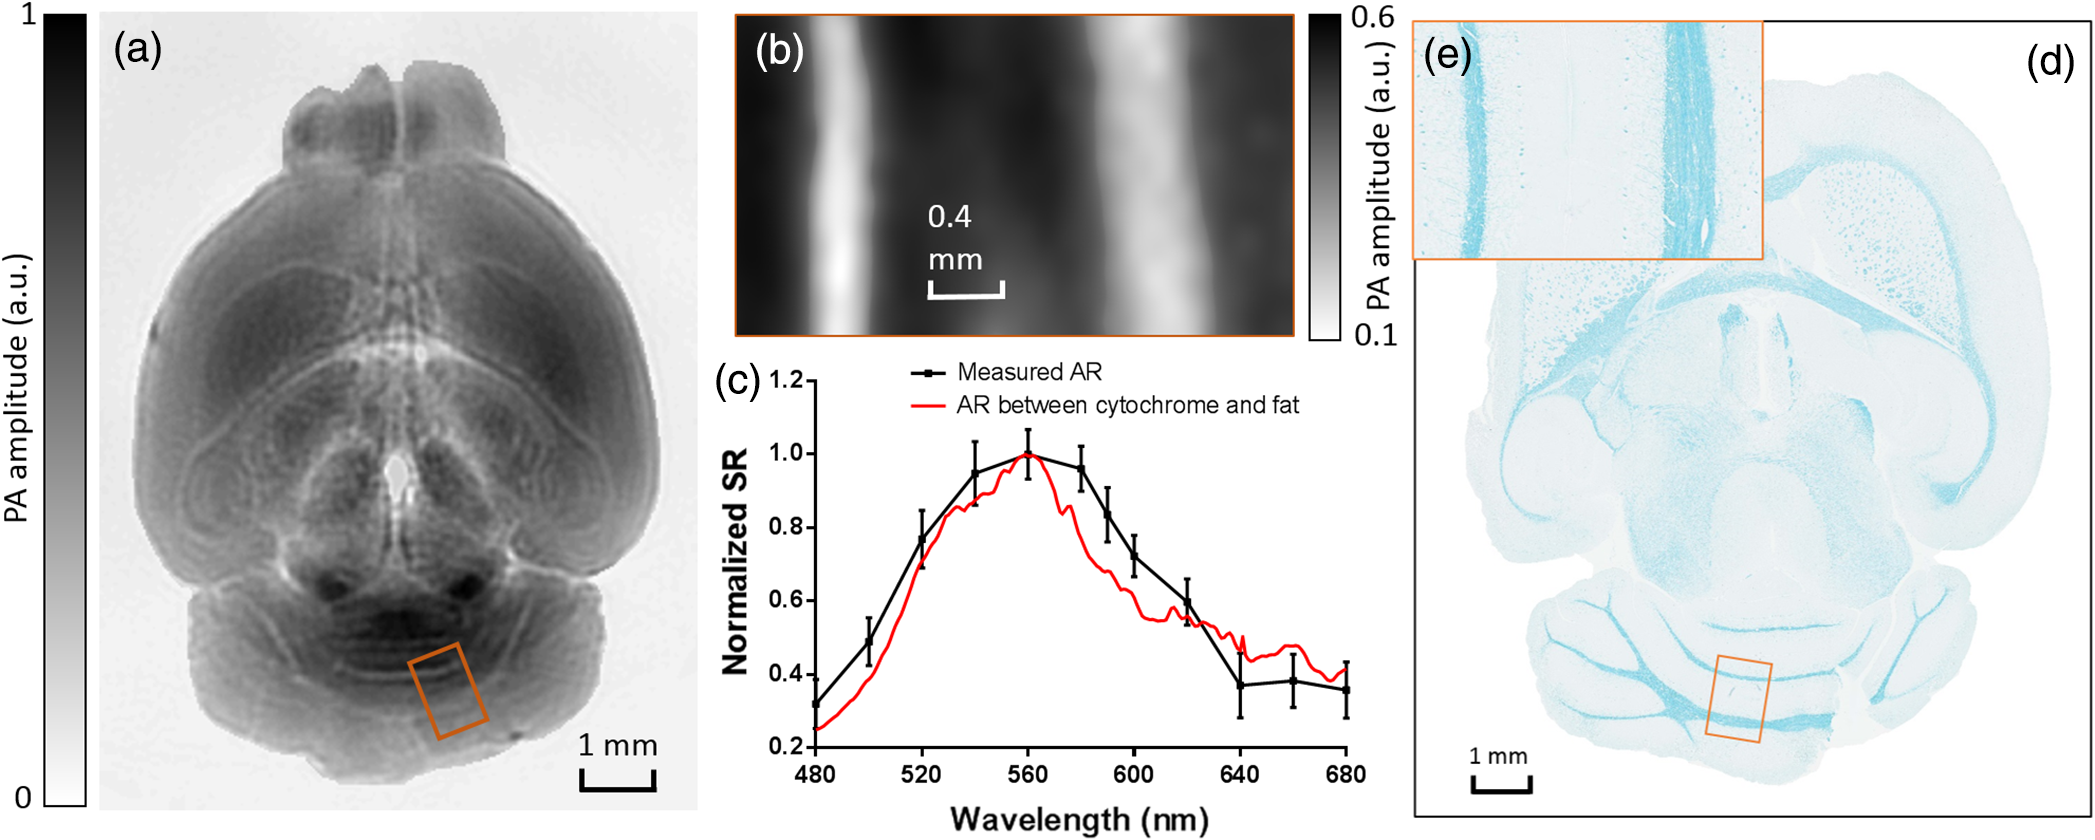 We also studied the feasibility of imaging structures on nonperfused brains. To minimize the distortion of PA waves due to bone, we removed the skulls of a euthanized mouse, fully exposing the blood intact brain. Images acquired at different depths are shown in Fig. 8. It can be seen that both of the cortex vessels [Fig. 8(a)] and deep brain structure [Fig. 8(b) and 8(c)] are clearly resolved. Most of the cerebral structures, such as the neocortex, corpus callosum, hippocampus, hypothalamus, and ventricles can be identified [Fig. 8(c)]. Compared to Fig. 4(a), though the presence of hemoglobin decreases the structural contrast of the brain image, as shown in Video 4. Fig. 8PACT image of a whole blood-perfused brain, showing both the vasculature and brain structure at depths of (a) 0.3 mm, (b) 2.1 mm, and (c) 2.9 mm (Video 4, MOV, 192 KB) [URL: http://dx.doi.org/10.1117/1.NPh.3.3.035001.4]. 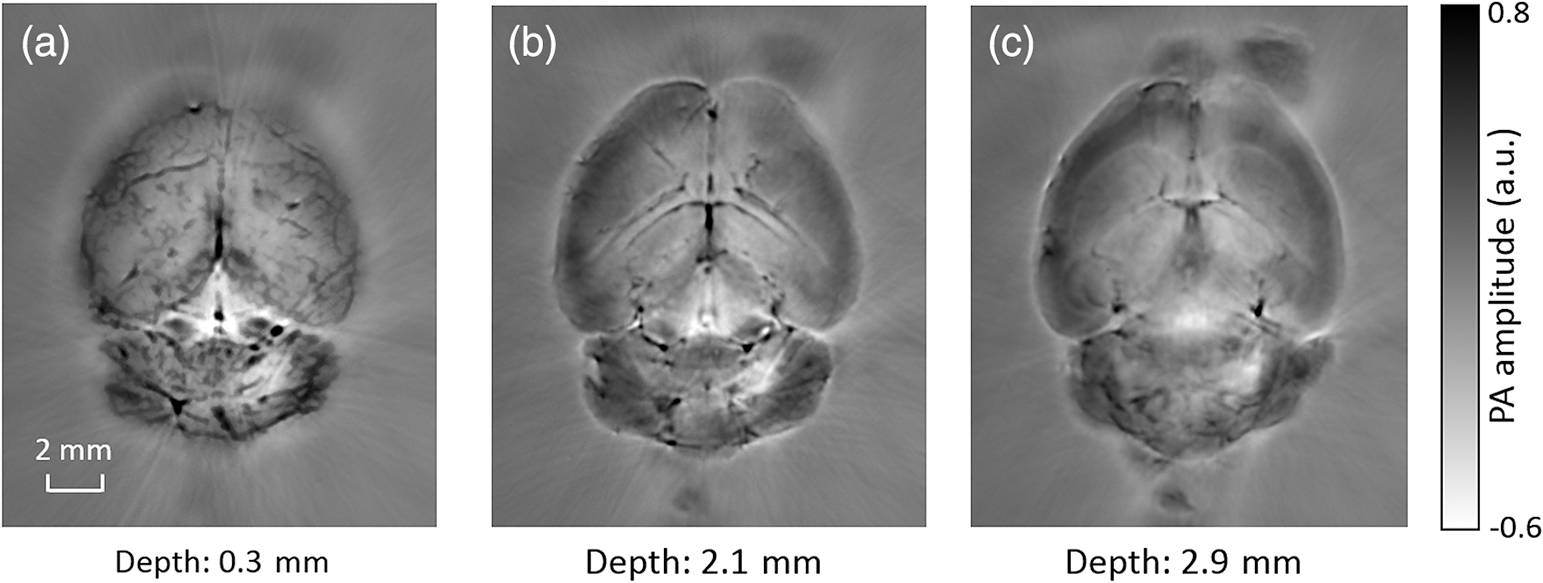 Nevertheless, the main hindrance to imaging the structure of the brain in vivo is the bone effect. Figure 3(b) shows that removing just the top skulls would not help us much. In fact, the top skulls removal created irregular bone boundaries, which further distorted the acoustic wave. Compared to the top skulls, the side skulls are thicker and have more complex structures. side bones have a stronger effect on the PA signal, because of our signal detection geometry (Fig. 1). To address this issue, there are two possible approaches. First, we can thin the skull to mitigate the acoustic distortion. Top-skull thinning is routinely applied in confocal or two-photon microscopy.58,59 Thinning the side skulls may require special attention to avoid loss of blood. Second, the acoustic properties of the head can be incorporated into PACT image reconstruction. This will require accurate measurement of the skull’s geometry and acoustic properties, which can be achieved with other imaging modalities. For example, by using x-ray CT, the skull morphology and composition can be obtained and incorporated into a time-reversal-based reconstruction algorithm to correct for the skull distortion.60 Ultrasound tomography (UST) has also been integrated into PACT to measure the acoustic properties, which were then used to inform the PACT image reconstruction.61 With continuing advances in imaging techniques and reconstruction algorithms, we believe PACT will soon allow in vivo imaging of the deep brain in addition to the cortex. In summary, we have experimentally demonstrated, for the first time, that PACT is able to provide label-free imaging of whole mouse brain structures in the absence of the side skulls, with MRM image quality. As a quantitative imaging modality, PACT can spectrally differentiate different chromophores (cytochromes and lipid) in brain tissue by virtue of its optical absorption contrast. As a deep imaging modality, PACT can resolve deep structures of the brain owing to its high-ultrasonic resolution. With these merits, we expect PACT to be applied to more brain structural and functional studies in the future. AcknowledgmentsThe authors appreciate Prof. James Ballard’s close reading of the manuscript, and thank Ernie Gonzales, Dr. Junjie Yao, Dr. Chi Zhang, and Chiye Li for their useful discussion and technical assistance. This work was sponsored in part by the National Institutes of Health (NIH) Grant Nos. DP1 EB016986 (NIH Director’s Pioneer Award), R01 CA186567 (NIH Director’s Transformative Research Award), U01 NS090579 (BRAIN Initiative), and R01 EB016963. L. V. Wang has a financial interest in Microphotoacoustics, Inc., which, however, did not support this work. L. V. Wang has a financial interest in Endra, Inc., and Microphotoacoustics, Inc., which, however, did not support this work. The other authors declare no competing financial interests. ReferencesJ. D. Pollock,
“Deep imaging technology needed for NIH BRAIN initiative,”
J. Biomed. Opt., 19
(3), 030601
(2014). http://dx.doi.org/10.1117/1.JBO.19.3.030601 Google Scholar
N. Chuang et al.,
“An MRI-based atlas and database of the developing mouse brain,”
NeuroImage, 54 80
–89
(2011). http://dx.doi.org/10.1016/j.neuroimage.2010.07.043 Google Scholar
D. N. Guilfoyle et al.,
“Functional connectivity fMRI in mouse brain at 7 T using isoflurane,”
J. Neurosc. Methods, 214 144
–148
(2013). http://dx.doi.org/10.1016/j.jneumeth.2013.01.019 Google Scholar
J. Ellegood et al.,
“Neuroanatomical analysis of the BTBR mouse model of autism using magnetic resonance imaging and diffusion tensor imaging,”
NeuroImage, 70 288
–300
(2013). http://dx.doi.org/10.1016/j.neuroimage.2012.12.029 Google Scholar
D. Wu et al.,
“Localized diffusion magnetic resonance micro-imaging of the live mouse brain,”
NeuroImage, 91 12
–20
(2014). http://dx.doi.org/10.1016/j.neuroimage.2014.01.014 Google Scholar
F. Calamante et al.,
“Super-resolution track-density imaging studies of mouse brain: comparison to histology,”
NeuroImage, 59 286
–296
(2012). http://dx.doi.org/10.1016/j.neuroimage.2011.07.014 Google Scholar
D. Wu et al.,
“In vivo high-resolution diffusion tensor imaging of the mouse brain,”
NeuroImage, 83 18
–26
(2013). http://dx.doi.org/10.1016/j.neuroimage.2013.06.012 Google Scholar
Y. Jiang and G. A. Johnson,
“Microscopic diffusion tensor atlas of the mouse brain,”
NeuroImage, 56 1235
–1243
(2011). http://dx.doi.org/10.1016/j.neuroimage.2011.03.031 Google Scholar
R. Yuste and W. Denk,
“Dendritic spines as basic functional units of neuronal integration,”
Nature, 375 682
–684
(1995). http://dx.doi.org/10.1038/375682a0 Google Scholar
E. S. Boyden et al.,
“Millisecond-timescale, genetically targeted optical control of neural activity,”
Nat. Neurosci., 8 1263
–1268
(2005). http://dx.doi.org/10.1038/nn1525 Google Scholar
F. Zhang et al.,
“Multimodal fast optical interrogation of neural circuitry,”
Nature, 446 633
–U634
(2007). http://dx.doi.org/10.1038/nature05744 Google Scholar
V. Gradinaru et al.,
“Optical deconstruction of parkinsonian neural circuitry,”
Science, 324 354
–359
(2009). http://dx.doi.org/10.1126/science.1167093 Google Scholar
T. E. Matthews et al.,
“In vivo and ex vivo epi-mode pump-probe imaging of melanin and microvasculature,”
Biomed. Opt. Express, 2 1576
–1583
(2011). Google Scholar
C. W. Freudiger et al.,
“Label-free biomedical imaging with high sensitivity by stimulated Raman scattering microscopy,”
Science, 322 1857
–1861
(2008). http://dx.doi.org/10.1126/science.1165758 Google Scholar
L. Cai, N. Friedman and X. S. Xie,
“Stochastic protein expression in individual cells at the single molecule level,”
Nature, 440 358
–362
(2006). http://dx.doi.org/10.1038/nature04599 Google Scholar
A. Y. Shih et al.,
“Two-photon microscopy as a tool to study blood flow and neurovascular coupling in the rodent brain,”
J. Cereb. Blood Flow Metab., 32 1277
–1309
(2012). http://dx.doi.org/10.1038/jcbfm.2011.196 Google Scholar
H. P. Lu, L. Y. Xun and X. S. Xie,
“Single-molecule enzymatic dynamics,”
Science, 282 1877
–1882
(1998). http://dx.doi.org/10.1126/science.282.5395.1877 Google Scholar
L. H. V. Wang and S. Hu,
“Photoacoustic tomography: in vivo imaging from organelles to organs,”
Science, 335 1458
–1462
(2012). http://dx.doi.org/10.1126/science.1216210 Google Scholar
J. Xia, J. J. Yao and L. H. V. Wang,
“Photoacoustic tomography: principles and advances (invited review),”
Prog. Electromagn. Res., 147 22
(2014). http://dx.doi.org/10.2528/PIER14032303 Google Scholar
V. Ntziachristos et al.,
“Looking and listening to light: The evolution of whole-body photonic imaging,”
Nat. Biotechnol., 23 313
–320
(2005). http://dx.doi.org/10.1038/nbt1074 Google Scholar
P. Beard,
“Biomedical photoacoustic imaging,”
Interface Focus, 1 602
–631
(2011). http://dx.doi.org/10.1098/rsfs.2011.0028 Google Scholar
D. Razansky et al.,
“Multispectral opto-acoustic tomography of deep-seated fluorescent proteins in vivo,”
Nat. Photonics, 3 412
–417
(2009). http://dx.doi.org/10.1038/nphoton.2009.98 Google Scholar
D. Razansky, A. Buehler and V. Ntziachristos,
“Volumetric real-time multispectral optoacoustic tomography of biomarkers,”
Nat. Protoc., 6 1121
–1129
(2011). http://dx.doi.org/10.1038/nprot.2011.351 Google Scholar
J. Xia et al.,
“Whole-body ring-shaped confocal photoacoustic computed tomography of small animals in vivo,”
J. Biomed. Opt., 17
(5), 050503
(2012). http://dx.doi.org/10.1117/1.jbo.17.5.050506 Google Scholar
J. Gamelin et al.,
“A real-time photoacoustic tomography system for small animals,”
Opt. Express, 17 10489
–10498
(2009). http://dx.doi.org/10.1364/OE.17.010489 Google Scholar
X. D. Wang et al.,
“Noninvasive laser-induced photoacoustic tomography for structural and functional in vivo imaging of the brain,”
Nat. Biotechnol., 21 803
–806
(2003). http://dx.doi.org/10.1038/nbt839 Google Scholar
L.-D. Liao et al.,
“Imaging brain hemodynamic changes during rat forepaw electrical stimulation using functional photoacoustic microscopy,”
NeuroImage, 52 562
–570
(2010). http://dx.doi.org/0.1016/j.neuroimage.2010.03.065 Google Scholar
J. Xia et al.,
“Three-dimensional photoacoustic tomography based on the focal-line concept,”
J. Biomed. Opt., 16
(9), 090505
(2011). http://dx.doi.org/10.1117/1.3625576 Google Scholar
M. H. Xu and L. H. V. Wang,
“Universal back-projection algorithm for photoacoustic computed tomography,”
Phys. Rev. E, 71 7
(2005). http://dx.doi.org/10.1103/PhysRevE.71.016706 Google Scholar
Q. Sheng et al.,
“Photoacoustic computed tomography without accurate ultrasonic transducer responses,”
Proc. SPIE, 9323 932313
(2015). http://dx.doi.org/10.1117/12.2081056 Google Scholar
L. Wang,
“Photoacoustic tomography,”
Scholarpedia, 9
(2), 10278
(2014). http://dx.doi.org/10.4249/scholarpedia.10278 Google Scholar
Y. Jiang et al.,
“Blood oxygen flux estimation with a combined photoacoustic and high-frequency ultrasound microscopy system: a phantom study,”
J. Biomed. Opt., 17
(3), 036012
(2012). http://dx.doi.org/10.1117/1.jbo.17.3.036012 Google Scholar
A. Ray et al.,
“Lifetime-based photoacoustic oxygen sensing in vivo,”
J. Biomed. Opt., 17
(5), 057004
(2012). http://dx.doi.org/10.1117/1.jbo.17.5.057004 Google Scholar
L. Li et al.,
“Fully motorized optical-resolution photoacoustic microscopy,”
Opt. Lett., 39 2117
–2120
(2014). http://dx.doi.org/10.1364/ol.39.002117 Google Scholar
S. E. Forest and J. D. Simon,
“Wavelength-dependent photoacoustic calorimetry study of melanin,”
Photochem. Photobiol., 68 296
–298
(1998). Google Scholar
J. A. Viator et al.,
“A comparative study of photoacoustic and reflectance methods for determination of epidermal melanin content,”
J. Investig. Dermatol., 122 1432
–1439
(2004). http://dx.doi.org/10.1111/j.0022-202X.2004.22610.x Google Scholar
M. Szakall et al.,
“On the pressure dependent sensitivity of a photoacoustic water vapor detector using active laser modulation control,”
Infrared Phys. Technol., 48 192
–201
(2006). http://dx.doi.org/10.1016/j.infrared.2006.01.002 Google Scholar
Z. Xu, Q. Zhu and L. V. Wang,
“In vivo photoacoustic tomography of mouse cerebral edema induced by cold injury,”
J. Biomed. Opt., 16
(6), 066020
(2011). http://dx.doi.org/10.1117/1.3584847 Google Scholar
T. J. Allen et al.,
“Spectroscopic photoacoustic imaging of lipid-rich plaques in the human aorta in the 740 to 1400 nm wavelength range,”
J. Biomed. Opt., 17
(6), 061209
(2012). http://dx.doi.org/10.1117/1.jbo.17.6.061209 Google Scholar
B. Wang et al.,
“Intravascular photoacoustic imaging of lipid in atherosclerotic plaques in the presence of luminal blood,”
Opt. Lett., 37 1244
–1246
(2012). Google Scholar
P. Wang et al.,
“Mapping lipid and collagen by multispectral photoacoustic imaging of chemical bond vibration,”
J. Biomed. Opt., 17
(9), 096010
(2012). http://dx.doi.org/10.1117/1.jbo.17.9.096010 Google Scholar
M. R. Bugs and M. L. Cornelio,
“Analysis of the ethidium bromide bound to DNA by photoacoustic and FTIR spectroscopy,”
Photochem. Photobiol., 74 512
–520
(2001). http://dx.doi.org/10.1562/0031-8655(2001)074<0512:aotebb>2.0.co;2 Google Scholar
M. R. Bugs and M. L. Cornelio,
“A new biophysics approach using photoacoustic spectroscopy to study the DNA-ethidium bromide interaction,”
Eur. Biophys. J. Biophys. Lett., 31 232
–240
(2002). http://dx.doi.org/10.1007/s00249-002-0205-7 Google Scholar
D. K. Yao et al.,
“In vivo label-free photoacoustic microscopy of cell nuclei by excitation of DNA and RNA,”
Opt. Lett., 35 4139
–4141
(2010). http://dx.doi.org/10.1364/ol.35.004139 Google Scholar
C. Di Primo et al.,
“Origin of the photoacoustic signal in cytochrome p-450(cam): Role of the Arg186-Asp251-Lys178 bifurcated salt bridge,”
Biochemistry, 36 112
–118
(1997). http://dx.doi.org/10.1021/bi961508a Google Scholar
C. Zhang et al.,
“Label-free photoacoustic microscopy of cytochromes,”
J. Biomed. Opt., 18
(2), 020504
(2013). http://dx.doi.org/10.1117/1.jbo.18.2.020504 Google Scholar
G. S. Scott Brady, R. Wayne Albers and D. Price, Basic Neurochemistry: Molecular, Cellular and Medical Aspects, 01803 7th ed.Elsevier Academic Press, Burlington, Massachusetts
(2006). Google Scholar
Y. Ma et al,
“In vivo 3D digital atlas database of the adult C57BL/6J mouse brain by magnetic resonance microscopy,”
Front. Neuroanat., 2 10
(2008). http://dx.doi.org/10.3389/neuro.05.001.2008 Google Scholar
J. C. Sutherland and K. P. Griffin,
“Absorption-spectrum of DNA for wavelengths greater than 300-nm,”
Radiat. Res., 86 399
–410
(1981). http://dx.doi.org/10.2307/3575456 Google Scholar
W. L. Lin et al.,
“An absolute measurement of brain water content using magnetic resonance imaging in two focal cerebral ischemic rat models,”
J. Cereb. Blood Flow Metab., 20 37
–44
(2000). http://dx.doi.org/10.1097/00004647-200001000-00007 Google Scholar
M. Picard and B. S. McEwen,
“Mitochondria impact brain function and cognition,”
Proc. Natl. Acad. Sci. U. S. A., 111 7
–8
(2014). http://dx.doi.org/10.1073/pnas.1321881111 Google Scholar
A. V. Brusnichkin et al.,
“Ultrasensitive label-free photothermal imaging, spectral identification, and quantification of cytochrome c in mitochondria, live cells, and solutions,”
J. Biophotonics, 3 791
–806
(2010). http://dx.doi.org/10.1002/jbio.201000012 Google Scholar
M. Tanaka et al.,
“Connexin43 and bergmann glial gap junctions in cerebellar function,”
Front. Neurosci., 2 225
–233
(2008). http://dx.doi.org/10.3389/neuro.01.038.2008 Google Scholar
S. Kim et al.,
“Enhanced delineation of white matter structures of the fixed mouse brain using Gd-DTPA in microscopic MRI,”
NMR Biomed., 22 303
–309
(2009). http://dx.doi.org/10.1002/nbm.1324 Google Scholar
J. Hui et al.,
“Bond-selective photoacoustic imaging by converting molecular vibration into acoustic waves,”
Photoacoustics, 4 11
–21
(2016). http://dx.doi.org/10.1016/j.pacs.2016.01.002 Google Scholar
D. F. Marker et al.,
“A thin-skull window technique for chronic two-photon in vivo imaging of murine microglia in models of neuroinflammation,”
J. Visualized Exp.,
(43), 2059
(2010). http://dx.doi.org/10.3791/2059 Google Scholar
G. Yang et al.,
“Thinned-skull cranial window technique for long-term imaging of the cortex in live mice,”
Nat. Protoc., 5 201
–208
(2010). http://dx.doi.org/10.1038/nprot.2009.222 Google Scholar
C. Huang et al.,
“Aberration correction for transcranial photoacoustic tomography of primates employing adjunct image data,”
J. Biomed. Opt., 17
(6), 066016
(2012). http://dx.doi.org/10.1117/1.jbo.17.6.066016 Google Scholar
J. Xia et al.,
“Enhancement of photoacoustic tomography by ultrasonic computed tomography based on optical excitation of elements of a full-ring transducer array,”
Opt. Lett., 38 3140
–3143
(2013). http://dx.doi.org/10.1364/ol.38.003140 Google Scholar
BiographyLei Li received his BS and MS degrees from Harbin Institute of Technology, China, in 2010 and 2012, respectively. He is working as a graduate research assistant under the tutelage of Dr. Lihong Wang at Washington University. His research interests include PA microscopy and tomography, especially improving the PA imaging speed and applying it on brain functional and structural imaging. Jun Xia received his PhD from the University of Toronto. Currently, he is a postdoctoral fellow at Washington University in St. Louis, under the mentorship of Dr. Lihong V. Wang. His research interests include the development of novel biomedical imaging techniques including PA, photothermal, and ultrasonic imaging. He has published more than 20 peer-reviewed journal articles in PA and photothermal research. Guo Li received his BS degree in mechanical engineering and his MS degree in engineering physics from Tsinghua University. Currently, he is a graduate student at Washington University in St. Louis and a research assistant in Dr. Lihong V. Wang’s laboratory. His research interests include high-frequency linear-array PA imaging. Alejandro Garcia-Uribe received his MSc and PhD degrees in electrical engineering from the Department of Electrical and Computer Engineering, Texas A&M University, College Station, Texas, USA. Currently, he is a research scientist at the Optical Imaging Laboratory, Department of Biomedical Engineering, Washington University in St. Louis. His research interests include biomedical optics, biomedical image analysis, microsensors, and digital signal processing. Qiwei Sheng received his PhD in applied mathematical and computational sciences from the University of Iowa. Currently, he is a research assistant at the Computational Bioimaging Laboratory, Washington University in St. Louis. His research interests include image reconstruction methods for PA and UST, numerical methods for partial differential equation, and inverse problems. Mark A. Anastasio received his PhD from the University of Chicago. Currently, he is a professor of biomedical engineering at Washington University in St. Louis. His research interests include tomographic image reconstruction, imaging physics, and the development of novel-computed biomedical imaging systems. He has conducted extensive research in the fields of diffraction tomography, x-ray phase-contrast x-ray imaging, and PAT. Lihong V. Wang received his PhD from Rice University, Houston, Texas, USA. Currently, he holds the Gene K. Beare distinguished professorship of biomedical engineering at Washington University in St. Louis. He has published 342 peer-reviewed journal articles and delivered 370 keynote, plenary, or invited talks. His Google Scholar h-index and citations have reached 81 and over 26,000, respectively. |