|
|
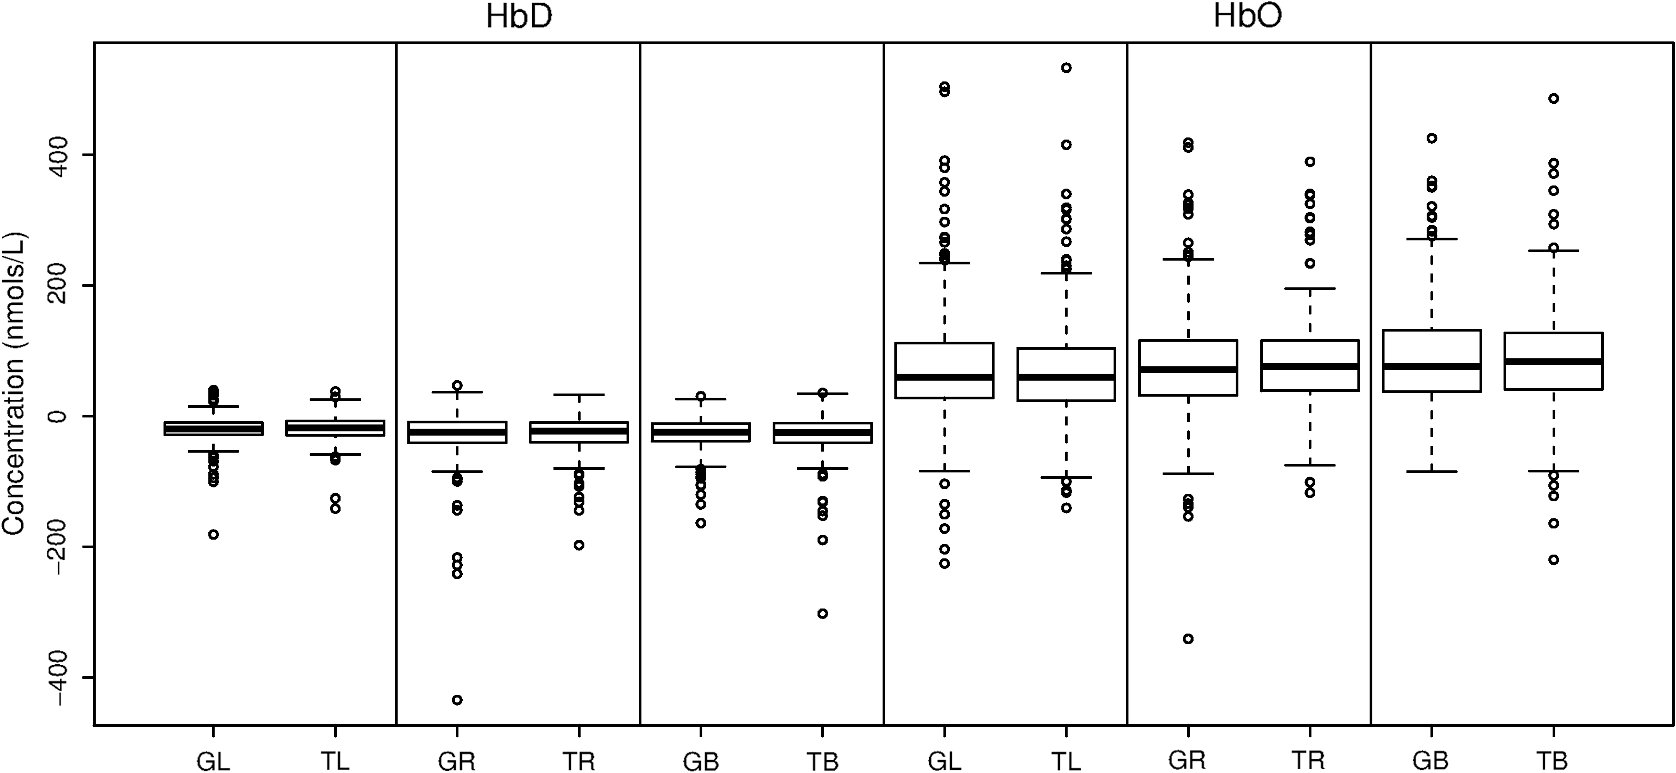
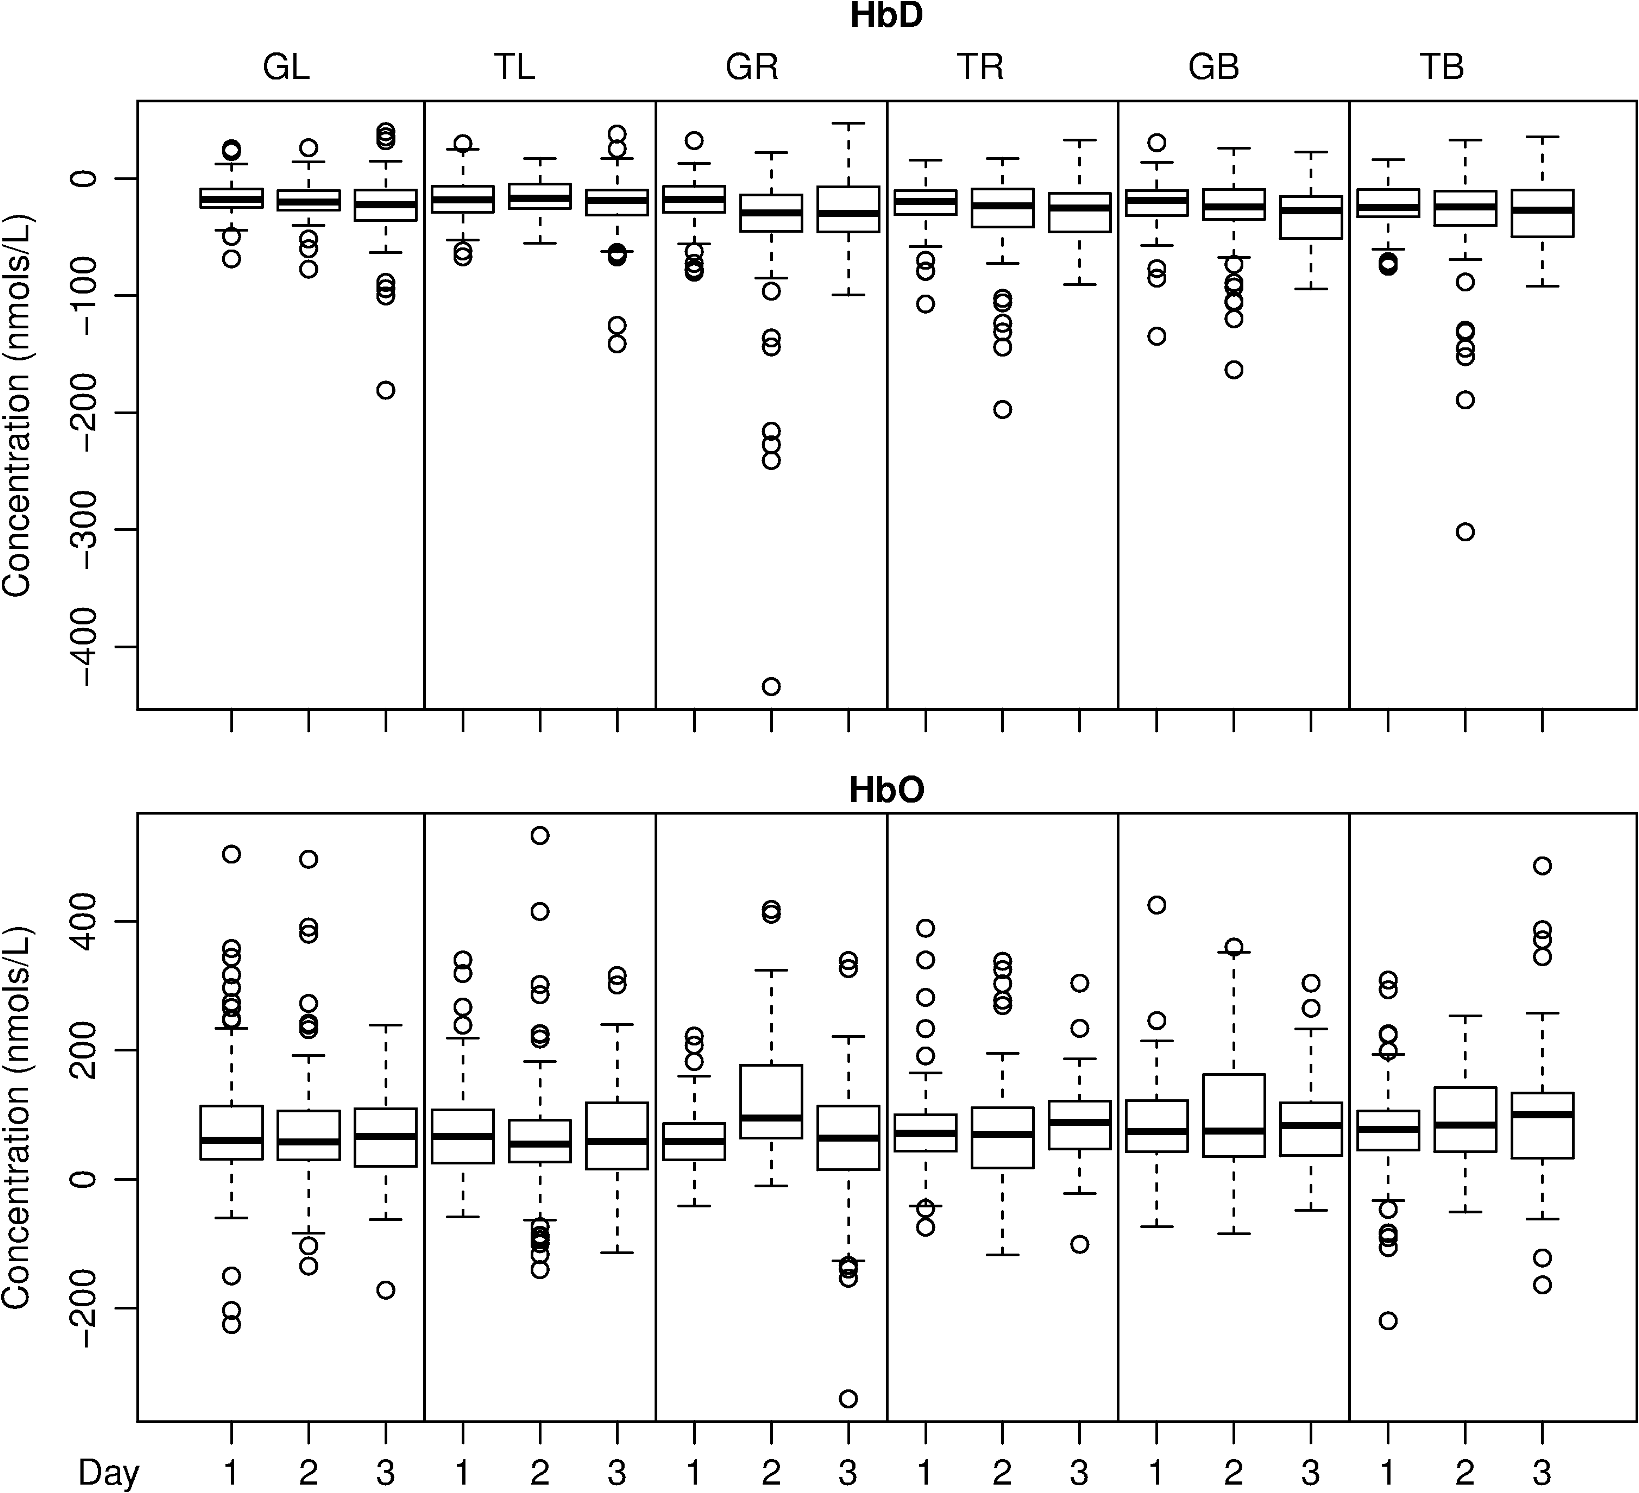
1.IntroductionNear-infrared spectroscopy (NIRS) is a noninvasive imaging modality. As its name suggests, NIRS is based in the infrared portion of the electromagnetic spectrum that overlaps the visible range. The term spectroscopy refers to the fact that multiple wavelengths are used to determine a composition. NIRS operates using a combination of sources that emit light between and 950 nm and photon detectors that measure light intensity at a given distance from the sources. Changes in the concentration of the oxygen-transport molecule and hemoglobin, can be determined for biological tissues between each near-infrared (NIR) source and detector. These changes in hemoglobin concentration are related to neuronal activation, or consumption, within the region-of-interest (ROI) of the motor cortex; thus, NIRS can be used for monitoring the cortical function. When a stimulus is used to trigger activation in a region of the brain, this modality is known as functional near-infrared spectroscopy (fNIRS). Within this particular range of wavelengths, the amount of light that biological tissue absorbs is quite low. On the other hand, the same biological tissue will highly scatter these low-energy photons. Thus, unlike x-rays, NIR photons are not directly transmitted through tissue. Obrig1 considers NIRS to be a promising tool for the assessment of neurological fields so as to develop indications for use beyond feasibility. There is a potential for using NIRS to monitor and assist a rehabilitation from motor dysfunction in a physical therapy clinic. Additionally, NIRS’ portability and compact size make the system feasible and user-friendly that other larger equipment such as magnetic resonance imaging (MRI) cannot offer. This allows increased privacy, convenience and requires no preparation for the patient. Time-to-diagnosis at the point-of-care can be decreased, thus reducing resource utilization. Imaging research with stroke rehabilitation and the neurological changes occurring when blood supply is blocked can be descriptive but does not characterize changes in function. Most often, blockages in the middle cerebral artery can lead to loss of sensation and motor control over the contralateral side of the body,2 and loss of sensory motor function in the upper limbs results from of strokes.3 Kato et al.4 compared fNIRS and fMRI for detection and monitoring of cortical motor organization following hemiparesis. They found that movement of the affected hand activated motor cortex bilaterally rather than in just the contralateral hemisphere. Miyai et al.5 utilized NIRS to study hemiparetic gait of poststroke patients using a treadmill before and after 2 months of rehabilitation and confirmed improvement in hemispheric asymmetry that correlated with improved gait. Applications of fNIRS in stroke rehabilitation permits monitoring of neural activity during various experimental therapies.6 This allows personalizing the rehabilitation to each patient. In a similar vein, it has been suggested to employ real-time imaging either during or immediately before and after the therapy.7 In fact, Mihara et al.8 found greater cortical activation and functional gain in the hands for poststroke patients that were provided direct feedback of their fNIRS signals. Another application for NIRS is with brain–computer interface (BCI). It has been proposed that cortical activation during imaginary movement (motor imagery) can be utilized in an optical BCI, which can then be used to control a robotic splint or a virtual environment to give the patient positive feedback.3 Sagara et al.9 based upon the methods of Haida et al.10 developed a portable NIRS-based BCI to control television programming or propel a toy robot. Furthermore, fNIRS data can be combined with other physiological signals—heart and respiration rate, blood pressure (BP), and skin conductance—as a step toward developing a real-time BCI for controlling a virtual reality robot. As with all imaging modalities, fNIRS offers strengths and opportunities for research. Much work is needed to develop clinical standards for both collecting and analyzing fNIRS data. Our study is aimed at assessing the hemodynamic concentration changes at the primary and premotor motor cortices in adults during whole-hand grasping and sequential finger-opposition (tapping) tasks. We investigated the: (1) sensitivity of fNIRS for detecting changes in hemoglobin (cortical activation) levels from various stimulus types: tapping versus grasping and (2) reproducibility of these measurements with repetition. 2.Materials and Methods2.1.InstrumentationA continuous wave, single phase, compact NIRScout imaging system (NIRx Medical Technologies LLC)—with eight 760- and 850-nm wavelength light-emitting diode sources (power: ) and 12 Si photodiode detectors (sensitivity and dynamic range: , 90 dB)—was used to measure changes in oxy-hemoglobin (HbO) and deoxy-hemoglobin (HbD) at a sampling rate of 6.25 Hz. Changes in concentration of both HbO and HbD were defined as the differences between an average baseline and a stimulus-induced peak. Event markers were synchronized with visual cues, routed through the NIRScout system, and recorded using NIRStar 12.4 during the data collection process. This promoted consistent data analysis. With the aid of a retaining cap, all sources and detectors (optodes) were arranged to overlie the left and right regions of the motor cortex (Fig. 1). Our arrangement resulted in a total of 36 nearest-neighbor and second nearest-neighbor measurement channels with an average source–detector separation of . Fig. 1(a) Sources (gray) and detectors (white) layout for both hemispheres based on 10 to 20 system (denoted by color coded borders) to give a total of eight sources and 12 detectors. (b) Illustration of (i) finger-opposition and (ii) grasping tasks trials. A total of eight cycles were used for each trial. This included tasks for right-hand, left-hand, and both for a total of six trials each day.  2.2.Experimental ProtocolStimulation of the motor cortex was achieved via either sequential finger-opposition or whole-hand grasping (Fig. 1). Participants were asked to be consistent during the task while keeping the rest of their body still. As validated before, no significant differences in oxygenation changes occur between 1 and 4.5 Hz,11 in the current paradigm, the frequency of grasping or tapping was regulated by the participants and at a speed with which they felt comfortable, as is usually the case in a clinical setting. Presentation (Neurobehavioral Systems, Inc.) software was utilized in the creation and execution of the visual cues. The protocol began with a 1-min black screen on which a central fixation cross was present as a baseline. This served as an initial baseline measure. The cross then switched to the word “tap” that was displayed in the center of the screen for 10 s. The participant was instructed to perform the appropriate task during this period of time. Following each “tap” segment was another 20 s of the fixation cross. The fixation cross was used as the resting state (sham stimulus). This tap-cross pattern repeated several times to give a total of eight stimulus-baseline cycles for each 5-min trial. These eight cycles enabled eight observations per hand-motion combination. Three trials were conducted for each type of hand motion: both hands, right-only, and left-only (finger-opposition and hand grasping totaling ). Immediately prior to each trial, the participant was told which hand movement task to perform and on which hand(s). One complete experimental run consisted of a randomized set of all six hand-motion combinations. One run was performed on three separate days/sessions in order to give a total of 18 trials and 144 stimulus events per subject. NIRS signals fluctuate, even during a resting state, which is the reason that a long initial baseline was chosen.12,13 2.3.Participant and PreparationA total of 10 participants (, ) were recruited at Wright State University. Half were female () and the other half were male (), and all were right-hand dominant. Participants with a variety of hair types were included in this study. The experimental protocol was approved by the Internal Review Board at Wright State University and informed consent was obtained from each participant prior to involvement in the study. Subjects were seated in front of a computer monitor and their heads were supported by a chin rest. After an optode retaining cap was placed on the subject’s head and centered, clear saline electrode gel was applied in order to enhance the signal quality by keeping the hair aside and improving optode contact with the skin. The gel application process allows hair to be pushed and kept aside before inserting optodes into the cap. Measurements were taken in a quiet and darkened room. A large, fleece cap was placed over the subject’s head to further reduce any outside light that could possibly strike the detectors. Each participant was asked to focus on a cross at the center of a computer monitor during data collection while remaining silent and as still as possible, aside from the hand movement tasks. 2.4.Data AnalysisRaw data were processed using the functions of Homer214,15—MATLAB-based (The Mathworks, Inc.) analysis tool and used to extract relevant values such as peak and baseline concentrations. First, a wavelet filter with tuning parameter 16–18 was applied to the data. Wavelet filtering was chosen due to its reported stability, consistency, and effectiveness for reduction of motion artifacts and low-frequency oscillations. Following application of the wavelet filter to each dataset, a simple 0.01 to 0.5 Hz bandpass filter was also used. This allowed elimination of low-frequency system drift and physiological noise such as heart rate without removing artifacts that may be stimulus-induced. Filtered signals were translated to changes of hemoglobin concentration using the modified Beer–Lambert law. Differential pathlength factor values for this region and a mean age of 23.8 years were estimated to be 6.14 and 5.09 for wavelengths of 760 and 850 nm, respectively, based upon calculations from previous studies.19,20 2.5.Statistical AnalysisQuantitative statistical analysis of hemoglobin concentration changes between baseline and peak was performed on the most consistent optode channel for each participant from the left and (equivalent) right hemisphere. This was largely done to seek out data that are artifact free and are consistent. Subject heterogeneity and head sizes vary and therefore recordings may not always come from the same specific ROI. As our aims were to detect grasp and finger movement related fNIRS changes over a consistent 3-day period, this methodology was thought to be appropriate for comparison. Here, baseline is defined as the average concentration during the 10-s period before each visual cue; peak is defined as the extremum reached between 5 and 15 s after the cue. The signal for single hand tasks was measured in the opposite hemisphere. The signal for tasks performed with both hands was the average signal over both hemispheres. Mixed effects linear regression was used with a random subject intercept to estimate the signal pooled over days and by day. Grasping versus tapping tasks were compared, adjusted for day, if the interaction was not statistically significant. This was performed on both the individual and group levels. All tests were two-sided and performed at the level. PROC MIXED in SAS 9.3 (SAS Institute Inc., 2010. SAS Version 9.3. SAS Institute Inc., Cary, North Carolina) was used to fit all models. 3.Results3.1.Hemodynamic ResponseAn example of the elicited hemodynamic responses for one participant is shown in Fig. 2. The largest number of events and channels in which a hemodynamic response was observed occurred for subjects 1 and 2. Both subject 6 and subject 7 also had more than 40 events in which a response was observed. Subjects 5 and 8 had the fewest number of events showing activation. The fewest total active channels were seen with subjects 8 and 10, which were followed closely by subjects 4 and 5. For a visual comparison, these data are shown in Fig. 3, in which they are also broken down by session. Fig. 2Typical hemodynamic responses for three trials of the finger-opposition task—one from each data collection session. All eight stimulus events from each trial are overlaid on a single graph for a representative channel. HbO curves range from red (first event) to yellow (eighth event) and HbD curves range from blue to green. The shaded region indicates the duration of the stimulus. 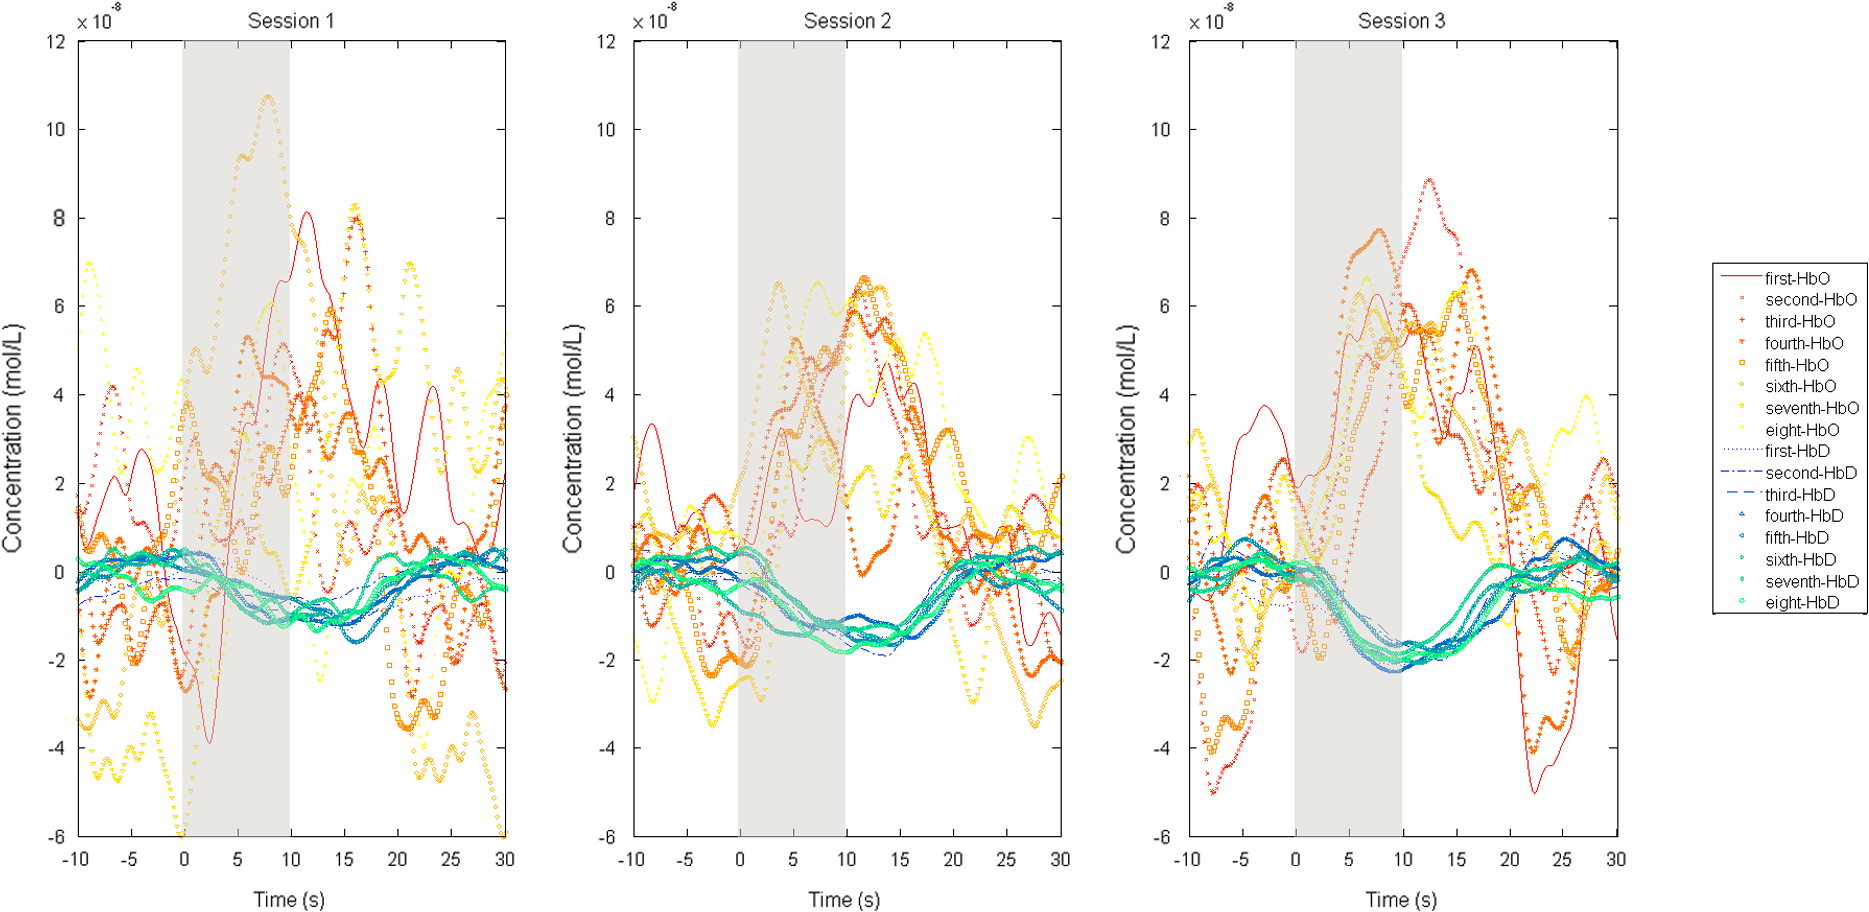 Fig. 3Summary of qualitative statistics for motor cortex trials. A total of 48 motor cortex stimulation events were analyzed for each of 10 participants. Each event possessed a total of 36 possible data channels to give a total of 1726 channels for each participant that were analyzed for the presence of an observable hemodynamic response. The number of (a) events and (b) channels in which a response was observed are illustrated. Note that the largest number of events and channels were obtained for the first two participants. 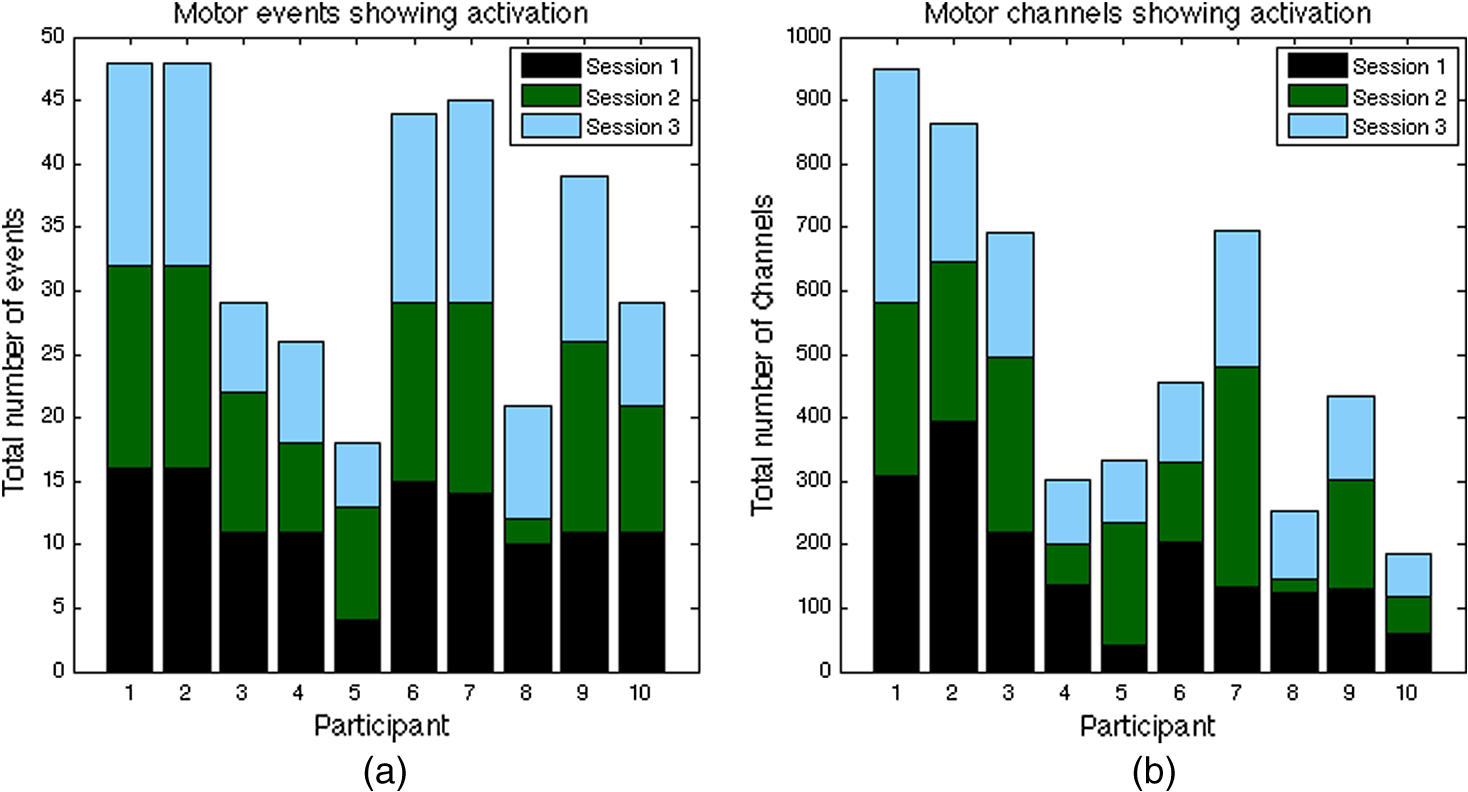 3.2.Motor Stimuli Statistics3.2.1.Individual levelFigures 4 and 5 show the signal magnitudes for tapping and grasping and across days/sessions, respectively, at the individual level. A significant difference () was not found between the levels of hemodynamic responses for whole-hand grasping and sequential finger-opposition (tapping). Significant differences in response levels occurred between data collection sessions in two participants. Fig. 4Summary of quantitative results obtained for task types using the most consistent motor cortex channel in each of the 10 participants. Associated error bars for the HbO (red) and HbD (blue) responses are given in black. Differences in response magnitudes did not reach significance () for any participant. 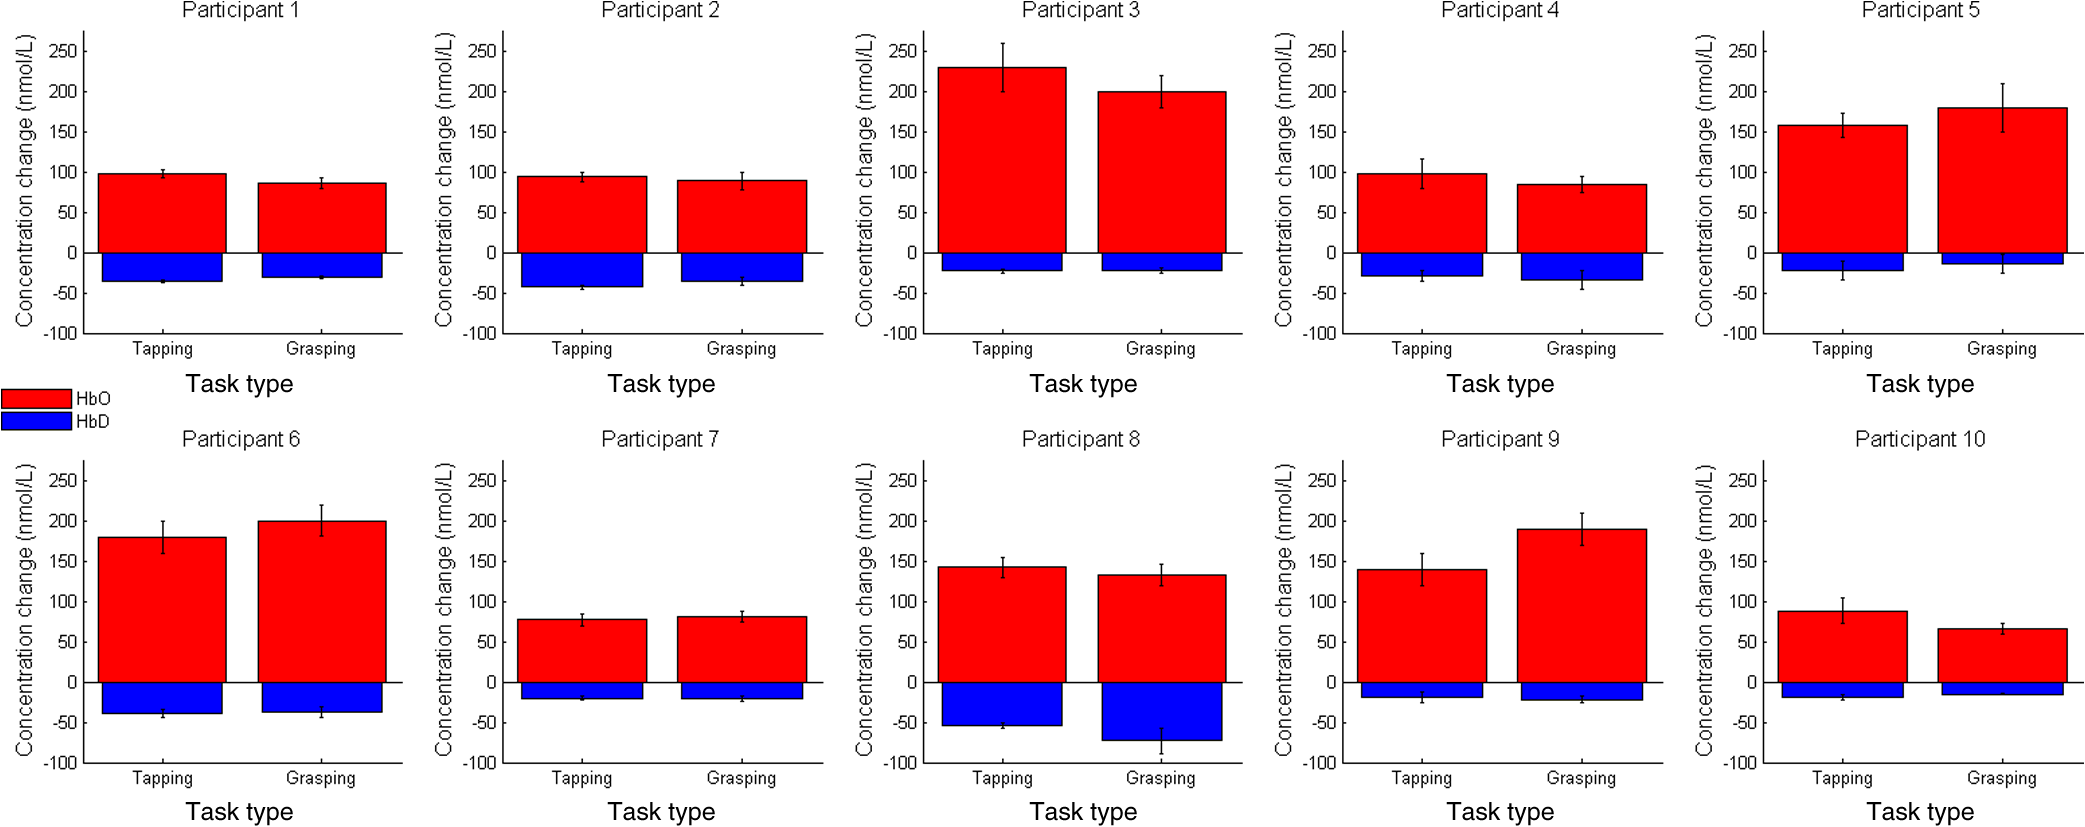 Fig. 5Summary of quantitative results obtained across the three data collection sessions for the most consistent motor cortex channel in each of the 10 participants. Associated error bars for the HbO (red) and HbD (blue) responses are given in black. Differences in response magnitudes for both HbO and HbD only reached significance () for 2 out of 10 participants.  3.2.2.Group levelStatistical results for the group are summarized in Table 1. There was no overall significant difference in hemodynamic response levels between motor tasks (Fig. 6). Signals were consistent across days/sessions for the group (Fig. 7). One exception was the difference in grasping and tapping HbO signals for the right hand. There was significant interaction (), with mean grasping and tapping signals significantly different on days 2 and 3, but not on day 1. Table 1Analysis of HbD and HbO concentration changes by signal, task, and hand across days/sessions.
Note: CB means confidence bound. 4.DiscussionThe present study aimed to assess the fNIRS signal activation at the primary and premotor motor cortices in adults during whole-hand grasping and sequential finger-opposition (tapping) tasks. Specifically, we investigated sensitivity and repeatability for each task to further assess the possibility of using fNIRS in physical rehabilitation tasks longitudinally. While the data for hand-grasping were noisier than the finger-opposition data they both were reliable for the best optode channel. Hand-grasping usually produces more bodily motion due to the fact that it is a more forceful movement. Finger-opposition, on the other hand, is a finer, more delicate movement. Additionally, it has been noted that these motor stimuli tend to slightly increase heart rate and, in turn, blood flow and oxygenation.21,22 This could contribute somewhat to the pronounced hemodynamic response that is observed for both types of motor stimuli, regardless of increased motion noise. It is common in functional studies of the motor cortex, especially those stimulated over a 20-s period, to see not one but two peaks in the HbO response curve.23–26 This phenomenon was indeed present in the results of six subjects for stimuli with only half that duration. However, it was observed that not all stimulus events exhibited a double peak in the HbO response; some only showed one. For the vast majority, the double peak remained after block averaging even when not present for every event. Some studies have also discovered evidence that the HbO response can begin a couple seconds prior to the stimulus itself, which has been attributed to mental simulation in preparation for the movement task.23,24 This prestimulation increase in HbO is not present in every event or even every subject, but does remain after block averaging for 6 out of 10 participants. It tends to appear as a small shoulder of the large peak observed at the actual onset of the stimulus. Further, Steinbrink et al.,27 Wolf et al.,23 and Jasdzewski et al.28 have noted that the HbD response began about 1.7 to 2 s after that of HbO within the motor cortex. Our results also confirm this finding. For the motor cortex, there is an evidence that hair thickness affects the hemodynamic response results. Subjects with coarse hair produced significantly different results than either those with fine hair (HbO) or with medium hair (HbD). A -value of 0.2750 was not enough evidence to conclude that hair color alone was a factor. However, the participants who had the darkest hair also had the coarsest. As such, there may be an underlying interaction between the two effects, but it cannot be investigated using the data from this series. Future studies could be specifically designed to investigate the possibility. fNIRS studies focusing on the motor cortex are quite prevalent. Subudhi et al.,29 e.g., compared oxygenation changes in three cortical regions—prefrontal, premotor, and motor—during maximal exercise. Ikegami and Taga30 observed that the amount of cortical activation was positively correlated with the level of kinetic movement. They also discovered a decrease in the sensorimotor cortex activation () as subjects learned the multijoint upper limb motor task, which was attributed to changes in motor commands. Hatakenaka et al.31 found that activation shifted posteriorly (from the presupplementary motor area to the supplementary motor area) with task repetition. These claims were further supported by the findings of Morihiro et al.32 They noted a decreasing tendency in the magnitude of HbO changes within the primary motor cortex, which suggested that the specific active areas of the brain change over the course of learning a motor task. Many motor cortex studies have also compared multiple modalities. Rather than utilizing fMRI as a tool to locate or confirm regions of high activation on individual subjects for fNIRS studies, one group actually used transcranial magnetic stimulation (TMS). During a hand-grasping task, Akiyama et al.33 utilized TMS to determine the specific area which had the highest activity prior to application of NIRS sources and detectors. Also, the use of fMRI in combination with fNIRS is quite common. Huppert et al.34 utilized NIRS simultaneously with each of two separate fMRI protocols: arterial spin labeling (ASL) and blood oxygen level-dependent (BOLD). High correlation was found between NIRS HbO and total hemoglobin measures and the cerebral blood flow measured via ASL fMRI. Similarly, high correlation was found between NIRS HbD response and the BOLD fMRI signal. Gagnon et al.35 investigated cortical versus superficial oxygenation changes elucidated from a finger tapping task during simultaneous fNIRS and BOLD fMRI. In addition, yet another group looked at cortical activation during apple peeling using fNIRS and fMRI. Real apple peeling was performed while fNIRS measurements were recorded; mock apple peeling was performed during concurrent fNIRS and fMRI recording. It was found that while the motor cortex showed activation in both cases, the prefrontal cortex only showed activation during the real case. This illustrates that fNIRS alone—as an alternative to fMRI—is promising for the study of cortical activation during everyday tasks. 4.1.Overall SensitivityNo significant differences were found in hemodynamic response levels between the two motor tasks for any study participant, which seems to indicate that using either task would be sufficient to study dysfunction in motor pathways. Choice of task could then be the decision of the study administrator with consideration given to each patient/subject; the sequential finger-opposition task is more complex, but the grasping task tends to create more bodily motion. 4.2.Regulation and Quality ControlProcedures and the reasoning behind them were given both verbally as well as briefly within the written consent form which each participant read and signed. Efforts were made by the experimenter, particularly during the first session, to provide all necessary explanations and prompt the participant to ask questions. However, some information may have been lost in translation or simply forgotten due to the sheer quantity received. Participants did remain quiet and, for the most part, still during data collection. A couple instances were noted when a participant shifted in the chair, although these instances were during rest periods of trials and the participant’s head did remain fixed on the chin rest. 4.3.Data Variability4.3.1.OscillationsIt has been demonstrated that mean BP is significantly greater in sitting and standing positions than it is while a person is lying down (supine). Although no significant change was seen in the mean baseline values of HbO, the magnitude of 0.1 Hz oscillations have been proven to be posture-dependent. These oscillations are greatest when standing and least when lying down, as a person would be during an MRI.36 For this study, subjects are in a seated position. This is a compromise between the magnitudes of spontaneous, regulatory BP oscillations—or Mayer waves. As such, care must be taken during analysis and when comparing results between studies and modalities that utilize another posture. In a clinical environment, a seated position is the most practical. Standing may allow greater alertness (i.e., focus on the stimulus), but is not necessarily comfortable for the patient during an exam. Standing also introduces a greater risk of motion artifacts. A supine position, which is used in MRI, would require more space and equipment in the clinic to ensure patient comfort. The increased comfort and motion artifact reduction that may result from a supine position could lead to significantly decreased alertness—especially in a quiet, darkened examination room. Some participants had a difficult enough time remaining alert when seated for the trials. Lying down would only make matters worse from this standpoint. Sitting in a chair allows a compromise between these factors (as well as the spontaneous, Mayer wave oscillations previously mentioned) and facilitates optode placement. As it has been noted in previous studies, low-frequency oscillations are common in NIRS data. Not only do these oscillations appear in the overall time series, but they can survive averaging over many stimulus events.21 Thus, care must be taken when filtering and processing fNIRS signals. Unfortunately, not everyone reports details on data processing steps. 4.3.2.Motion artifacts and noiseIt is rare to see a signal reported from a single stimulus response in scholarly articles. Instead, reported responses are generally averaged over a number of stimuli events, sessions, or even across subjects. While doing so reduces SNR, it does not allow one to see the true variability in the data. Individual responses are generally much noisier than data presented in scholarly articles. Looking at individual stimulus events, then, presents a challenge when trying to comment upon the repeatability of fNIRS measurements. This challenge can be compounded if a person moves during data collection. Motor cortex stimulation, e.g., requires some form of movement on the part of the subject (finger tapping, swallowing, etc.) which could introduce motion artifacts or other noise into the data. This was seen in the whole-hand grasping motion versus the sequential finger-opposition tasks for this project. Additionally, despite possession of various sizes of commercially available optode retaining caps, there were still difficulties in achieving a good fit. Even with a variety of cap sizes, there are bound to be adults who have a large quantity of hair or whose head shape does not correctly fit the caps. These subjects may require special modifications in order to obtain a snug fit. At times, the sheer quantity of hair significantly increased the amount of space between the cap and scalp. Further, there was one participant in this project whose head was rather flat near the crown. For this participant, extra straps were secured around the cap once the optodes were in place. Otherwise, many optodes would not have achieved contact with the scalp. Alternative to such modifications, a new optode holder could be designed that only covers the motor cortex region, but is adjustable to different head shapes and circumferences. Such a new design could also allow denser optode configurations. The design and production of such equipment could take a good deal of time to perfect—both in terms of creation and determining an ideal optode configuration. For this project, we chose the option of multiple cap sizes due to time constraints. Investigation of a new design, however, is currently underway. 5.ConclusionWe have shown that: (1) we can attain reproducible signals and (2) there is no significant difference between tapping and grasping tasks. This lack of difference in response levels between the two stimuli suggest that the same procedure could be used across a population, regardless of fine motor function. This contributes to fNIRS being a promising tool as a standalone prescreening and diagnosis within the clinical realm. However, a difference in measured activation levels across sessions indicates that there is room for improvement in terms of robustness. In order for fNIRS to be implemented within the realm of physical therapy, further optimization is needed before acceptable levels of repeatability can be reached. Since data processing methods have been well explored, this optimization would most likely include improvements in the hardware and experimental setup. An updated optode holder design, specific to the motor cortex, could possibly improve results as well. ReferencesH. Obrig,
“NIRS in clinical neurology—a ‘promising’ tool?,”
Neuroimage, 85 535
–546
(2014). http://dx.doi.org/10.1016/j.neuroimage.2013.03.045 NEIMEF 1053-8119 Google Scholar
F. Martini and J. L. Nath, Anatomy and Physiology, 2nd ed.Benjamin Cummings, San Francisco
(2010). Google Scholar
C. Dormer, T. Ward and S. McLoone,
“Towards enhanced biofeedback mechanisms for upper limb rehabilitation in stroke,”
(2008). Google Scholar
H. Kato et al.,
“Near-infrared spectroscopic topography as a tool to monitor motor reorganization after hemiparetic stroke: a comparison with functional MRI,”
Stroke, 33 2032
–2036
(2002). http://dx.doi.org/10.1161/01.STR.0000021903.52901.97 Google Scholar
I. Miyai et al.,
“Longitudinal optical imaging study for locomotor recovery after stroke,”
Stroke, 34 2866
–2870
(2003). http://dx.doi.org/10.1161/01.STR.0000100166.81077.8A Google Scholar
J. D. Schaechter,
“Motor rehabilitation and brain plasticity after hemiparetic stroke,”
Prog. Neurobiol., 73
(1), 61
–72
(2004). http://dx.doi.org/10.1016/j.pneurobio.2004.04.001 PGNBA5 0301-0082 Google Scholar
P.-Y. Lin et al.,
“Review: applications of near-infrared spectroscopy and imaging for motor rehabilitation in stroke patients,”
J. Med. Biol. Eng., 29 210
–211
(2009). Google Scholar
M. Mihara et al.,
“Near-infrared spectroscopy-mediated neurofeedback enhances efficacy of motor imagery-based training in poststroke victims: a pilot study,”
Stroke, 44 1091
–1098
(2013). http://dx.doi.org/10.1161/STROKEAHA.111.674507 Google Scholar
K. Sagara, K. Kido and K. Ozawa,
“Portable single-channel NRS-based BMI system for motor disabilities’ communication tools,”
in Annual Int. Conf. of the IEEE on Engineering in Medicine and Biology Society (EMBC 2009),
602
–605
(2009). Google Scholar
M. Haida et al.,
“Brain function of an ALS patient in complete locked-in state by using optical topography,”
The Frontier of Mind-Brain Science and its Practical Applications II, 95
–97 Hitachi Ltd., Tokyo
(2000). Google Scholar
N. Kuboyama et al.,
“Relationship between cerebral activity and movement frequency of maximal finger tapping,”
J. Physiol. Anthropol. Appl. Hum. Sci., 24 201
–208
(2005). http://dx.doi.org/10.2114/jpa.24.201 Google Scholar
Y. Hoshi et al.,
“Relationship between fluctuations in the cerebral hemoglobin oxygenation state and neuronal activity under resting conditions in man,”
Neurosci. Lett., 245 147
–150
(1998). http://dx.doi.org/10.1016/S0304-3940(98)00197-9 NELED5 0304-3940 Google Scholar
V. Toronov et al.,
“Near-infrared study of fluctuations in cerebral hemodynamics during rest and motor stimulation: temporal analysis and spatial mapping,”
Med. Phys., 27 801
–815
(2000). http://dx.doi.org/10.1118/1.598943 MPHYA6 0094-2405 Google Scholar
T. J. Huppert et al.,
“Homer: a review of time-series analysis methods for near-infrared spectroscopy of the brain,”
Appl. Opt., 48 D280
–D298
(2009). http://dx.doi.org/10.1364/AO.48.00D280 APOPAI 0003-6935 Google Scholar
T. J. Huppert,
“HomER: a review of time-series analysis methods for near-infrared spectroscopy of the brain,”
Appl. Opt., 48
(10), D280
–D298
(2009). http://dx.doi.org/10.1364/AO.48.00D280 Google Scholar
S. Brigadoi et al.,
“Motion artifacts in functional near-infrared spectroscopy: a comparison of motion correction techniques applied to real cognitive data,”
Neuroimage, 85 181
–191
(2014). http://dx.doi.org/10.1016/j.neuroimage.2013.04.082 Google Scholar
B. Molavi and G. A. Dumont,
“Wavelet-based motion artifact removal for functional near-infrared spectroscopy,”
Physiol. Meas., 33 259
–270
(2012). http://dx.doi.org/10.1088/0967-3334/33/2/259 PMEAE3 0967-3334 Google Scholar
R. J. Cooper et al.,
“A systematic comparison of motion artifact correction techniques for functional near-infrared spectroscopy,”
Front. Neurosci., 6 147
(2012). http://dx.doi.org/10.3389/fnins.2012.00147 1662-453X Google Scholar
A. Duncan et al.,
“Optical pathlength measurements on adult head, calf and forearm and the head of the newborn infant using phase resolved optical spectroscopy,”
Phys. Med. Biol., 40 295
–304
(1995). http://dx.doi.org/10.1088/0031-9155/40/2/007 PHMBA7 0031-9155 Google Scholar
H. Zhao et al.,
“Maps of optical differential pathlength factor of human adult forehead, somatosensory motor and occipital regions at multi-wavelengths in NIR,”
Phys. Med. Biol., 47
(12), 2075
(2002). http://dx.doi.org/10.1088/0031-9155/47/12/306 PHMBA7 0031-9155 Google Scholar
P. Wobst et al.,
“Linear aspects of changes in deoxygenated hemoglobin concentration and cytochrome oxidase oxidation during brain activation,”
NeuroImage, 13 520
–530
(2001). http://dx.doi.org/10.1006/nimg.2000.0706 NEIMEF 1053-8119 Google Scholar
M. A. Franceschini et al.,
“On-line optical imaging of the human brain with 160-ms temporal resolution,”
Opt. Express, 6 49
–57
(2000). http://dx.doi.org/10.1364/OE.6.000049 OPEXFF 1094-4087 Google Scholar
M. Wolf et al.,
“Comparison of three methods to measure absolute cerebral hemoglobin concentration in neonates by near-infrared spectrophotometry,”
J. Biomed. Opt., 7 221
–227
(2002). http://dx.doi.org/10.1117/1.1463044 JBOPFO 1083-3668 Google Scholar
W. N. Colier et al.,
“Human motor-cortex oxygenation changes induced by cyclic coupled movements of hand and foot,”
Exp. Brain Res., 129 457
–461
(1999). http://dx.doi.org/10.1007/s002210050913 Google Scholar
C. Hirth et al.,
“Towards brain mapping combining near-infrared spectroscopy and high resolution 3D MRI,”
Adv. Exp. Med. Biol., 413 139
–147
(1997). http://dx.doi.org/10.1007/978-1-4899-0056-2_15 AEMBAP 0065-2598 Google Scholar
H. Obrig and A. Villringer,
“Near-infrared spectroscopy in functional activation studies. Can NIRS demonstrate cortical activation?,”
Adv. Exp. Med. Biol., 413 113
–127
(1997). http://dx.doi.org/10.1007/978-1-4899-0056-2_13 AEMBAP 0065-2598 Google Scholar
J. Steinbrink et al.,
“Illuminating the BOLD signal: combined fMRI-fNIRS studies,”
Magn. Reson. Imaging, 24 495
–505
(2006). http://dx.doi.org/10.1016/j.mri.2005.12.034 MRIMDQ 0730-725X Google Scholar
G. Jasdzewski et al.,
“Differences in the hemodynamic response to event-related motor and visual paradigms as measured by near-infrared spectroscopy,”
NeuroImage, 20 479
–488
(2003). http://dx.doi.org/10.1016/S1053-8119(03)00311-2 NEIMEF 1053-8119 Google Scholar
A. W. Subudhi et al.,
“Frontal and motor cortex oxygenation during maximal exercise in normoxia and hypoxia,”
J. Appl. Physiol., 106 1153
–1158
(2009). http://dx.doi.org/10.1152/japplphysiol.91475.2008 Google Scholar
T. Ikegami and G. Taga,
“Decrease in cortical activation during learning of a multi-joint discrete motor task,”
Exp. Brain Res., 191 221
–236
(2008). http://dx.doi.org/10.1007/s00221-008-1518-2 EXBRAP 0014-4819 Google Scholar
M. Hatakenaka et al.,
“Frontal regions involved in learning of motor skill-a functional NIRS study,”
NeuroImage, 34 109
–116
(2007). http://dx.doi.org/10.1016/j.neuroimage.2006.08.014 NEIMEF 1053-8119 Google Scholar
M. Morihiro, T. Tsubone and Y. Wada,
“Relation between NIRS signal and motor capability,”
in Annual Int. Conf. of the IEEE on Engineering in Medicine and Biology Society (EMBC 2009),
3991
–3994
(2009). Google Scholar
T. Akiyama et al.,
“TMS orientation for NIRS-functional motor mapping,”
Brain Topogr., 19 1
–9
(2006). http://dx.doi.org/10.1007/s10548-006-0007-9 BRTOEZ 0896-0267 Google Scholar
T. J. Huppert et al.,
“A temporal comparison of BOLD, ASL, and NIRS hemodynamic responses to motor stimuli in adult humans,”
NeuroImage, 29 368
–382
(2006). http://dx.doi.org/10.1016/j.neuroimage.2005.08.065 NEIMEF 1053-8119 Google Scholar
L. Gagnon et al.,
“Short separation channel location impacts the performance of short channel regression in NIRS,”
NeuroImage, 59 2518
–2528
(2012). http://dx.doi.org/10.1016/j.neuroimage.2011.08.095 NEIMEF 1053-8119 Google Scholar
I. Tachtsidis et al.,
“Investigation of cerebral haemodynamics by near-infrared spectroscopy in young healthy volunteers reveals posture-dependent spontaneous oscillations,”
Phys. Meas., 25 437
–445
(2004). http://dx.doi.org/10.1088/0967-3334/25/2/003 PMEAE3 0967-3334 Google Scholar
BiographyNasser H. Kashou is an assistant professor at the Wright State University and IEEE Senior Member. He attained his PhD in 2008 from The Ohio State University's Biomedical Engineering Department. His education also includes Master's of Science in electrical engineering, 2004. He is currently running the Image Analysis Lab (IAL) at Wright State University (WSU). He has also established and runs the fNIRS Lab. Brenna M. Giacherio received her Master of Arts degree in physics from Western Michigan University (WMU) in 2010 and a Master of Science in biomedical engineering from WSU in 2014. She worked as a research associate and senior member of the IAL and fNIRS Lab. Her expertise includes biomedical signal processing, medical imaging, image processing, probability and statistics, and experimental design and analysis. Ramzi W. Nahhas is highly active in collaborative projects, utilizing modern statistical methods to analyze data from a wide range of biomedical research areas. These disciplines include childhood growth and development, obesity, cardiometabolic risk across the lifespan, illicit drug use, and psychiatry. His primary methodological area of expertise is the analysis of longitudinal data, in particular, linear and nonlinear mixed models. Sudarshan R. Jadcherla is a professor of pediatrics at the Ohio State University College of Medicine and Public Health. He is also the principal investigator and director of the Neonatal and Infant Feeding Disorders Research Program at the Nationwide Children’s Hospital Research Institute. He is well published in the field of developmental GI motility, dysphagia, and aero-digestive health in infants and has contributed to the development of innovative feeding strategies in high-risk infants. |