
|
|
1.IntroductionOver the course of its development thus far, functional near-infrared spectroscopy (fNIRS) has been employed in the areas of neurology, psychiatry, and psychology as well as in basic research with a long list of topics such as diseases, disorders, rehabilitation, reasoning, and sleep.1 It has been used alone or in tandem with other modalities such as functional magnetic resonance imaging (fMRI). Initially, demonstrated by Jöbsis in 1977, the first fNIRS studies were not carried out on human subjects until late 1991 and into 1992. After more than 20 years of research, much work remains to be done in this field. For example, although fNIRS may be lower in cost, noninvasive, nonionizing, and portable, it has yet to be proven as a feasible, stand-alone alternative to fMRI within many clinical settings, such as ophthalmology. fNIRS operates on the premise that light in the near-infrared (NIR) range can be transmitted through tissue, is partially absorbed by certain chromophores—namely, oxygenated (HbO) and deoxygenated (HbD) hemoglobin—and is received by a detector at some distance from the source.2 When a region of the brain is activated, or used, the oxygen demand in that region increases and it receives a corresponding increase in blood flow to (over)compensate. The overall increase in blood flow can be caused by dilation of blood vessels or possibly opening of additional vessels. This large increase in oxygenated blood flow supplied by the arteries causes a washout of HbD. It is for this reason that HbD is observed to decrease whether metabolic rate increases as has been suggested for the visual cortex or not. Typically, this is shown by an increase in the level of HbO and a corresponding decrease in HbD that is smaller in magnitude. The relation between cortical activation and blood flow is known as neurovascular coupling. A limiting factor in fNIRS is the optode placement. Greatest levels of activation, and therefore increase in HbO, as a result of visual stimuli, have been observed from optodes that overlie the primary visual cortex3–5 with a greater response typically seen in the left hemisphere.6–8 The amount of activation measured tends to decrease with radial distance from this location. Using the International 10–20 System of Electrode Placement,9 Wijeakumar et al.7 showed that the largest changes in hemoglobin concentration occurred at O1 and O2 as well as locations vertically between O1, O2, PO3, and PO4. They also demonstrated that the greatest and longest activations were induced using pattern-reversing checkerboards (as opposed to static or pattern onset/offset). The current International Society for Clinical Electrophysiology (ISCEV) standard for clinical visual evoked potentials (VEPs)10 suggests a pattern reversal rate of 1.0 Hz, which corresponds to two reversals per second, in order to obtain a reliable electroencephalogram (EEG) signal. However, studies have shown that higher reversal rates produce a greater response. Numerous studies have been performed using sweep VEP to measure contrast sensitivity and visual acuity at reversal rates of 6 Hz. Heine and Meigen11 found that the greatest magnitudes and significance could be obtained by using pattern-reversal checkerboards at rates between 4 and 8 Hz for VEP. Another previous study12 suggested that for larger checker sizes, a higher temporal frequency would produce a better response. Checker sizes used in this project are considered large by ISCEV standards10 and it has been demonstrated that good fNIRS results are attainable.6,7 Our study takes a small but important step toward utilizing a portable stand-alone system for diagnosing visual disorders. In doing so, we pose several questions: how reliable and robust is fNIRS at detecting changes in HbO and HbD? Can differences be detected in the hemodynamic response from various visual stimuli? Will the same measurements be obtained upon repetition? Finally, is the current level of sensitivity and repeatability sufficiently reliable for use in a clinical setting? 2.Materials and Methods2.1.InstrumentationA compact NIRScout imaging system (NIRx Medical Technologies LLC) using five sources (of a possible eight) and 12 detectors was used to measure the changes in HbO and HbD at a sampling rate of 8.93 Hz. Change in concentration of both HbO and HbD was defined as the difference between the averaged baseline and the stimulus peak (either minimum or maximum). The LED sources emitted fixed NIR wavelengths of 760 and 850 nm. Triggers were programmed into the stimulus, routed through the NIRScout system, and read by the data acquisition program (NIRStar 12.4). This ensured that the stimulus timing was accurate for data analysis. With the aid of a retaining cap, all sources and detectors (optodes) were arranged to overlie the occipital region (Fig. 1), which houses the visual cortex. Our arrangement resulted in a total of 28 nearest-neighbor and second nearest-neighbor measurement channels with source-detector separations of approximately 2.4 and 3.0 cm, respectively. Fig. 1(a) Coronal illustration of optode layout of five sources (gray) and 12 detectors (white) based on the 10-20 system. (b) Illustration of functional block paradigm with a total of eight cycles for each trial. (c) A total of five trials (visual angles) were displayed, (i) 1 deg, (ii) 2 deg, (iii) 5 deg, (iv) 9 deg, and (v) 18 deg each day. Note: not to scale. 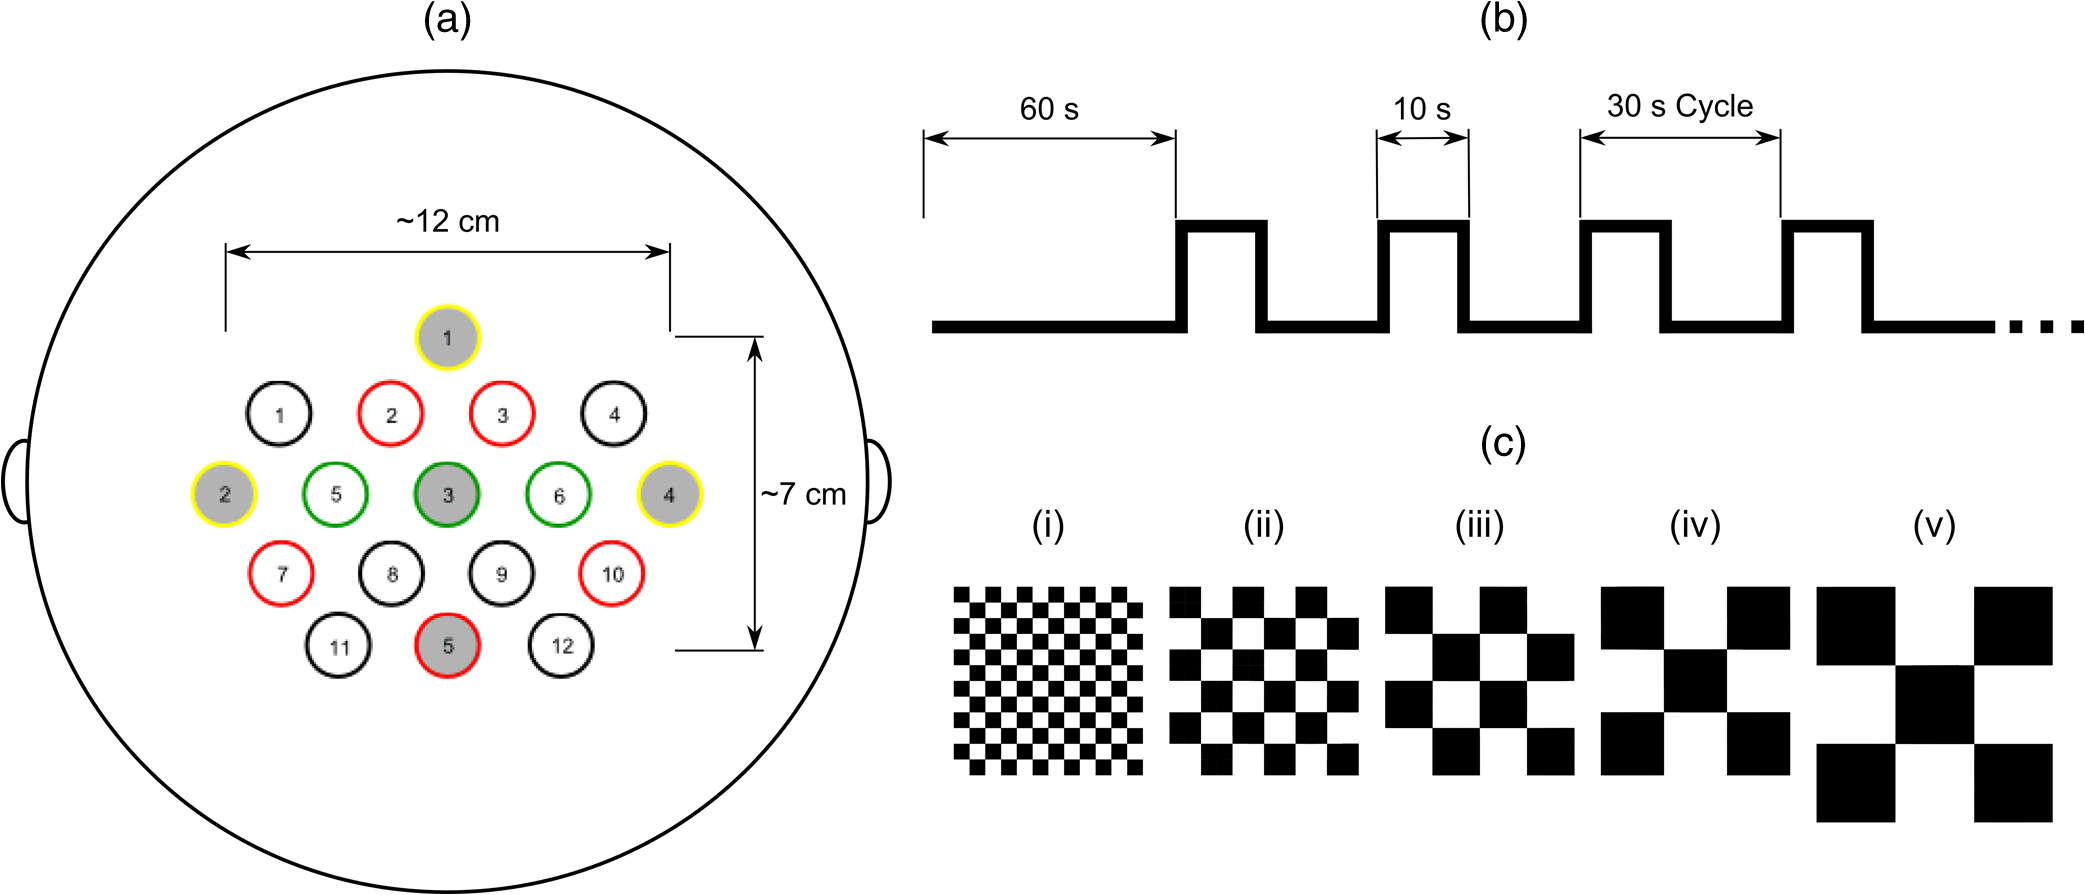 2.2.Visual StimulationA visual stimulus of black-and-white checkerboards, reversing at a frequency of 7.5 Hz, was utilized in order to elicit a hemodynamic response within the visual cortex. The stimulus protocol began with a 1-min black screen, which was used to form the initial baseline, followed by the visual task of reversing checkerboards, Fig. 1. The checkerboard stimulus duration was 10 s and was followed by 20 s of baseline. This repeated several times to give a total of 8 stimulus-baseline cycles for each 5-min trial. These 8 cycles enabled eight observations per factor level. NIRS signals fluctuate, even during a resting state, which is the reason that a long initial baseline was chosen.13,14 Each stimulus protocol used a single checker size (spatial frequency), was displayed on a LCD computer monitor with a 60-Hz refresh rate, and subtended the entire screen. Presentation (Neurobehavioral Systems, Inc.) software was utilized in the creation and execution of all visual stimuli. Each experimental block consisted of five different stimulus protocols and each protocol employed a different, but uniform, checker size. The size of the individual checker squares ranged from small to large with visual angles of approximately 1 deg, 2 deg, 5 deg, 9 deg, and 18 deg in the experimental configuration. A single complete, randomized block of the five spatial frequencies was run on each of three separate days, and participants were unaware of the sequence prior to each data trial. 2.3.Participant and PreparationA total of 10 participants with mean age years were recruited from the population of Wright State University (WSU) in accordance with the Code of Ethics of the World Medical Association (Declaration of Helsinki). Of these, five were female with mean age years and five were male with mean age years. Participants with a variety of hair types were included. The experimental protocol was approved by the internal review board at WSU and informed consent was obtained from each participant prior to involvement in the study. Subjects were seated so that their eyes were 55 cm from the screen and their heads were supported by a chin rest in order to keep the viewing distance constant. The screen subtended a visual area of at this distance. After parting long hair, the optode retaining cap was placed on the subject’s head and centered. Electrode gel was applied in order to enhance the conduction of light between the optodes and the skin by removing an interface with the air, which would significantly reduce the signal. This step also allows hair to be pushed and kept out of the way before loading the optodes into the cap. Although measurements were taken in a darkened room, a large, fleece cap was placed over the subject’s head to further reduce any ambient light from computer screens. The room was also quiet in order to keep potential distractions to a minimum. 2.4.AnalysisRaw data was initially processed using Homer2:15,16 a MATLAB®-based (The Mathworks, Inc.) analysis tool. Functions of Homer2 were used within a stand-alone MATLAB® script in order to automate data processing and reduce the number of potential human errors. This extracted values such as the peak and baseline for each stimulus event in each defined data channel and saved them in a file that could be used for statistical analysis. Despite the many available options for filtering signals, the one chosen in this study was a wavelet. Wavelet filtering17,18 has shown more stability and consistency than Kalman filtering19 or principal component analysis,20 for example, and does not require any strict assumptions or the inclusion of additional physiological measures. Further, wavelet filtering has proven to be effective in the reduction of low-frequency oscillations and motion artifacts that are often present in fNIRS signals.21 In the wavelet filtering method of Molavi and Dumont,22 which is utilized by Homer2, motion artifacts are considered outliers. The specific value of the tuning parameter (), which is a probability threshold, was chosen based upon precedent.21–23 Following application of the wavelet filter to each dataset, a simple 0.01 to 0.5 Hz bandpass filter was also used. This allowed elimination of physiological noise and low-frequency system drift without removing artifacts that may be related to hemodynamic response. Filtered signals were used to calculate concentration changes in HbO and HbD via the modified Beer–Lambert law. Differential pathlength factor values used for a mean age of 23.8 years were estimated to be 7.57 and 6.26 for wavelengths of 760 and 850 nm, respectively, based upon literature.24,25 Statistical analysis was executed with JMP software (SAS Institute, Inc.). The change in HbO and HbD between each prestimulus baseline and peak response was the basis for quantitative analysis. Baseline value was defined as the average concentration value over the 10-s period before each stimulus onset. Peak value was defined as the extremum reached between 5 and 15 s after stimulus onset. All quantitative analysis of the observed hemodynamic responses began with one-way ANOVA. Tukey’s test (Tukey–Kramer HSD) was then administered in order to compare all possible differences between both checker size and data collection session. In addition, JMP’s Fit Model option was used in two ways. First, the subject number was categorized as a blocking factor and set as a model effect along with session and checker size. In a second model, hair color and thickness were set as the model effects. The most consistently active channels were chosen for the statistical analysis of data from each participant to keep the statistical power as large as possible. 3.Results3.1.Hemodynamic ResponseIt was seen that the vast majority of observable hemodynamic responses reached their extrema—maximum for HbO and minimum for HbD—between 10 and 15 s after stimulus onset. This is at or after the point which a stimulus ended. Overall, the magnitude of the change in concentration of HbD was approximately half, or less than, that of the HbO. An example of the elicited hemodynamic responses for one checker size and participant is shown in Fig. 2. Qualitatively, the results for subject 2 far surpassed the rest (Fig. 3). Poorest results were obtained from subjects 1, 5, 8, and 9. Fig. 2Hemodynamic responses for three trials using the 1 deg checker size—one trial from each data collection session—for subject 2. All eight stimulus events from each trial are overlaid on a single graph for a representative channel. HbO curves range from red (first event) to yellow (eighth event) and HbD curves range from blue to green. The shaded region indicates the duration of the stimulus and the third session was found to produce significantly different () results than the other two for both HbO and HbD. 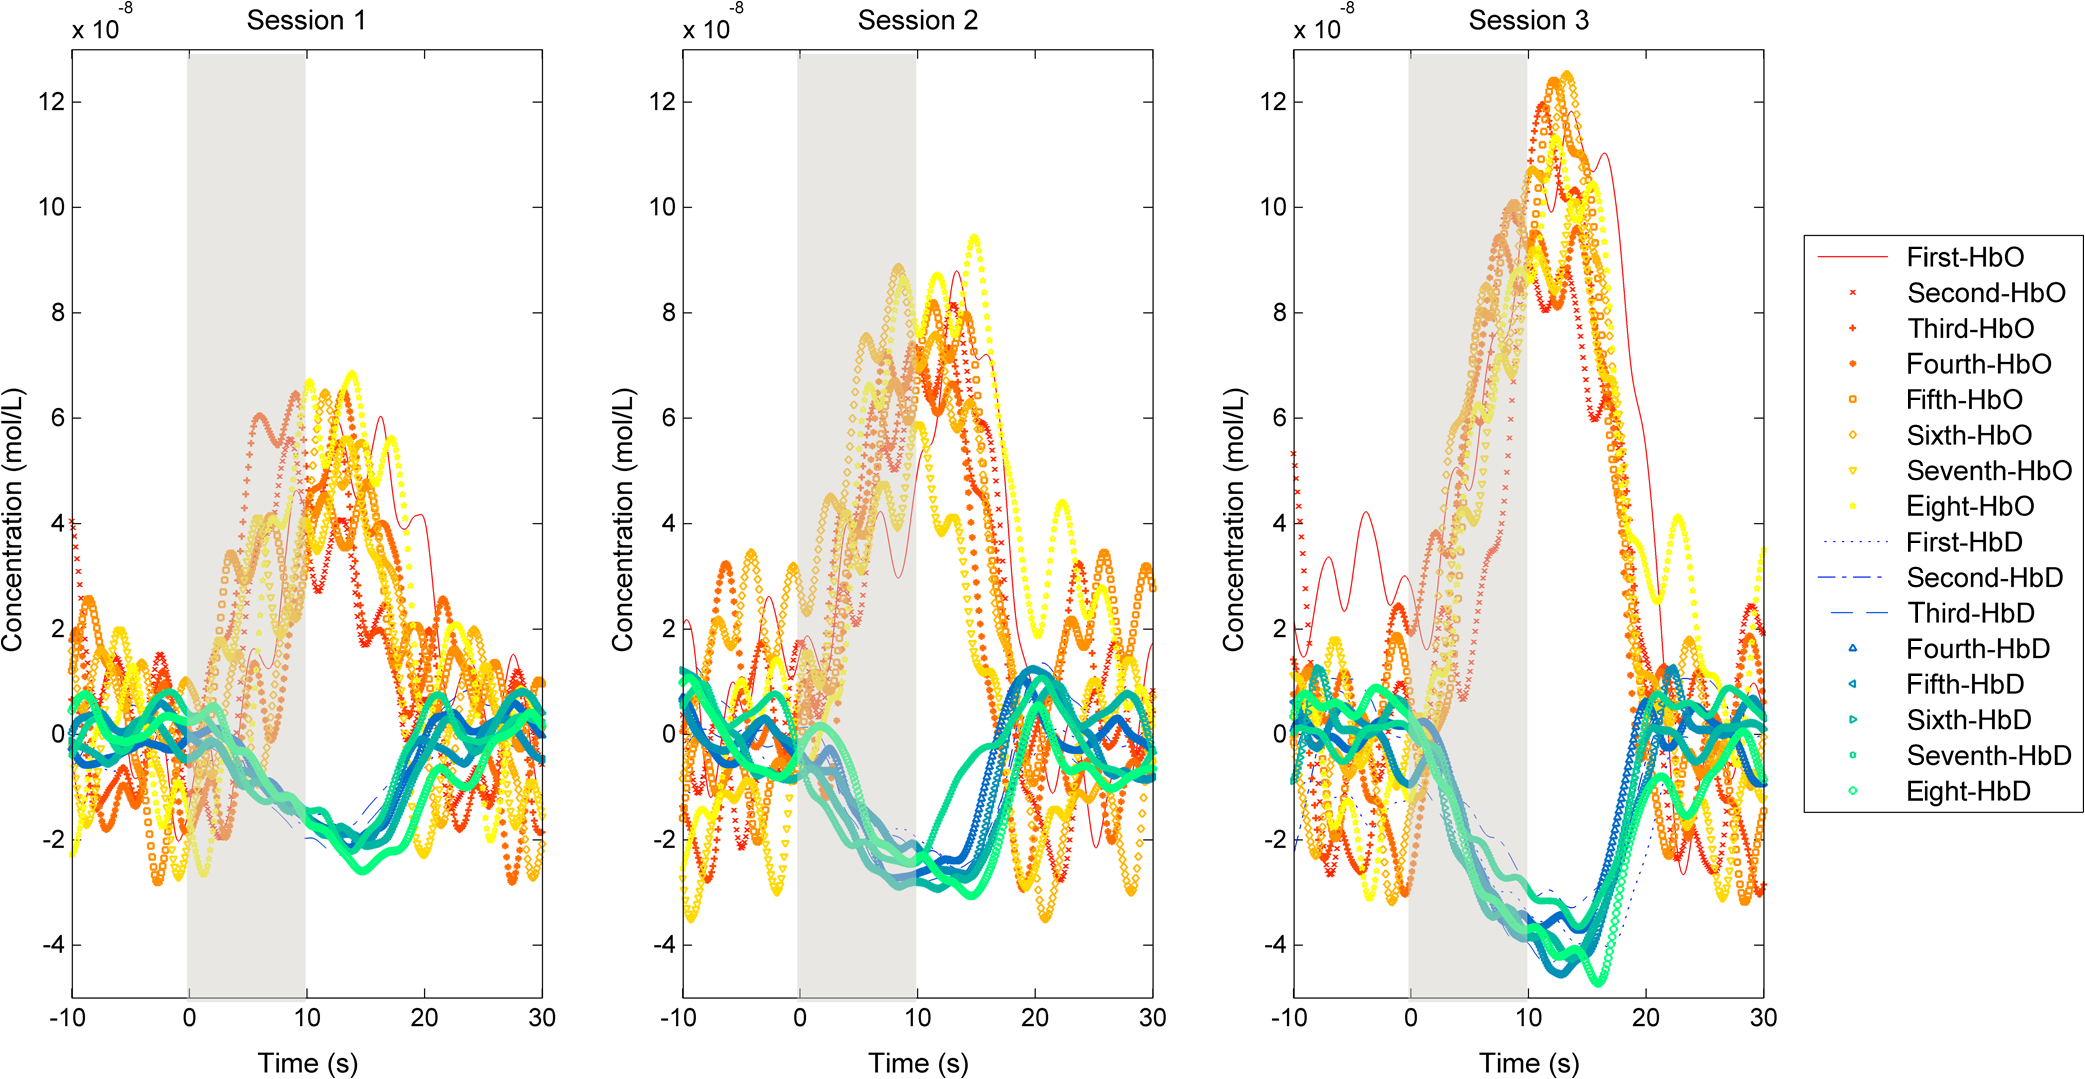 Fig. 3Summary of qualitative statistics. A total of 120 stimulation events were analyzed for each of 10 participants. Each event possessed a total of 28 possible data channels to give a total of 3360 channels for each participant that were analyzed for the presence of an observable hemodynamic response. The number of (a) events and (b) channels in which a response was observed are illustrated. Note that the highest number of each was obtained for participants 2, 4, 7, and 10. 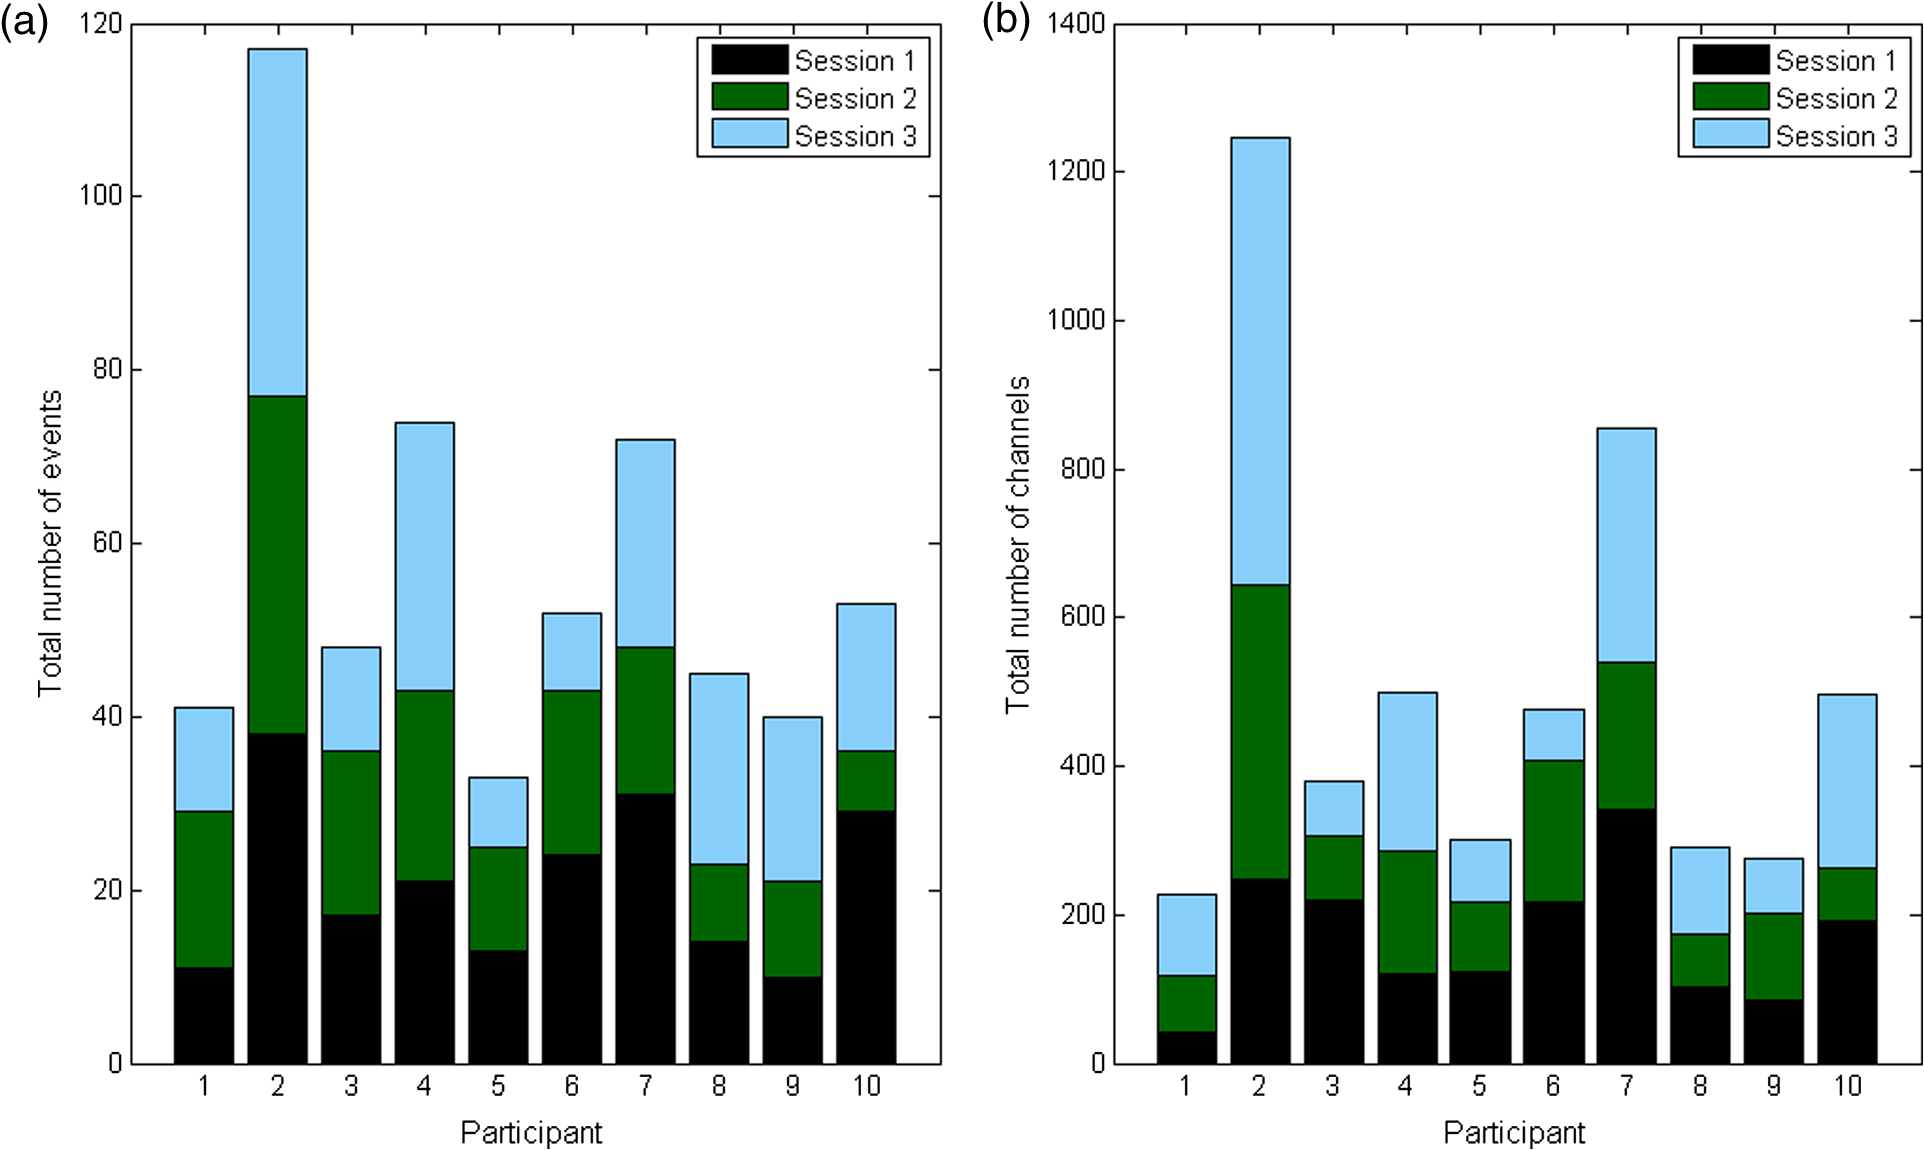 Subject 2: In general, for this subject, more prominent responses were observed for the left hemisphere with the highest magnitude responses observed slightly superior to the left primary visual cortex (per the 10-20 system). Overall, block averages across eight stimulus events appeared very smooth with an easily discernible hemodynamic response, even if one or two of those events did not exhibit a response. Of the 120 total events, a hemodynamic response was observed in 117 (97.5%) with an average of 10 channels (35.7%) per event. Average magnitudes of the hemodynamic responses, both HbO and HbD, were greater for the final data collection session than the first two (). However, there was no significant difference () found between the first and second sessions. The final data collection session also contained more average channels with an observable hemodynamic response. The two channels that were consistent across all sessions were positioned over the left primary visual cortex. 3.2.Visual Stimuli Comparison: SensitivityFor 9 of the 10 participants, no statistical differences were found in mean hemodynamic responses between checker sizes. From a qualitative comparison of responses across the visual stimuli, however, there did appear to be a somewhat decreasing trend in the magnitude of responses for a few participants as the checker size increased. All others showed little to no visible difference. Quantitative data is organized by checker size and summarized in Fig. 4. 1-deg checker size produced the greatest magnitude responses in HbO and HbD for subject 2 across all three data collection sessions (Table 1). Fig. 4Summary of quantitative results obtained across checker sizes—given in degrees—for the most consistent channel in each of the 10 participants. Associated error bars for the HbO (positive, red) and HbD (negative, blue) responses are given by vertical lines. Differences in response magnitudes only reached significance () for the second participant. 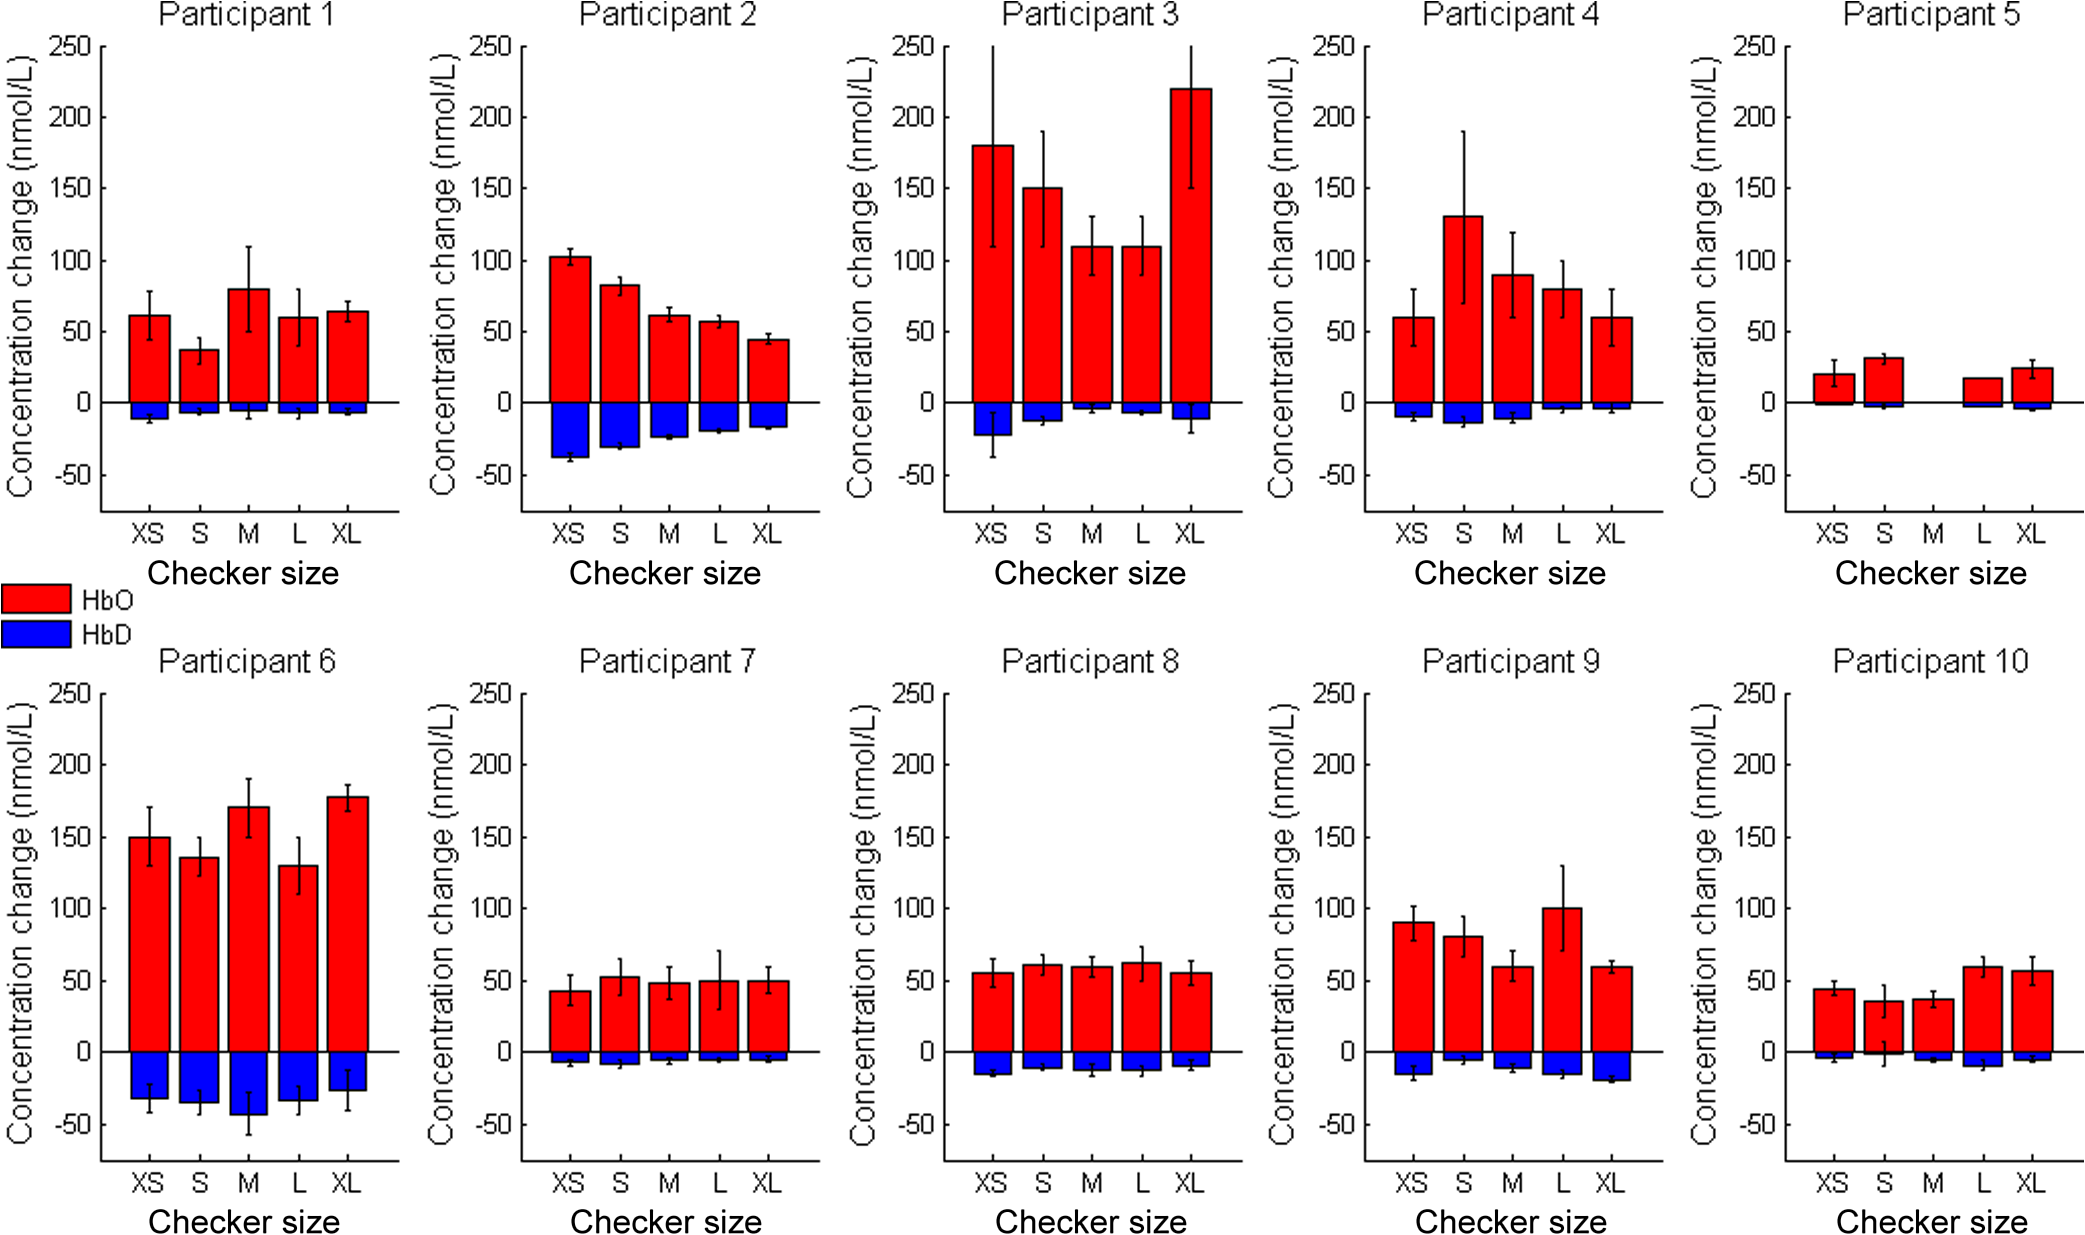 Table 1Mean hemodynamic responses by visual stimulus and data collection session for subject 2. Reported data corresponds to a channel over the left primary visual cortex. Concentration changes are given in units of nmol/L and uncertainty is reported as standard error. The use of a * indicates a significant difference (p<0.05) from all the other sessions or checker sizes for a participant. A † or § indicates a significant difference only between those marked with the same.
3.3.Visual Block Comparison: RobustnessData from 7 of 10 subjects exhibited significant differences between at least two of the three data collection sessions for either HbO, HbD, or both. Subjects 1 and 3 produced differences in HbO response levels; subjects 4, 5, and 6 produced differences in HbD response levels; and subjects 2 and 8 produced differences for both hemoglobin response levels. Additionally, no responses were observed for the third session of subject 5, which means that there are no quantitative statistics reported for those five trials. Figure 5 summarizes quantitative data by session. Fig. 5Summary of quantitative results obtained across data collection sessions for the most consistent channel in each of the 10 participants. Associated error bars for the HbO (positive, red) and HbD (negative, blue) responses are given by vertical lines. Differences in response magnitudes for both HbO and HbD only reached significance () for two of the 10 participants. 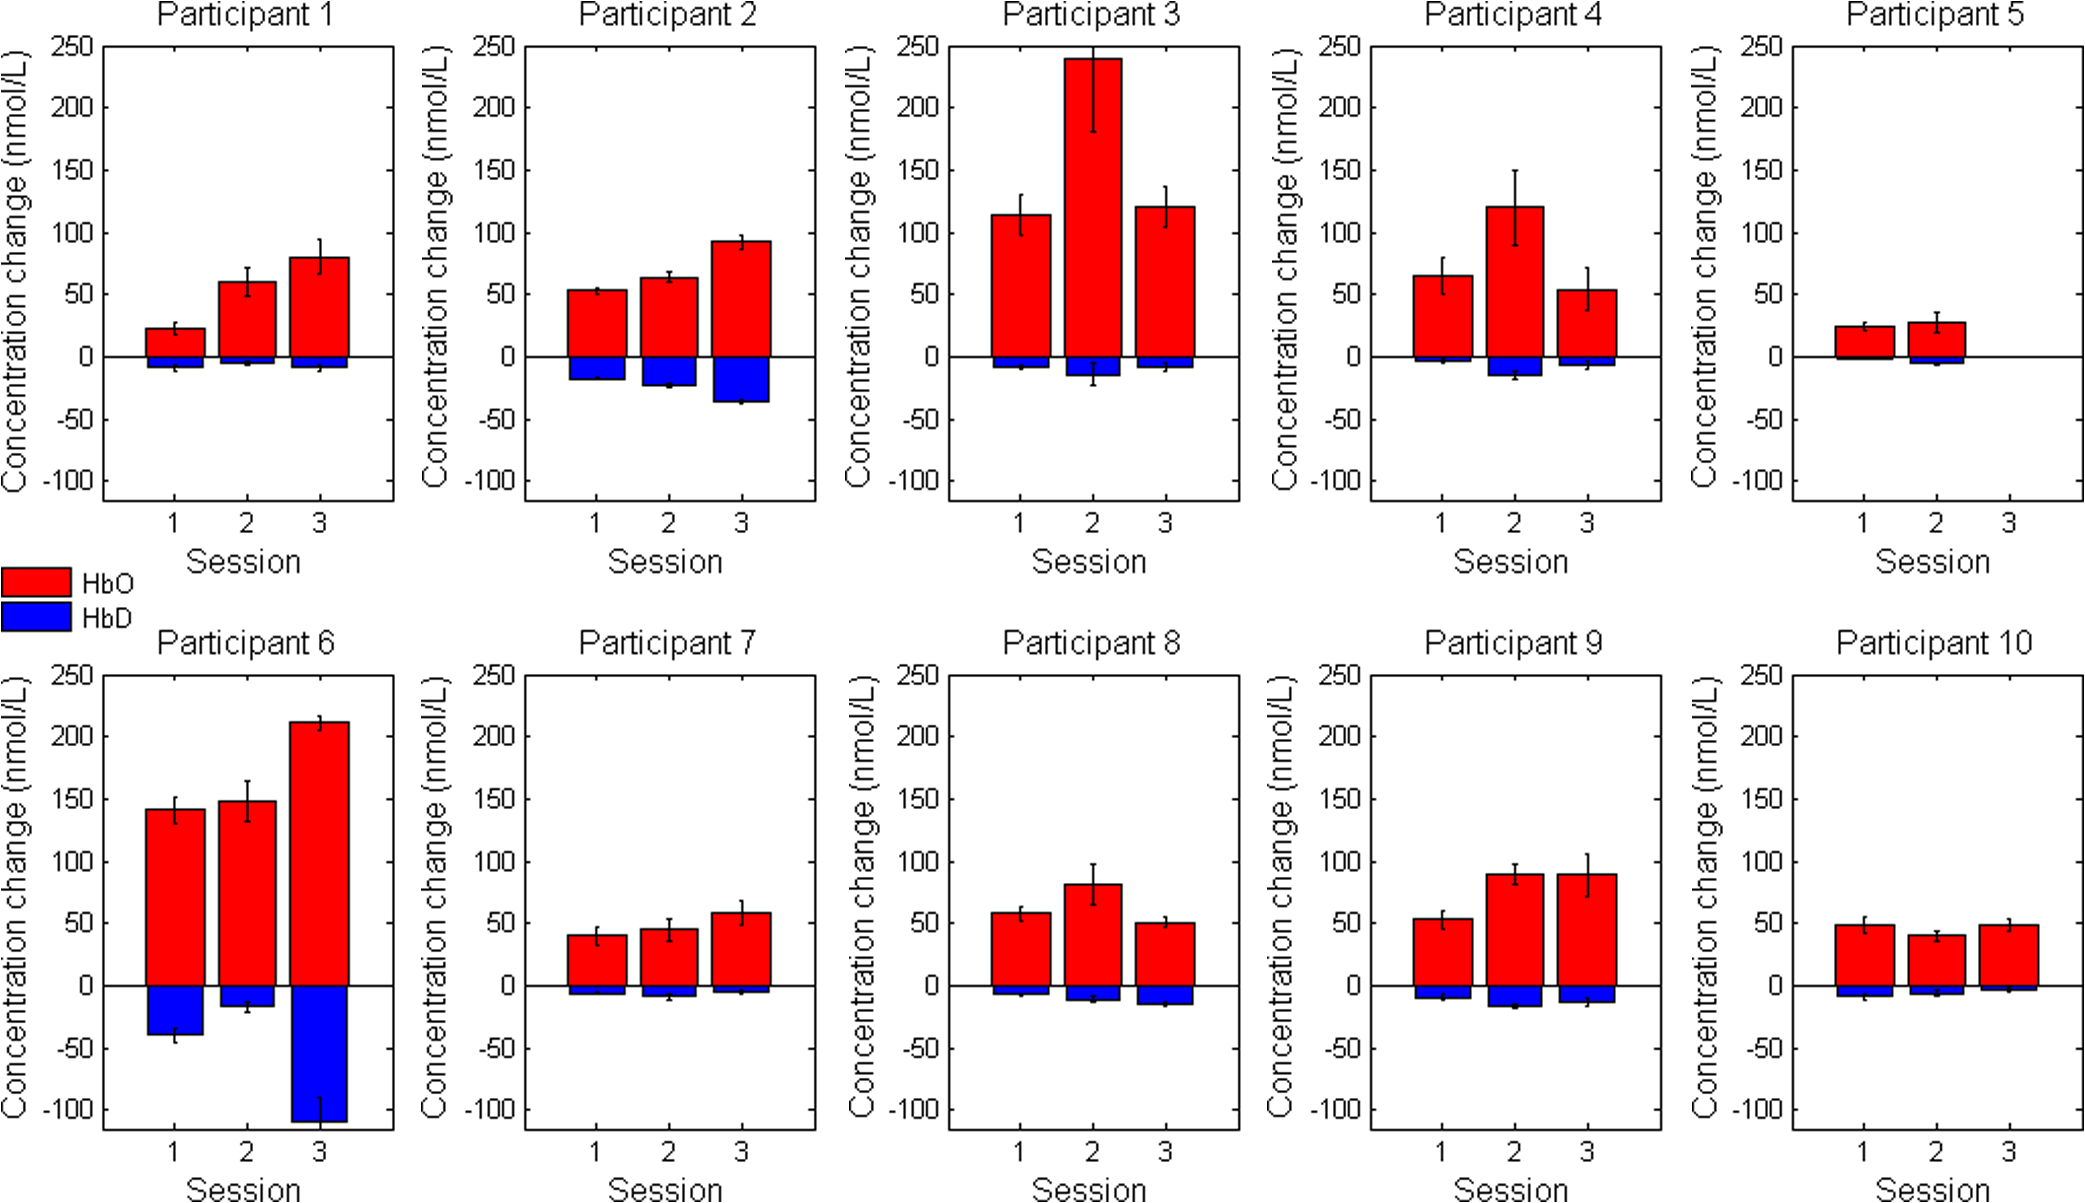 3.4.Fit ModelsThe subject-session-size model confirms the results of the one-way ANOVAs; there was no overall significant difference in levels between checker sizes. For overall HbD response, however, a significant difference was found between the 1 deg and the two largest (9 deg and 18 deg) checker sizes. This model also confirms that significant differences in response levels occurred between data collection sessions. Based upon the color-thickness model, with -values of and 0.0144, respectively, hair color and thickness each appeared to have an effect upon the overall HbO response, as shown in Table 2. The response for black hair was significantly higher than brown or blond; the response for coarse hair was lower than fine. On the other hand, only color appeared to have a significant effect for HbD responses. The results for brown hair were found to be significantly lower in magnitude than those for blond and black. Table 2Summary of statistical results organized by hair type. Within each section and column if factor levels are not connected by the same letter, then they are considered significantly different (p<0.05). Hemoglobin changes are given in nmol/L.
4.DiscussionSeveral studies have focused on identifying age-related differences in hemodynamic response patterns. Many discovered that in general, the magnitude of hemodynamic response is greater in young adults and tends to decrease with age.26–28 The age range for participants in the current study falls under the young adult category, which means that hemodynamic responses should exhibit the typical pattern and show a decent amount of activation. In this study, it was observed that an appropriate level of sensitivity is achievable for visual cortex studies but is not yet reliable across the population. Data for only 1 in 10 participants reached significance for the various spatial frequencies used in the study. Since the largest response was observed for the smallest checker size, it would be wise to include even smaller sizes in future studies. Subject 2, which showed consistent and reliable data, did not reach the threshold in which half of the channels showed activation over the occipital region. All others were below one-third of the overall total number of channels. This suggests that the optode layout could be even further condensed. This seemingly small area makes sense because only a fraction of the visual cortex is found on the exterior portion of the cerebrum. Much of it is actually housed within the longitudinal fissure, which increases the difficulty to obtain reliable fNIRS data. The presence of most active channels in the superior region of the layout suggests that sources and detectors could be included above those in the current configuration. This fact, combined with the low number of channels containing observable responses, may indicate that better statistics can be achieved by shifting the optode arrangement by 5% to 10% toward the crown of the head. Additionally, results showed that at the onset of stimulation, the level of HbO rises significantly and the level of HbD falls to a lesser degree. It was observed in this study that there was a tendency for HbO and HbD signals to be more delayed in lateral regions. The visual association area is located lateral to the visual cortex and this delay, then, is consistent with activation of the association area following activation of the visual cortex. It has been demonstrated that for approximately 7 to 10 s after the onset of a stimulus, the concentration of HbO increases significantly to reach a plateau.6,7,29,30 It takes approximately the same amount of time for HbD levels to decrease in the visual cortex. Once the stimulus ends, approximately 10 to 12 s are needed for HbO and HbD to return to normal levels.7,29,31 The time to reach an HbO maximum varies with the stimulus protocol used. For a 10-s on protocol, such as the one used in this study, a maximum occurs 1 to 2 s after the stimulus ends29 before values begin returning to baseline. Hence, since from this point an additional 10 to 12 s are needed for HbO and HbD to return to original levels, a 20-s baseline was chosen. 4.1.Overall Subject ComparisonA wide range of hair types were included in order to analyze feasibility across a potential patient population. There were some differences in the measured responses based upon hair type. This was expected, since it is known that melanin absorbs NIR light and previous manuscripts have reported the use of participants with light-colored hair only. Seen in Table 2, the largest measured magnitude changes in HbO and HbD occurred for participants with very dark hair. This particular result was not expected, since the higher quantity of melanin in dark hair would absorb the NIR light more than in light-colored hair. However, the data from those with dark-colored hair was generally lower in quality and, therefore, is not necessarily as reliable as data from those with lighter-colored hair. Therefore, further studies are needed to investigate this phenomenon as well as any potential interaction between the effects of hair color and thickness. 4.2.Overall SensitivityIt was hoped to measure at least some difference in the level of responses prompted by various stimuli. This was accomplished for only one of the 10 participants, the results of which can be seen in Fig. 4. Achieving an acceptable level of sensitivity in healthy individuals shows the feasibility of using fNIRS to study activation in the visual cortex. This achievement for healthy participants should allow extension to study dysfunction of the visual pathways using fNIRS by providing a basis for comparison. The greatest differences in hemodynamic response were measured between the 1 deg and 5 deg through 18 deg checker sizes, which indicates at least two potentially reliable stimulus levels to use for studying visual dysfunction. No statistically significant differences were found between the responses of stimuli for any other subject, which suggests low reliability. However, there appeared to be a decreasing trend in response magnitude as checker size increased for a few participants, although no differences reached significance. This could indicate that sufficient reliability can be achieved with further optimization. 4.3.Overall RepeatabilityLack of repeatability could be caused by at least one of several possible factors. First, the experimental setup may need to be refined. To minimize variation in the procedure used, the same person setup, aligned the cap, and applied the optodes for all three data collection sessions on each participant. However, the participant was asked to fasten the cap so that it was comfortably snug and may not have been as conscientious to consistency as the experimenter. Also, sometimes it took a couple of sessions for the experimenter to get accustomed to application for each participant due to variations in head shape and hair. In practice, every person’s hair acts differently when attempting to clear a small patch of skin for optode contact. This is true even from one region to another on the same person, which sometimes serves to make optode application particularly challenging and, unfortunately, reduces the ease of performing a completely consistent experimental setup each time. In addition, the times available for data collection were limited. As such, sessions for each participant were not restricted to the exact same time of day or week. The use of caffeine was not prohibited and the level of nearby noise, unfortunately, could not be completely regulated. All of these factors, along with potential boredom from repetition, could contribute to changes in a participant’s level of attentiveness between data collection sessions or even within the same session. 4.4.Regulation and Quality ControlThe level of attention given to the stimuli is difficult to interpret and record. The importance of attention levels, especially for the visual cortex, is an example of a piece of information that could have been confounded by external variables and not readily quantifiable. Also, despite efforts to perform data collection in a quiet environment, distracting levels of noise were reported in five of 30 total sessions. In addition, several participants commented that they had difficulty remaining awake and alert, particularly after the third trial. The level of attentiveness during stimulation could have played a role in the observed hemodynamic responses, or lack thereof. It could also possibly explain the longer-period signal oscillations noted for a few participants. For future studies, it may be prudent to include an audio cue at the beginning of or just prior to the beginning of a stimulus. Doing so would remind the participants that they need to pay attention to the stimulus. In addition, the number of trials could be limited. Beyond these factors, it is known that nicotine increases CBF; none of the participants were active smokers. Caffeine has other effects—such as increasing heart rate, metabolism, and vasoconstriction—which actually decrease CBF. Several participants were known coffee or soda drinkers, although their specific ingestion habits were not officially recorded. For those on whom fNIRS is already difficult, caffeine ingestion could possibly increase the difficulty of obtaining reliable signals. Regulation of such commonly-used stimulants may be difficult from a researcher’s or clinician’s perspective. It is the practice of some fNIRS researchers to request that participants refrain from alcohol or caffeine use for at least 24 h prior to data collection.32 However, if fNIRS is extended to the clinical realm, a patient or doctor may not know in advance that such an exam will need to be performed. 4.5.Data Variability4.5.1.OscillationsThe magnitude of 0.1-Hz oscillations has been proven to be posture-dependent. These oscillations are greatest when standing and least when lying down, as a person would be during an MRI.33 For this study, subjects are in a seated position. This is a compromise between the magnitudes of spontaneous, regulatory BP oscillations—or Mayer waves. As such, care must be taken during analysis and when comparing results between studies and modalities that utilize another posture. As it has been noted in previous studies, low-frequency oscillations are common in NIRS data, especially with lower magnitude responses like in the visual cortex. Not only do these oscillations appear in the overall time series, but they can survive averaging over many stimulus events.34 Thus, care must be taken when filtering and processing fNIRS signals, especially for the visual cortex. Unfortunately, not everyone reports details on data processing steps. 4.5.2.Motion artifacts and noiseIt is rare to see a signal reported from a single stimulus response in scholarly articles. Instead, reported responses are generally averaged over a number of stimuli events, sessions, or even across subjects. While doing so increases SNR, it does not allow one to see the true variability in the data. Individual responses are generally much noisier than data typically presented. Looking at individual stimulus events then presents a challenge when trying to comment upon the repeatability of fNIRS measurements. This challenge can be compounded if a person moves during data collection. An advantage of imaging the visual cortex is that stimulation of this cortical region requires no movement on the part of the subject. A disadvantage to imaging the visual cortex in adults is the location of this region of the brain. The skull here is generally a bit thicker, not uniformly shaped, and the depth of the cortex varies from person to person. Further, the weight of the optode leads tend to tug the optodes themselves down over time, which could, for instance, lead to detector saturation as a result of optodes losing contact with the skin. It is important to have a snug-fitting cap—or other optode retaining device—for each subject and a specific method of loading the optodes into the cap. Additionally, despite various sizes of commercially-available optode retaining caps, there were still difficulties in achieving a good fit. Even with a variety of cap sizes, there are bound to be adults who have a large quantity of hair or whose head shape causes poor optode contact with the scalp. These subjects may require special modifications in order to obtain a snug fit. Alternative to such modifications, a new optode holder could be designed that only covers the visual cortex/occipital region, but is adjustable to different head shapes and circumferences. Such a new design could also allow denser optode configurations. The design and production of such equipment could take a good deal of time to perfect—both in terms of creation and determining an ideal optode configuration. For this project, we chose the option of multiple cap sizes. Investigation of a new design, however, is currently underway. 4.6.ResolutionSince fNIRS is limited by its low-spatial resolution, groups have begun investigating methods by which to improve upon it. Specifically, diffuse optical tomography (DOT) instruments are being designed with a high-density array of optodes. This provides higher SNR with greater repeatability and spatial resolution over traditional fNIRS. Zeff et al.35 describe the development of such a DOT system. The quantity of optodes arranged in a relatively dense configuration not only allows for lateral image reconstruction, but, due to an increased number of source–detector separation distances, allows for depth reconstruction as well. The reported high repeatability would mean that fewer stimulus cycles would be required. This means even further reduced time to diagnosis and increased patient comfort. Such systems could be the future of fNIRS. 5.ConclusionThis study has shown that using the standard 10–20 cap for studying brain activation in the visual cortex may not be optimal. It is suggested that a modified optode layout with higher (superior) placement be used to attain more reliable data across participants. A more robust alternative would be a dedicated optode cap designed solely for the visual cortex that would be adjustable for hair, head shape and size. In regards to stimulus size, it was found that the 1 deg checker size yielded the greatest magnitude signals. Although signals were consistently present across the three sessions, there was a significant difference in one of these sessions, which raises the concern of repeatability. Thus, in order for fNIRS to be utilized clinically for assessment of visual dysfunction, further optimization is needed before acceptable levels of reliability and repeatability can be reached. Since data processing methods have been well explored, this optimization would primarily include improvements in the hardware and experimental setup. ReferencesM. Ferrari and V. Quaresima,
“A brief review on the history of human functional near-infrared spectroscopy (fNIRS) development and fields of application,”
NeuroImage, 63 921
–935
(2012). http://dx.doi.org/10.1016/j.neuroimage.2012.03.049 NEIMEF 1053-8119 Google Scholar
F. F. Jobsis,
“Noninvasive, infrared monitoring of cerebral and myocardial oxygen sufficiency and circulatory parameters,”
Science, 198 1264
–1267
(1977). http://dx.doi.org/10.1126/science.929199 SCIEAS 0036-8075 Google Scholar
L. Tang, M. J. Avison and J. C. Gore,
“Nonlinear blood oxygen level-dependent responses for transient activations and deactivations in V1 insights into the hemodynamic response function with the balloon model,”
Magn. Reson. Imaging, 27
(4), 449
–459
(2009). http://dx.doi.org/10.1016/j.mri.2008.07.017 MRIMDQ 0730-725X Google Scholar
M. Wolf et al.,
“Comparison of three methods to measure absolute cerebral hemoglobin concentration in neonates by near-infrared spectrophotometry,”
J. Biomed. Opt., 7
(2), 221
–227
(2002). http://dx.doi.org/10.1117/1.1463044 JBOPFO 1083-3668 Google Scholar
M. Wolf et al.,
“Fast cerebral functional signal in the 100-ms range detected in the visual cortex by frequency-domain near-infrared spectrophotometry,”
Psychophysiology, 40 521
–528
(2003). http://dx.doi.org/10.1111/1469-8986.00054 PSPHAF 0048-5772 Google Scholar
S. Wijeakumar et al.,
“Neural and vascular responses to fused binocular stimuli: a VEP and fNIRS study,”
Invest. Ophthalmol. Visual Sci., 53 5881
–5889
(2012). http://dx.doi.org/10.1167/iovs.12-10399 Google Scholar
S. Wijeakumar et al.,
“Localization of hemodynamic responses to simple visual stimulation: an fNIRS study,”
Invest. Ophthalmol. Visual Sci., 53 2266
–2273
(2012). http://dx.doi.org/10.1167/iovs.11-8680 Google Scholar
V. Y. Toronov, X. Zhang and A. G. Webb,
“A spatial and temporal comparison of hemodynamic signals measured using optical and functional magnetic resonance imaging during activation in the human primary visual cortex,”
NeuroImage, 34
(3), 1136
–1148
(2007). http://dx.doi.org/10.1016/j.neuroimage.2006.08.048 NEIMEF 1053-8119 Google Scholar
H. H. Jasper,
“The ten twenty electrode system of the international federation,”
Electroencephalogr. Clin. Neurophysiol., 10 371
–375
(1958). ECNEAZ 0013-4694 Google Scholar
J. V. Odom et al.,
“ISCEV standard for clinical visual evoked potentials (2009 update),”
Doc. Ophthalmol., 120
(2), 111
–119
(2010). http://dx.doi.org/10.1007/s10633-009-9195-4 DOOPAA 0012-4486 Google Scholar
M. Heine and T. Meigen,
“The dependency of simultaneously recorded retinal and cortical potentials on temporal frequency,”
Doc. Ophthalmol., 108 1
–8
(2004). http://dx.doi.org/10.1023/B:DOOP.0000018367.29985.98 Google Scholar
A. Moskowitz and S. Sokol,
“Spatial and temporal interaction of pattern-evoked cortical potentials in human infants,”
Vision Res., 20
(8), 699
–707
(1980). http://dx.doi.org/10.1016/0042-6989(80)90095-4 VISRAM 0042-6989 Google Scholar
Y. Hoshi et al.,
“Relationship between fluctuations in the cerebral hemoglobin oxygenation state and neuronal activity under resting conditions in man,”
Neurosci. Lett., 245 147
–150
(1998). http://dx.doi.org/10.1016/S0304-3940(98)00197-9 NELED5 0304-3940 Google Scholar
V. Toronov et al.,
“Near-infrared study of fluctuations in cerebral hemodynamics during rest and motor stimulation: temporal analysis and spatial mapping,”
Med. Phys., 27 801
–815
(2000). http://dx.doi.org/10.1118/1.598943 MPHYA6 0094-2405 Google Scholar
T. J. Huppert et al.,
“Homer: a review of time-series analysis methods for near-infrared spectroscopy of the brain,”
Appl. Opt., 48 D280
–D298
(2009). http://dx.doi.org/10.1364/AO.48.00D280 APOPAI 0003-6935 Google Scholar
K. E. Jang et al.,
“Wavelet minimum description length detrending for near-infrared spectroscopy,”
J. Biomed. Opt., 14
(3), 034004
(2009). http://dx.doi.org/10.1117/1.3127204 Google Scholar
J. M. Lina et al.,
“Wavelet-based estimation of the hemodynamic responses in diffuse optical imaging,”
Med. Image Anal., 14 606
–616
(2010). http://dx.doi.org/10.1016/j.media.2010.04.006 Google Scholar
M. Izzetoglu et al.,
“Motion artifact cancellation in NIR spectroscopy using discrete Kalman filtering,”
Biomed. Eng., 9 16
(2010). Google Scholar
Y. Zhang et al.,
“Eigenvector-based spatial filtering for reduction of physiological interference in diffuse optical imaging,”
J. Biomed. Opt., 10
(2), 011014
(2005). http://dx.doi.org/10.1117/1.1852552 Google Scholar
S. Brigadoi et al.,
“Motion artifacts in functional near-infrared spectroscopy: a comparison of motion correction techniques applied to real cognitive data,”
NeuroImage, 85 181
–191
(2014). Google Scholar
B. Molavi and G. A. Dumont,
“Wavelet-based motion artifact removal for functional near-infrared spectroscopy,”
Physiol. Meas., 33 259
–270
(2012). http://dx.doi.org/10.1088/0967-3334/33/2/259 PMEAE3 0967-3334 Google Scholar
R. J. Cooper et al.,
“A systematic comparison of motion artifact correction techniques for functional near-infrared spectroscopy,”
Front. Neurosci., 6 147
(2012). http://dx.doi.org/10.3389/fnins.2012.00147 1662-453X Google Scholar
A. Duncan et al.,
“Optical pathlength measurements on adult head, calf and forearm and the head of the newborn infant using phase resolved optical spectroscopy,”
Phys. Med. Biol., 40 295
–304
(1995). http://dx.doi.org/10.1088/0031-9155/40/2/007 PHMBA7 0031-9155 Google Scholar
H. Zhao et al.,
“Maps of optical differential pathlength factor of human adult forehead, somatosensory motor and occipital regions at multi-wavelengths in NIR,”
Phys. Med. Biol., 47
(12), 2075
(2002). http://dx.doi.org/10.1088/0031-9155/47/12/306 PHMBA7 0031-9155 Google Scholar
C. Hock et al.,
“Age dependency of changes in cerebral hemoglobin oxygenation during brain activation: a near-infrared spectroscopy study,”
J. Cereb. Blood Flow Metab., 15 1103
–1108
(1995). http://dx.doi.org/10.1038/jcbfm.1995.137 Google Scholar
K. Sakatani et al.,
“Effects of aging on language-activated cerebral blood oxygenation changes of the left prefrontal cortex: near infrared spectroscopy study,”
J. Stroke Cerebrovasc. Dis., 8 398
–403
(1999). http://dx.doi.org/10.1016/S1052-3057(99)80047-0 Google Scholar
M. L. Schroeter et al.,
“Age dependency of the hemodynamic response as measured by functional near-infrared spectroscopy,”
NeuroImage, 19 555
–564
(2003). http://dx.doi.org/10.1016/S1053-8119(03)00155-1 NEIMEF 1053-8119 Google Scholar
W. N. Colier et al.,
“Simultaneous near-infrared spectroscopy monitoring of left and right occipital areas reveals contra-lateral hemodynamic changes upon hemi-field paradigm,”
Vision Res., 41 97
–102
(2001). http://dx.doi.org/10.1016/S0042-6989(00)00219-4 VISRAM 0042-6989 Google Scholar
M. A. McIntosh et al.,
“Absolute quantification of oxygenated hemoglobin within the visual cortex with functional near infrared spectroscopy (fNIRS),”
Invest. Ophthalmol. Vision Sci., 51
(9), 4856
–4860
(2010). http://dx.doi.org/10.1167/iovs.09-4940 Google Scholar
R. Wenzel et al.,
“Saccadic suppression induces focal hypooxygenation in the occipital cortex,”
J. Cereb. Blood Flow Metab., 20
(7), 1103
–1110
(2000). http://dx.doi.org/10.1097/00004647-200007000-00010 Google Scholar
F. Orihuela-Espina et al.,
“Quality control and assurance in functional near infrared spectroscopy (fNIRS) experimentation,”
Phys. Med. Biol., 55
(13), 3701
(2010). http://dx.doi.org/10.1088/0031-9155/55/13/009 PHMBA7 0031-9155 Google Scholar
I. Tachtsidis et al.,
“Investigation of cerebral haemodynamics by near-infrared spectroscopy in young healthy volunteers reveals posture-dependent spontaneous oscillations,”
Physiol. Meas., 25 437
–445
(2004). http://dx.doi.org/10.1088/0967-3334/25/2/003 PMEAE3 0967-3334 Google Scholar
P. Wobst et al.,
“Linear aspects of changes in deoxygenated hemoglobin concentration and cytochrome oxidase oxidation during brain activation,”
NeuroImage, 13 520
–530
(2001). http://dx.doi.org/10.1006/nimg.2000.0706 NEIMEF 1053-8119 Google Scholar
B. W. Zeff et al.,
“Retinotopic mapping of adult human visual cortex with high-density diffuse optical tomography,”
Proc. Natl. Acad. Sci., 104
(29), 12169
–12174
(2007). http://dx.doi.org/10.1073/pnas.0611266104 Google Scholar
BiographyNasser H. Kashou is an assistant professor at the WSU and an IEEE senior member. He received his PhD in 2008 from The Ohio State University’s Biomedical Engineering Department. He received his Master of Science in electrical engineering in 2004. Currently, he is running the BioMedical Imaging Lab at WSU. He has also established and runs the functional near infrared spectroscopy lab. Brenna M. Giacherio received her Master of Arts in physics in 2010 from Western Michigan University and her Master of Science in biomedical engineering in 2014 from WSU. She worked as a research associate and senior member of the biomedical imaging and fNIRS laboratories. Her expertise includes biomedical signal processing, medical imaging, image processing, probability and statistics, and experimental design and analysis. |


