
|
|
1.IntroductionSpines are small nanoscale protrusions located on neurons as excitatory contact points, relaying electrochemical signaling between brain cells. Although documented over a century ago by Santiago Ramón y Cajal,1 their inner molecular organization has only been elucidated more thoroughly during recent decades. For several neuronal proteins, their specific nanoscale locations are, however, not yet fully disentangled, and function is assumed to direct from topological organization in the neuronal architecture (on small as well as on large scales); elucidation of synaptic assemblies is thus of considerable interest in neurobiology.2 A central determinant for the function of neurons in the brain is the postsynaptic molecular composition in spines. Which proteins are localized, where and to which amount, and how do possible interactions determine functional properties within and between neurons? As is well known, malfunction in synaptic signaling may generate different neuropsychiatric disorders (e.g., schizophrenia, bipolar disorders, autism, and attention deficit hyperactivity disorder [ADHD]). However, finer details of the protein distribution in spines are blurred in classical live-cell fluorescence microscopy (see Fig. 1). In order to study localization, interactions, and trafficking of proteins at the nanoscale, high temporal and spatial resolution with live-cell compatible microscopy is thus desired. Fig. 1Cultured neurons immunolabeled with (a) monoclonal anti--ATPase and (b) transfected with eGFP to visualize mature morphology and overview of membrane bound sodium-pump topology (ATP1A3) as done with confocal imaging (applied objective ). Scale bar . 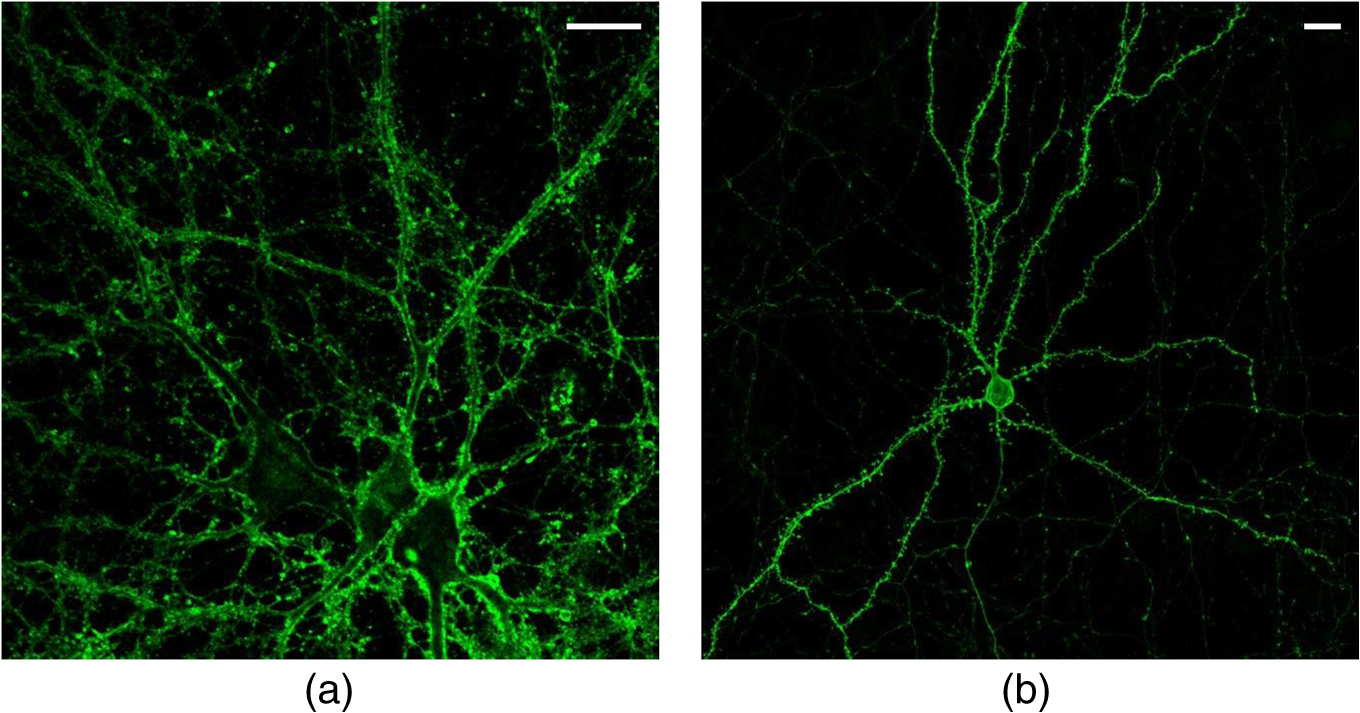 During the last decade, a handful of pioneering scientists have achieved the long-sought-after goal of visualizing the nanoscopic world with noninvasive optical microscopy. Optical switching was the unique solution that now allows one to separate and resolve neighboring fluorescent molecules on the nanoscale.3 Several flavors of “super-resolution” microscopy techniques today exist, thus allowing life scientists to beneficially select the most appropriate technique.4–6 Stochastic switching of single-fluorescent molecules with subsequent localization and image rendering (e.g., photoactivated localization microscopy [PALM] or stochastic optical reconstruction microscopy [STORM]) is one common imaging modality.7 Targeted switching at a selected point (or set of points) as applied in stimulated emission depletion microscopy (STED) or reversible saturable optical fluorescence transition (RESOLFT) microscopy is yet another.8 Additionally, structured illumination microscopy (SIM) is a third imaging approach that allows resolving into the sub-hundred nanometer regime.9 The developed techniques can all be applied with either immunohistochemical labeling or genetic transfection and are similar in many respects, but distinct in others (data generation, speed, multiplexing, resolution, and analysis) with potential of further developments and combinations.10–12 The principal energy consumer in the brain is the sodium pump (-ATPase), a membrane-bound enzyme that harnesses energy from ATP to establish a chemoelectric gradient across the plasma membrane in mammalian cells, by transporting three out of the cell and importing two while hydrolyzing one ATP.13 The established chemoelectric gradient is later used as the energy source to drive action potentials, for secondary active transport of glucose and amino acids, and for co- and countertransport of ions in neurons. The overall structural form of -ATPase is a heterotrimeric complex, where the alpha subunit being the catalytic subunit transporting and while converting ATP.14 In neurons, two different isoforms of the alpha subunit are expressed: the ubiquitous (ATP1A) and the neuron-specific (ATP1A3), which demonstrate different affinities for sodium and potassium, as well as kinetic turnover rates.15–17 In the case of mutations in the protein-coding sequence of the -isoform, a series of severe neurological disorders and diseases are correlated to enzymatic malfunction.18–20 Moreover, it has recently been shown experimentally and computationally that the sodium pump may provide a cellular memory of previous activity in neurons by controlling potentiation while interacting with different processing ion channels.21–28 Such integral feedback systems are suggested to be a crucial part of how the central nervous system can maintain stable functions, i.e., not to “go nuts” while allowing plastic mechanisms to shape synaptic outputs and network functions; processes that are assumed crucial for learning-related adaptations in the neuronal network.29 A plethora of modulatory messengers are at hand for fine-tuning cooperative processes of the pump and its regulation.30–33 Termination of repetitive seizures in neurons has additionally been shown to depend on sodium and potassium (as well as chloride) homeostasis regulated by the pump.34 The importance of -ATPase is thus easily motivated for ionic control and regulation in the brain. In this work, we present some comparisons of PALM and STED microscopy data for the investigation of estimated labeled and expressed amounts in dendritic spines of the membrane-bound sodium pump (-ATPase), the essential protein responsible for maintaining resting membrane potential and controller of intracellular ion homeostasis. Our comparisons assess how imaging method and variations in labeling strategies and sample analysis may be critical factors for quantification. Furthermore, we discuss subsequent influences protein estimates of the sodium pump may have for homeostatic ion regulation and energy consumption in neurons.35 2.Results2.1.Stimulated Emission Depletion MicroscopyFigure 2 shows cultured striatal rat neurons immunolabeled for the sodium pump (ATP1A3) visualized with conventional confocal microscopy and super-resolution STED microscopy. Only the STED images reveal discernible pools of -ATPase complexes (green clusters in Fig. 2) both in the heads and necks of the spine structures with areas of empty patches, which realistically one assumes contains co-occurring postsynaptic proteins. Confocal imaging may be used as a “morphological” overview onto which one may attach resolved nanoscale clusters. Spine-heads viewed from the side, tilted, as well as from above reveals a modulated distribution of sodium-pump complexes. Analyzing only spines projecting out from dendrites in the plane of the cover slip reveals spatial sizes of individual -ATPase clusters having FWHM-values ranging from 43 to 88 nm, with a mean of 58 nm ( spines). Assuming physical dense packing of pumps (crystallographic size )14 in these nanoscale clusters would allow a total of around -ATPase per spine structure (average of 5 to 6 clusters per spine). This value is an exogenous upper range estimate of the number of sodium pumps possible to achieve in the spine, but estimated with maximized geometric packing assumption. Using estimates from real biochemical data,36 assuming a scaffolding of only a single sodium pump per postsynaptic scaffold protein, which has a mean density of 4 to 5 PSD-95 molecules per membrane area, generate data suggesting that individual clusters may contain no more than 15 to -ATPase. Total expression may thus be around 50 to 90 pumps being expressed in individual spines. Fig. 2(a) Confocal imaging of dendritic spines immunolabeled for the neuronal sodium pump. (b) STED images of typical sodium-pump topology in spines projecting out from dendrites in the plane of the cover slip. Scale bar 300 nm. 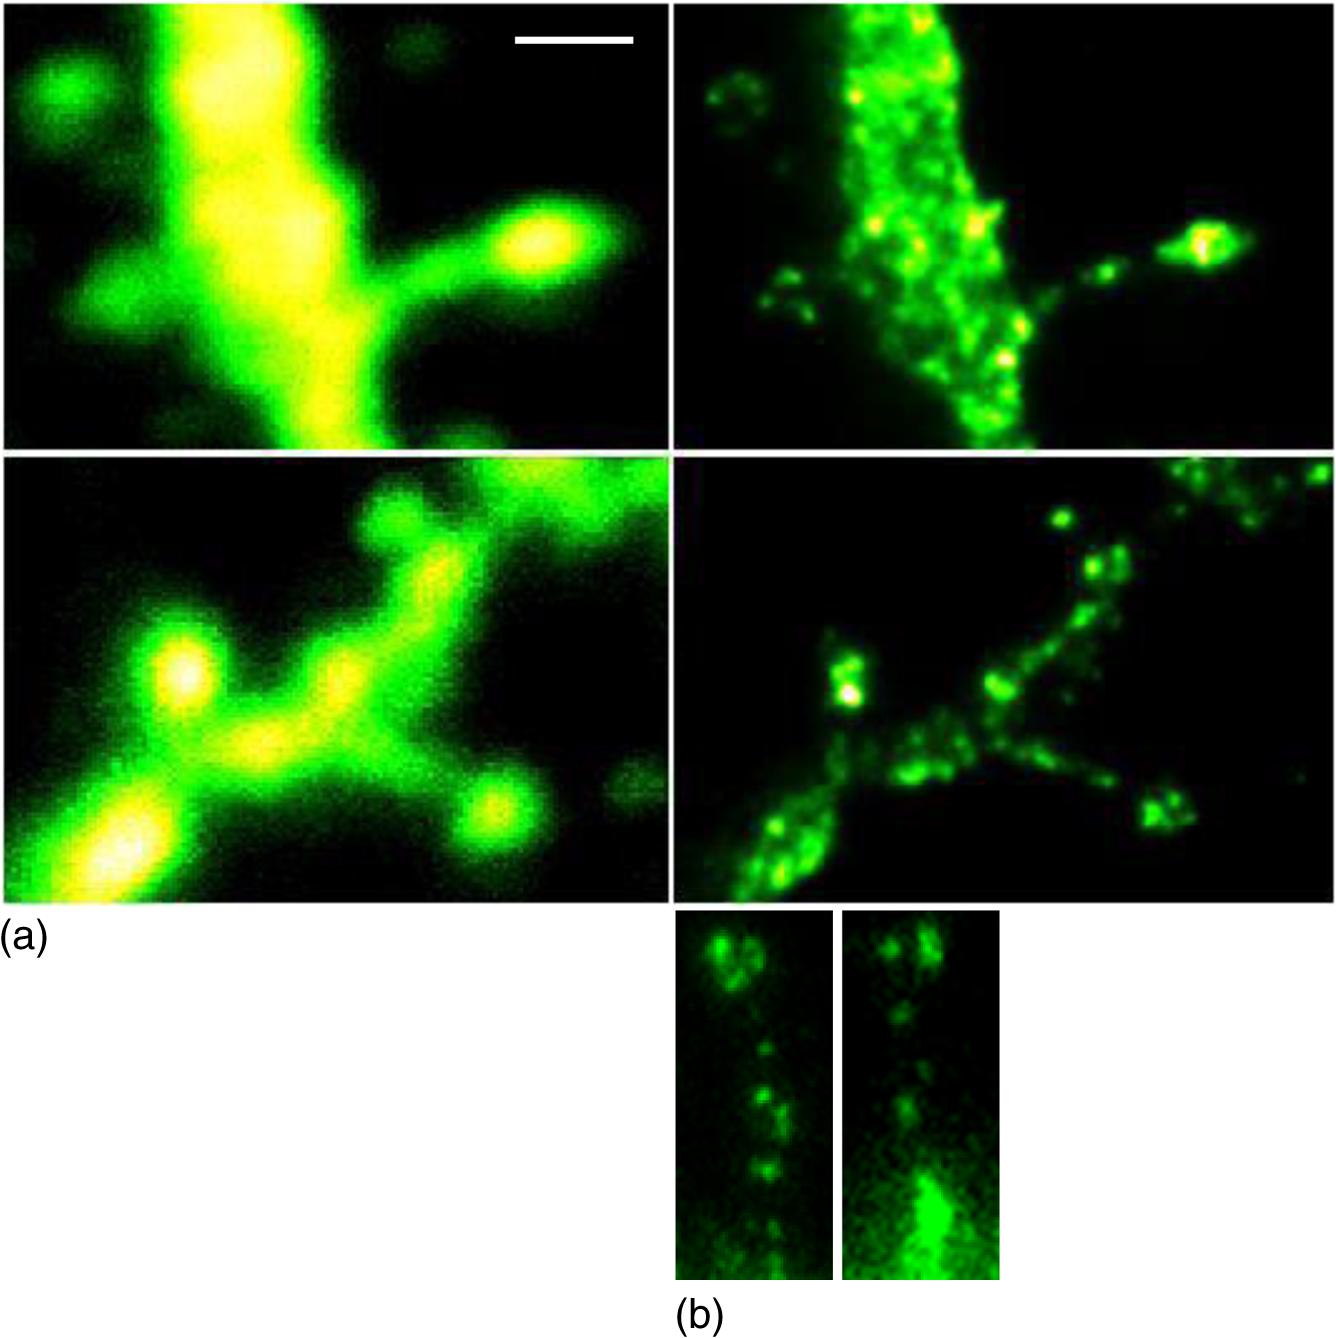 Analyzing the fluorescence intensity of the nanoclusters and comparing them to single fluorescence spots of antibodies nonspecifically attached to the bare cover slip reveals only a three to five times higher intensity of the labeled sodium-pump nanoclusters. The latter estimates possibly indicate that only a handful of pumps could be immunocytochemically labeled in each discernible cluster. Expression is then deduced to be about 15 to 30 sodium pumps in total for individual spines, as indicated earlier.37,38 As it has frequently been pointed out with antibody labeling, the molecular “bulky” size may induce distortions to epitope accessibility and to a physical broadening of the nanoclusters. Estimated numbers may thus be an overestimate if the antibodies physically increase the size of the imaged clusters, or possibly an underestimate if quantification is based on fluorescence intensity. Assessments of “true” amount of the sodium pump should in the future apply directly conjugated primary antibodies or Fab fragments having smaller physical size to evaluate any spatial influences on endogenous quantifications. Application of small-sized aptamers or nanobodies is also a suitable labeling tool,39,40 if they are available toward the studied biomolecules. Taken together, a total expression of tens of sodium pumps per spine structure as revealed by STED and fluorescence intensity is deduced. 2.2.Photoactivated Localization MicroscopyFigure 3 shows cultured hippocampal rat neurons transfected with photoconvertible (PC-mEos3.2),41,42 exogenously expressed as fusion proteins together with the sodium pump (ATP1A3) and visualized by PALM and wide-field microscopy [Figs. 3(a) and 3(b)]. The image combination allows getting a morphologic overview onto which single molecule localization events may be distributed. In addition, to allow further control of postsynaptic regions, separating them from dendrites, mCherry-tagged PSD-95 [red in Fig. 3(c)] was combined with photoactivable enhanced GFP (eGFP) (PA-eGFP) tagged sodium pumps. Wide-field PSD-95 images were acquired immediately before PALM imaging by laser excitation at 561 nm. The sequence for mCherry was subcloned into the transfection plasmid vector before inserting the PSD-95 sequence as applied previously.43 As clearly dissected, PALM images visualize a sodium-pump topology (in agreement with STED) that the spine structures contain nanoclusters (green clusters in Fig. 3). Furthermore, heads and necks projecting out from dendrites reveal discrete distributions of sodium-pump complexes in the PALM rendered image, with appearing higher number of clusters in head areas. Both samples were cultured for 2 weeks with a subsequent week of transfection growth before imaging. Fig. 3PALM and wide-field images of the sodium pump tagged with PC-mEOS3.2 first imaged (b) in its unconverted form and (a) then converted to single molecule localization rendering. (c) PALM imaging of dendritic spines transfected with PA-eGFP toward the sodium pump with wide-field overlay of the postsynaptic scaffolding protein PSD-95 tagged with mCherry. Scale bar 300 nm. 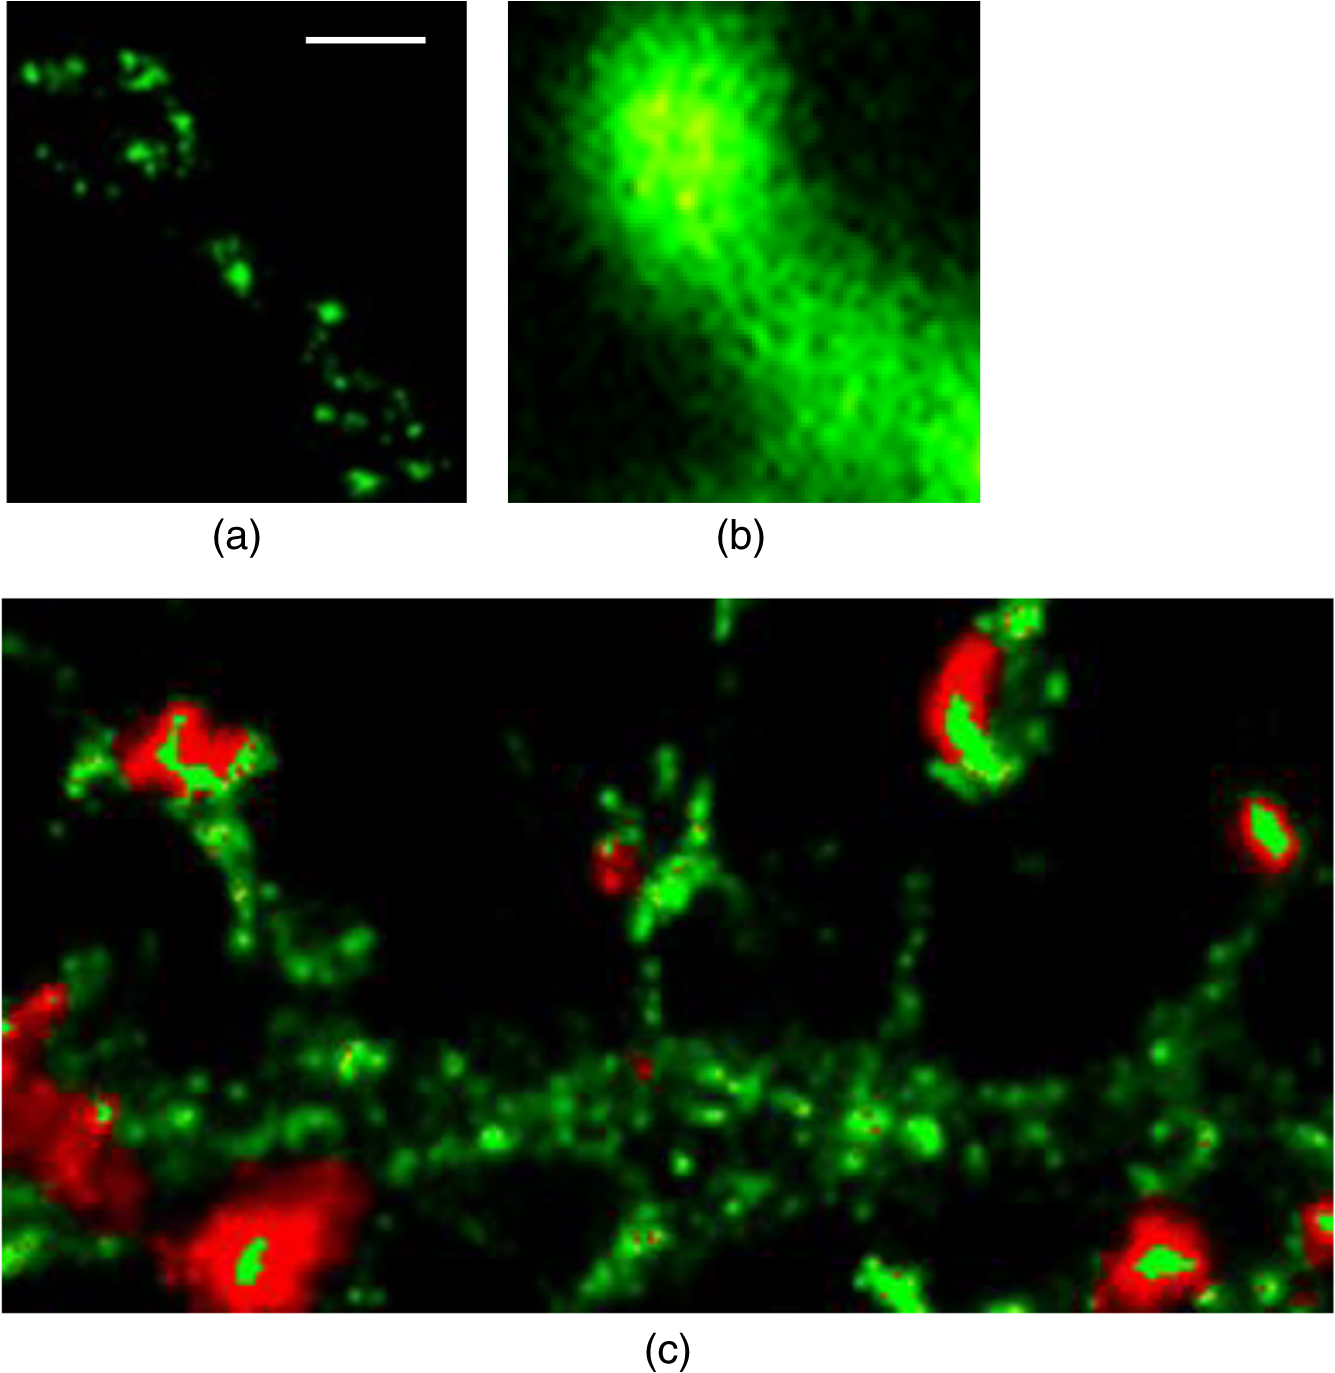 In pointillistic imaging, summation of single molecule detection events (over many thousands of acquisition frames) gives a possibility of quantifying molecule densities within a given region-of-interest.44–48 For quantification, spines were isolated from whole cell recordings and individually assessed for single molecule density calculations for both fluorescent probes. The estimated mean precision of both probes were similar, 20 and 25 nm for PC-mEos3.2 and PA-eGFP, with spread from around 10 to 50 nm, respectively.49 Although PALM data are often filtered for improved localization precision, our recordings have included all recorded single-molecule detection values. Localized events were processed for arbitrarily shaped cluster analysis,50 deducing mean cluster sizes of for PC-mEos3.2 and for PA-eGFP ( spines analyzed). Equivalent areas correspond to radiuses of 55 nm for PC-mEos3.2 and 80 nm for PA-eGFP. Cluster sizes ranged from 0.01 to for PC-mEos3.2 and 0.07 to for PA-eGFP. The number of events per cluster was 43 to 215 (with a mean of 124) for PC-mEOS3.2 and 42 to 319 (with a mean of 153) for PA-eGFP. The number of clusters per spine ranged between 2 and 5 (mean 3.3) for PC-mEos3.2 and 3 and 9 (mean 6.4) for PA-eGFP. This is in agreement with immunohistochemical investigations with STED as shown earlier, where cluster sizes and numbers of cluster per spine correlate quite well. Estimated number of -ATPase per cluster is, however, higher with PALM quantification. Total number of sodium pumps per spine is here deduced to about 410 for PC-mEos3.2 and 980 for PA-eGFP. The larger on-off switching ratio (effecting the achievable localization density)51 might explain the higher value of cluster sizes and numbers for PA-eGFP around two times, which is reciprocally generated from a higher total amount of pumps. Another concern is the subsequent data analysis applied by the cluster analysis density-based spatial clustering of application with noise (DBSCAN) algorithm, which with increasing point densities may overestimate cluster numbers.52 Absolute single-molecule localization estimates must thus also be considered as approximate, as each of the applied fluorescent probes has limitations preventing perfect quantifications.53,54 Of primary interests are fluorescent proteins activation/conversion efficiency and “photoblinking” effects,51,55 which either mask or induce overcounting of entities. Fitting estimated amounts with varied detection times in the low (dark) time regime, as developed by Annibale et al.55 to correct for photoblinking, gave estimates of around 40% overcounting for PA-eGFP and 25% for PC-mEos3.2. These estimates thus reduce mean expression of pumps per clusters to 92 for PA-eGFP and 93 for PC-mEos3.2. However, activation/conversion efficiencies of photoactivatable and photoconvertible fluorescent proteins have been estimated to 40% to 60%,53 meaning that half of possible exogenous-introduced probes may not be detectable. A “true” estimate of total sodium-pump densities is thus challenging (i.e., depending on fluorescent probe and analysis), and deducible numbers might also be influenced by biological “overexpression” (i.e., sample preparation). However, for the highly regulated -ATPase system for which molecular function is heteromerically bound to endogenous levels of the beta-subunit, we expect a minor effect of transfection excess.56 On the other hand, the deduced exogenous densities might be an underestimate due to the competition with the endogenous protein for beta subunits. Future investigation should aim to achieve endogenous levels of proteins via, e.g., CRISPR/Cas9 gene-editing to control sodium-pump expression levels. Use of transgenic animals with knock-in of a labeled protein of interest might be another suitable approach, as recently shown for quantifications of the scaffolding protein Gephyrin in neurons.48 3.Discussion and ConclusionAs estimated by STED and PALM imaging, total sodium-pump numbers per spine structure may vary from tens to several hundred comparing the former and latter methods. With the discussion of “photoblinking” and overexpression in mind, one may consider PALM deductions to be possible overestimates. On the other hand, competition with endogenous expressions for building blocks to produce heterotrimeric -ATPase and activation/conversion efficiencies might generate underestimates. Likewise, STED measurements may be underestimates due to possible incomplete epitope labeling. Overestimates may likewise come from the antibody possibly broadening cluster sizes if used to estimate pump numbers. Optimization of immunolabeling with selection of highly specific antibodies and controlled transfection systems for fluorescent protein expression is thus crucial step in sample preparation. Subsequently, data analysis has to be selected accordingly to allow “true” estimates of protein amount from the applied nanoscopic imaging methods. In our opinion, the obvious question one must then ask is if deduced amounts may be suitable for physiological regulation. Alle et al.57 have estimated that in the mammalian brain a density of -ATPase of is enough to keep pace with steady sodium influx (average loading frequency 0.15 Hz). If fast sodium regulation is intended (i.e., 26-Hz burst loading of sodium to be relocated in 1 second), several hundreds of are needed.57 These numbers seem to be within estimates found here experimentally in immunolabeled resolved STED images or with transfected PALM imaged neurons. Furthermore, homeostatic regulation of sodium has been studied and described for many different systems, including neurons. In a series of studies, Rose58,59 has investigated sodium homeostasis in dendritic spines. Figure 4 shows a performed experiment where a sodium-sensitive dye was applied to measure transient sodium loads in dendrites and in spines (burst loading at 50 Hz). Response in spines typical accumulate a sodium load of 45 mM and this load is thereafter cleared during a “fast” () and a “slow” () recovery phase to intracellular baseline levels (i.e., ). Assuming a physically sized spine as seen in Fig. 2 (diameter ; volume ), the accumulated sodium load corresponds to about entering the spine-head (loaded via AMPA and NMDA receptors located in the head membrane). Available kinetic data can be used to estimate how many sodium pumps are needed to clear this physiological sodium load. The enzymatic turnover rate for the neuron-specific sodium pump (ATP1A3) reaches a value of at maximum,15 and will at intracellular levels of 50 mM be working almost at full capacity (see Fig. 5). Assuming an average turnover rate to be , 200 enzymatic turnovers will occur during the “fast” 2 s clearing period. Each enzymatic turnover extrudes three sodium ions, which gives that a total of is extruded by a single pump. Thus a total amount of about 630 neuronal sodium pumps is needed to extrude the full load of during the “fast” 2 s phase of the recovery. The latter calculated estimate is, however, an overestimate, as neurons also contain the ubiquitous -isoform (AT1A1), considering the “housekeeping” pump establishing baseline homeostatic sodium concentration gradients across the plasma membrane. The full extrusion dynamics of sodium ions is thus occurring by a combination of “fast” emptying of high sodium concentrations via the -isoform (ATP1A3) and a “slower” emptying occurring via a combined effort of the neuronal and ubiquitous sodium pump at lower concentrations. This shared workload is ideally suitable to cope with high and low sodium concentrations in neurons, and indicates that an approximately equal amount of the two -ATPase isoforms (ATP1A1 and ATP1A3) would be needed, as suggested earlier.49 Fig. 4Using two-photon fluorescence imaging with suprathreshold synaptic stimulation (five afferent stimuli at 50 Hz) in CA1 pyramidal tissue cells, transient sodium gradients were detected in “activated” spines and adjacent dendrites. Recovery follows biexponential decay with a fast time constant () and a slow time constant (). Reprinted with permission from the licensed publisher, Springer-Verlag.59 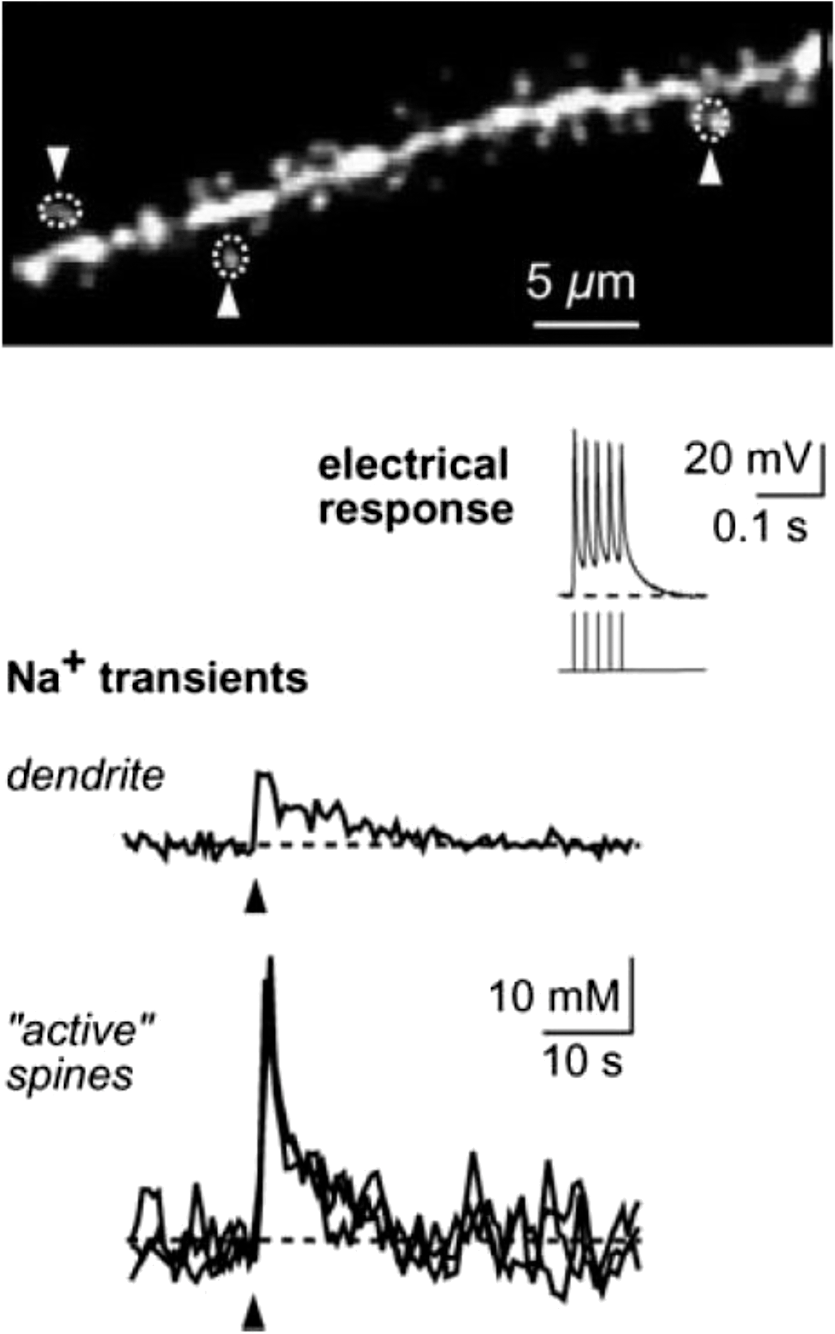 Fig. 5Enzyme kinetics of the ubiquitous isoform and the neuron specific isoform. (a) Kinetics data taken from Zahler et al.15 Normalized pump rates for (black line) and (gray line) as a function of sodium concentrations. (b) The 50% intracellular sodium affinity value () is 12 mM for and 33 mM for , and the Hill coefficient is 3.5 for and 6.8 for . Pump rates for both isoforms scaled to reflect the difference in maximum rate, so that the neuron specific isoform (gray line) has a 10 times higher maximum turnover rate than (black line). Additionally, the summed pump rate from combining (equal amounts of) the isoforms is also shown (black-dashed line). 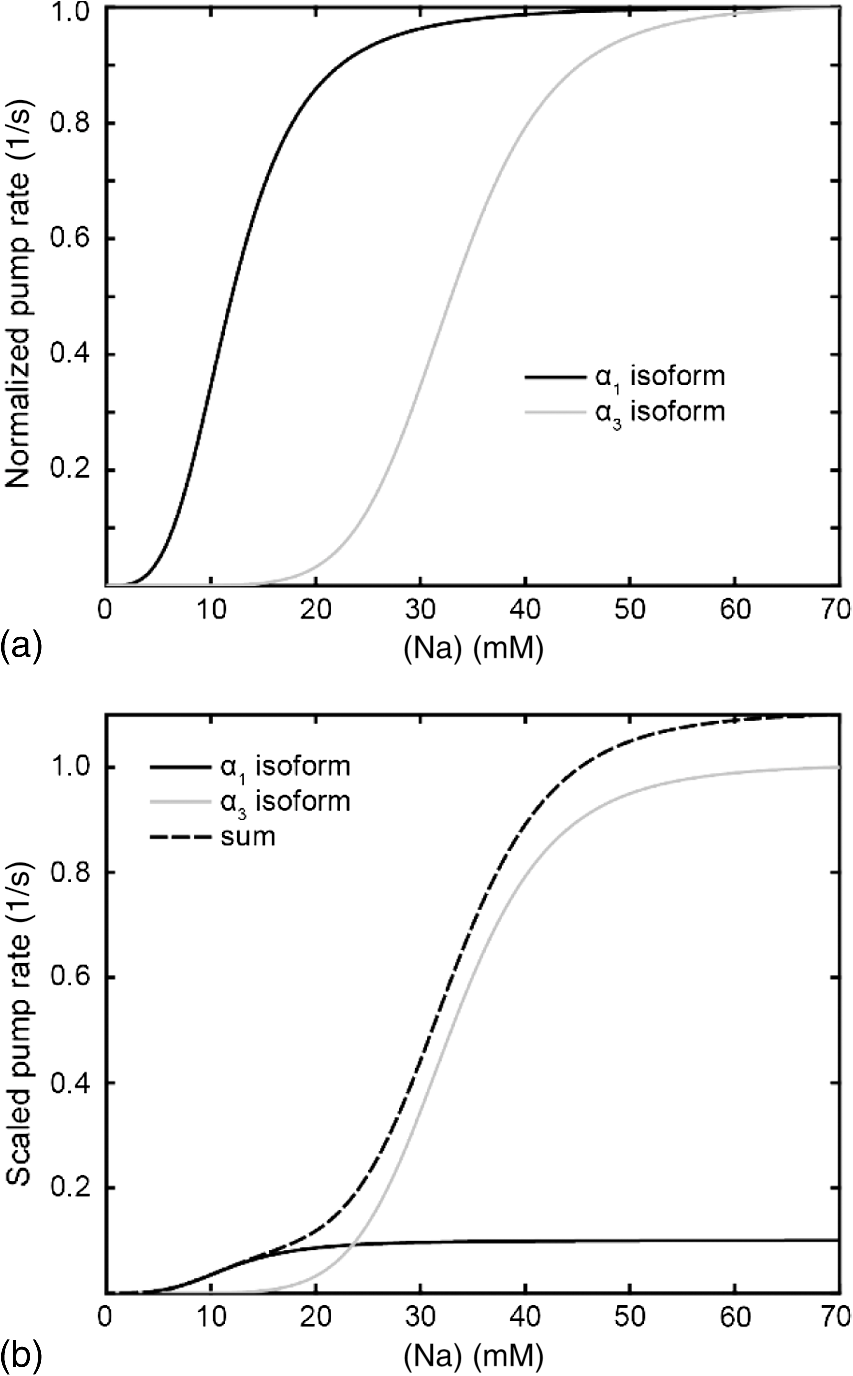 To conclude, each spine is unique in the number and positions of contact points with neighboring axonal presynaptic neurons and glia cells, and within its distribution of postsynaptic proteins.2 This complexity is probably a consequence of the functional regulation setup by and needed within the brain, allowing a plethora of biochemical interactions with variability in strength and speed to be tuned to demands put onto the network-controlling system. Accordingly, the number of sodium pump in neurons is under tight energy control to fulfill its function to regulate fast and large variations in ion concentrations.35 Interestingly, published data show that a distribution of sodium amplitudes may be detected from individual spines, indicating variability in sodium regulation. In this work, with the use of super-resolution STED and PALM imaging, we have discussed estimates of copy numbers of the sodium pump in dendritic spines. The deduced quantification has been compared between methods and to experimental and theoretical functional estimates. Overall, a one-to-one comparison is challenging since several parameters within and between the two methods affects quantification. Comparison to physiological data is thus essential to correlate estimates. A low density of sodium pumps () may prevent the postsynaptic spine compartment from being exposed to ever increasing sodium concentrations at a low steady state influx.57 Similar low amounts of sodium entry AMPA channels (tens/spine head) have also been dissected by super-resolution imaging and the estimates were found to be functionally adequate.44,46 A high density of -ATPase () delivers a sufficient number of pumps to provide a capacity for rapid restoration of high sodium levels and preventing the postsynaptic spine compartment from being exposed to prolonged “unphysiological” sodium levels.58,59 Taken together, this suggests that the finest structures of the nervous system, the dendritic spines, do not need many -ATPase to physiologically regulate and modulate the dynamics of intracellular sodium. The balance of the high-capacity/low-affinity sodium pumps (ATP1A3) for fast extrusion and the low-capacity/high-affinity pumps (ATP1A1) for homeostatic base-line regulation is likely a fine-tuned system for the integrated function and for conservation of energy.17 In addition to assessed -ATPase amounts, the topological distribution of pumps and overall spine structure morphology (including internal diffusional properties) may play an important roles in this ionic regulation, which should be possible to model mathematically and to compare physiological functions.34 4.Materials4.1.Cellular Cultures and Protein LabelingTo investigate the sodium-pump distribution in dendritic spines, primary dissociated cultured neurons from the hippocampal or striatal area were prepared from Sprague Dawley rat embryo. All animal procedures were controlled and approved by the Stockholm North ethical evaluation board for animal research. Following published protocols, neurons were cultured for about 3 weeks and then immunohistochemically stained, or after 2 weeks transfected with fluorescent protein vectors to label the neuron-specific sodium pump.37,38,49 The primary antibody used was the well characterized mouse monoclonal anti- -ATPase (Affinity Bioreagents, MA3-915)60 together with a secondary antibody goat anti-mouse Alexa594 (Molecular Probes Inc.) for immunofluorescence. Labeling was optimized regarding selection of fixatives (methanol selected), permeabilization solution (0.1% Triton X-100 used), blocking media (7% normal goat serum used), and concentrations of primary (1:1000 dilution in PBS selected) and secondary (1:500 dilution in PBS selected) antibodies. ATP1A3 plasmids subcloned with eGFP, PA-eGFP, and photoconvertible mEos3.2 (PC-mEos3.2) were used to transfect cultured cells with Lipofectamine 2000 (Life Technologies) according to manufacturer’s recommendations. Transfected cells were analyzed 6 to 7 days after transfection. Figure 1 shows confocal overview images of cellular cultures with mature morphology as later used in the experimental section where super-resolution fluorescence imaging with STED and PALM were applied to elucidate sodium-pump organization in dendritic spines. 4.2.Stimulated Emission Depletion MicroscopyThe STED imaging was done on a custom built system similar to previously reported,61 with some minor modifications. A white-light super-continuum laser source (SC-450 HP, Fianium) delivering both excitation and stimulated emission depletion wavelengths (, ) was coupled together using a dichroic mirror (z690SPRDC, Chroma) before being sent into the microscope objective (HCX PL APO , Leica). The fluorescence from the labeled sample was collected back through the objective and separated from excitation and STED light by a customized dichroic mirror (Laseroptik, Garbsen, Germany) and a bandpass filter (ET615/30, Chroma) placed in front of a single-photon-sensitive avalanche photodiode (SPCMAQRH-13-FC, PerkinElmer) fitted with a multimode optical fiber acting as optical pinhole (). The sample was placed on a three-dimensional scanning piezo stage coupled to a controller unit (MAX311/M and BPC203, Thorlabs) offering a closed loop positional resolution of 5 nm. STED images were acquired with a pixel size of 15 to 25 nm and a pixel dwell time of 0.5 to 1 ms. Raw STED images were before further analysis deconvoluted using a Richardson-Lucy algorithm with an assumed 40-nm Lorentzian shaped point spread function (PSF).61 Image analysis of sodium-pump nanoclusters was performed by a custom written code in MATLAB® (MathWorks Inc., Natick, Massachusetts). STED cluster sizes were estimated as the mean full width half maximum value averaged over 20 directions from peak cluster intensity values.62 4.3.Photoactivated Localization MicroscopyThe PALM imaging was done on a commercial Carl Zeiss Elyra PS.1 system equipped with lasers for wide-field activation/conversion and excitation at 405, 488, and 561 nm (as well as 642 nm). PALM imaging of PA-eGFP was accomplished with 405 nm activation and 488 nm excitation (15%, maximum output 200 mW), whereas imaging of PC-mEos3.2 was accomplished with 405 nm conversion and 561 nm excitation (20%, maximum output 150 mW). Activation/conversion intensities were kept at minimal levels to restrict stochastic activation events to low and distinct single molecule densities, and then gradually increased to maintain sufficient activation/conversion during image recordings. An oil objective Plan-Apochromat DIC was used for all PALM imaging. Lasers were kept at oblique angles (near-TIRF or HILO) to maintain low axial excitation thickness and enhance signal contrast. The detector EMCCD-gain on the Andor iXon DU 897 () was set at 100. PALM images consisted of 5000 acquisition frames of 50 and 100 ms for PA-eGFP and PC-mEos3.2, respectively, were collected. Subsequent PALM rendering and analysis were performed with the integrated system software (ZEN 2012 SP2 Black). Peak intensity to noise ratio for single-molecule detection was processed with settings of 4.5 and 6.0 for PA-eGFP and PC-mEos3.2, respectively, with a detector mask size of ( in the image focal plane). Grouping of molecular detection events (with maximum on times and off gap times) were set to five frames for PA-eGFP and PC-mEos3.2, respectively. The grouping pixel radius for reoccurring and persistent events was set to 150 nm. Drift correction was done with the model-based autocorrelation of whole image section registrations (number of segments set to 10). Rendering for visualization was done with a Gaussian display mode, , and PSF expansion factor. Sodium pump analysis for PALM was performed by a custom written code in MATLAB® (MathWorks Inc.) applying the algorithm DBSCAN.50 The algorithm finds neighbors of data points within a circle of radius (here selected as the mean detection precision from PA-eGFP and PC-mEos3.2 in individual spines) to define a seeding cluster and the process continues until all density connected clusters are found. The density parameter (MinPts in the algorithm) was selected by plotting the number of clusters as a function of point density, and selecting the first “valley” as threshold number of connections (as suggested in Ref. 50). AcknowledgmentsThe authors are grateful for the support with sample preparation, microscopy imaging and analysis, including scientific discussions from and with Drs. Lena Scott, Thomas Liebmann, Otto Manneberg, and Daniel Rönnlund, as well as Professors Anita Aperia and Jerker Widengren at the Karolinska Institutet and the Royal Institute of Technology in Stockholm Sweden. This work was financially supported by the Swedish Research Council (Grant No. VR-2013-6041). ReferencesR. Yuste,
“The discovery of dendritic spines by Cajal,”
Front. Neuroanat., 9 18
(2015). http://dx.doi.org/10.3389/fnana.2015.00018 Google Scholar
Z. Li and M. Sheng,
“Some assembly required: the development of neuronal synapses,”
Nat. Rev. Mol. Cell Biol., 4 833
–841
(2003). http://dx.doi.org/10.1038/nrm1242 COCBF4NRMCBP 1367-59311471-0072 Google Scholar
D. Choquet,
“The 2014 Nobel Prize in chemistry: a large scale prize for achievements on the nanoscale,”
Neuron, 84 1116
–1119
(2014). http://dx.doi.org/10.1016/j.neuron.2014.12.002 NERNET 0896-6273 Google Scholar
B. O. Leung and K. C. Chou,
“Review of super-resolution microscopy for biology,”
Appl. Spec., 65
(9), 967
–980
(2011). http://dx.doi.org/10.1366/11-06398 Google Scholar
T. J. Gould, S. T. Hess and J. Bewersdorf,
“Optical nanoscopy: from acquisition to analysis,”
Annu. Rev. Biomed. Eng., 14 231
–254
(2012). http://dx.doi.org/10.1146/annurev-bioeng-071811-150025 ARBEF7 1523-9829 Google Scholar
V. Marx,
“Is super-resolution microscopy right for you?,”
Nat. Methods, 10 1157
–1163
(2013). http://dx.doi.org/10.1038/nmeth.2756 1548-7091 Google Scholar
M. Bates, B. Huang and X. Zhuang,
“Super-resolution imaging by nanoscale localization of photo-switchable fluorescent probes,”
Curr. Opin. Chem. Biol., 12 505
–514
(2008). http://dx.doi.org/10.1016/j.cbpa.2008.08.008 Google Scholar
S. W. Hell,
“Far-field optical nanoscopy,”
Science, 316 1153
–1158
(2007). http://dx.doi.org/10.1126/science.1137395 SCIEAS 0036-8075 Google Scholar
M. G. L. Gustafsson et al.,
“Three-dimensional resolution doubling in wide-field fluorescence microscopy by structured illumination,”
Biophys. J., 94 4957
–4970
(2008). http://dx.doi.org/10.1529/biophysj.107.120345 BIOJAU 0006-3495 Google Scholar
M. Eisenstein,
“Super-resolve me: from micro to nano,”
Nature, 526 459
–462
(2015). http://dx.doi.org/10.1038/526459a Google Scholar
K. Bourzac,
“Beyond the limits,”
Nature, 526 S50
–S54
(2015). http://dx.doi.org/10.1038/526S50a Google Scholar
S. W. Hell et al.,
“The 2015 super-resolution microscopy roadmap,”
J. Phys. D: Appl. Phys., 48 443001
(2015). http://dx.doi.org/10.1088/0022-3727/48/44/443001 JPAPBE 0022-3727 Google Scholar
J. C. Skou and M. Esmann,
“The Na, K-ATPase,”
J. Bioenerg. Biomem., 24 249
–261
(1992). JBBID4 0145-479X Google Scholar
C. Toyoshima, R. Kanai and F. Cornelius,
“First crystal structure of Na+, K+ -ATPase: new light on the oldest ion pump,”
Structure, 19 1732
–1738
(2011). http://dx.doi.org/10.1016/j.str.2011.10.016 STRUE6 0969-2126 Google Scholar
R. Zahler et al.,
“Sodium kinetics of Na, K-ATPase α isoforms in intact transfected HeLa cells,”
J. Gen. Physiol., 110 201
–213
(1997). http://dx.doi.org/10.1085/jgp.110.2.201 JGPLAD 0022-1295 Google Scholar
M. Dobretsov and J. R. Stimers,
“Neuronal function and alpha3 isoform of the Na/K-ATPase,”
Front. Biosci., 10 2373
–2396
(2005). http://dx.doi.org/10.2741/1704 Google Scholar
G. Azarias et al.,
“A specific and essential role for Na, K-ATPase alpha3 in neurons co-expressing alpha1 and alpha3,”
J. Biol. Chem., 288 2734
–2743
(2013). http://dx.doi.org/10.1074/jbc.M112.425785 JBCHA3 0021-9258 Google Scholar
E. E. Benarroch,
“Na+, K+ -ATPase,”
Neurology, 76 287
–293
(2011). http://dx.doi.org/10.1212/WNL.0b013e3182074c2f NEURAI 0028-3878 Google Scholar
G. S. Kirshenbaum et al.,
“Decreased neuronal Na+, K+-ATPase activity in Atp1a3 heterozygous mice increases susceptibility to depression-like endophenotypes by chronic variable stress,”
Gene, Brain Behav., 10 542
–550
(2011). http://dx.doi.org/10.1111/j.1601-183X.2011.00691.x Google Scholar
E. L. Heinzen et al.,
“Distinct neurological disorders in ATP1A3 mutations,”
Lancet, 13 503
–514
(2014). http://dx.doi.org/10.1016/S1474-4422(14)70011-0 LANCAO 0140-6736 Google Scholar
J. H. Kim et al.,
“Presynaptic Ca2+ buffers control the strength of a fast post-tentanic hyperpolarization mediated by the α3 Na+/K+-ATPase,”
Nat. Neurosci., 10 196
–205
(2007). http://dx.doi.org/10.1038/nn1839 NANEFN 1097-6256 Google Scholar
S. Arganda, R. Guantes and G. G. de Polavieja,
“Sodium pumps adapt spike bursting to stimulus statistics,”
Nat. Neurosci., 10 1467
–1473
(2007). http://dx.doi.org/10.1038/nn1982 NANEFN 1097-6256 Google Scholar
E. M. Adler,
“Linking channels and pumps,”
Sci. Signal, 2 ec128
(2009). http://dx.doi.org/10.1126/scisignal.266ec128 1945-0877 Google Scholar
D. Zhang et al.,
“Na, K-ATPase activity regulates AMPA receptor turnover through proteasome-mediated proteolysis,”
J. Neurosci., 29 4498
–4511
(2009). http://dx.doi.org/10.1523/JNEUROSCI.6094-08.2009 JNRSDS 0270-6474 Google Scholar
D. L. Glanzman,
“Ion pumps get more glamorous,”
Nat. Neurosci., 13 4
–5
(2010). http://dx.doi.org/10.1038/nn0110-4 NANEFN 1097-6256 Google Scholar
S. R. Pulver and L. C. Griffith,
“Spike integration and cellular memory in a rhythmic network from Na+/K+ pump current dynamics,”
Nat. Neurosci., 13 53
–59
(2010). http://dx.doi.org/10.1038/nn.2444 NANEFN 1097-6256 Google Scholar
J. Simmers,
“Motor control: learning new moves with old pumps,”
Curr. Biol., 22 R194
–R196
(2012). http://dx.doi.org/10.1016/j.cub.2012.02.018 CUBLE2 0960-9822 Google Scholar
H-Y. Zhang and K. T. Sillar,
“Short-term memory of motor network performance via activity-dependent potentiation of Na+/K+ pump function,”
Curr. Biol., 22 526
–531
(2012). http://dx.doi.org/10.1016/j.cub.2012.01.058 CUBLE2 0960-9822 Google Scholar
G. G. Turrigiano,
“The self-tuning neuron: synaptic scaling of excitatory synapses,”
Cell, 135 422
–435
(2008). http://dx.doi.org/10.1016/j.cell.2008.10.008 CELLB5 0092-8674 Google Scholar
A. G. Therien and R. Blostein,
“Mechanism of sodium pump regulation,”
Am. J. Physiol. Cell. Physiol., 279 C541
–C566
(2000). Google Scholar
E. M. Rose et al.,
“Glutamate transporter coupling to Na, K-ATPase,”
J. Neurosci., 29 8143
–8155
(2009). http://dx.doi.org/10.1523/JNEUROSCI.1081-09.2009 JNRSDS 0270-6474 Google Scholar
L. Reinhard et al.,
“Na+, K+-ATPase as a docking station: protein-protein complexes of the Na+, K+-ATPase,”
Cell. Mol. Life Sci., 70 205
–222
(2013). http://dx.doi.org/10.1007/s00018-012-1039-9 CMLSFI 1420-9071 Google Scholar
R. E. Sims and N. Dale,
“Activity-dependent adenosine release may be linked to activation of Na+K+ ATPase: an in vitro rat study,”
PLoS One, 9 e87481
(2014). http://dx.doi.org/10.1371/journal.pone.0087481 POLNCL 1932-6203 Google Scholar
G. P Krishnan and M. Bazhenov,
“Ionic dynamics mediate spontaneous termination of seizures and postictal depression state,”
J. Neurosci., 31
(24), 8870
–8882
(2011). http://dx.doi.org/10.1523/JNEUROSCI.6200-10.2011 JNRSDS 0270-6474 Google Scholar
J. J. Harris, R. Jolivet and D. Attwell,
“Synaptic energy use and supply,”
Neuron, 75 762
–777
(2012). http://dx.doi.org/10.1016/j.neuron.2012.08.019 NERNET 0896-6273 Google Scholar
T. A. Blanpied, J. M. Kerr and M. D. Ehlers,
“Structural plasticity with preserved topology in the postsynaptic protein network,”
Proc. Natl. Acad. Sci. U. S. A., 105 12587
–12592
(2008). http://dx.doi.org/10.1073/pnas.0711669105 Google Scholar
H. Blom et al.,
“Nearest neighbor analysis of dopamine D1 receptors and Na+-K+-ATPases in dendritic spines dissected by STED microscopy,”
Microsc. Res. Tech., 75 220
–228
(2012). http://dx.doi.org/10.1002/jemt.v75.2 MRTEEO 1059-910X Google Scholar
H. Blom et al.,
“Spatial distribution of Na+-K+-ATPase in dendritic spines dissected by nanoscale superresolution STED microscopy,”
BMC Neurosci., 12 16
(2011). http://dx.doi.org/10.1186/1471-2202-12-16 1471-2202 Google Scholar
F. Opazo et al.,
“Aptamers as potential tools for super-resolution microscopy,”
Nat. Methods, 9 938
–939
(2012). http://dx.doi.org/10.1038/nmeth.2179 1548-7091 Google Scholar
P. C. Fridy et al.,
“A robust pipeline for rapid production of versatile nanobody repertoires,”
Nat. Methods, 11 1253
–1260
(2014). http://dx.doi.org/10.1038/nmeth.3170 1548-7091 Google Scholar
J. Lippincott-Schwartz and G. H. Patterson,
“Photoactivatable fluorescent proteins for diffraction-limited and super-resolution imaging,”
Trends Cell Biol., 19 555
–565
(2009). http://dx.doi.org/10.1016/j.tcb.2009.09.003 TCBIEK 0962-8924 Google Scholar
D. M. Shcherbakova et al.,
“Photocontrollable fluorescent proteins at nanometer resolution,”
Ann. Rev. Biophys., 43 303
–329
(2014). http://dx.doi.org/10.1146/annurev-biophys-051013-022836 Google Scholar
T. Liebmann et al.,
“A noncanonical postsynaptic transport route for a GPCR belonging to the serotonin receptor family,”
J. Neurosci., 32
(50), 17998
–18008
(2012). http://dx.doi.org/10.1523/JNEUROSCI.1804-12.2012 JNRSDS 0270-6474 Google Scholar
H. D. MacGillavry et al.,
“Nanoscale scaffolding domains within the postsynaptic density concentrate synaptic AMPA receptors,”
Neuron, 78 615
–622
(2013). http://dx.doi.org/10.1016/j.neuron.2013.03.009 NERNET 0896-6273 Google Scholar
Y. Fukata et al.,
“Local palmitoylation cycles define activity-regulated postsynaptic subdomains,”
J. Cell. Biol., 202
(1), 145
–161
(2013). http://dx.doi.org/10.1083/jcb.201302071 JCLBA3 0021-9525 Google Scholar
D. Nair et al.,
“Super-resoluton imaging reveal that AMPA receptors inside synapses are dynamically organized in nanodomains regulated by PSD95,”
J. Neurosci., 33
(32), 13204
–13224
(2013). http://dx.doi.org/10.1523/JNEUROSCI.2381-12.2013 JNRSDS 0270-6474 Google Scholar
A. Pertsinidis et al.,
“Ultrahigh-resolution imaging reveals formation of neuronal SNARE/Munc18 complexes in situ,”
Proc. Natl. Acad. Sci. U. S. A., 110
(30), E2812
–E2820
(2013). http://dx.doi.org/10.1073/pnas.1310654110 Google Scholar
C. G. Specht et al.,
“Quantitative nanoscopy of inhibitory synapses: counting gephyrin molecules and receptor binding sites,”
Neuron, 79 308
–321
(2013). http://dx.doi.org/10.1016/j.neuron.2013.05.013 NERNET 0896-6273 Google Scholar
T. Liebmann et al.,
“Nanoscale elucidation of Na, K-ATPase isoforms in dendritic spines,”
Opt. Nanoscopy, 2 6
(2013). http://dx.doi.org/10.1186/2192-2853-2-6 Google Scholar
M. Ester et al.,
“A density-based algorithm for discovering clusters,”
in KDD-96 Proc.,
226
–231
(1996). Google Scholar
S. Wang et al.,
“Characterization and development of photoactivatable fluorescent proteins for single-molecule-based superresolution imaging,”
Proc. Natl. Acad. Sci. U. S. A., 111
(23), 8452
–8457
(2014). http://dx.doi.org/10.1073/pnas.1406593111 Google Scholar
X. Nan et al.,
“Single-molecule superresolution imaging allows quantitative analysis of RAF multimer formation and a signaling,”
Proc. Natl. Acad. Sci. U. S. A., 110
(46), 18519
–18524
(2013). http://dx.doi.org/10.1073/pnas.1318188110 Google Scholar
A. Shivanandan et al.,
“Challenges in quantitative single molecule localization microscopy,”
FEBS Lett., 588
(19), 3595
–3602
(2014). http://dx.doi.org/10.1016/j.febslet.2014.06.014 FEBLAL 0014-5793 Google Scholar
H. Deschout et al.,
“Progress in quantitative single-molecule localization microscopy,”
Histochem. Cell Biol., 142 5
–17
(2014). http://dx.doi.org/10.1007/s00418-014-1217-y Google Scholar
P. Annibale et al.,
“Quantitative photo activated localization microscopy: unraveling the effects of photoblinking,”
PLoS One, 6 e22678
(2011). http://dx.doi.org/10.1371/journal.pone.0022678 POLNCL 1932-6203 Google Scholar
E. Tokhtaeva, G. Sachs and O. Vagin,
“Assembly with the Na, K-ATPase alpha(1) subunit is required for export of beta(1) and beta(2) subunits from the endoplasmic reticulum,”
Biochemistry, 48 11421
–11431
(2009). http://dx.doi.org/10.1021/bi901438z Google Scholar
H. Alle, A. Roth and J. R. P. Geiger,
“Energy-efficient action potentials in hippocampal mossy fibers,”
Science, 325 1405
–1408
(2009). http://dx.doi.org/10.1126/science.1174331 SCIEAS 0036-8075 Google Scholar
C. R. Rose,
“Na + signals at central synapses,”
Neuroscientist, 8 532
–539
(2002). http://dx.doi.org/10.1177/1073858402238512 NROSFJ 1073-8584 Google Scholar
C. R. Rose,
“High-resolution Na+ imaging in dendritic spines,”
Pflugers Arch - Eur. J. Phyisol., 446 317
–321
(2003). http://dx.doi.org/10.1007/s00424-003-1036-9 Google Scholar
E. Arystharkova and K. Sweadner,
“Isoform-specific monoclonal antibodies to Na, K-ATPase α subunits,”
J. Biol. Chem., 271 23407
–23417
(1996). http://dx.doi.org/10.1074/jbc.271.38.23407 JBCHA3 0021-9258 Google Scholar
D. Wildanger et al.,
“STED microscopy with a supercontinuum laser source,”
Opt. Express, 16 9614
–9621
(2008). http://dx.doi.org/10.1364/OE.16.009614 OPEXFF 1094-4087 Google Scholar
H. Blom et al.,
“Spatial distribution of DARPP-32 in dendritic spines,”
PLoS One, 8
(9), e75155
(2013). http://dx.doi.org/10.1371/journal.pone.0075155 POLNCL 1932-6203 Google Scholar
BiographyHans Blom is a facility head of the Advanced Light Microscopy Facility at the Science for Life Laboratory, and supporting Swedish scientist with super-resolution microscopy (SIM, STED, and PALM/STORM). |


