
|
|
1.IntroductionLight microscopy (LM) and electron microscopy (EM) are fundamental imaging methods in the life sciences, each approach having its strengths and limitations. Since the potential gains of combining the two on the same sample are tremendous, many protocols for correlative light and electron microscopy (CLEM) have emerged in recent years. However, CLEM approaches remain challenging due to the vastly different requirements for sample preparation of LM and EM. Array tomography (AT), first reported by Micheva and Smith,1 enables three-dimensional (3-D) reconstruction of volumes imaged by scanning electron microscopy (SEM) and LM after immunohistochemistry (IHC). By overlaying aligned SEM and LM images at regions of interest (ROIs) molecular identity, as revealed by IHC, can be put into full context of the ultrastructure. Briefly, ultrathin serial sections of resin-embedded samples are applied to a glass surface, where they are stained with antibodies or other fluorescent dyes. After imaging sections with LM, they are processed and imaged again using SEM. By imaging the same ROI on consecutive serial sections, an image stack with the -resolution corresponding to the section thickness is generated and used for 3-D reconstruction. Notably, the ultrathin nature of the sections (100 nm and below) elegantly physically breaks the -resolution diffraction limit of LM, allowing super-resolution in axial direction.1 The current limitation of AT is lateral LM resolution and correlation. First, it can be very challenging and time consuming to rediscover an ROI during SEM imaging, especially at very high magnification. Second, precise and unbiased correlation requires spatially precise overlaying of structures both seen in EM and LM. Because of these challenges and the limited resolution of conventional LM, AT is in general mostly applied at lower magnifications. Another possibility for serial CLEM is to utilize the fluorescence of proteins like GFP directly. It is possible to preserve some portion of the fluorescence during freeze substitution and embedding and image it in serial resin sections.2 In combination with techniques like stimulated emission depletion (STED) microscopy3 and photoactivated localization microscopy (PALM),4 fluorescent proteins can even offer super-resolved LM images.5 Recently, Perkovic et al.6 reported an elegant method to perform direct stochastic optical reconstruction microscopy (dSTORM)7–9 super-resolution LM on resin sections using in-section fluorescence of uranyl acetate-resistant chemical tags. This resulted in achieving high - and -resolution of the fluorescent signals. Applied in combination with electron tomography, however, this method still has limited -resolution of the fluorescence signal and is hard to apply to large numbers of serial sections and thus is more suitable for comparatively smaller volumes. Nanguneri et al.10 succeeded in applying dSTORM to IHC stained serial resin sections, but did not show direct correlations of dSTORM and EM images of the same sections. Here, we report a method to advance AT for application at very high magnifications using structured illumination microscopy (SIM)11 in conjunction with correlation to same-section SEM images. We further show that the same principal approach can also be applied using dSTORM to reach even more precise correlation. The nematode Caenorhabditis elegans is a key model organism in neurobiological research due to its very small, genetically tractable nervous system of exactly 302 neurons in the adult hermaphrodite. It is well suited to establish and rigorously test neuroimaging approaches.12 This and other advantages of C. elegans, like ease of maintenance and an advanced genetic tool-box, made it the first and still only organism where the reconstruction of its entire neuronal network (connectome) has been undertaken to near completion.13 Despite its relative simplicity, its annotation remains incomplete, and one of the biggest challenges is the confident mapping of key circuit components, the electrical synapses. Electrical synapses are formed by connexins14 and pannexins15 in vertebrates, and innexins in invertebrates.16 They form hexamers, so-called connexons/pannexons and innexons, in the plasma membrane, which attach to another hexamer from the membrane of a nearby second cell.17 This way they form a bridge between the two cells through which ions and metabolites can pass. These intercellular bridges are called gap junctions. Several gap junctions form an electrical synapse and through them electrical and metabolic coupling of the two cells is achieved.14 C. elegans has at least 25 different innexins, expressed in virtually all cell types and tissues.18 The large family of innexins may allow for a molecular-level compensation for the small number of cellular components of the C. elegans nervous system. A precise and comprehensive mapping of gap junctions thus provides essential information to understand the connectivity logic of a neuronal network or an entire connectome. Ultrastructural EM methods have mainly characterized gap junctions as defined membrane appositions.19 However, they are difficult to be unambiguously distinguished by ultrastructural data alone. Emerging CLEM techniques make it now feasible to map gap junctions comprehensively and confidently using molecular labeling. In a recent publication Collman et al.20 have shown how improved AT can be efficiently utilized to map synapses in mouse brain subvolumes. However, this analysis focuses on chemical synapses, and conventional fluorescence LM does not have the necessary precision to confidently identify gap junctions. Here, we describe a super-resolution array tomography (srAT) protocol based on high-pressure frozen and freeze-substituted samples that allows us to map gap junctions formed by the innexin UNC-7 in the nervous system of C. elegans. We thus demonstrate an important application of this method and show how mapping of gap junction locations and even discerning their molecular identity in C. elegans and other organisms could be achieved with relative ease, adding a new dimension of connectivity information to connectomes. 2.Materials and Methods2.1.StrainsC. elegans were maintained using standard methods.21 The C. elegans strain used for the gap junction study was ZM1158, which contains an outcrossed integrated array lwIs48[Punc-7::UNC-7S::GFP], where an innexin UNC-7S fused with GFP was expressed from an endogenous unc-7 promoter.22,23 UNC-7S appears to be the major form of UNC-7,22 and for simplicity is referred to as UNC-7 in the main text. For dSTORM analyses, N2 Bristol wild-type was used. 2.2.High Pressure Freezing and Freeze SubstitutionFor high pressure freezing, C. elegans young adults were picked into freezing platelets (recesses 100 and , Leica Microsystems) containing 10% bovine serum albumin (BSA) in M924 (3.0 g , 6.0 g , 0.5 g NaCl, 1 ml 1 M , to 1 l). They were cryoimmobilized with an EM HPM100 (Leica Microsystems) at freezing speed and pressure and stored in liquid nitrogen until freeze substitution. The freeze substitution protocol was adapted from Weimer25 and Rostaing et al.26 The samples were processed in an EM AFS2 freeze substitution system (Leica Microsystems). First, they were incubated overnight in 0.1% in anhydrous acetone at . The solution was then exchanged with fresh one to efficiently remove residual water. The samples were kept at for a total of 80 h. Next, the temperature was ramped to over the course of 11 h. At the samples were washed four times within 3 h with acetone. Then, acetone was exchanged with one-third ethanol in acetone and incubated for 30 min, then 30 min with two-thirds ethanol in acetone, and finally two times (30 min each) with pure ethanol. Then the temperature was ramped to 4°C over the course of 16 h and the samples were washed again with ethanol two times for 30 min each. Then the samples were removed from the EM AFS2 and incubated in 50% LR White (Medium Grade Acrylic Resin, London Resin Company Ltd.) in ethanol overnight at 4°C. Next, the solution was exchanged with 100% LR White and then again after 1, 4 h, and overnight incubation at 4°C. The specimens were finally embedded in gelatin capsules with either 100% LR White and cured at for at least 48 h or with LR White containing additional accelerator (provided by manufacturer; one drop per 10 ml of resin was used) and cured for at least 48 h at 4°C under UV light and then further 48 h at room temperature under sunlight. 2.3.Serial Sections100-nm serial sections were cut with a histo Jumbo Diamond Knife (Diatome AG, Biel, Switzerland). To ensure ribboning, a thin layer of a mixture of contact adhesive and xylene was added to one side of the block. To make sections easier to find in the light microscope, we also added black pigment to the glue mixture. Microscopic glass slides coated with poly-l-lysine (Polysine slides, Thermo Fisher Scientific) or, for dSTORM application, cover slips coated with 0.5% gelatin and 0.05% chromium potassium sulfate1 were submerged in the knife’s boat to receive the sections. The slides/cover slips were then incubated for 20 min at . 2.4.Immunostaining and SIM Image AcquisitionImmunostaining was adapted from Micheva and Smith1 with modifications. Instead of a PAP pen, we used reversibly applicable and removable custom sample chambers made of polydimethylsiloxane (PDMS, Sylgard 184, Dow Corning) for IHC and dSTORM image acquisition. According to the instruction for use, the bulk material is thoroughly mixed with the crosslinker compound, degassed, and subsequently polymerized at 85°C for 4 h in negative molds made from Plexiglas. The resultant rectangular chambers with an inner edge length of 1 cm reversibly adhere to glass slides, creating a barrier for keeping IHC or switching buffers in place (cf. Fig. 1). For initial blocking and rehydration, blocking solution (0.1% BSA and 0.05% Tween 20 in Tris-buffer) was added for 5 min. All incubation steps were performed in humidity chambers at room temperature. The first antibodies were diluted (monoclonal mouse anti--tubulin, , Sigma; product number: T5168) or (polyclonal chicken anti-GFP, abcam; product number: ab13970) in blocking solution, centrifuged for 2 min at top speed and applied for 1 h. Sections were washed four times with Tris-buffer (5 min each). Secondary antibodies [for dSTORM application: goat anti-mouse IgG (H+L) Alexa Fluor 647 conjugate, F(ab')2 fragment, Thermo Fisher Scientific; for SIM application: goat anti-chicken IgG (H+L) Alexa Fluor 488 conjugate, Thermo Fisher Scientific, and goat anti-mouse IgG (H+L) Texas Red dye-conjugate, Jackson ImmunoResearch] were also diluted in blocking solution and then applied for 30 min in the dark. After washing Live Hoechst 33342 (Sigma) diluted in Tris-buffer was applied, then sections were washed again two times, and finally either PDMS sample chambers were removed and the sections mounted with Mowiol (for SIM application) or sections were kept in Tris-buffer until dSTORM application. All light microscopic analyses were performed within 3 days of immunostaining. SIM image acquisition was performed with an ELYRA S.1 super-resolution structured illumination microscope (Zeiss). Black glue in between sections and the Hoechst staining aided in finding the sections and tissues. Fig. 1Overview of the workflow from living animal to finished correlated image. See Sec. 2 for details. 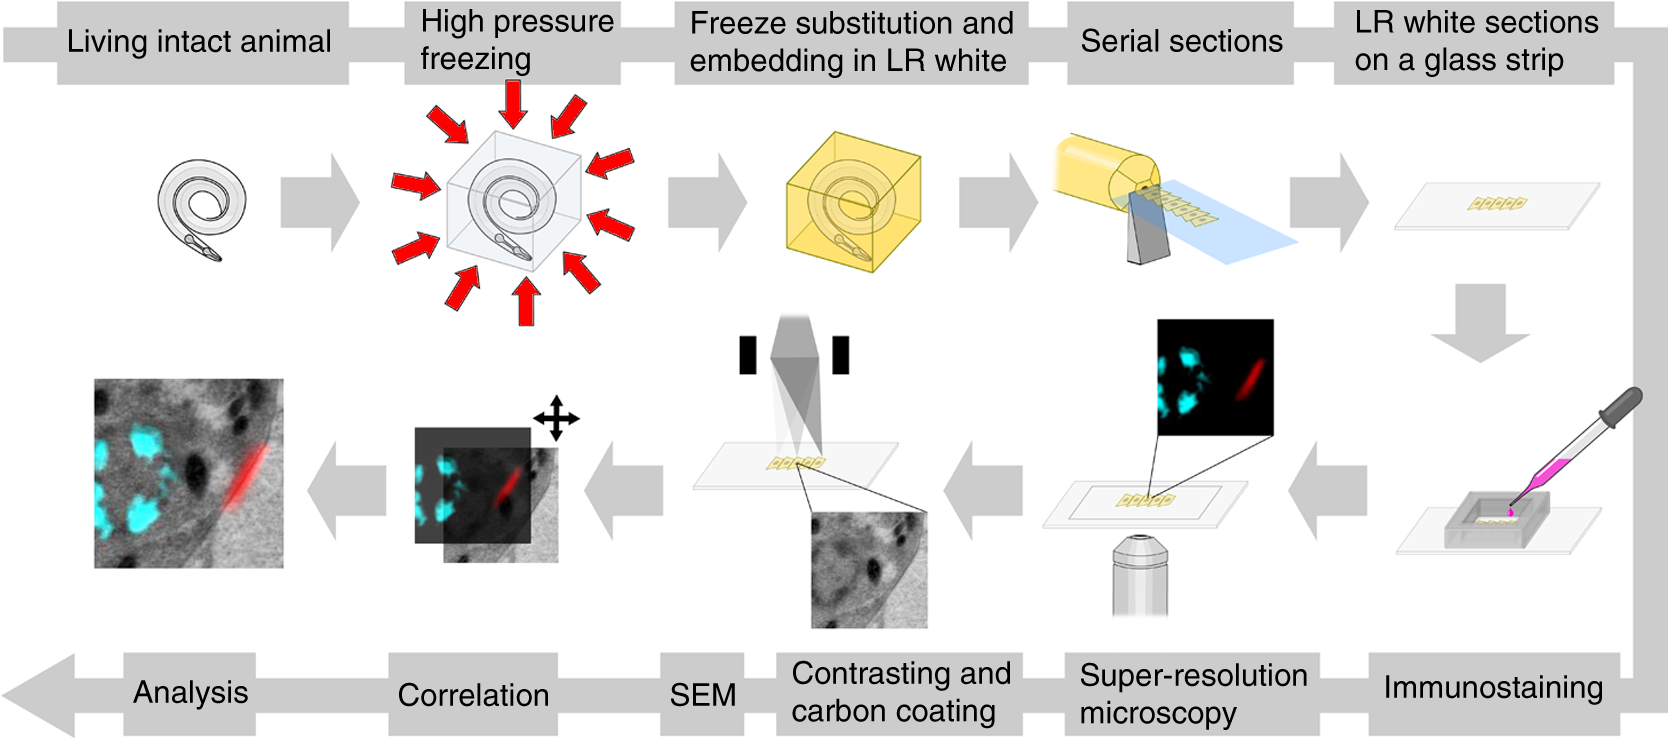 2.5.dSTORM Image Acquisition and Data ProcessingdSTORM measurements were performed on a custom setup built around a Zeiss Axio Observer.Z1 inverted microscope equipped with a objective with (Zeiss). A central region of about of the sample was illuminated by a 150-mW diode laser at 640 nm wavelength (Toptica iBeam smart) and fluorescence was detected with an Andor Ixon Ultra EMCCD camera (DU897U-CSO). The microscope stand is equipped with a Optovar lens that directly leads to an effective pixel size of about for sufficient sampling of the detected PSFs.27 Because the setup has two cameras attached to one camera port, the detected light was relayed to the camera by two lenses (Thorlabs). In this work, the second camera was only used to facilitate finding the specimen by imaging, e.g., Hoechst staining. The shorter wavelengths are directed to the second camera via a longpass filter (Chroma 630 DCXR) placed between the two above-mentioned lenses and imaged with a third lens of the same kind. The longpass filter is never removed from the beam path in order to avoid signal shifts induced by possible slight displacements. For imaging of signals other than Alexa Fluor 647, the sample can additionally be illuminated by 405-, 488-, or 532-nm lasers (Toptica, Laser Quantum). The 640-nm laser was cleaned from spectral noise with a narrow-width bandpass (Semrock MaxDiode LD01-640/8) and focused on the back focal plane of the objective with two lenses (40 and 100 mm, Thorlabs). The light was thereby guided by a dichroic beam splitter (Semrock BrightLine Di01-R405/488/532/635-25x36) and fluorescence was filtered from unwanted light with a rejection filter underneath the beam splitter (Chroma ZET405/488/532/642m) and a bandpass in front of the camera (Chroma ET700/75m). A typical measurement consists of a video of the switching molecules with about 15,000 frames acquired at a frame rate of 100 Hz. The measurements were evaluated and visualized with the free rapidSTORM 3.3.1 software package for reconstruction of localization data.28 2.6.Contrasting and Carbon CoatingAfter acquisition of the SIM images, the cover slips were carefully removed, and the whole slide with the attached sections was washed in to remove the mounting medium. After acquisition of dSTORM images, the cover slips were detached from the PDMS chambers and washed and dried the same way. After drying, the sections were contrasted in 2.5% uranyl acetate in ethanol for 15 min and in 50% Reynolds’ lead citrate29 in decocted for 10 min. The slides/cover slips were size-reduced using a diamond pen and attached to an SEM pin stub specimen mount. To prevent charging of the specimen, electrically conductive adhesive was added to one side of the glass piece. Finally, the sections were coated with a thin carbon layer to further reduce charging of the sample. 2.7.Scanning Electron MicroscopyA field emission scanning electron microscope JSM-7500F (JEOL, Japan) with LABE detector (for back scattered electron imaging at extremely low acceleration voltages) was used with an acceleration voltage of 5 kV, a probe current of 0.3 nA, and a working distance of 8 mm for all SEM images. 2.8.Image Processing, Correlation, and Three-Dimensional ModelingFrom the -stacks acquired by SIM the -layer with the highest signal intensity was chosen for correlation and further processed with Fiji30 (version October 2015), an ImageJ distribution. Background noise was subtracted for each channel individually so that regions with no specific labeling (i.e., pure resin) appeared black, and lookup tables were applied to color the images. They were exported (one image per channel) in portable network graphic (PNG) format and imported into Inkscape, an open source and free vector graphics editor31 together with the raw SEM images. By reducing the opacity of the SIM images, they can be moved over the SEM images to look for matching structures. The images from the different channels were overlaid, linked, and put into separate layers. Correlation was then performed with the channel for the protein of interest blanked out. To match the structures, SIM images were only rotated and resized, no distortions to the aspect ratio were permitted. After the structures were aligned to satisfaction, the channel with the protein of interest was displayed again. No further manipulations of image location were performed after this stage. All correlated images were cropped to a rectangle so that their sizes and shapes matched exactly. Next, they were saved as individual PNG files and imported into GIMP, an open source and free image editor.32 The black background was removed from the fluorescence images and all desired channels superimposed. The finished correlated images were exported as PNG files. Figure 2 gives a schematic summary of the correlation process and strategy. Fig. 2Diagram of the correlation strategy using intrinsic landmarks. In addition to the protein of interest, one or more independent, well-described structures are labeled. These should be unambiguously identifiable in electron micrographs as well. After channel alignment of all fluorescent channels only the independent landmarks are used for correlation transformations. Thus, precise and unbiased localization of the protein of interest is achieved. 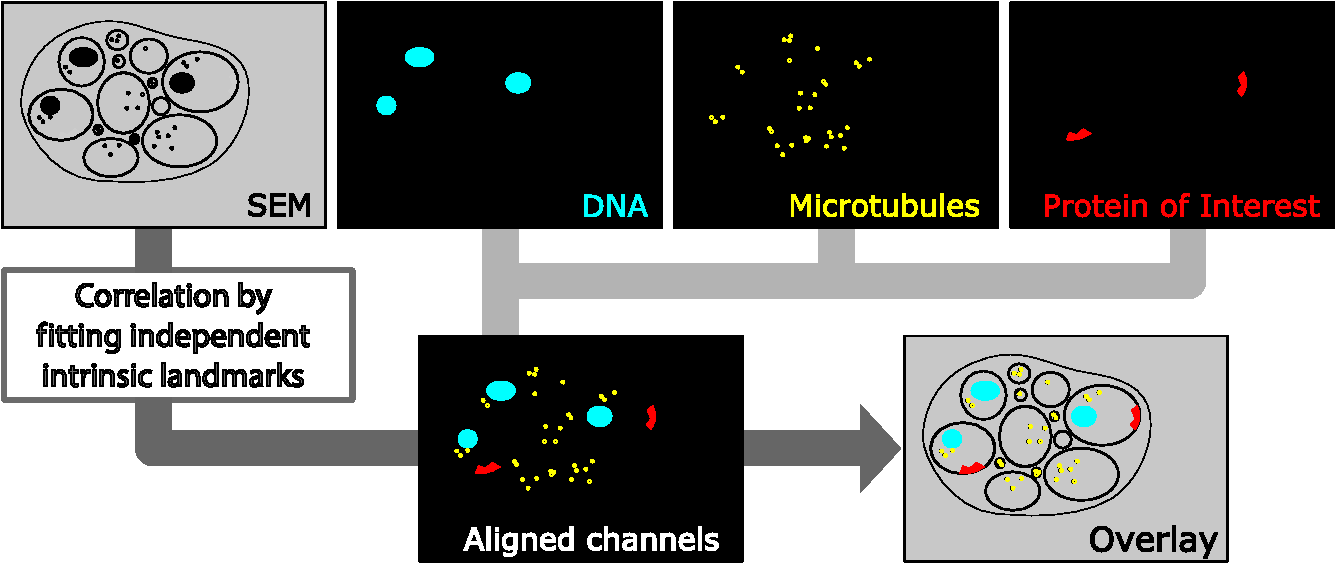 Accuracy of correlation was estimated using Fiji. We set the straight line tool to a line width of 10 pixels and used it to determine the peak of the fluorescence signal as well as the peak of highest electron density for each gap junction analyzed in this study. All measurements were performed orthogonally to the gap junction. The difference of the two peaks in nanometers was defined as the divergence of the correlation of this particular gap junction. All correlations were performed three times by three different persons, and thus correlation accuracy of each gap junction was performed three times as well. We pooled all divergences together and calculated the mean and standard deviation to provide a measure of overall accuracy of our correlation method. Segmentation and 3-D modeling were performed using 3dmod from the free and open source software package IMOD.33 2.9.Identification of CellsCell IDs were made based on neurite tracing throughout serial EM sections imported into CATMAID,34 which was compared mainly against the JSH and N2U series published by White et al.,13 covering the same region. We first identified highly characteristic and conserved neurite structures for AIY, AIZ, RIB, RIA, RIG, and SMB in all series, and then, by following stereotypical chemical synapse and gap junction connectivity patterns and other known trajectories based on previous description13 and those from several fully or partially reconstructed L1 animal synapse patterns from different sectioning angles (M. Zhen and A. Samuel labs, unpublished data), we determined the identity of additional neurites unambiguously. 3.Results and Discussion3.1.Super-Resolution Array Tomography Facilitates Mapping of C. elegans Gap JunctionsOur protocol for high pressure freezing, freeze substitution, and LR White embedding at 4°C resulted in a good ultrastructural preservation of the nervous system and other tissues of C. elegans while retaining good antigenicity for several different proteins. To visualize a defined subset of neuronal gap junctions with srAT, we chose a transgenic line that expresses a functional UNC-7::GFP fusion from the native unc-7 promoter.22,23 The UNC-7 innexin16 is expressed in many neurons and some body wall muscles.22 We used an antibody against GFP to stain for UNC-7::GFP, and co-stained for microtubules using an antibody against α-tubulin on ultrathin sections from the young adult C. elegans hermaphrodite. In addition, the sections were stained for heterochromatin with the Hoechst dye. We imaged by SIM several arrays from different regions of the nervous system in different individuals. Here we exemplarily show a series of 29 sections through the retrovesicular ganglion (RVG), a portion of the ventral nerve cord anterior of the excretory pore (cf. Fig. 3). After image acquisition, we prepared the arrays for SEM and electron micrographs of the same regions were obtained (for an overview of the whole workflow see Fig. 1). After correlation of the LM and EM images (Fig. 2), UNC-7::GFP-positive gap junctions were identified within their full ultrastructural context. Figure 3 shows an example section from the series, where a SIM image was correlated with an SEM image. In Fig. 4, we show a serial analysis of 10 consecutive srAT sections, which reveals three UNC-7::GFP positive gap junctions. Only GFP signals that appeared on at least two consecutive sections at the same relative location were considered bona fide labeling. Signals that appeared on single sections were disregarded as potential background. Fig. 3Correlation example. (a) Scheme of the cutting plane (gray) through the young adult hermaphrodite. (b) SIM image of a section. Nuclei (cyan) and microtubules (yellow) as well as UNC-7::GFP (red) are stained. High incidence of microtubules marks neuropil tissue, which is useful for orientation. Scale bar: . (c) Inverted SEM image of a subregion of the RVG of the same section. (d) Detail of the SIM image corresponding to the SEM image in (c). (e) Overlay of (c) and (d). SIM images are correlated to the SEM images using in this case only the super-resolved Hoechst signal, but not the microtubule staining. The anti-GFP signal (labeling UNC-7::GFP) then is superimposed without further positional manipulation. In this example, a gap junction is seen (white arrowhead). Some relevant cell identities are annotated. See Fig. 5 for details. Scale bar: .  Fig. 4Serial sections through the RVG of a young adult hermaphrodite reveal UNC-7::GFP containing gap junctions and ER. (a) Inverted SEM images of 10 serial 100 nm sections showing neuropil tissue. (b) SIM images of the same regions as in (a). Signals from anti-GFP immunostaining are displayed in red. (c) Overlay of (a) and (b). White and black arrowheads as well as the white arrow point to one gap junction each, as it appears in several consecutive sections of the series. Asterisk marks a signal that is only seen in a single section and is thus not considered a bona fide gap junction. Black arrow marks a pronounced UNC-7::GFP expression in what is very likely ER and not a gap junction. Relevant cell identities are annotated. Names of cells forming a gap junction in the particular section are given in red. Scale bar: 500 nm. 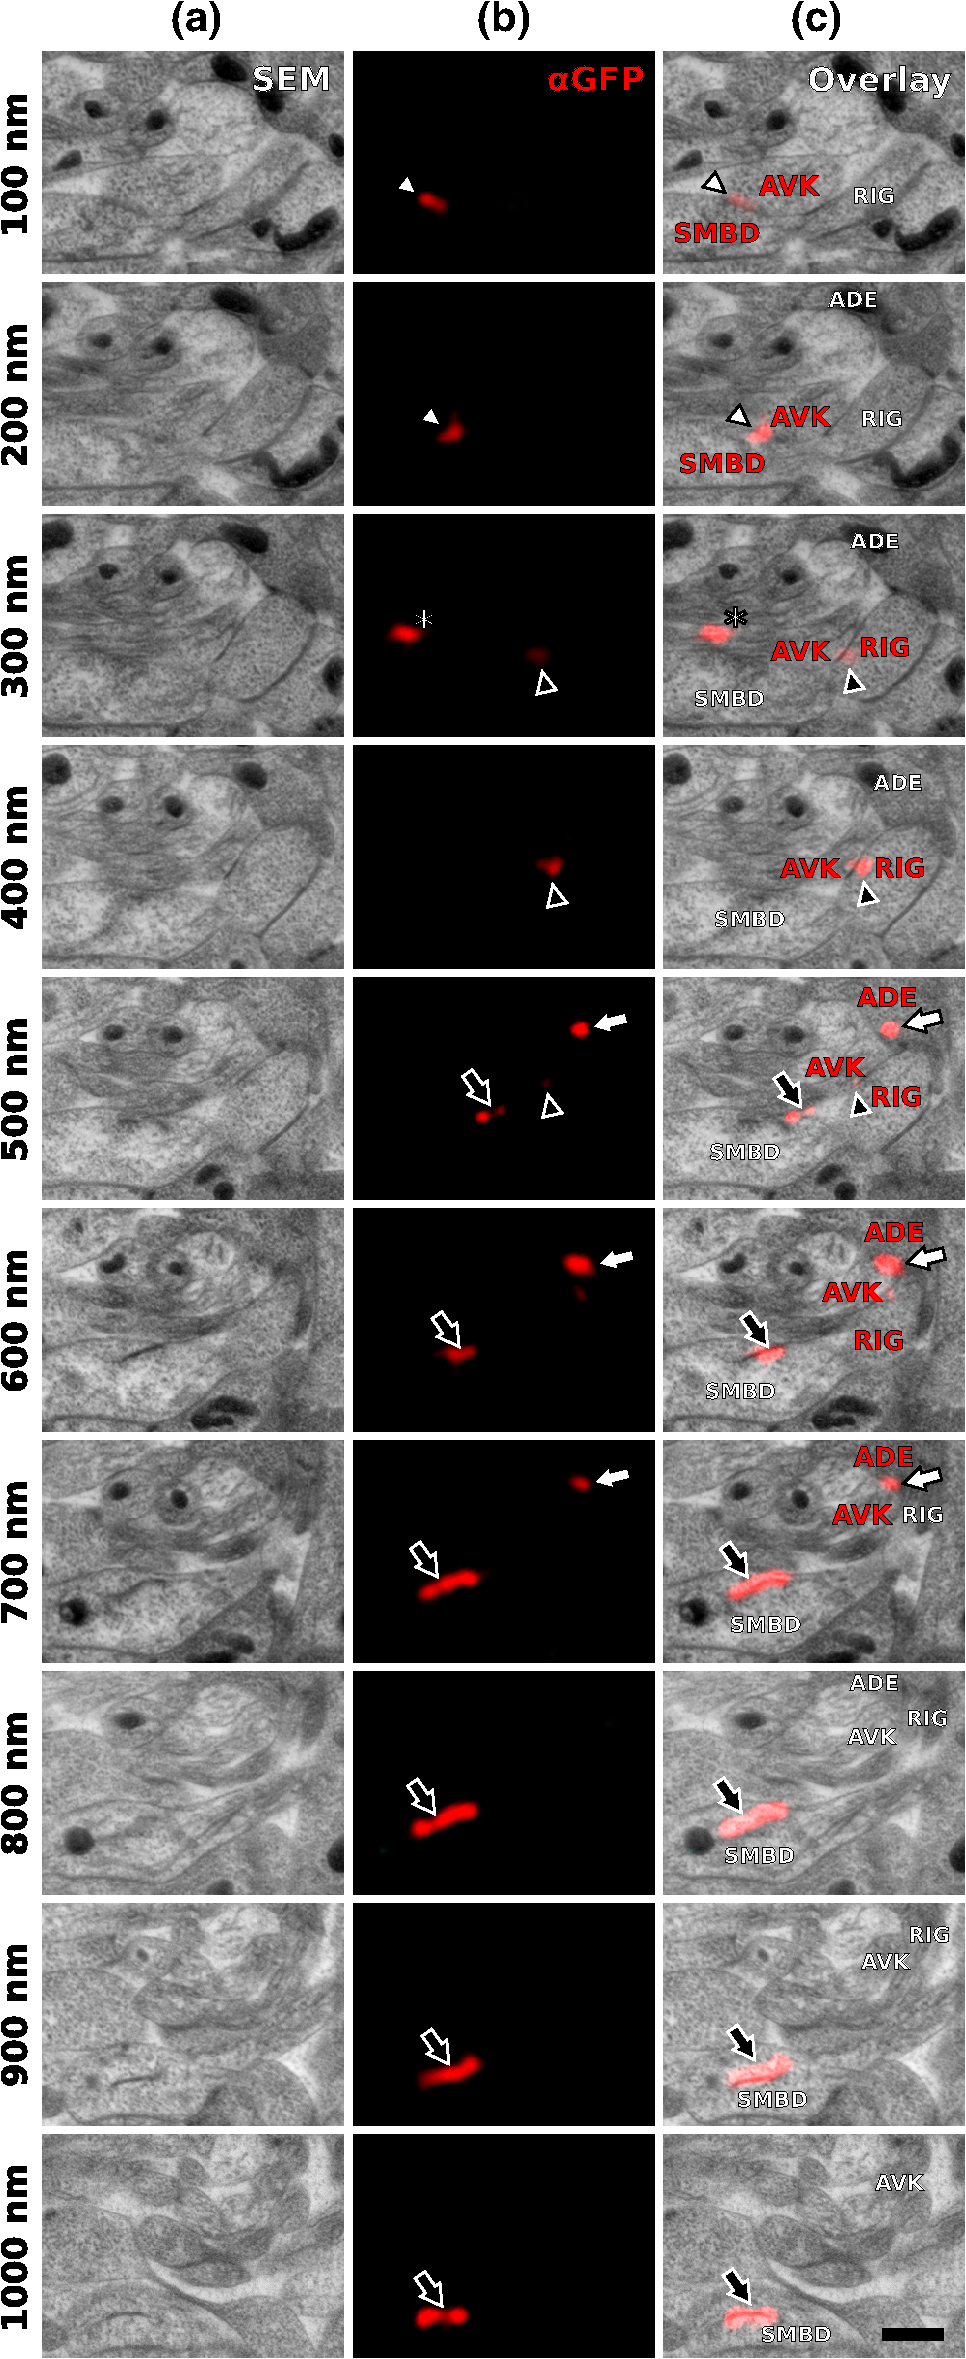 Our analysis revealed high-confidence UNC-7-positive gap junctions (Fig. 5). Several identified gap junctions include those between AVK and SMBD, between AVK and RIG, between RIH and FLP, between AVK and ADE, and between RIM and RIS. These neurons have been previously identified to express UNC-7,22,23 and on the basis of ultrastructure these gap junctions have been reported in the original C. elegans wiring diagram.13 In addition, an unambiguous UNC-7::GFP labeled gap junction between ADA and ADF neurons was identified, which, to our knowledge, was not previously reported to express UNC-7. Fig. 5Selection of UNC-7::GFP-positive gap junctions in the wider context of the RVG. (a) Gap junction between SMBD and AVK (white arrowhead). (c) Gap junction between RIH and FLP (white arrowhead). (e) Gap junction between ADF and ADA (white arrowhead). (g) Gap junction between RIM and RIS (white arrowhead). (b), (d), (f), (h) Same SEM images as (a), (c), (e), (g), respectively, but with correlated SIM signals overlaid. All identified UNC-7::GFP-positive cells are annotated, if visible. Black arrowheads: other UNC-7::GFP-positive gap junctions. Black arrows: UNC-7::GFP contained in ER. Asterisks: signals only visible in one section, treated as random background labeling. Scale bars: . 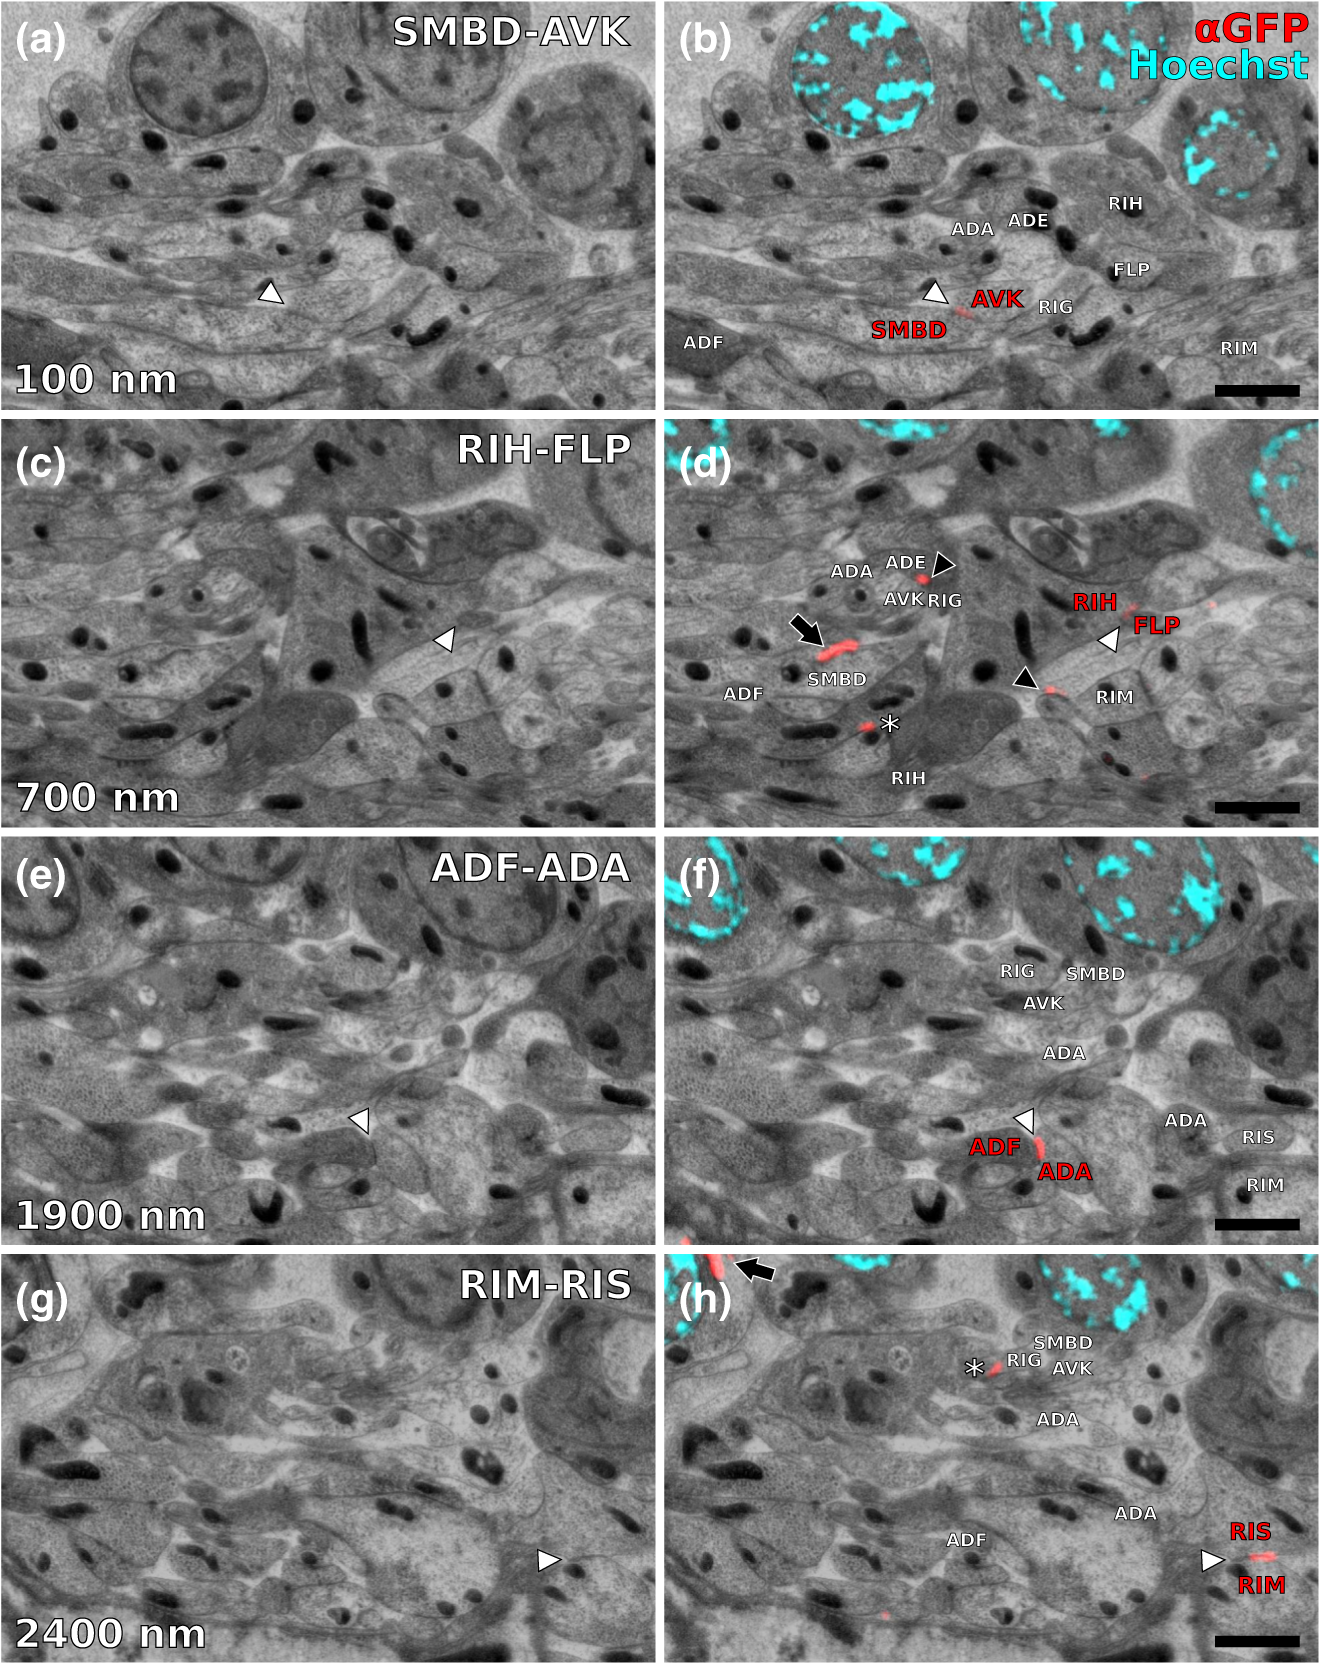 We also observed UNC-7::GFP intracellular structures that resemble endoplasmic reticulum (ER). ER-localized UNC-7::GFP signal is likely due to the high expression level of UNC-7::GFP from the multicopy integrated array. If fluorescence microscopy alone is used to assess expression patterns of these lines, results could be very challenging to interpret. However, using srAT we were able to clearly distinguish the ER retention or other expression artifacts from true gap junction signals. srAT is thus suitable for precise determination of protein localization at a subcellular level (for further discussion see below), and it would be feasible to map gap junctions of C. elegans neuronal networks comprehensively. For a better spatial understanding of the volume of our dataset and the precise positions of the mentioned gap junctions, we segmented identified UNC-7::GFP-positive gap junctions in their cellular context, and generated 3-D models (Fig. 6). Fig. 63-D models of neurite projections of 10 UNC-7::GFP gap junction forming neurons and SAAD somatic region. (a) Overview with first section of the SEM data set shown. Red: gap junctions. Light blue: nucleus of SAAD (shown for context). Yellowish colors: plasma membranes. Scale bar: . (b)–(g) Individual pairs of neurons connected by a UNC-7::GFP-positive gap junctions. Black arrowheads: gap junctions (also shown in red). Insets: closer look on the gap junctions though partially transparent neurons. Neuronal identities are color coded. Scale bars: 500 nm. 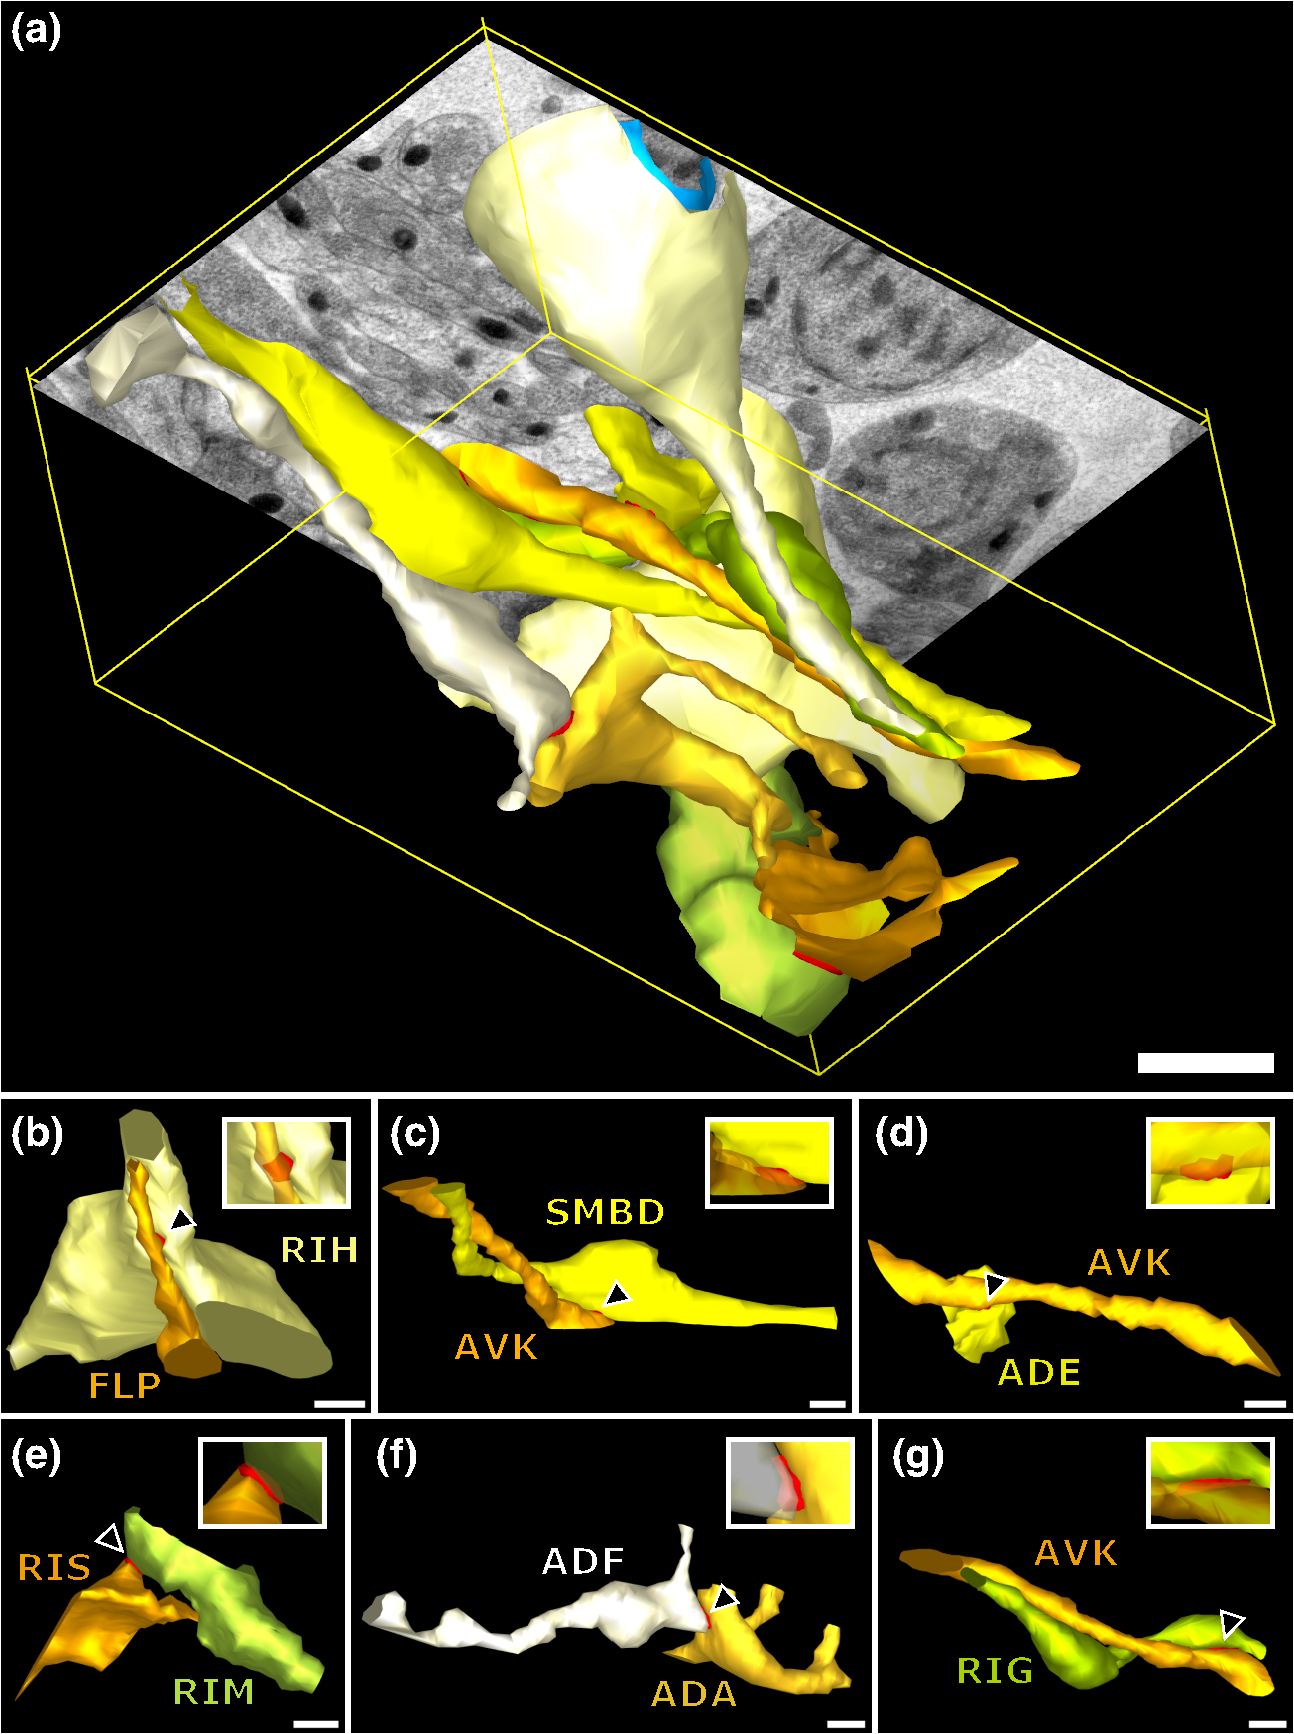 3.2.In Combination with dSTORM, srAT Can Be Used for Even More Precise CorrelationsWe initially applied tubulin staining to aid with correlation, but realized that the resolution of SIM, although much improved compared to conventional fluorescence microscopy35 and sufficient for our gap junction analysis (see Fig. 7), was insufficient to confidentially discern individual microtubules. In principle, microtubules are excellent internal landmarks for LM/EM correlations for applications that require even higher subcellular precision, such as localizing synaptic vesicle proteins, because they are of uniform size and shape, and are often clearly discernible in electron micrographs. To establish microtubules as such landmarks, we proceeded with dSTORM measurement on sections IHC stained against -tubulin. Here, we used samples cured in LR White at instead of 4°C. This leads to more extraction of the tissue and synaptic vesicles are not or only barely visible anymore. However, because of that, microtubules become easier to distinguish. Depending on the type of question and tissue, one or the other protocol might be better suited. Figure 8 shows that it was possible to match individual microtubules to distinct dSTORM signals. Thus, we can show that our srAT approach can in principle be applied at even higher magnifications as well. By using the microtubules as intrinsic correlation landmarks, it should be possible to apply our approach for unbiased fitting of proteins with up to now unreached precision and accuracy. Fig. 7Comparison of SIM and conventional fluorescence microscopy with and without deconvolution. (a) Wide-field fluorescence image of anti-tubulin staining on a 100-nm LR White section of the RVG of C. elegans. (b) Same region as in (a), but after deconvolution algorithm was applied. (c) Same region as in (a) and (b), but after super-resolution SIM algorithm was applied. (d) Intensity profile of the three imaging methods reveals that SIM makes it possible to discern more individual signals than deconvolution. The white lines in (a)–(c) correspond to the intensity profile displayed in (d). (e)–(h) Same as in (a)–(d), also the same section, but with anti-GFP staining displayed. Scale bars: . 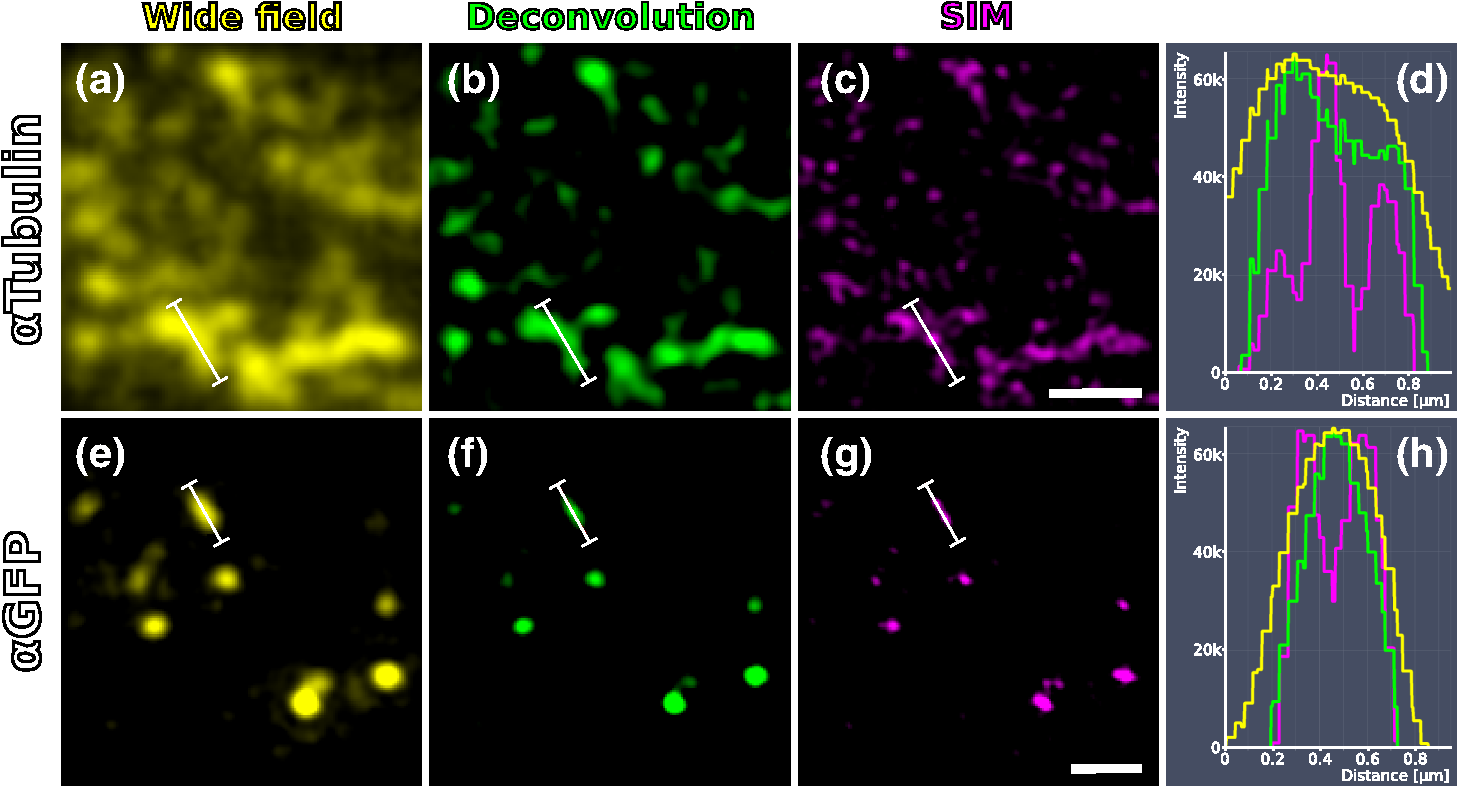 Fig. 8Microtubules in the ventral nerve cord of C. elegans correlated with dSTORM. (a) SEM image of the ventral nerve cord of an adult hermaphrodite cured in LR White at . Note the pronounced tissue extraction of the sample. Inlay: four microtubules. (b) dSTORM image of an IHC staining against -tubulin at the same location and on the same section as in (a). (c) Overlay of (a) and (b). Scale bar: 500 nm. 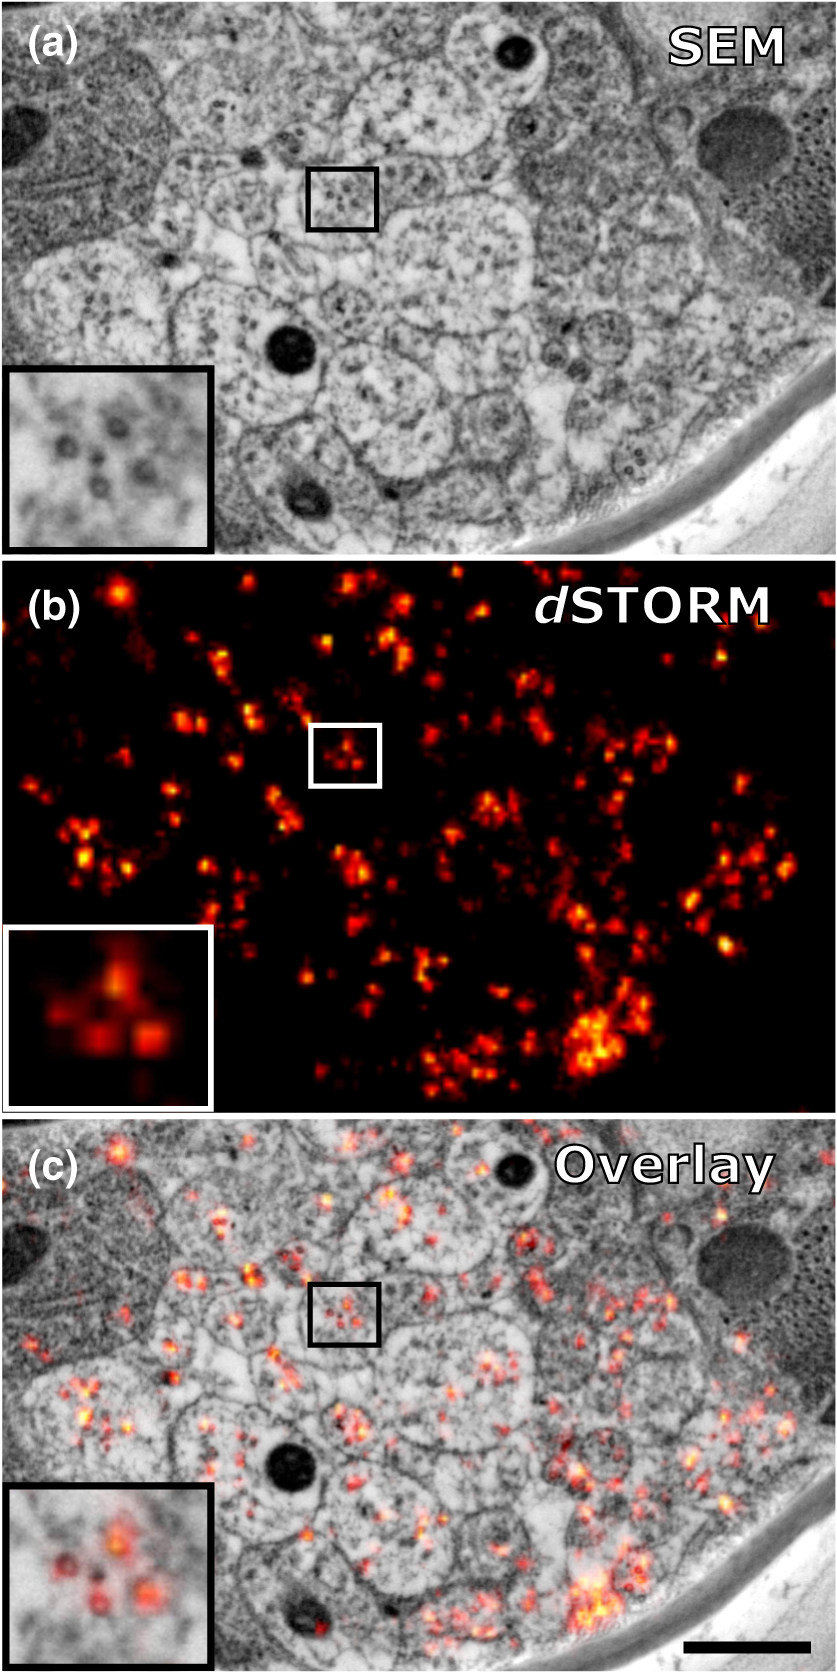 3.3.Low-Temperature LR White Embedding Combines Good Structural Preservation with High AntigenicityAT requires a careful compromise between structure preservation and retention of antigenicity. This is even more important in srAT, where good preservation is needed to analyze smaller structures, and at the same time reliable labeling of proteins is required, in particular when they are of low abundance and locally distributed, like innexins. In their original AT publication Micheva and Smith1 used the resin LR White cured at . In our hands, this protocol led to heavy extraction of nervous tissue from our C. elegans samples and was not suitable for an analysis of gap junctions, although we took advantage of this characteristic for imaging microtubules with dSTORM (see above). However, we found that curing of LR White at 4°C under UV light resulted in better ultrastructural preservation (cf. Figs. 5 and 8) and comparable antigenicity. In a recent AT publication, Collman et al.20 compared thermally cured LR White with low-temperature cured Lowicryl HM20 and found an improved structural preservation for the latter condition. This is consistent with our observation that the curing temperature is of key importance for the preservation of gently fixed tissues for AT. 3.4.Correlation Using Intrinsic Landmarks Is Easily Applicable, Precise, and UnbiasedAn obstacle of AT is the image correlation. Structures imaged in LM have to be located and reimaged in EM, and then both images need to be superimposed with high precision. To address these problems a number of approaches have been implemented. These methods often rely on external fiducial markers, such as quantum dots2,36 or finder grids. Since external fiducials are usually applied onto resin sections, it is conceivable that their positions could slightly change in between imaging steps or that some of them get detached. Also, they are difficult to apply, and in the case of quantum dots, offer low contrast in EM. In our study, we decided to take a more straightforward approach that is easy and comparatively cheap to execute and avoids potential bias. Since multichannel imaging is readily applicable in SIM, we co-imaged suitable structures in different channels from our protein of interest. In this case, staining of heterochromatin was useful for correlations in the nerve ring region that is surrounded by neuronal nuclei. We could easily fit an initial alignment of SEM overview images, since nuclei are clearly visible in electron micrographs. More precise correlation was then made possible by fitting the super-resolved heterochromatin patterns visible in both images (see Fig. 3). The channel-aligned fluorescence signal of the protein of interest is then superimposed without any further positional manipulation, thus avoiding potential bias. With this method, we measured an overall correlation accuracy of (mean divergence of fluorescence signal from gap junction electron density ± standard deviation). This approach can be further strengthened using several independent landmarks (depending on the sample of interest). Figure 2 depicts a general diagram of our correlation strategy. We co-stained for microtubules. This was useful for identifying the rough position of the microtubule-rich neuropil tissue, but not useful for precise correlation, because SIM can reach a lateral resolution of about 120 nm and thus cannot reliably resolve individual 25 nm filaments.35 This changes with the application of dSTORM, however. With this technique, a lateral resolution of 20 nm is typical.35,37 We were able to identify distinct microtubules in the ventral nerve cord of C. elegans in electron micrographs as well as in dSTORM images (Fig. 8). This equips us with a powerful tool for theoretically even more precise correlation and localization of synaptic proteins of interest, since the microtubules can serve as intrinsic fiducial markers. This level of precision was not necessary in our gap junction analysis, however, and thus we concentrated on SIM in this study. This strategy of choosing suitable endogenous markers and co-imaging them with the protein of interest can be applied to many tissues and questions. Depending on the type of tissue, mitochondria, actin bundles, membranes, or any other structure that is close to the ROI and unambiguously discernible in electron micrographs can potentially be used for precise, unbiased correlation. 3.5.Reanalysis of the Whole C. elegans Connectome Using srAT Is Feasible in the Near FutureThe dataset shown in Fig. 6 consists of 29 serial worm sections () in total. From sectioning to correlation, the process took about 5 to 6 workdays for one person. A young adult hermaphrodite C. elegans is just over 1 mm in length, so this would correspond to 10,000 to 12,000 cross sections. Assuming a full-time dedication, we estimate that it would take one skilled person about 3 years to complete data acquisition of the whole connectome of one worm using our protocols and equipment. Thus, this is theoretically feasible already. However, some steps of the workflow can potentially be improved to speed up the process considerably. Sectioning could be automated by using an automated tape-collecting ultramicrotome (ATUM).38,39 The resulting tape can be cut into convenient chunks and imaged with a SIM featuring automatic section recognition that can help with imaging, and a multibeam SEM setup as well as an automated registration system could speed up SEM imaging considerably. In combination with a multiperson concerted effort the overall time estimation for a complete mapping of gap junctions to the C. elegans connectome in a yet to be built pan-innexin GFP line could be brought down to several months. 4.ConclusionRecently, block-face techniques like focused-ion beam SEM40 and serial-block face SEM41 are used in connectomics research.42,43 However, AT offers some key advantages compared to these techniques that make it a valuable and complementary alternative. First, AT sections are not lost after imaging, and they can be reimaged for further ultrastructural analysis and reevaluated many times after initial image acquisition. Second, AT adds a whole new level of information by including multichannel IHC and other fluorescence-labeling strategies. Thus, not only ultrastructure alone but also the molecular identities of synapses can be included.20 In this study, we show that AT paired with super-resolution techniques (srAT) makes it possible to map even gap junctions with a high level of confidence. The major drawback of AT is the comparatively low throughput of imaging. However, in combination with an ATUM, a multibeam SEM, and future developments in automatic staining, image registration, and correlation of the section-tape, this drawback could be overcome. It would become feasible to image very large volumes and to acquire, e.g., the entire C. elegans connectome, including synapses, chemical and electrical, together with their molecular identities. This would be an important step toward a functionally understood, truly complete connectome. AcknowledgmentsThis work was supported by the Bundesministerium für Bildung und Forschung (BMBF) Grant No. 13N12781 (MS and SP), by the Human Frontier Science Program RGP0051/2014 (JLB and MZ), and by a PhD grant from the Studienstiftung des Deutschen Volkes (SMM). BM and DW were supported by the CIHR MOP-123250 and Human Frontier Science Program to MZ. We cordially thank G. Krohne, M. Engstler, H. Schwarz, C. Luccardini, J. Carl, M. Behringer, A. Löschberger, and H. Zhan for experimental support and fruitful discussions throughout the project. We are grateful to F. Helmprobst and D. Mastronarde for advice and support regarding image analysis and segmentation. We thank T. Starich and J. Shaw for the UNC-7::GFP transgene and A. Cardona for advice on CATMAID. We further thank C. Gehrig, B. Trost, and D. Bunsen for excellent technical support. ReferencesK. D. Micheva and S. J. Smith,
“Array tomography,”
Neuron, 55
(1), 25
–36
(2007). http://dx.doi.org/10.1016/j.neuron.2007.06.014 NERNET 0896-6273 Google Scholar
W. Kukulski et al.,
“Correlated fluorescence and 3D electron microscopy with high sensitivity and spatial precision,”
J. Cell. Biol., 192
(1), 111
–119
(2011). http://dx.doi.org/10.1083/jcb.201009037 Google Scholar
S. W. Hell and J. Wichmann,
“Breaking the diffraction resolution limit by stimulated emission: stimulated-emission-depletion fluorescence microscopy,”
Opt. Lett., 19
(11), 780
–782
(1994). http://dx.doi.org/10.1364/OL.19.000780 OPLEDP 0146-9592 Google Scholar
E. Betzig et al.,
“Imaging intracellular fluorescent proteins at nanometer resolution,”
Science, 313
(5793), 1642
–1645
(2006). http://dx.doi.org/10.1126/science.1127344 SCIEAS 0036-8075 Google Scholar
S. Watanabe et al.,
“Protein localization in electron micrographs using fluorescence nanoscopy,”
Nat. Methods, 8
(1), 80
–84
(2011). http://dx.doi.org/10.1038/nmeth.1537 Google Scholar
M. Perkovic et al.,
“Correlative light- and electron microscopy with chemical tags,”
J. Struct. Biol., 186
(2), 205
–213
(2014). http://dx.doi.org/10.1016/j.jsb.2014.03.018 JSBIEM 1047-8477 Google Scholar
M. Heilemann et al.,
“Subdiffraction-resolution fluorescence imaging with conventional fluorescent probes,”
Angew. Chem. Int. Ed., 47
(33), 6172
–6176
(2008). http://dx.doi.org/10.1002/anie.v47:33 ACIEAY 0570-0833 Google Scholar
S. van de Linde et al.,
“Direct stochastic optical reconstruction microscopy with standard fluorescent probes,”
Nat. Protoc., 6
(7), 991
–1009
(2011). http://dx.doi.org/10.1038/nprot.2011.336 1754-2189 Google Scholar
A. Löschberger et al.,
“Correlative super-resolution fluorescence and electron microscopy of the nuclear pore complex with molecular resolution,”
J. Cell Sci., 127
(20), 4351
–4355
(2014). http://dx.doi.org/10.1242/jcs.156620 Google Scholar
S. Nanguneri et al.,
“Three-dimensional, tomographic super-resolution fluorescence imaging of serially sectioned thick samples,”
PLoS One, 7
(5), e38098
(2012). http://dx.doi.org/10.1371/journal.pone.0038098 POLNCL 1932-6203 Google Scholar
M. G. L. Gustafsson,
“Surpassing the lateral resolution limit by a factor of two using structured illumination microscopy,”
J. Microsc., 198
(2), 82
–87
(2000). http://dx.doi.org/10.1046/j.1365-2818.2000.00710.x JMICAR 0022-2720 Google Scholar
M. Chalfie et al.,
“Green fluorescent protein as a marker for gene expression,”
Science, 263
(5148), 802
–805
(1994). http://dx.doi.org/10.1126/science.8303295 SCIEAS 0036-8075 Google Scholar
J. G. White et al.,
“The structure of the nervous system of the nematode Caenorhabditis elegans,”
Philos. Trans. R. Soc. London B. Biol. Sci., 314
(1165), 1
–340
(1986). http://dx.doi.org/10.1098/rstb.1986.0056 Google Scholar
N. B. Gilula, O. R. Reeves and A. Steinbach,
“Metabolic Coupling, Ionic Coupling and Cell Contacts,”
Nature, 235
(5336), 262
–265
(1972). http://dx.doi.org/10.1038/235262a0 Google Scholar
R. Bruzzone et al.,
“Pannexins, a family of gap junction proteins expressed in brain,”
Proc. Natl. Acad. Sci. U. S. A., 100
(23), 13644
–13649
(2003). http://dx.doi.org/10.1073/pnas.2233464100 Google Scholar
P. Phelan et al.,
“Innexins: a family of invertebrate gap-junction proteins,”
Trends Genet., 14
(9), 348
–349
(1998). http://dx.doi.org/10.1016/S0168-9525(98)01547-9 Google Scholar
V. M. Unger et al.,
“Three-dimensional structure of a recombinant gap junction membrane channel,”
Science, 283
(5405), 1176
–1180
(1999). http://dx.doi.org/10.1126/science.283.5405.1176 SCIEAS 0036-8075 Google Scholar
K. T. Simonsen, D. G. Moerman and C. C. Naus,
“Gap junctions in C. elegans,”
Front. Physiol., 5 40
(2014). http://dx.doi.org/10.3389/fphys.2014.00040 Google Scholar
A. Peters et al., Fine Structure of the Nervous System, Oxford University Press, Oxford, UK
(1976). Google Scholar
F. Collman et al.,
“Mapping synapses by conjugate light-electron array tomography,”
J. Neurosci., 35
(14), 5792
–5807
(2015). http://dx.doi.org/10.1523/JNEUROSCI.4274-14.2015 JNRSDS 0270-6474 Google Scholar
S. Brenner,
“The genetics of Caenorhabditis elegans,”
Genetics, 77
(1), 71
–94
(1974). GENTAE 0016-6731 Google Scholar
T. A. Starich et al.,
“Interactions between innexins UNC-7 and UNC-9 mediate electrical synapse specificity in the Caenorhabditis elegans locomotory nervous system,”
Neural. Dev., 4 16
(2009). http://dx.doi.org/10.1186/1749-8104-4-16 Google Scholar
E. Yeh et al.,
“Caenorhabditis elegans innexins regulate active zone differentiation,”
J. Neurosci., 29
(16), 5207
–5217
(2009). http://dx.doi.org/10.1523/JNEUROSCI.0637-09.2009 JNRSDS 0270-6474 Google Scholar
T. Stiernagle,
“Maintenance of C. elegans,”
(2006). http://dx.doi.org/10.1895/wormbook.1.101.1 Google Scholar
R. Weimer,
“Preservation of C. elegans tissue via high-pressure freezing and freeze-substitution for ultrastructural analysis and immunocytochemistry,”
C. elegans, 203
–221 Humana Press, Totowa, New Jersey
(2006). Google Scholar
P. Rostaing et al.,
“Preservation of immunoreactivity and fine structure of adult C. elegans tissues using high-pressure freezing,”
J. Histochem. Cytochem., 52
(1), 1
–12
(2004). http://dx.doi.org/10.1177/002215540405200101 Google Scholar
T. Holm et al.,
“A blueprint for cost-efficient localization microscopy,”
ChemPhysChem, 15
(4), 651
–654
(2014). http://dx.doi.org/10.1002/cphc.201300739 CPCHFT 1439-4235 Google Scholar
(
(2016) http://www.super-resolution.biozentrum.uni-wuerzburg.de/research_topics/rapidstorm/ ( March ). 2016). Google Scholar
E. S. Reynolds,
“The use of lead citrate at high pH as an electron-opaque stain in electron microscopy,”
J. Cell. Biol., 17
(1), 208
–212
(1963). http://dx.doi.org/10.1083/jcb.17.1.208 Google Scholar
J. Schindelin et al.,
“Fiji: an open-source platform for biological-image analysis,”
Nat. Methods, 9
(7), 676
–682
(2012). http://dx.doi.org/10.1038/nmeth.2019 Google Scholar
J. R. Kremer, D. N. Mastronarde and J. R. McIntosh,
“Computer visualization of three-dimensional image data using IMOD,”
J. Struct. Biol., 116
(1), 71
–76
(1996). http://dx.doi.org/10.1006/jsbi.1996.0013 JSBIEM 1047-8477 Google Scholar
S. Saalfeld et al.,
“CATMAID: collaborative annotation toolkit for massive amounts of image data,”
Bioinformatics, 25
(15), 1984
–1986
(2009). http://dx.doi.org/10.1093/bioinformatics/btp26632 BOINFP 1367-4803 Google Scholar
C. G. Galbraith and J. A. Galbraith,
“Super-resolution microscopy at a glance,”
J. Cell. Sci., 124
(10), 1607
–1611
(2011). http://dx.doi.org/10.1242/jcs.080085 Google Scholar
R. Nisman et al.,
“Application of quantum dots as probes for correlative fluorescence, conventional, and energy-filtered transmission electron microscopy,”
J. Histochem. Cytochem., 52
(1), 13
–18
(2004). http://dx.doi.org/10.1177/002215540405200102 Google Scholar
T. Klein, S. Proppert and M. Sauer,
“Eight years of single-molecule localization microscopy,”
Histochem. Cell. Biol., 141
(6), 561
–575
(2014). http://dx.doi.org/10.1007/s00418-014-1184-3 Google Scholar
K. J. Hayworth et al.,
“Imaging ATUM ultrathin section libraries with WaferMapper: a multi-scale approach to EM reconstruction of neural circuits,”
Front. Neural. Circuits, 8 68
(2014). http://dx.doi.org/10.3389/fncir.2014.00068 Google Scholar
R. Schalek et al.,
“Development of high-throughput, high-resolution 3D reconstruction of large-volume biological tissue using automated tape collection ultramicrotomy and scanning electron microscopy,”
Microsc. Microanal., 17
(Suppl. S2), 966
–967
(2011). http://dx.doi.org/10.1017/S1431927611005708 MIMIF7 1431-9276 Google Scholar
G. Knott et al.,
“Serial section scanning electron microscopy of adult brain tissue using focused ion beam milling,”
J. Neurosci., 28
(12), 2959
–2964
(2008). http://dx.doi.org/10.1523/JNEUROSCI.3189-07.2008 JNRSDS 0270-6474 Google Scholar
W. Denk and H. Horstmann,
“Serial block-face scanning electron microscopy to reconstruct three-dimensional tissue nanostructure,”
PLoS Biol., 2
(11), e329
(2004). http://dx.doi.org/10.1371/journal.pbio.0020329 Google Scholar
S. Shibata et al.,
“Connectomics: comprehensive approaches for whole-brain mapping,”
Microscopy, 64
(1), 57
–67
(2015). http://dx.doi.org/10.1093/jmicro/dfu103 Google Scholar
K. L. Briggman and D. D. Bock,
“Volume electron microscopy for neuronal circuit reconstruction,”
Curr. Opin. Neurobiol., 22
(1), 154
–161
(2012). http://dx.doi.org/10.1016/j.conb.2011.10.022 COPUEN 0959-4388 Google Scholar
|


