|
|
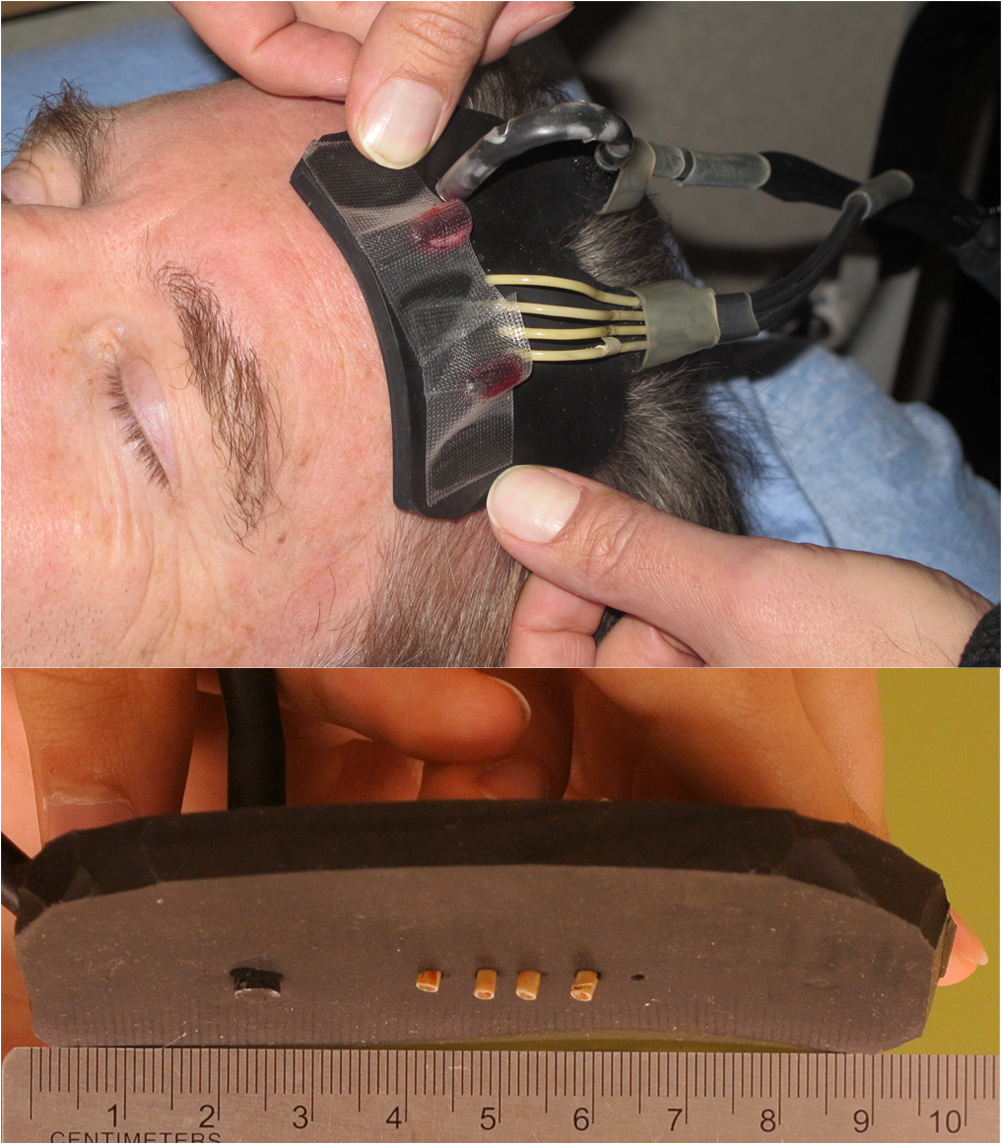
1.IntroductionStroke involves a major ischemic event, so it follows that there will also be major changes in brain tissue oxygenation. Positron emission tomography (PET) can be considered the gold standard for determining oxygen extraction fraction (OEF; the amount of oxygen extracted from the blood) and has been widely used to study brain oxygenation in a variety of conditions.1–7 However, in the setting of acute stroke management, PET is not a reasonable option for most centers. Near-infrared spectroscopy (NIRS) is a noninvasive and low-cost technique that can measure oxyhemoglobin () and deoxyhemoglobin concentrations (HHb) at bedside. In this paper, we measure hemoglobin saturation in the microvasculature as an index of tissue oxygenation. NIRS uses the standard principles of spectroscopy to measure the absorption of light at various wavelengths. By measuring the light attenuation at two different wavelengths of 690 and 830 nm, one can obtain data related to the concentrations of the chromophores and HHb. Previous studies of NIRS in stroke mainly used continuous wave NIRS (cwNIRS).8,9 This method can measure changes in NIRS parameters from a baseline but cannot obtain absolute values of each parameter, which is needed to compare oxygenation levels between the right and left side of an interrogated tissue, between subjects, or with an individual subject over days. Studies of acute stroke using cwNIRS have thus focused on variations of the NIRS signal according to head position,10 side to side difference of low-frequency oscillations of the signal,11 and change over time in various situations.12,13 Frequency-domain NIRS (fdNIRS)14 uses an intensity-modulated light source allowing calculations of both the absorption and the scattering coefficient of the interrogated tissue between the sources and the detector. Accounting for scattering allows the calculation of a quantitative absorption coefficient and quantitative values of and HHb. By measuring these two parameters, total hemoglobin content () and hemoglobin oxygen saturation () can be calculated. It has been used successfully to assess other conditions than acute ischemic stroke.15,16 tHb is related to cerebral blood volume (CBV).17 If the concentration of hemoglobin is constant in blood, a higher concentration of tHb represents a higher proportion of blood in a particular volume, a surrogate CBV. Arterial is very close to (arterial oxygen content, neglecting dissolved oxygen in blood), yet measured in this study represents mean oxygen content of microvascular blood from vessels prior (arterial capillary part) and after (venous capillary part) oxygen extraction. is the microvascular oxyhemoglobin saturation, and it is inversely related the arteriovenous oxygen content difference (), the quantity of oxygen extracted from the capillary path. Oxygen parameters of ischemia measured by PET [CBF, OEF, and cerebral metabolic rate for oxygen () ()] have shown strong correlation, if duration of ischemia is taken into account, with final infarction in animal models.18–20 Closely related NIRS parameters may show the same promise if it can easily be applied to the acute stroke clinical setting. In this study, we collected measurements of and tHb using fdNIRS in controls, cadavers, and acute stroke patients to determine whether fdNIRS is a suitable method that can be used to detect the effects of stroke on brain oxygenation—both in an acute stroke management environment and with stroke follow-up. 2.Methods2.1.Frequency-Domain Near-Infrared SystemThe OxiplexTS® fdNIRS system (ISS) was used. The probe consists of one high-sensitivity photomultiplier detector and four fiber optic sources with a minimum separation of 2.0 cm and a maximum separation of 3.5 cm from the detector. The NIRS probe emits light at 690 and 830 nm into the tissue. The intensity of the light is modulated at a frequency of 110 MHz. A custom probe suitable for measurements within the hair was designed by us and produced by ISS (Fig. 1).21 The fiber cap was modified such that the fibers and the detector projected out of the rubber probe by . This modification allowed for excellent skin contact even in areas with hair. OxiplexTS® returns absolute and HHb values using the frequency modulated method.14 2.2.SubjectsEthics approval was obtained by the local Conjoint Health Research Ethics Board, and all subjects provided direct or surrogate informed written consent. The control inclusion criterion was older than 18 years old and informed consent. The exclusion criterion was any known brain pathology. The subject was at rest lying supine. The inclusion criteria for the cadaver subjects were confirmed death for and years old at time of death. Exclusion was any known brain pathology. Age, gender, and time since death data were recorded. The inclusion criteria for acute stroke patients were years old, known symptom onset and occlusion of the proximal middle cerebral artery or the internal carotid artery on one side confirmed by CT imaging. 2.3.Data Collection and Study DesignThe OxiplexTS® system was warmed up for 10 min to ensure output laser stability, which is dependent on internal temperature of the system. The probe was then calibrated using a calibration block from ISS with known absorption and scattering properties. This was done every time the system was turned on. The calibration process is automatic according to previously published algorithms from ISS and lasts around 1 min. The absorbtion coefficient () of the calibration block is at a wavelength of 690 nm and at a wavelength of 830 nm. The scattering coefficient () of the calibration block is at 690 nm and at 830 nm. We accepted a deviation of 0.02 and a deviation of 0.1 (sum of deviation of both wavelengths). The measurement surface was prepared by combing the subject’s hair to provide a straight line relatively free of hair. After placing the probe, the “Autobias” function was used to adjust the detector sensitivity. Autobias sets the detector bias voltage, which controls the detector’s gain. A larger voltage gives a larger signal, but too large and the linear range of the detector will be passed and the detector may be damaged. Autobias sets this voltage to the best level, avoiding overvoltage or low signal. Once the measurements begin, the detector is outputting a voltage based on incident light intensity from four different light sources at fixed distance interval (Fig. 1). From the output voltage, the OxiplexTS® system records three parameters that relate to the incident light: alternating AC component of the signal, average DC component of the signal, and phase. The natural log (LnAC, DC, phase) are linearly related to the source–detector separation distance.22 With four distances at each wavelength, the slope of the line of best fit is determined for each parameter. As these slopes are used to calculate pathlength related absorption and scattering, values of the slopes are checked to verify linearity of input data. If was the probe was repositioned. If remained , then the data were discarded. Only data meeting this accuracy criterion is reported in this paper. We chose measurement sites according to surface anatomical landmarks (Fig. 2).23 An imaginary line was drawn from the nasion to the inion (M line on the midline). A second line was drawn from 2 cm behind the 50% mark of the M line to the external auditory meatus (the R line represents the Rolandic sulcus). A third line was drawn from the lateral canthus to the 75% mark of the M line (S line represents the sylvian fissure). Measurement sites are given below.
Fig. 2Diagram showing the location of the measured areas on the head. (a) Par = Parietal; (b) Rol = Rolandic Sulcus; (c) Fro = Frontal; (d) Bro = Broca’s area; (e) Wer = Wernicke’s area. Parasagittal is not shown. (f) Patient 2 follow-up CT is shown so the reader can understand approximately where the measurements were made. Black lines delineate the infarcted area. 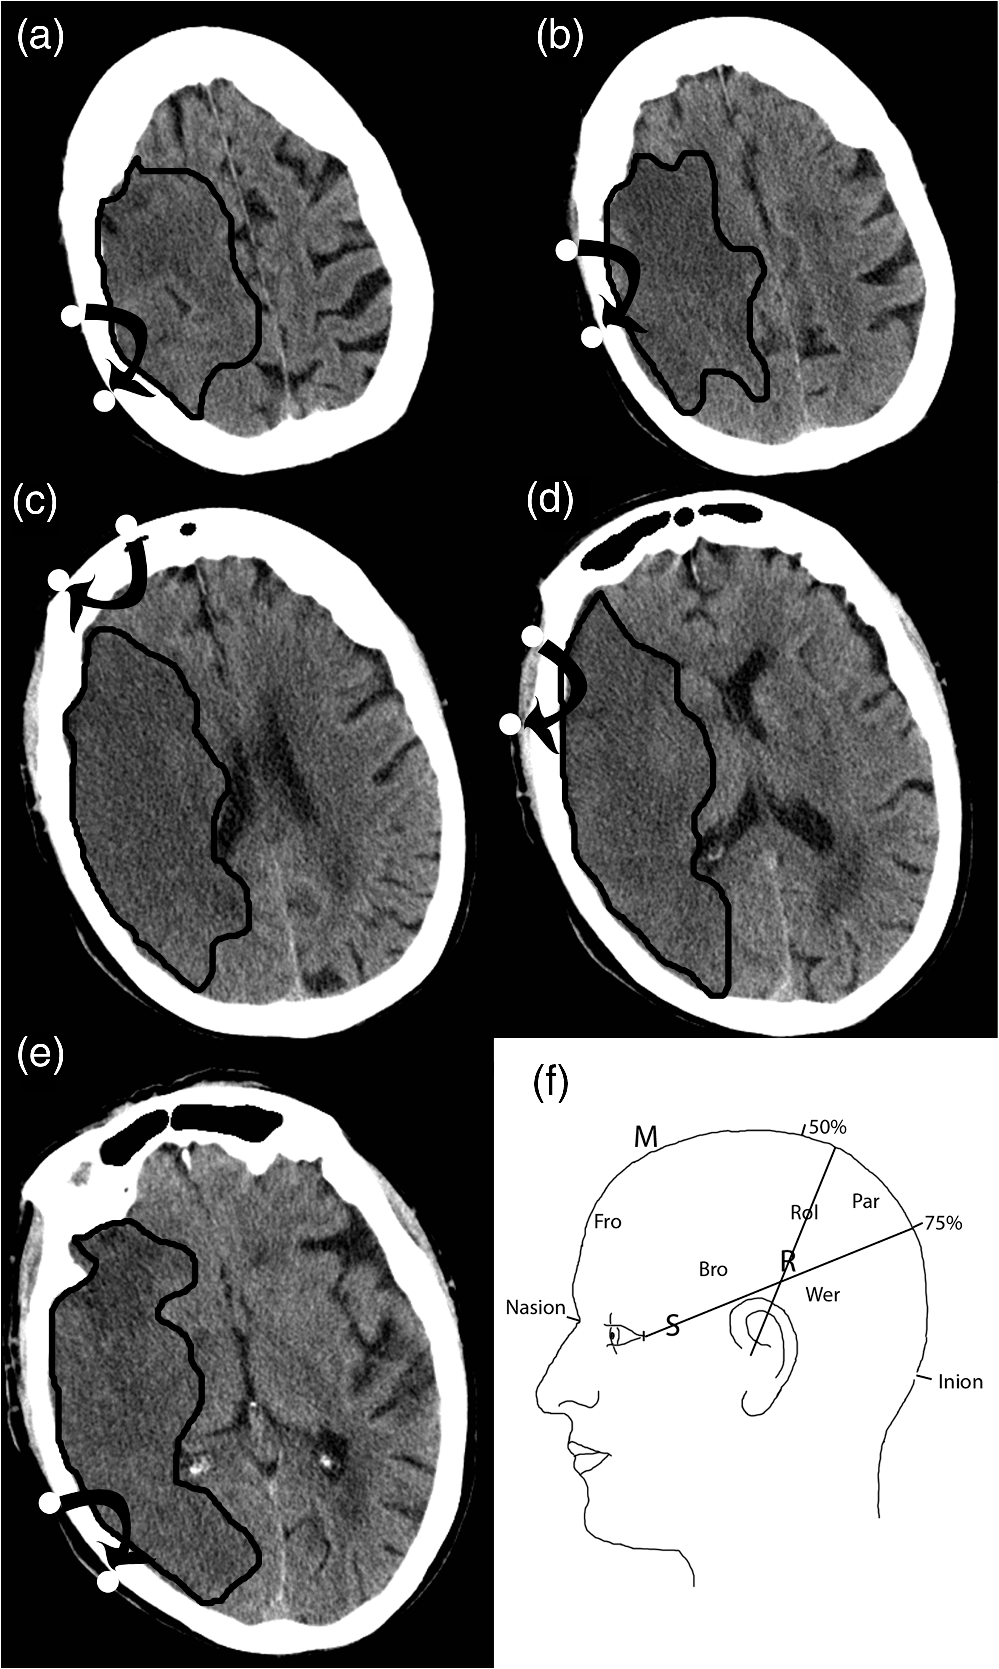 Measurements were made bilaterally for each site. Stroke patients were measured within 9 h of symptom onset and followed on day 3 after stroke. The total time from approaching the patient to completion of the exam was . 2.4.Data AnalysisBetween-group comparison of mean measurement values for each brain region was done using a two-factor analysis of variance (ANOVA) using measurement site (e.g., frontal, Broca, etc.) and subject (e.g., cadaver, controls, etc.) as the covariates and or tHb as the dependent variable. To analyze individual areas in a stroke patient, we planned to compare them to a reference range of values for tHb and from our normal control population. This is similar to what is done in other clinical laboratory tests where a control distribution is measured and outside of that range is considered “abnormal.”24 In brain imaging for stroke, for example, Doppler ultrasound,25 and computed tomography perfusion studies,26 it is common practice to asses individual values as relative to the uninvolved side, using an internal control value for comparison. For this purpose, we used the side to side difference for tHb and calculated as right minus left for every control subject. The values were then averaged and standard deviation was calculated. A 95.45% confidence interval (2 SD from the mean) was calculated and established to be the normal reference range of difference when comparing both sides. This reference range establishes a threshold in which left to right side differences would be considered as being abnormal: the difference is greater than the 95.45% confidence interval of the difference in the normal control population for this measurement site. To validate the side to side difference reference range approach, we used a sign test to determine if there was a systematic difference between left and right sides in controls. The sign test is used to test the null hypothesis that the median of the distribution is equal to a particular fixed value. The sign test was used to determine whether there was a 50% chance that the values of the left side of the brain are higher than the right side. The sign test showed that in this dataset, the median probability that the left side is higher than the right side is not significantly different from 50%. As there was no systemic difference between the left and right side measurements, we reported the absolute value of the difference between left and right sides (for controls) and used it as the reference range for normal (95.45% confidence interval) side to side difference. tHb is used here as a surrogate of CBV17,27,28 and is used as a surrogate of the OEF. These two are favored as the primary parameters to analyze as CBV and OEF are important markers of tissue fate in ischemic stroke in PET studies.6,18 3.ResultsFor the controls, , the median age was 43 years old [interquartile range (IQR): 35 to 49] and 55% were male. The mean absolute values for each site and overall mean on each side are shown in Table 1. Out of the 110 measurements planned (5 measurements on each side for 11 subjects), 67 values were obtained. Five out of 67 values were discarded because the collected data did not meet the collection criteria. The remaining 62 measurements were distributed primarily in the frontal lobe (22) and Broca’s area (22), while the remaining measurements were made in the Rolandic sulcus (10) and the Wernicke’s area (8). The number of measurements made on the left side is equal to the number of measurements made on the right side. Table 1Mean value (SD) and side to side difference (SD) of fdNIRS parameters for each site in controls. Side to side difference is counted as absolute values (negative and positive left to right difference counted as positive).
For cadavers, with a median age of 75 years. The median time from death to measurement was 20 h (IQR: 14 to 26). In cadavers, compared to controls, tHb is reduced and the and [] were close to 0. These values were all significantly different from controls, whereas sites were not different within the subject in a two-factor ANOVA (, Fig. 3). Fig. 3Bar plot showing mean values of (a) and (b) tHb for each measurement sites for all controls, the contralateral side in stroke patients, the side ipsilateral to the stroke in acute stroke patients, the stroke side on follow-up measurements of the single stroke patient, who underwent complete infarction (brain tissue appears darker than normal white matter on the follow-up CT) of all measured areas on day 3 except the frontal area (measurement sites shown in Fig. 2 for this patient) and cadavers. 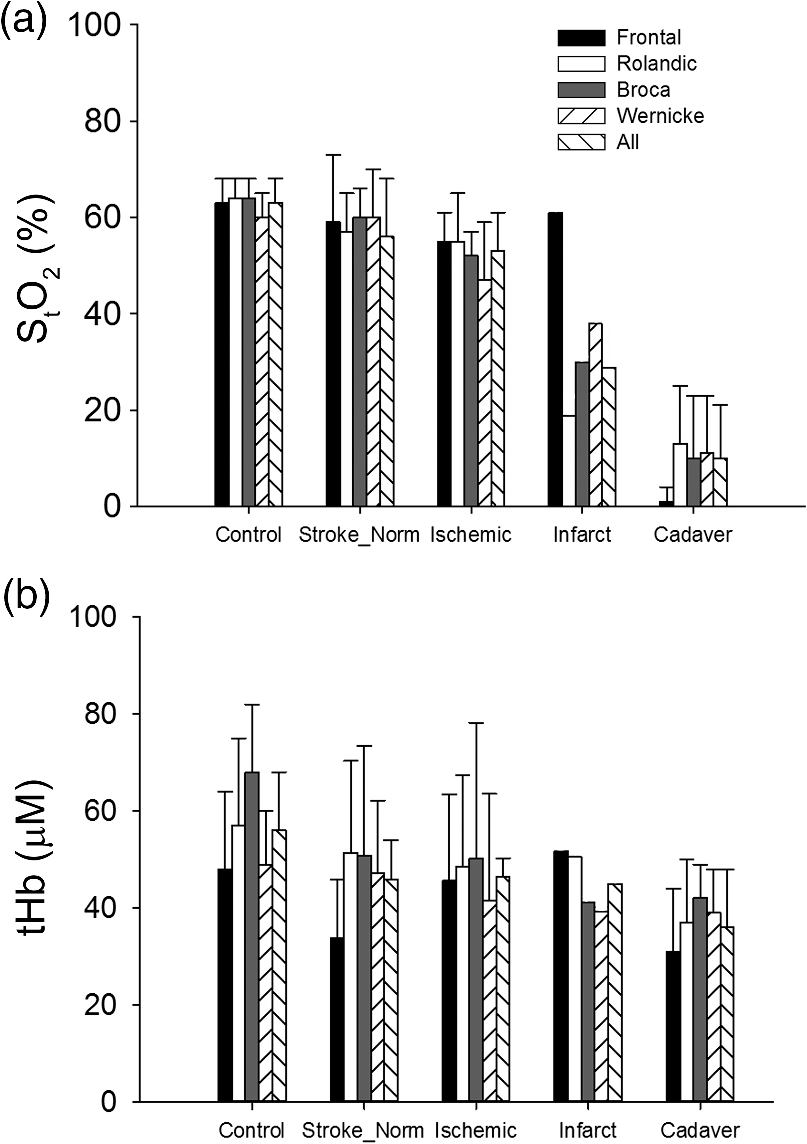 We examined five acute stroke patients. The median age was 64 years old and two were male. The median time from stroke symptom onset to measurement was 3.5 h (IQR: 3 to 4.5). Out of the 50 measurement sites planned (10/patient), 46 were obtained. Sixteen of the 46 values were discarded because the fell below 0.9 while all follow-up measurements were accepted. In the stroke subjects, the number of affected side measurements is equal to the number in the unaffected side. Of the 30 usable measurements, there were 10 frontal lobe, 6 Rolandic sulcus, 6 Broca’s area, and 4 Wernicke’s area. Two superior frontal gyrus measurements and two parietal measurements were conducted as they were thought to be involved in the stroke. All patients were examined after start of intravenous tissue plasminogen activator. Table 2 shows the left to right side differences in the stroke patients. The side to side differences, which meet the criteria for “abnormal,” are indicated with an asterisk. All acute stroke patients had at least one area with lower on the stroke side. tHb was either increased on the stroke side or showed no significant change. Table 2Absolute values (SDa) and side to side (S-S) difference of fdNIRS oxygen saturation (StO2) and total hemoglobin (tHb) measurements in the five acute stroke patients. Abnormal values compared to the control population are marked by a.
Follow-up measurements on day 3 were obtained for three patients (Table 3). Patient 1 recanalized and had a small mainly subcortical infarct at 24 h based on CT. The follow-up measurements for this patient showed no significant side to side difference at day 3. Patient 2 had a major hemispheric infarct at 24 h and the follow-up measurements showed significant reductions in tHb and . Patient 3 had a small subcortical infarct. Note that the significant changes from side to side in this patient may be explained by higher than usual values on the contralateral side. Patients 4 and 5 had a large infarct at 24 h (Fig. 4) and significant reductions in . Patient 4 was in the intensive care unit on day 3 and could not be measured. Patient 5 died on day 2. Table 3Clinical evolution on day 3: absolute values (SDa) and side to side (S-S) difference of fdNIRS oxygen saturation (StO2) and total hemoglobin (tHb) measurements in five acute stroke patients. Abnormal values compared to the control population are marked a. Follow-up data could not be obtained for patients 4 and 5. Patient 4 was acutely ill in the ICU and patient 5 passed away.
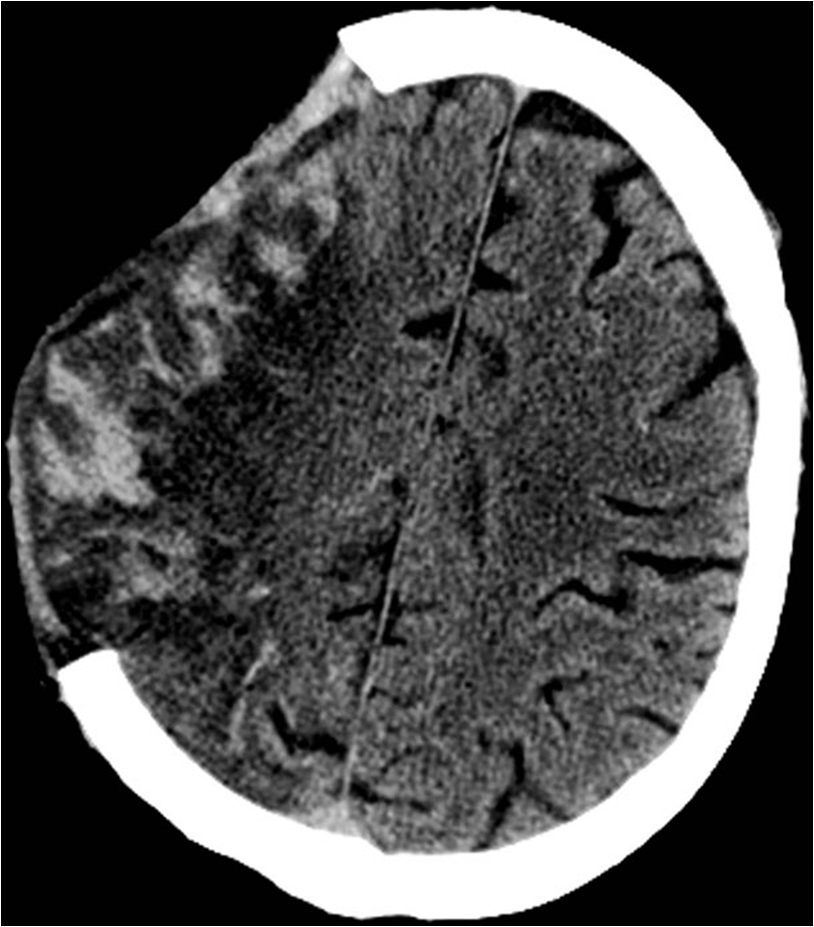
Fig. 4Clinical imaging done on our five acute stroke patients. (a) Admitting noncontrast CT showing regions affected by stroke. (b) Admitting CT angiography showing occlusion location. (c) 24-h follow up CT showing infarct size and location. White arrows point to the occlusion site on MCA. Black lines delineate the infarcted area on follow-up scan.  Figure 3 summarizes the findings for each measurement site in controls, the cotralateral side of acute stroke patients and ipsilateral side of acute stroke patients and cadavers. The results in an infarcted hemisphere on follow-up are also shown. We had the opportunity to make a single set of measurements in a patient with a large right middle cerebral artery stroke with hemorrhagic transformation after hemicraniectomy. Measurements on the stroke side were made through scalp without intervening bone except for the parasagittal frontal area (Table 4). The follow-up computed tomography for this patient is shown in Fig. 5. Based on the criteria of , the values for and tHb were significantly higher on the stroke side. High tHb is consistent with increased blood volume (extravascular blood) in the setting of a hemorrhage. The high saturation may be explained by hemorrhaged blood still relatively high in oxygenation as it had not passed through a capillary bed or decreased extraction of oxygen due to a decrease in metabolism that resulted from tissue damage. Table 4Absolute values and side to side difference fdNIRS oxygen saturation (StO2) and total hemoglobin (tHb) measurements of a right hemicraniectomy patient with hemorrhagic transformation of an ischemic stroke on the right side.
4.DiscussionPrevious studies using cwNIRS in stroke patients show changes in frequency responses, but the methods do not allow for comparing absolute values.9–13 This paper shows that fdNIRS can provide novel data allowing for comparison of individual stroke patients and stroke evolution. We validated the ability of fdNIRS to detect the expected very low oxygen saturation in cadavers as shown in a previous report.29 We also detected significant changes in tHb and in a hemicraniectomy patient with hemorrhagic transformation of an ischemic stroke. For the first time, quantitative measurement of brain oxygenation using NIRS was done in acute stroke patients. There was at least one area with low on the stroke side in all five patients, evidenced by the decreased compared to the contralateral side. Not all areas involved in the acute stroke showed reduced , which may be explained by pathophysiological aspects of stroke and their relationship to NIRS parameters. In healthy tissue, the relationship between metabolism and oxygen supply follows the principles of neurovascular coupling. As the metabolism () increases, the CBF increases, leading to an increased delivery of oxygen by blood per unit of time, resulting in a stable OEF (CBF and are matched) and a stable .30 When and CBF are not matched, changes in or CBF lead to corresponding changes in OEF to maintain optimal tissue oxygenation. In an acute stroke, neurovascular coupling is lost and OEF and its NIRS counterpart ( and ) are influenced by both the degree of pathologic regional reduction in blood flow (CBF) and the evolution of the infarction process (dictating tissue oxygen demand or ). As Boas and Francheschini pointed out, (as well as OEF) is influenced not only by but also by CBF relative to .31 Apart from the expected situation of an ischemic, high- (demand) low-CBF brain area with resulting high OEF and correspondingly low , infarcted tissue with low will have normal or even reduced OEF and increased and some reperfused overcompensated areas (increased CBF above actual oxygen demand) may show reduced OEF and increased . Also, ischemic areas are not affected at the same degree and do not undergo infarction at the same time.18 Consequently, each situation described here may be present in the same patient at one time point. Each case presented here represents unique situations combining a certain degree of ischemia at onset, the development of infarction and the occurrence of reperfusion. Therefore, it is possible that NIRS measurements could provide information about tissue viability and tissue reperfusion by examining each patient individually. The absolute values for do tend to be lower in stroke patients compared with healthy controls (Tables 2 and 3). Controls had a mean in the frontal lobe of 63%, which compares favorably with a previous study, which also reported 63% in healthy controls.29 The lowest value for stroke was 38% although in one case, the infarct side had higher than the contralateral side. Cadaver values were all 13% or less and do not fall to zero. This is expected given that oxygen can diffuse through tissue and is tightly bound by Hb. The patient condition may vary significantly in terms of factors that will influence brain oxygenation including respiration rate and partial arterial pressure of . As these parameters were not controlled for, therefore, we suggest reducing intersubject variability by comparing the infarcted side to the noninfarcted side. There are several limitations that will affect our measurements in acute stroke patients. There will be little contamination from skin as this is compressed beneath the probe, but there will be significant contamination of the measurement by the skull, dampening the low signal originating from ischemic tissue. This partial volume effect will mean that will never decline to cadaver levels in stroke patients. We may also have failed to measure the true ischemic area in some cases. Using CT to guide probe placement would be helpful, as long as it can be achieved quickly. This work shows that fdNIRS may be used to detect oxygenation changes in acute stroke. This is important as oxygenation relates to stroke pathophysiology. This study paves the way for future studies using fdNIRS as a rapid, noninvasive tool to assess stroke evolution. The future developments of this technique include whole brain mapping and combination with CBF data, which can be obtained with NIRS using a dye32 or diffuse correlation spectroscopy,33 adding interpretative value to measurements. This will be a unique tool with the capacity to provide multiple or continuous measurements of stroke pathophysiologic parameters from the bedside, something that cannot be achieved using perfusion CT. This technique has the potential to measure the effects of therapy in real time. In the future, we may evolve from a one-shot picture of physiology to a finely tuned approach using time-course assessments. AcknowledgmentsThis work was funded by the National Sciences and Engineering Research Council, and Alberta Innovates Health Solutions. ReferencesF. Vernieri et al.,
“Transcranial Doppler and near-infrared spectroscopy can evaluate the hemodynamic effect of carotid artery occlusion,”
Stroke, 35 64
–70
(2004). http://dx.doi.org/10.1161/01.STR.0000106486.26626.E2 SJCCA7 0039-2499 Google Scholar
K. Ogasawara et al.,
“Transcranial regional cerebral oxygen saturation monitoring during carotid endarterectomy as a predictor of postoperative hyperperfusion,”
Neurosurgery, 53 309
–314
(2003). http://dx.doi.org/10.1227/01.NEU.0000073547.86747.F3 NEQUEB Google Scholar
S. P. Wardle, C. W. Yoxall and A. M. Weindling,
“Determinants of cerebral fractional oxygen extraction using near infrared spectroscopy in preterm neonates,”
J. Cereb. Blood Flow Metab., 20 272
–279
(2000). http://dx.doi.org/10.1097/00004647-200002000-00008 Google Scholar
M. A. Mintun et al.,
“Brain oxygen utilization measured with O-15 radiotracers and positron emission tomography,”
J. Nucl. Med., 25 177
–187
(1984). Google Scholar
W. J. Powers, Jr. R. L. Grubb and M. E. Raichle,
“Physiological responses to focal cerebral ischemia in humans,”
Ann. Neurol., 16 546
–552
(1984). http://dx.doi.org/10.1002/ana.410160504 Google Scholar
W. J. Powers et al.,
“Cerebral blood flow and cerebral metabolic rate of oxygen requirements for cerebral function and viability in humans,”
J. Cereb. Blood Flow Metab., 5 600
–608
(1985). http://dx.doi.org/10.1038/jcbfm.1985.89 Google Scholar
K. L. Leenders et al.,
“Cerebral blood flow, blood volume and oxygen utilization. Normal values and effect of age,”
Brain, 113
(Pt 1), 27
–47
(1990). http://dx.doi.org/10.1093/brain/113.1.27 BRAIAK 0006-8950 Google Scholar
C. Terborg et al.,
“Reduced vasomotor reactivity in cerebral microangiopathy: a study with near-infrared spectroscopy and transcranial Doppler sonography,”
Stroke, 31 924
–929
(2000). http://dx.doi.org/10.1161/01.STR.31.4.924 SJCCA7 0039-2499 Google Scholar
F. Vernieri et al.,
“Near infrared spectroscopy and transcranial Doppler in monohemispheric stroke,”
Eur. Neurol., 41 159
–162
(1999). http://dx.doi.org/10.1159/000008041 Google Scholar
D. Hargroves et al.,
“The influence of positioning upon cerebral oxygenation after acute stroke: a pilot study,”
Age Ageing, 37 581
–585
(2008). http://dx.doi.org/10.1093/ageing/afn143 Google Scholar
H. W. Schytz et al.,
“Spontaneous low-frequency oscillations in cerebral vessels: applications in carotid artery disease and ischemic stroke,”
J. Stroke Cerebrovasc. Dis., 19 465
–474
(2010). http://dx.doi.org/10.1016/j.jstrokecerebrovasdis.2010.06.001 Google Scholar
M. J. Aries et al.,
“Near infrared spectroscopy for the detection of desaturations in vulnerable ischemic brain tissue: a pilot study at the stroke unit bedside,”
Stroke, 43 1134
–1136
(2012). http://dx.doi.org/10.1161/STROKEAHA.111.636894 SJCCA7 0039-2499 Google Scholar
M. S. Damian and R. Schlosser,
“Bilateral near infrared spectroscopy in space-occupying middle cerebral artery stroke,”
Neurocrit. Care, 6 165
–173
(2007). http://dx.doi.org/10.1007/s12028-007-0010-3 Google Scholar
M. Wolf et al.,
“Absolute frequency-domain pulse oximetry of the brain: methodology and measurements,”
Adv. Exp. Med. Biol., 530 61
–73
(2003). http://dx.doi.org/10.1007/978-1-4615-0075-9_7 Google Scholar
M. A. Franceschini et al.,
“Assessment of infant brain development with frequency-domain near-infrared spectroscopy,”
Pediatr. Res., 61 546
–551
(2007). http://dx.doi.org/10.1203/pdr.0b013e318045be99 Google Scholar
A. Demel et al.,
“Effect of different assumptions for brain water content on absolute measures of cerebral oxygenation determined by frequency-domain near-infrared spectroscopy in preterm infants: an observational study,”
BMC Pediatr., 14 206
(2014). http://dx.doi.org/10.1186/1471-2431-14-206 Google Scholar
R. Yang et al.,
“Monitoring angiogenesis using a human compatible calibration for broadband near-infrared spectroscopy,”
J. Biomed. Opt., 18 016011
(2013). http://dx.doi.org/10.1117/1.JBO.18.1.016011 Google Scholar
C. Giffard et al.,
“Outcome of acutely ischemic brain tissue in prolonged middle cerebral artery occlusion: a serial positron emission tomography investigation in the baboon,”
J. Cereb. Blood Flow Metab., 24 495
–508
(2004). http://dx.doi.org/10.1097/00004647-200405000-00003 Google Scholar
W. D. Heiss et al.,
“Dynamic penumbra demonstrated by sequential multitracer pet after middle cerebral artery occlusion in cats,”
J. Cereb. Blood Flow Metab., 14 892
–902
(1994). http://dx.doi.org/10.1038/jcbfm.1994.120 Google Scholar
A. R. Young et al.,
“Relationships between high oxygen extraction fraction in the acute stage and final infarction in reversible middle cerebral artery occlusion: an investigation in anesthetized baboons with positron emission tomography,”
J. Cereb. Blood Flow Metab., 16 1176
–1188
(1996). http://dx.doi.org/10.1097/00004647-199611000-00012 Google Scholar
T. Durduran et al.,
“Diffuse optics for tissue monitoring and tomography,”
Rep. Prog. Phys., 73 076701
(2010). http://dx.doi.org/10.1088/0034-4885/73/7/076701 Google Scholar
H. R. Winn and J. R. Youmans, Youmans Neurological Surgery, 4 W.B. Saunders, Philadelphia, Pennsylvania
(2004). Google Scholar
Defining, Establishing, and Verifying Reference Intervals in the Clinical Laboratory; Approved Guideline, 3rd ed.Clinical and Laboratory Standards Institute, Wayne, Pennsylvania
(2008). Google Scholar
A. M. Demchuk et al.,
“Specific transcranial Doppler flow findings related to the presence and site of arterial occlusion,”
Stroke, 31 140
–146
(2000). http://dx.doi.org/10.1161/01.STR.31.1.140 SJCCA7 0039-2499 Google Scholar
M. Wintermark et al.,
“Perfusion-CT assessment of infarct core and penumbra: receiver operating characteristic curve analysis in 130 patients suspected of acute hemispheric stroke,”
Stroke, 37 979
–985
(2006). http://dx.doi.org/10.1161/01.STR.0000209238.61459.39 SJCCA7 0039-2499 Google Scholar
T. S. Leung et al.,
“Estimating a modified Grubb’s exponent in healthy human brains with near infrared spectroscopy and transcranial Doppler,”
Physiol. Meas., 30 1
–12
(2009). http://dx.doi.org/10.1088/0967-3334/30/1/001 Google Scholar
S. Suzuki et al.,
“Tissue oxygenation monitor using NIR spatially resolved spectroscopy,”
Proc. SPIE, 3597 582
–592
(1999). http://dx.doi.org/10.1117/12.356862 Google Scholar
R. Gatto et al.,
“Frequency domain near-infrared spectroscopy technique in the assessment of brain oxygenation: a validation study in live subjects and cadavers,”
J. Neurosci. Methods, 157 274
–277
(2006). http://dx.doi.org/10.1016/j.jneumeth.2006.04.013 Google Scholar
I. Kida, D. L. Rothman and F. Hyder,
“Dynamics of changes in blood flow, volume, and oxygenation: implications for dynamic functional magnetic resonance imaging calibration,”
J. Cereb. Blood Flow Metab., 27 690
–696
(2006). http://dx.doi.org/10.1038/sj.jcbfm.9600409 Google Scholar
D. A. Boas and M. A. Franceschini,
“Haemoglobin oxygen saturation as a biomarker: the problem and a solution,”
Philos. Trans. R. Soc. A: Math. Phys. Eng. Sci., 369 4407
–4424
(2011). http://dx.doi.org/10.1098/rsta.2011.0250 Google Scholar
C. Terborg et al.,
“Noninvasive assessment of cerebral perfusion and oxygenation in acute ischemic stroke by near-infrared spectroscopy,”
Eur. Neurol., 62 338
–343
(2009). http://dx.doi.org/10.1159/000239794 Google Scholar
R. C. Mesquita et al.,
“Direct measurement of tissue blood flow and metabolism with diffuse optics,”
Philos. Trans. R. Soc. A: Math. Phys. Eng. Sci., 369 4390
–4406
(2011). http://dx.doi.org/10.1098/rsta.2011.0232 Google Scholar
BiographyFrançois Moreau is a stroke neurologist in Sherbrooke, Canada. He collaborates in translational research applications to the field of stroke. He also has publications on the application of MRI to the clinical management of transient ischemic attack. Runze Yang is a PhD student in neuroscience at the University of Calgary. His research focus includes glioblastoma, multiple sclerosis, stroke, and hypoxia. Vivek Nambiar is a stroke neurologist based Amrita vishwavidhyapeetham University Kochi India, heading the stroke unit at the teaching hospital. His interests are collateral imaging in acute stroke and endo vascular therapeutics. He had worked as a post doctoral fellow at the University of Calgary while doing the project. He has 17 publications. Andrew M. Demchuk is the director of the Calgary Stroke Program located at the Foothills Medical Centre. His primary research interests are in the area of vascular imaging where he is trying to develop new treatments for stroke by optimally selecting patients based on imaging. Jeff F. Dunn is a specialist in applying MRI and near-infrared spectroscopy in biomedical applications. Much of the work is in brain, regulation of oxygenation, and the impact of hypoxia on brain health. He is the director of the Experimental Imaging Centre at the University of Calgary, which houses a 9.4T MRI and a range of animal-and human-oriented optical equipment. He has 140 publications. |
|||||||||||||||||||||||||||||||||||||||||||||||||||||||||||||||||||||||||||||||||||||||||||||||||||||||||||||||||||||||||||||||||||||||||||||||||||||||||||||||||||||||||||||||||||||||||||||||||||||||||||||||||||||||||||||||||||||||||||||||||||||||||||||||||||||||||||||||||||||||||||||||||||||||||||||||||||||||||||||||||||||||||||||||||||||||||||||||||||||||||||||||||||||||||||||||||||||||