

|
|
1.IntroductionFunctional near-infrared spectroscopy (fNIRS) is a noninvasive neuroimaging technique that monitors tissue oxygenation and cortical hemodynamics in the brain.1 Near-infrared light with wavelengths within the 650- to 900-nm range is projected onto the scalp by optical emitters, and is mainly absorbed by hemoglobin during its propagation in brain tissue. By collecting the scattered light with sensors positioned a few centimeters from the emitters, local changes in blood oxygenation on the cortex can be measured in terms of concentration changes in oxygenated hemoglobin (HbO) and deoxygenated hemoglobin (HbR).2–4 By adding together the concentration variations in HbR and HbO, concentration changes in total hemoglobin (HbT) are obtained, which can be regarded as an indicator of regional cerebral blood volume (rCBV) variations under the hypothesis of constant hematocrit.5 Compared to alternatives such as single photon-emission computed tomography (SPECT), positron emission tomography (PET), or functional magnetic resonance imaging (fMRI), fNIRS offers the potential for long-term, noninvasive monitoring, and higher temporal resolution hemodynamic imaging. fNIRS applications in the study of epilepsy have grown in recent years.6 Epilepsy is a common and diverse set of chronic neurological disorders characterized by seizures (or ictus), resulting from abnormal and excessive neuronal discharges.7,8 Seizures last from several seconds to a few minutes, and are usually accompanied by clinical manifestations such as altered mental state, tonic and/or clonic movements, and various other experiential symptoms.9,10 Brief paroxysmal discharges (20 to 200 ms) may occur in between these ictal events (i.e., seizures), and are called “interictal epileptiform discharges” (IEDs, a.k.a “spikes”). Both seizures and IEDs can usually be captured and observed with electroencephalography (EEG). Using fNIRS concurrently with EEG enables researchers not only to detect and monitor epileptic events, but also to study their impact on hemodynamics and oxygenation. In past decades, different groups have assessed the clinical potential of EEG-fNIRS as an auxiliary method of epilepsy diagnosis11–33 (summarized in Table 1). In these works, the hemodynamic effects of epileptic events (mostly seizures) were preliminarily investigated in adults, children, and neonates. Early studies revealed heterogeneous patterns of oxygenation changes that might be specific to seizure types.11,12,18–20 For example, Villringer et al.20 reported cerebral blood volume increases concordant with seizure origin in three patients with presumed extratemporal epilepsy, while a reproducible deoxygenation was also observed over the frontal lobe by Steinhoff et al.19 on two patients with mesial temporal lobe epilepsy. Sokol et al.18 studied eight patients with drug refractory temporal epilepsy using fNIRS and showed distinct patterns of cerebral oxygenation for complex partial seizures and for rapidly secondarily generalized complex partial seizures. Haginoya et al.12 studied various types of pediatric epileptic seizures with fNIRS in 15 children and reported heterogeneous CBV changes depending on seizure types (convulsions, absence, tonic status epilepticus, and infantile spasms). These initial observations suggested the utility of fNIRS in epilepsy research but did not make direct progress toward evaluating its preclinical value for focus lateralization or localization because of the limited number of subjects, the use of a single fNIRS channel (frequently affixed to the hairless skin overlying the frontal cortex to avoid hair contamination) distant from the seizure focus, heterogeneity in seizure types, and/or lack of clear confirmation of the epileptogenic zone. One pioneer fNIRS study on focus lateralization was carried out by Watanabe et al.,23 where they performed bihemispheric sampling of brain hemodynamics and correctly lateralized the focus for 28 of the 29 patients. Their recent work on mesial temporal lobe epilepsy presented four successful focus lateralization cases when using HbO changes as the index.31 However, the behavior of other chromophores was not discussed in their reports and information on remote changes was not elaborated. Table 1Summary of the literature on EEG-fNIRS in human epilepsy.
In the past few years, the feasibility of applying an optical imaging technique in the study of the hemodynamic response to neonatal seizures has been explored by different groups26,28,30,32 (see also Ref. 35 for a review of early discoveries). Their recent results showed that the shape of the hemodynamic changes associated with neonate seizures might be distinct from the standard responses to functional stimulations on older children or adults. Since reading neonatal EEG can be extremely challenging, and performing SPECT, PET, or fMRI on neonates is usually not possible due to ethical and technical restrictions,28 their studies are remarkable in showing the potential of fNIRS for monitoring in neonatal intensive care units. Another particular interest of recent fNIRS work was in the observation of oxygenation variations preceding the EEG onsets of epileptic seizures. With EEG-fNIRS, two different groups observed preictal oxygenation changes over the frontal lobe prior to temporal lobe seizures.15,17 Although a subsequent attempt of using fNIRS-measured hemoglobin concentration changes as biomarkers for seizure detection was unsuccessful,29 this endeavor suggests a potential for fNIRS as a home monitoring seizure detection or prediction device. Some other studies focused on the application of recent fNIRS methodological improvements to epilepsy. For example, aiming at removing the movement artifact from clinical fNIRS recordings, Yücel et al.22 proposed to use collodion-fixed prism-based optical fibers, which were eventually proven to be helpful in recovering the hemodynamic response to three epileptic seizures in their study. Serving the same purpose, data-based filtering techniques were also adapted into the analysis of long-term fNIRS data.33 In addition, efforts have been made by Machado et al.36 to provide an optimal fNIRS emitter/detector montage in IED studies to maximize the sampling sensitivity over one or several brain regions. In summary, preliminary work confirms the clinical potential and usefulness of fNIRS: (1) it was seen as a robust tool to explore hemodynamics associated with seizures on adults, children, and neonates; (2) studies of seizures indicated a potential for epileptic focus localization; (3) it can possibly be used to study preictal hemodynamic changes; and (4) fNIRS hardware and software have steadily improved over the last few years and will most likely continue to improve, which may in turn benefit future clinical studies. Our group has been trying to complement the current research paradigm by recording from more channels (typically 100 to 150) to reconstruct two-dimensional (2-D) topographic images of activations with much larger brain coverage. The relatively large number of channels ascertained complex local and remote oxygenation changes during focal seizures in a fair number of patients.37–39 In addition, we were able to detect the hemodynamic responses associated with IEDs.39–41 We also assessed the degree of oxygenation demand due to IEDs in the epileptic focus based on EEG-fNIRS data collected from a total of 40 patients.42 2.Methods2.1.Simultaneous Electroencephalography-Functional Near-Infrared Spectroscopy RecordingsBack in 2006, when one of us Dang Khoa Nguyen (DKN) initiated an EEG-fNIRS epilepsy research program, commercial fNIRS equipment did not incorporate EEG, and recordings were not long enough to study seizures. Helmets were often made with Velcro strips and were very sensitive to patient movement. A motorcycle helmet alternative was uncomfortably heavy. This motivated the design of a rigid and light helmet drilled with holes to mount NIRS optodes (sources and detectors) and EEG electrodes.43 Over the last 5 years, portable, long-term monitoring systems dedicated to epilepsy have been developed.44–46 In studies reviewed in the following sections,37–42,47 we used a home-modified commercial (nonportable) fNIRS imaging system (ISS Imagent, Champaign, Illinois) with helmets of different sizes to ensure the best fit to patients’ heads. Recording hardware included 19 carbon EEG electrodes, 64 fiber sources, and 16 fiber detectors mounted on the helmets. A detector is placed 3 to 5 cm away from several adjacent sources, forming multiple optical source–detector (SD) channels [Fig. 1(a)]. Optode positions were then coregistered onto a three-dimensional (3-D) high-resolution anatomical MRI (obtained prior to EEG-fNIRS) using BrainSight™ (Rogue Research, Montreal, Canada) [Fig. 1(b)]. 3-D coordinates of an SD channel were considered as the midpoint of its source and detector. In our studies, channel positions were intentionally arranged so that the covered area included the whole lobe with the preacknowledged epileptic focus, the corresponding contralateral lobe, and as much area from the other lobes as possible, especially on the suspected focus side. An alternative approach to generate the SD montage was recently proposed in Ref. 36, in which the authors aimed at maximizing the spatial sensitivity in one or several brain regions. Fig. 1(a) Example of optode configuration for simultaneous EEG-fNIRS. (b) Coregistered optode distribution projected onto the scalp: sources/detectors are marked in blue/green, respectively. 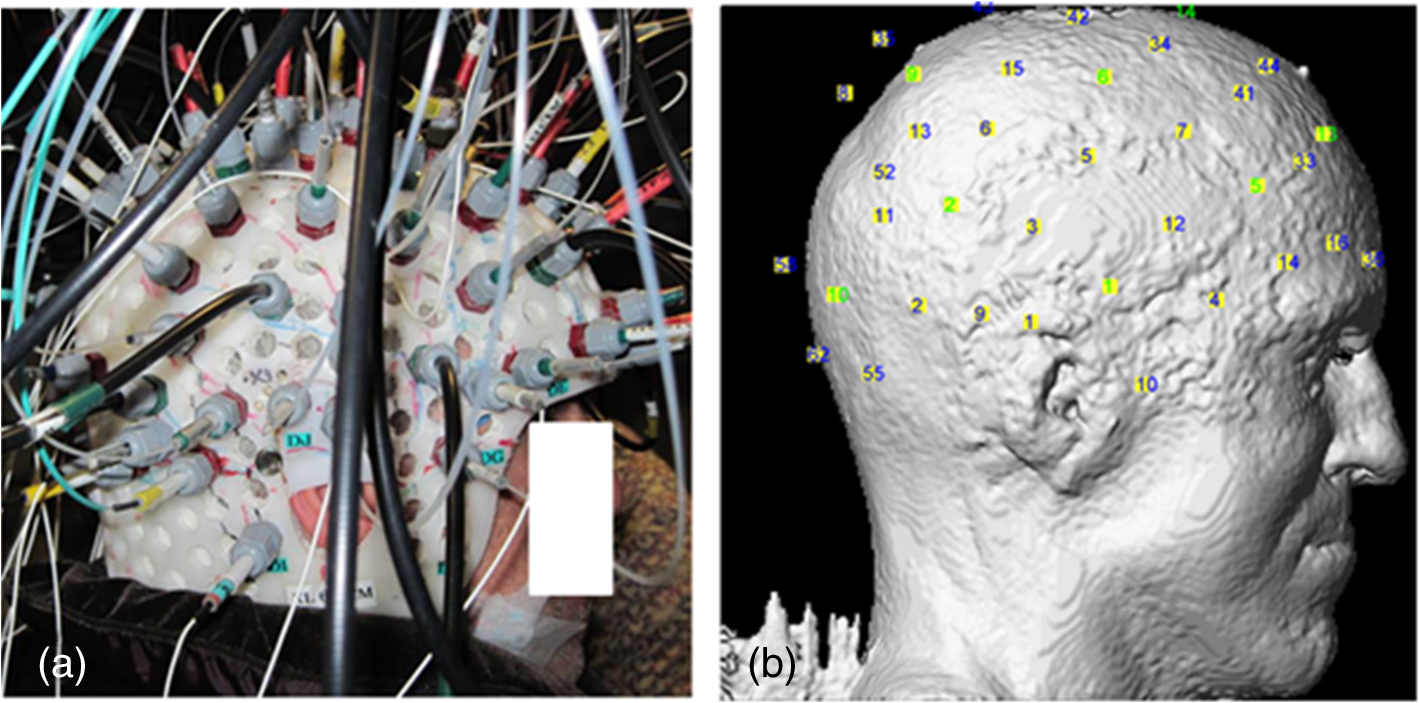 After installation of the helmet, multiple sessions of simultaneous EEG-fNIRS are recorded for each patient. During recordings, each patient is simply asked to sit comfortably in a chair and relax. Two wavelengths on either side of the 800-nm hemoglobin isosbestic point (i.e., the wavelength at which the absorption rates of HbR and HbO are equal) are used: 690 nm, which is more sensitive to HbR, and 830 nm, which is more sensitive to HbO. Optical intensities are recorded at 19.5 Hz by an oximeter. Hemoglobin concentration changes are then solved from the recorded optical intensities by using the modified Beer–Lambert law.48 Multiple SD channels deliver topographical images (i.e., activation maps on the surface of the brain), which are now commonly seen in the literature. EEG data are recorded at a sampling rate of 500 Hz using a Neuroscan Synamps 2TM system (Compumedics, Charlotte, North Carolina), and are then band-pass filtered between 0.1 and 100 Hz to remove instrumental noise and other artificial disturbances. After acquisition, the EEG data are reviewed offline by certified clinical neurophysiologists. Seizure-onset and seizure-offset times, defined, respectively, as the earliest and latest clinical or electrographic evidence of seizure activity, are marked directly on the EEG along with IEDs using Analyzer 2.0 (Brain Products, Gilching, Germany). Physiological data are also marked on the electrocardiogram and are semiautomatically filtered. 2.2.Data AnalysisTwo software packages to analyze EEG-fNIRS data have been developed in house. The first one is an extension of HomER49 with helmet visualization and artifact detection. More explicitly, a topographic view onto the scalp is created with MATLAB (MathWorks) to display the evolution and general propagation of HbR and HbO activations. A student’s -test is subsequently performed to assess the significance of activation amplitude over baseline, assuming a confidence level of 95% corrected by Bonferroni thresholds. The calculated -values of all channels are then mapped to the topographic view without interpolation, according to the coordinates of the channels that have been acquired during the coregistration process. Overall, this software package allows quick inspection of fNIRS time courses and simplicity in statistical analysis. The other data processing package (named nirs10) features more developed 2-D topographic reconstructions, which require a more elaborate statistical treatment for multiple comparisons. It is based on statistical parametric mapping (SPM)50 and allows automated preprocessing and standardized statistical analysis adapted to fNIRS data in a way similar to the treatment of fMRI data.51 A general linear model (GLM) is introduced to model the time-varying brain hemodynamics, as this can provide for more flexible tests of activations than simpler approaches.52,53 The detected hemoglobin concentration changes are decomposed by the GLM into a linear combination of the expected hemodynamic response of epileptic or physiological events (such as seizures, IEDs, cardiac oscillations, etc.) plus an error term. These responses are constructed by convolving the time and duration of the events (which have been previously marked on EEG data) with a basis function, normally a canonical hemodynamic response function (HRF).54 To obtain 2-D contrast maps from fNIRS data, the central difficulty in accounting for multiple comparisons is the sparseness of measurements (unlike fMRI data). Ye et al.55–57 recently addressed this problem in their near-infrared spectroscopy-statistical parametric mapping (NIRS-SPM) toolbox. Inhomogeneous interpolation was applied and temporal correlation of the residuals was targeted in a desired way by the “precoloring” process.51 -tests were then conducted at the interpolated measurements for each type of epileptic events. Their methodology was validated in controlled experiments, such as finger-tapping (where strong hemodynamic responses could be expected). The main NIRS-SPM statistical analysis developments were integrated into our nirs10 package. 3.Applications3.1.Multichannel Electroencephalography-Functional Near-Infrared Spectroscopy for Focal Seizure ObservationEpileptic seizures are broadly classified into two different types, according to the source within the brain: focal seizures where the foci lie in only part of a cerebral hemisphere, and generalized seizures where the activation is distributed and involves both cerebral hemispheres.58 The most frequent focal seizures are temporal and frontal lobe seizures, while parietal, occipital, and insular seizures are less common and are thus less well studied in the literature. In this section, we review our work in studying hemodynamic responses associated with seizures during temporal lobe epilepsy,37 frontal lobe epilepsy,38 as well as posterior epilepsy39 with EEG-fNIRS. The data processing was carried out with our first analysis package (based on HomER) in the former two studies, and with the nirs10 toolbox in the latter study of posterior epilepsies. Our studies on seizures and IEDs were approved by the Ethics Committees of Sainte-Justine and Notre-Dame Hospitals. Informed consents were obtained from all subjects. On each subject, a comprehensive neurological evaluation was performed including ictal SPECT, PET, anatomical brain MRI, magnetoencephalography, and intracranial EEG (when needed). Focus localization was carried out by an epileptologist (DKN) based on multimodal analysis, and was confirmed by seizure-freedom following epilepsy surgery for most patients with a follow-up of more than a year. 3.1.1.Multichannel electroencephalography-functional near-infrared spectroscopy recording of temporal lobe seizuresNine patients with refractory temporal lobe epilepsy were recruited for simultaneous EEG-fNIRS recordings at the Optical Imaging Laboratory of Hôpital Sainte-Justine (Montreal, Quebec, Canada). Eight temporal lobe seizures were successfully recorded in three patients while the other six patients had uneventful EEG-fNIRS sessions in terms of seizures (but not IEDs, analyzed later). All detected seizures were accompanied by significant alterations in cerebral hemodynamics. Hemoglobin concentration changes occurred almost simultaneously with the suspected electrical onset. Variations from baseline to the highest peak reached 28% for HbR, 13% for HbO, and 11% for HbT. A detailed description of the hemodynamic responses to each seizure can be found in Ref. 37. Here, we first present the results from a group analysis where all eight seizures were aligned to seizure onset to assess overall variation of HbO and HbR (Fig. 2). In this figure, two distinct phases were identified in the focus area: in phase 1, a significant HbR decrease as well as an HbO increase occurred initially (consistent with a compensatory rise of rCBV to augment oxygen supply to discharging epileptic neurons59); in phase 2, after the initial decrease, a longer increase in HbR, which often outlasted the duration of the seizure, was seen for the three patients, while HbO continued to increase for patient 1 and even decreased for patients 2 and 3. This implies that during complex partial seizures, the brain might suffer from hypoxia. The reactive increase in rCBV might not be able to sufficiently meet the local oxygen demand. Fig. 2HbO and HbR concentration changes from baseline in group analysis where all eight temporal lobe seizures from three patients are aligned to seizure onset at time zero. Solid curve shows the medians and errorbars depict the 25th and the 75th pencentiles of concentration changes of the eight seizures at certain time points. Significance level: and . Figure was adapted from Ref. 36. 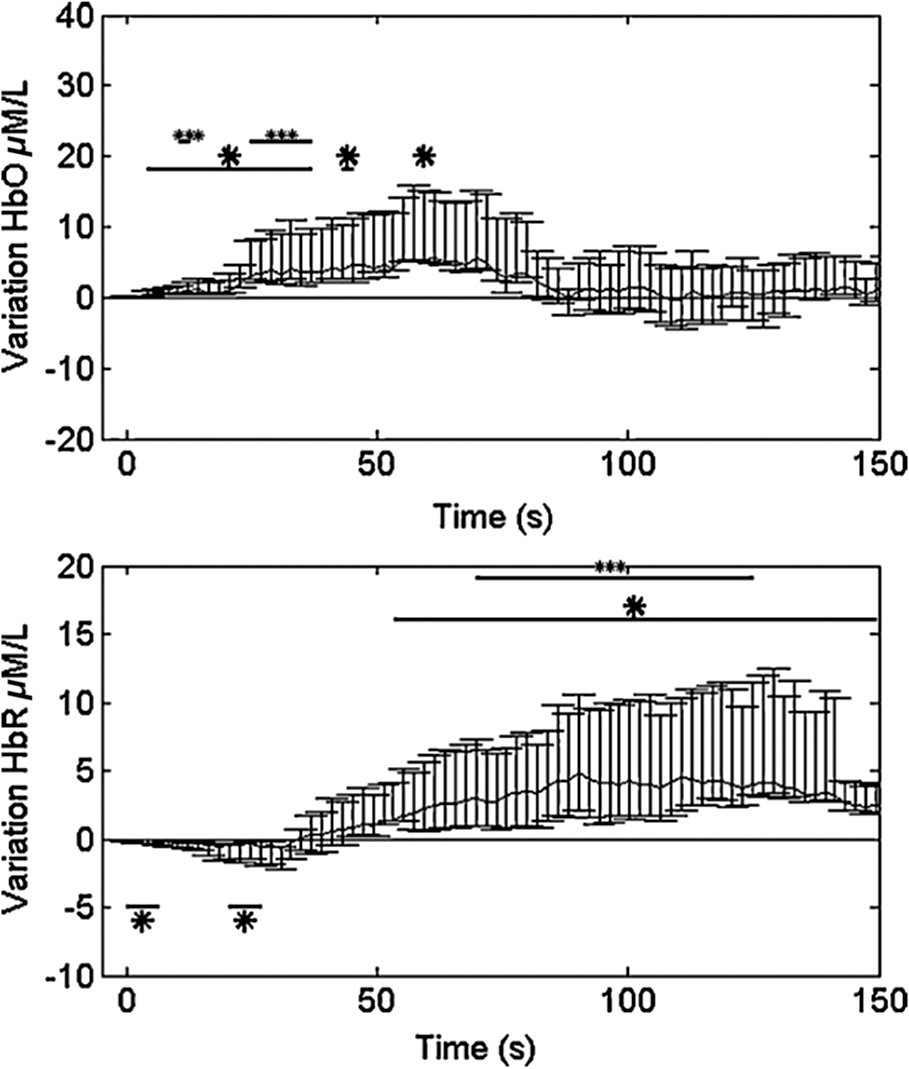 Another notable finding in the study was the surprisingly similar hemodynamic profile seen over the region contralateral to the focus. Similar variations, albeit of lower amplitude, in hemoglobin concentration during and after temporal lobe seizures were observed early on in the opposite temporal lobe region. In other remote lobes of the ipsilateral hemisphere, hemoglobin concentrations tended to have changes of the opposite sign. While contralateral homologous and remote changes may be explained by seizure propagation, very early hemodynamic changes appeared to occur without any evidence of contralateral epileptic activity on EEG. It was then concluded that focal temporal lobe seizures had effects on remote regions both before and after they propagated to them. The results were also evaluated to establish whether EEG-fNIRS could adequately lateralize the epileptic focus. Two laterality indices were calculated by comparing the extent of HbO activation as well as its peak -value between hemispheres. Among the eight temporal lobe seizures, six (from two out of the three patients) showed a larger extent of activation and/or higher peak amplitude on the ipsilateral side of the epileptic focus during the initial HbO increase. Lateralization of the focus to the correct side was possible for these two patients. The following case study on seizure 4 in patient 1 illustrates these findings (Fig. 3). Fig. 3Case study: patient 1, seizure 4. (a) Hemodynamic variations in both the ipsilateral (epileptogenic) side and contralateral temporal lobe. EEG evidence of seizure is visible above the black line. (b) Topographic uncorrected -statistics during the initial phase of the seizure. 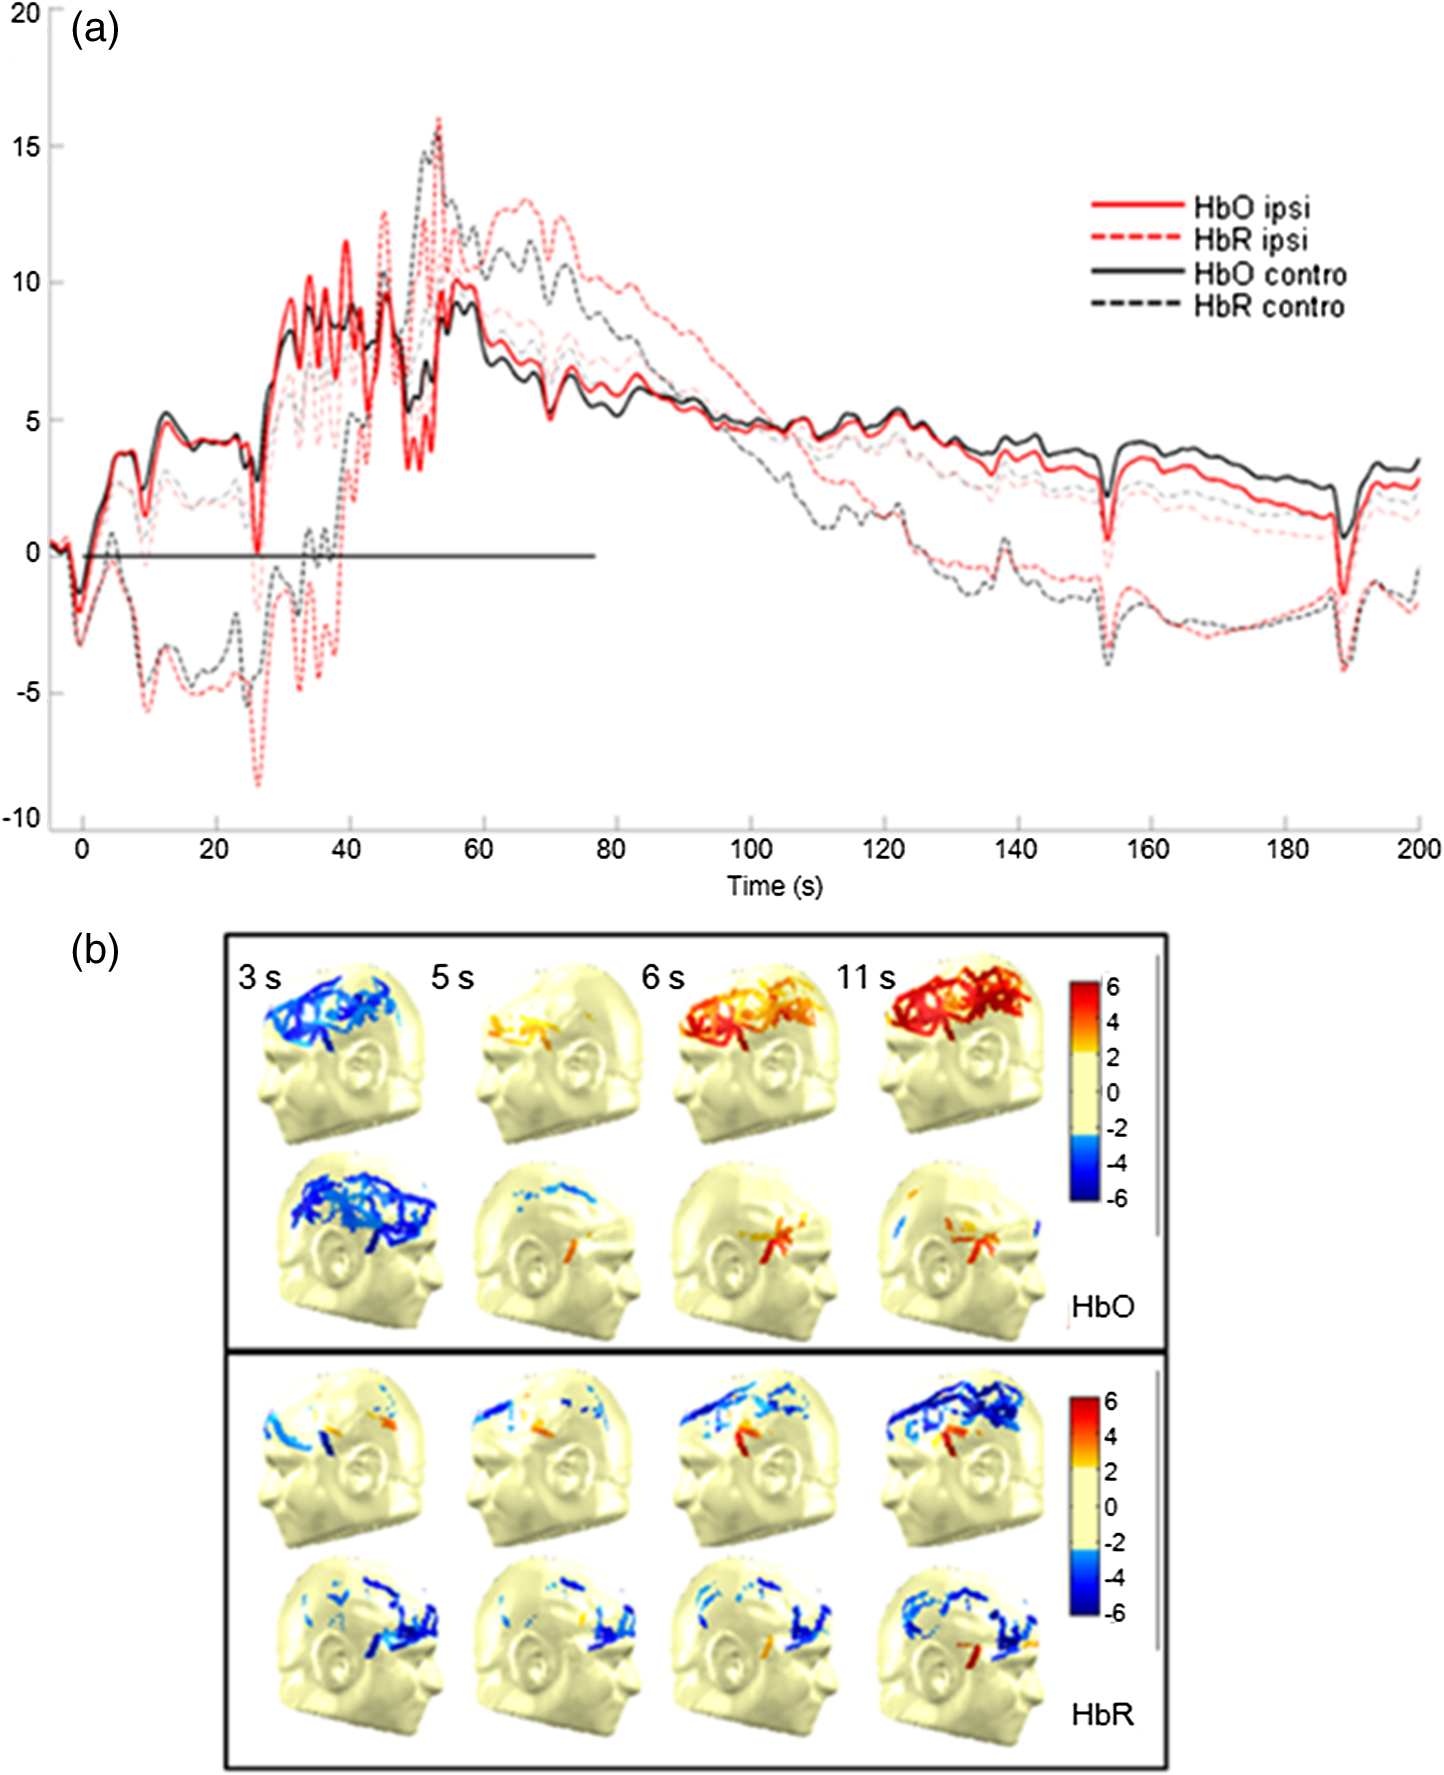 Patient 1, seizure 4: This patient is a 49-year-old man with left medial temporal lobe epilepsy due to prior meningitis in childhood. One hundred and twenty optical channels were placed bilaterally over the frontal, temporal, and parietal lobes during EEG-fNIRS recordings. Five complex partial seizures with mean duration of 93 s were recorded during total recording time of 82 min. Figure 3(a) depicts the hemodynamic variations associated with seizure 4 over time in terms of HbO and HbR concentration changes measured by selected optodes over the left (ipsilateral) and right (contralateral) temporal lobes. Figure 3(b) presents uncorrected -maps at several specific times prior to obvious ictal rhythmic theta activity. In the temporal region ipsilateral to the focus side, an increase in HbO as well as an increase in HbT was first noticed (phase 1). The increase in HbO and in HbT mostly resulted from a local increase in rCBV, while HbR decreased. After phase 1, phase 2 followed, consisting of a significant long-duration increase in HbR as well as continued increases in HbO and in HbT. Hence, possible hypoxia over the seizing tissue was suggested by that phase. Ictal hemodynamic changes gradually returned to the baseline after the seizure offset. In the contralateral anterior temporal region, despite no evidence of epileptic contralateral activity on EEG at seizure onset, hemoglobin concentration changes behaved in a very similar way. Moreover, the results of seizure 4 helped to lateralize the epileptogenic focus to the correct hemisphere, as a larger spatial extent in HbO activation was clearly observed on the ipsilateral side. 3.1.2.Multichannel electroencephalography-functional near-infrared spectroscopy recording of frontal lobe seizuresA total of 20 patients with nonlesional, suspected refractory frontal lobe epilepsy also underwent EEG-fNIRS at Hôpital Sainte-Justine. The epileptic focus was eventually clearly identified for 11 patients following clinical investigation. Eighteen seizures from these 11 patients were recorded: five complex partial seizures, five simple partial seizures, and eight electrical seizures. All detected seizures were observed to be associated with changes in the fNIRS optical signal over the epileptogenic zone. Details of ictal hemodynamic variations for each seizure can be found in Ref. 38. In summary, these variations usually occurred () after seizure onset, and persisted until seizure offset (seven patients) or even beyond (four patients). Over the seizure focus, an initial concentration increase for HbO and HbT from baseline to peak was noted, followed by a gradual decline to a plateau or to the baseline. The amplitude of the rise highly correlated seizure duration. Brief electrical seizures (mean duration: 9.4 s) were accompanied by small increases from the baseline (mean: 1.2%/0.9% for HbO/HbT), while larger increases (mean: 7.4%/5.7% for HbO/HbT) were seen with longer electroclinical seizures (mean duration: 25.3 s). HbR variation within the epilepticus focus was heterogeneous. In four patients, HbR behaved as expected, with an initial decrease to a nadir and a progressive return to the baseline or plateau. In the remaining patients, either no significant response or an opposite response was encountered. Hence, in contrast to what we observed with temporal lobe seizures,37 the local increase in rCBV appeared to be sufficient to meet the metabolic demand in the majority of recorded frontal lobe seizures (9 out of 11 patients) as most showed little change (suggesting sufficient oxygen supply) or a decrease (suggesting oxygen oversupply) in HbR. These observations may probably be due to the fact that recorded frontal lobe seizures were shorter in duration (mean duration: 18.2 s) compared to recorded temporal lobe seizures (mean duration: 66.5 s). Further recording of seizures is necessary to investigate the different factors that may affect the behavior of HbR. In the homologous contralateral region, we again saw very similar alterations in HbO, HbR, and HbT as in our previous study on temporal lobe epilepsies.37 These closely mirrored activations occurred with no clear delay to ipsilateral hemoglobin variations, but their peak amplitudes were usually slightly lower. To lateralize the epileptic focus, during the early phase of frontal lobe seizures, EEG-fNIRS discerned larger HbO activation extent on the focus side in 7 out of 8 patients, but higher peak amplitude of HbO activation on the focus side in only 4 out of 8 patients. The extent of HbO activation was more indicative of the epileptogenic hemisphere than peak HbO activation. Additional work is necessary to evaluate the EEG-fNIRS potential in seizure localization. 3.1.3.Multichannel electroencephalography-functional near-infrared spectroscopy recording of seizures from posterior epilepsiesNine patients with refractory posterior epilepsies (such as occipital, parieto-occipital, or temporo-occipital epilepsies) participated in our EEG-fNIRS study.39 Seizures were seen in three patients, the first of whom had two simple partial seizures (lasting 34 and 52 s, respectively), the second suffered from numerous (34) brief auras of flashing lights but without clear electrographic correlates, and the third had a simple partial seizure (lasting 23 s), again with no obvious EEG change. In most cases, GLM analysis revealed some responses to recorded epileptic seizures with various degrees of significance and agreement with the patients’ epileptic foci. In the first two patients, significant HbR decreases were located in the focus as well as in the corresponding contralateral areas. In the last patient, we did not observe any HbR decrease in the occipital lobes, but were able to locate an HbO increase broadly consistent with the suspected focus region. In summary, our work in recent years confirms that continuous fNIRS-EEG can indeed detect hemodynamic changes during focal seizures and that these variations (occurring both locally over the epileptic focus and in remote areas) are more complex than previously thought. 3.2.Multichannel Electroencephalography-Functional Near-Infrared Spectroscopy for Interictal Epileptiform Discharge ObservationResults on seizures summarized earlier point to the clinical potential of continuous EEG-fNIRS in detecting focal seizures and monitoring their hemodynamic response before, during, and after their occurrence. Unfortunately, one may not always be able to record seizures during a prolonged EEG-fNIRS study as seizures are unpredictable. It is likely, however, that IEDs will be recorded as they are typically numerous in patients with drug-refractory focal epilepsy. Their analysis may prove useful in identifying epileptic foci or their networks.60,61 In Ref. 41, two analysis methods based on the GLM were used to process fNIRS data related to IEDs: a Bayesian general linear model (BGLM62) and wavelet generalized least square (WGLS63). Both methods were applied in simulation and to the analysis of responses to bilateral fronto-temporal IEDs in a patient with focal right frontal epilepsy. Both methods successfully detected a significant HbO increase and an HbR decrease (thus an increment of rCBV could be inferred) that were spatially concordant with the presumed epileptogenic focus. WGLS was overall more accurate, more specific, and more reliable than the BGLM, mainly because of its ability to model transient events for the drifts and its inherent noise whitening property. However, it was also noticed that both methods became inaccurate in case of low signal-to-noise ratio (SNR) and would lead to a high rate of false positives. In Ref. 40, IEDs from three more patients were studied, comparing results between EEG-fNIRS and EEG-fMRI in the same subjects. These patients had IEDs that occurred very frequently, with an average of 32/26/26 IEDs/min, respectively. It thus appeared interesting to investigate the extent to which the hemodynamic response was linear when consecutive IEDs occurred within a brief timespan of one another. Clearly, when a large number of spikes occur in rapid succession, an inhibitory nonlinear effect is to be expected, as the hemodynamic response would grow arbitrarily large under a linear assumption. The method of Volterra kernels,64 an analog of the Taylor expansion of series as applied to functions, was used to quantify nonlinearities, implemented in the nirs10 software package. In these three patients, the first-order Volterra (linear response) and second-order Volterra (first nonlinear correction to the linear response) amplitudes were estimated using GLM methodology. Good concordance between fNIRS and fMRI in the three patients was observed for the amplitudes and ratio, and in the correspondence of a positive blood oxygenation level-dependent (BOLD) signal with a decrease of HbR and an increase of HbO. Adding this nonlinear contribution helped to obtain the correct localization of the epileptic focus with fMRI for one patient, which was missed in standard analyses without nonlinearities. For EEG-fNIRS, focus localization was less clear due to the presence of several responses in other areas of the brain, mainly mirror sites to the epileptic focus. Through this work, it was then concluded that including nonlinear terms to GLM might be beneficial when numerous IEDs take place in rapid succession. As part of the study on posterior epilepsies,39 we applied GLM analysis to 7 out of 9 patients exhibiting focal IEDs during EEG-fNIRS. We located HbR responses and they were broadly concordant with the epileptic focus in 6 out of 7 patients. In five patients (5/7), the HbR response near the focus was recognized to be the most significant among all the activations with respect to -statistic scores and spatial extents, and was thus indicative of the focus. Nonlinearity in HbR response was also significant at a -statistics threshold of 3.0 in 3 out of 4 patients with frequent IEDs. Concentration changes in HbO in these patients were seen to be less sensitive () and specific () with the focus than HbR. 3.2.1.Sensitivity and specificityIn Ref. 42, we performed EEG-fNIRS on a larger sample set of patients (40) with focal epilepsy, to estimate the percentage of patients we can expect EEG-fNIRS to help in activation detection and focus localization. In this study, GLM analysis was performed in a standardized manner as described in Sec. 2.2 with the nirs10 toolbox, assuming an SPM8 canonical HRF50 as the basis function. In each patient, the anatomical MRI was segmented to obtain a gray matter layer, from which four 2-D cortical projections (frontal, dorsal, right, and left) were extracted. Optode positions on the standard SPM8 anatomical atlas were then mapped back to these topographical projections of the patients’ gray matter layer. One-tailed 2-D contrast maps for each IED type from a patient-level analysis (“group-of-sessions”) were finally generated by interpolation of the hemodynamic responses for the four views. As the Euler Characteristic65 and Bonferroni thresholds were a bit too severe at the patient-level, an attempt was made at calculating a peak false discovery rate threshold66 on 2-D maps, assuming a 95% confidence level. In the meantime, the 3-D position of the most plausible epileptic focus, previously marked by an epileptologist, was also projected onto the four 2-D views. Comparisons between the locations of detected activations and the focus were then made at each view. Five patients were excluded from the sample because of too few IEDs or uncertain epileptic focus position. In the remaining 35 patients, 29 suffered from neocortical epilepsy, while the other six had mesial temporal lobe foci. In neocortical epilepsy, significant negative HbR concentration changes associated with IEDs were seen to be concordant with the epileptic focus in 18 out of 29 patients (sensitivity: 62%), while in eight patients, the HbR decreases near the focus were identified as being the most significant among all other clusters and thus would lead to successful identification of the epileptic focus (specificity: 28%). Similarly, significant HbO or HbT increases near the focus were observed in 38% of the 29 patients, and were the most significant in 21%. Specificity was further improved to 45%/24%/24% for HbR/HbO/HbT if analysis was restricted only to fNIRS activations that were topographically related on the basis of observed epileptiform activity. On the other hand, EEG-fNIRS was generally insensitive in the remaining six patients with mesial temporal lobe epilepsies (sensitivity: 0%/17%/17%, specificity: 0% for all chromophores). Although temporal IEDs detected on scalp EEG indicated that IEDs originating from mesial structures had projected to the temporal neocortex, corresponding hemodynamic changes were not observed in most of these six patients. The relatively modest sensitivity and specificity rates obtained in this study were probably partially due to the fact that IEDs evoke a weaker neurovascular response compared to seizures. Moreover, we were still able to recognize some responses to IEDs in remote regions, e.g., similar HbR activations in corresponding areas of the contralateral lobe were observed on 61% of the 18 patients who already had significant HbR responses near the focus (50% for HbO or HbT). Further analysis is needed to better understand the pathophysiology (and thus, the metabolic demands) behind hemodynamic propagation. Analysis of patient 39 is presented here as an individual case study (Fig. 4). Fig. 4Case study: patient 39. (a) Epileptic focus region: right SMA, shadowed). (b) Reconstructed NIRS channel map over gray matter layer of the patient (dorsal view). (c) EEG fragment with markings for right central IEDs. (d) Hemodynamic responses to central IEDs, patient level, one-tailed, 2-D-peak false discovery rate corrected, . Solid black circle (radius: 30 mm): epileptogenic focus. 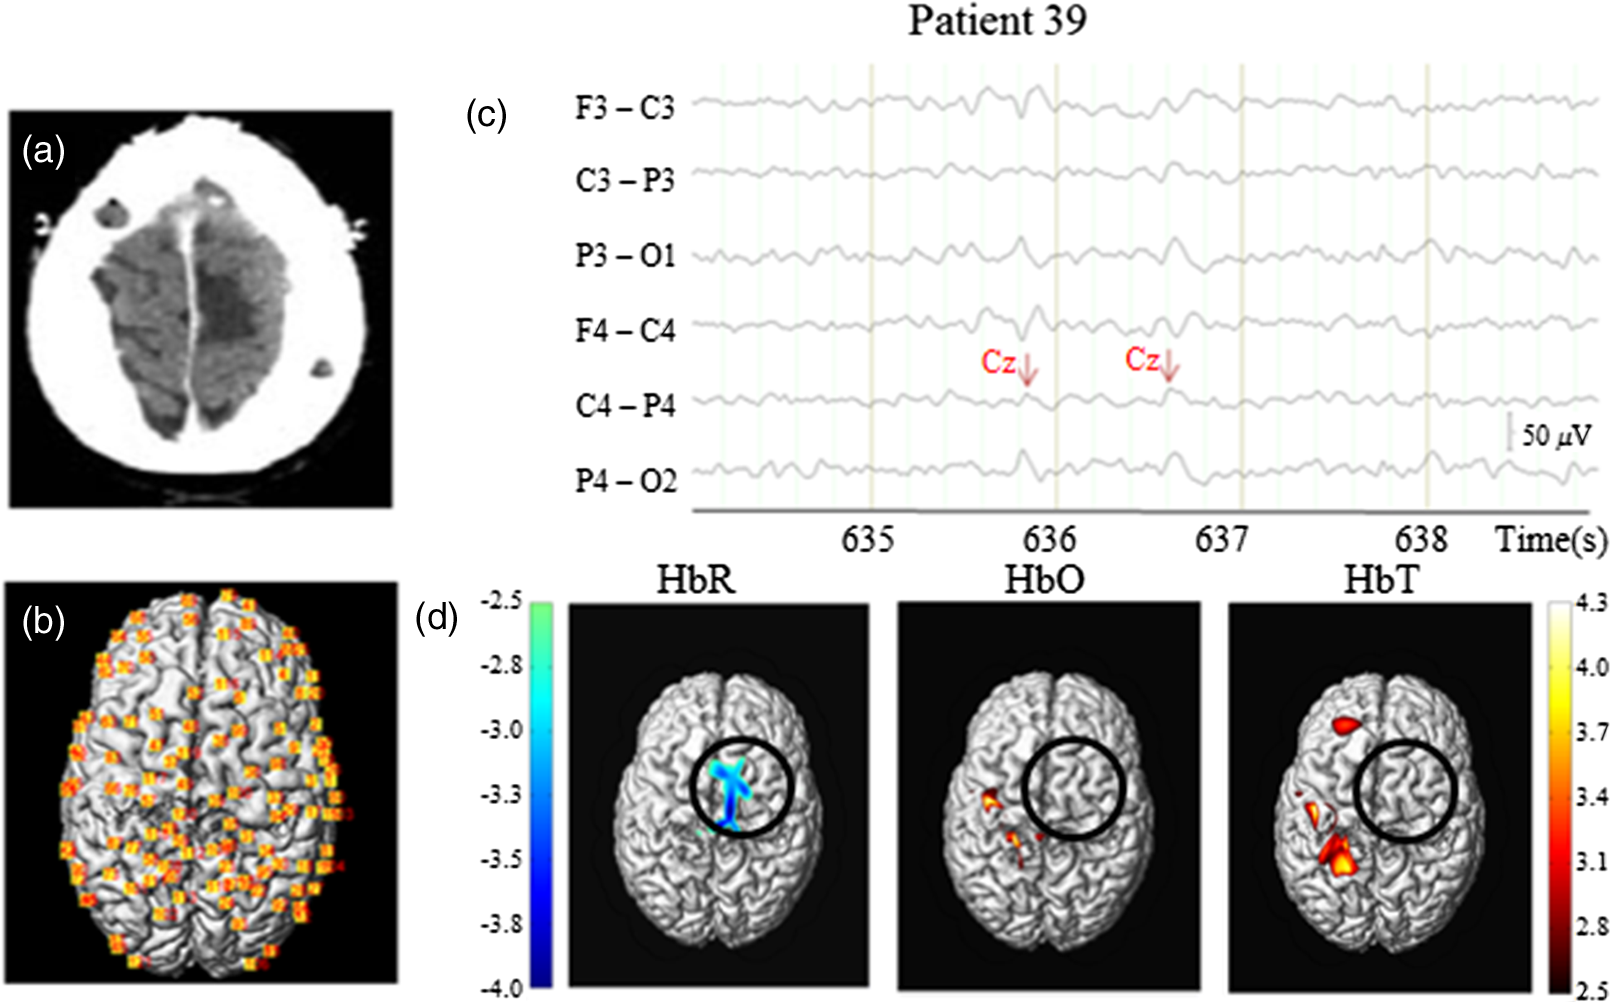 Patient 39, IEDs: This 18-year-old patient had an epileptic focus located in the right supplementary motor area (SMA) [Fig. 4(a)]. Four 15-min sessions followed by a 9.6-min final session were recorded with EEG-fNIRS. Some 121 channels were mounted on the helmet providing wide coverage of bilateral frontal lobes, parietal lobes, and central regions [Fig. 4(b)]; 550 central IEDs were captured during recordings [average: , Fig. 4(c)]. GLM analysis revealed a significant HbR decrease (with a minimum -value of ) located mainly in the right SMA at the time of IEDs [Fig. 4(d)], allowing correct localization of the epileptic focus. Increases in HbO or in HbT were not found in the right SMA, but were observed near corresponding areas contralateral to the focus region on the left side (a bit too posterior, maximum -values: for HbO/HbT). In recent work,47 we sought to model patient-specific HRFs to IEDs for GLM analysis with fNIRS data (instead of assuming an HRF with a canonical shape as the basis function). For this purpose, we chose to follow the fMRI literature.67–71 Specifically, a second-order Volterra term was also added to the model to account for the nonlinearity in the hemodynamic response when frequent IEDs were present in the data. On five patients with refractory focal epilepsy, we consistently obtained higher statistical scores and/or larger spatial extents for activations using specific HRFs compared to the SPM8 canonical HRF. These preliminary results suggested that, in some cases, including specific HRFs in the analysis can potentially provide better sensitivity in the detection of neuronal activations associated with epileptic events. 4.DiscussionIn this paper, we briefly reviewed the basic principles of fNIRS before describing in some depth the methods that our group has been using for simultaneous EEG-fNIRS recordings. Through the studies of focal seizures, we reported that the hemodynamic changes can last much longer than the EEG evidence of seizure activity and that epileptic seizures were associated with increased oxygenation (in terms of an increase in HbO) over the epileptic focus in most cases. In addition, early complex hemodynamic changes outside the focus were frequently observed, notably in contralateral homologous areas but also in more remote regions as seizures evolve. HbR concentration behaved heterogeneously: it usually decreased, sometimes stayed unchanged, or even in some cases increased during some seizures, indicating a concomitant deoxygenation process. Along another research direction, using careful modeling, we have also revealed a clinical potential in studying the hemodynamic response to IEDs with EEG-fNIRS in focal epilepsy research. In recent years, fNIRS studies of epilepsy have provided promising results, which in time may lead to clinical usefulness. However, much more work is necessary as fNIRS still has several limitations that prevents it from being a mature technique in clinical settings. To begin with, one problem concerns the interpretation of fNIRS results, as the relation between the measured hemodynamic change and the underlying neural activity is not fully understood. For example, evidence of a deoxygenation process can be detected during some seizures both in our study and in previous work.18,19,22,24 Whether the factors such as the type of seizures, their duration, their frequency, age, or other comorbid conditions are underlying the deoxygenation remains to be investigated. On the other hand, the HRF shape for IEDs was also reported to vary across patients and brain regions in previous BOLD-fMRI studies.72,73 Our recent work tried to estimate the HRF while accounting for the patient-specific variability and nonlinearity to some extent,47 but did not provide a standard solution for the analysis of IEDs with fNIRS. The other critical issue is the SNR of fNIRS signals. fNIRS data acquisition can be disturbed by movement artifacts especially during seizures. While several methods have been proposed to address this problem either with additional equipment22,74 or with signal denoising techniques,33,75,76 there is still no standard method for the correction of motion artifacts in fNIRS signals.77 Another factor that might lower the SNR of fNIRS signals is the unknown contribution from extracerebral tissue, as the averaged path of photon propagation is considered to follow a banana-shaped pattern from superficial layers (e.g., skin, scalp, skull, etc.) to cerebral cortex. The extracerebral contamination would further interfere with data interpretation by reducing fNIRS sensitivity to brain tissue, which gets worse if channels with shorter-than-typical separation (e.g., ) are employed in the SD layout.78,79 Recent studies concluded that signals recorded from very short SD separations (80) may be used to filter out the some of the physiological noise arising from superficial tissues.81–83 However, installing short channels together with long channels will probably lead to reduced head coverage, which is disadvantageous in epilepsy studies aimed at the localization of the focus region. Finally, it must be reminded that fNIRS can only reliably sample the superficial neocortex due to its limited penetration depth,6,19 a disadvantage shared by surface EEG. While additional hardware/software development and clinical validation are necessary, results obtained so far indicate that fNIRS may become in time a useful complementary clinical tool. Current methods to visualize the hemodynamics associated with abnormal epileptiform discharges in patients with focal epilepsy include the application of ictal SPECT, PET, and combined EEG-fMRI. All the aforementioned techniques have their limitations. The localization yield of ictal SPECT is low (especially with extratemporal lobe epilepsies) as a single ictal perfusion brain image can rarely discriminate between the seizure onset zone and areas receiving propagated activity.84 Indeed, the ictal SPECT is a single snapshot in time that lacks temporal information, similarly for PET, which measures glucose metabolism in a single scan. EEG-fMRI studies have dealt quite successfully with IEDs, e.g., a recent study reported 88% sensitivity and 64% specificity in the focus localization of 21 patients,85 but this method has difficulties with seizures as they are unpredictable and rarely occur at the exact moment of scanning. The difficulty in recording seizures with fMRI is exacerbated by the fact that small patient movements during a seizure can have a severely negative effect on data quality.86 None of the above imaging tests can be used for continuous monitoring for several reasons including cost, availability, safety, and portability. Building on these unique qualities, potential fNIRS applications include the following: (a) rapid detection of the onset of a seizure to warn patients to protect themselves or nurses/physicians to intervene; (b) help in localizing the epileptic focus for eventual epilepsy surgery; (c) determination of the impact of seizures on brain oxygenation and cognition to allow more aggressive treatment (combination of antiepileptic drugs, earlier referral for surgery, oxygen therapy, etc.); and (d) lateralization of language function prior to epilepsy surgery. Other potential applications include the evaluation of critically ill patients in the intensive care unit: assessment of convulsive and nonconvulsive status epilepticus, appraisal of the impact of repeated seizures on tissue deoxygenation, continuous assessment of electrical and hemodynamic activity in acute stroke, examination of several ill-defined EEG patterns of unclear pathophysiology (periodic discharges, stimulus-induced rhythmic ictal discharges, etc.) but frequently seen in critically ill neurological patients, etc. Adding continuous NIRS to video-EEG telemetry has the potential to boost our capacity to monitor the brain in such situations, allowing early intervention before irreversible brain damage can ensue. 5.ConclusionWork on fNIRS and epilepsy over the last two decades has provided cumulative promising results. To further validate the clinical utility of EEG-fNIRS in epilepsy research and treatment, the following challenges are proposed: a deeper understanding of hemodynamics associated with epileptic events; the development of a comfortable recording system with large spatial coverage combined with long term monitoring for days or even weeks, and portable use; and the improvements of analytical methods including appropriate modeling and artifact reduction. Randomized and blinded protocols with a larger patient number are also mandatory. AcknowledgmentsThis work was supported by the Fonds de Recherche en Santé du Québec (FRSQ) Grant No. 14385, the Canadian Institutes of Health Research (CIHR), Institute of Circulatory and Respiratory Health (ICRH), and the Heart and Stroke Foundation of Canada (HSFC) Grant No. 62573, and the Savoy Foundation. The authors thank Parikshat Sirpal for suggested improvements to text quality. ReferencesF. F. Jöbsis,
“Noninvasive, infrared monitoring of cerebral and myocardial oxygen sufficiency and circulatory parameters,”
Science, 198
(4323), 1264
–1267
(1977). http://dx.doi.org/10.1126/science.929199 SCIEAS 0036-8075 Google Scholar
D. T. Delpy and M. Cope,
“Quantification in tissue near-infrared spectroscopy,”
Philos. Trans. R. Soc. B Biol. Sci., 352
(1354), 649
–659
(1997). http://dx.doi.org/10.1098/rstb.1997.0046 Google Scholar
M. Desjardins, P. Pouliot and F. Lesage,
“Principles and applications of diffuse optical imaging for the brain,”
Curr. Med. Imaging Rev., 8
(3), 157
–173
(2012). http://dx.doi.org/10.2174/157340512803759901 Google Scholar
F. Irani et al.,
“Functional near infrared spectroscopy (fNIRS): an emerging neuroimaging technology with important applications for the study of brain disorders,”
Clin. Neuropsychol., 21
(1), 9
–37
(2007). http://dx.doi.org/10.1080/13854040600910018 Google Scholar
S. Lloyd-Fox, A. Blasi and C. E. Elwell,
“Illuminating the developing brain: the past, present and future of functional near infrared spectroscopy,”
Neurosci. Biobehav. Rev., 34
(3), 269
–284
(2010). http://dx.doi.org/10.1016/j.neubiorev.2009.07.008 NBREDE 0149-7634 Google Scholar
H. Obrig,
“NIRS in clinical neurology—a ‘promising’ tool?,”
NeuroImage, 85
(Pt 1), 535
–546
(2014). http://dx.doi.org/10.1016/j.neuroimage.2013.03.045 NEIMEF 1053-8119 Google Scholar
B. S. Chang and D. H. Lowenstein,
“Epilepsy,”
N. Engl. J. Med., 349
(13), 1257
–1266
(2003). http://dx.doi.org/10.1056/NEJMra022308 NEJMAG 0028-4793 Google Scholar
J. Engel and T. A. Pedley, Epilepsy: A Comprehensive Textbook, Lippincott-Williams & Wilkins, Philadelphia, Pennsylvania
(2008). Google Scholar
R. S. Fisher et al.,
“Epileptic seizures and epilepsy: definitions proposed by the International League against Epilepsy (ILAE) and the International Bureau for Epilepsy (IBE),”
Epilepsia, 46
(4), 470
–472
(2005). http://dx.doi.org/10.1111/j.0013-9580.2005.66104.x EPILAK 0013-9580 Google Scholar
J. Gotman,
“A few thoughts on ‘what is a seizure?’,”
Epilepsy Behav., 22
(01), S2
–S3
(2011). http://dx.doi.org/10.1016/j.yebeh.2011.08.025 Google Scholar
P. D. Adelson et al.,
“Noninvasive continuous monitoring of cerebral oxygenation periictally using near-infrared spectroscopy: a preliminary report,”
Epilepsia, 40
(11), 1484
–1489
(1999). http://dx.doi.org/10.1111/j.1528-1157.1999.tb02030.x EPILAK 0013-9580 Google Scholar
K. Haginoya et al.,
“Ictal cerebral haemodynamics of childhood epilepsy measured with near-infrared spectrophotometry,”
Brain J. Neurol., 125
(9), 1960
–1971
(2002). http://dx.doi.org/10.1093/brain/awf213 Google Scholar
M. Munakata et al.,
“Dynamic cortical activity during spasms in three patients with West syndrome: a multichannel near-infrared spectroscopic topography study,”
Epilepsia, 45
(10), 1248
–1257
(2004). http://dx.doi.org/10.1111/j.0013-9580.2004.t01-1-04004.x EPILAK 0013-9580 Google Scholar
N. Roche-Labarbe et al.,
“NIRS-measured oxy- and deoxyhemoglobin changes associated with EEG spike-and-wave discharges in children,”
Epilepsia, 49
(11), 1871
–1880
(2008). http://dx.doi.org/10.1111/j.1528-1167.2008.01711.x EPILAK 0013-9580 Google Scholar
M. Seyal,
“Frontal hemodynamic changes precede EEG onset of temporal lobe seizures,”
Clin. Neurophysiol., 125
(3), 442
–448
(2014). http://dx.doi.org/10.1016/j.clinph.2013.09.003 CNEUFU 1388-2457 Google Scholar
H. Shuhaiber et al.,
“Cerebral regional oxygen fluctuations and decline during clinically silent focal electroencephalographic seizures in a neonate,”
J. Child Neurol., 19
(7), 539
–540
(2004). JOCNEE Google Scholar
E. Slone et al.,
“Near-infrared spectroscopy shows preictal haemodynamic changes in temporal lobe epilepsy,”
Epileptic. Disord., 14
(4), 371
–378
(2012). http://dx.doi.org/10.1684/epd.2012.0535 Google Scholar
D. K. Sokol et al.,
“Near infrared spectroscopy (NIRS) distinguishes seizure types,”
Seizure, 9
(5), 323
–327
(2000). http://dx.doi.org/10.1053/seiz.2000.0406 SEIZE7 1059-1311 Google Scholar
B. J. Steinhoff, G. Herrendorf and C. Kurth,
“Ictal near infrared spectroscopy in temporal lobe epilepsy: a pilot study,”
Seizure, 5
(2), 97
–101
(1996). SEIZE7 1059-1311 Google Scholar
A. Villringer et al.,
“Noninvasive assessment of cerebral hemodynamics and tissue oxygenation during activation of brain cell function in human adults using near infrared spectroscopy,”
Adv. Exp. Med. Biol., 345 559
–565
(1994). AEMBAP 0065-2598 Google Scholar
E. Watanabe et al.,
“Noninvasive cerebral blood volume measurement during seizures using multichannel near infrared spectroscopic topography,”
J. Biomed. Opt., 5
(3), 287
–290
(2000). http://dx.doi.org/10.1117/1.429998 JBOPFO 1083-3668 Google Scholar
M. A. Yücel et al.,
“Reducing motion artifacts for long-term clinical NIRS monitoring using collodion-fixed prism-based optical fibers,”
NeuroImage, 85
(1), 192
–201
(2014). http://dx.doi.org/10.1016/j.neuroimage.2013.06.054 NEIMEF 1053-8119 Google Scholar
E. Watanabe, Y. Nagahori and Y. Mayanagi,
“Focus diagnosis of epilepsy using near-infrared spectroscopy,”
Epilepsia, 43
(Suppl. 9), 50
–55
(2002). http://dx.doi.org/10.1046/j.1528-1157.43.s.9.12.x EPILAK 0013-9580 Google Scholar
K. Buchheim et al.,
“Decrease in haemoglobin oxygenation during absence seizures in adult humans,”
Neurosci. Lett., 354
(2), 119
–122
(2004). http://dx.doi.org/10.1016/j.neulet.2003.10.001 NELED5 0304-3940 Google Scholar
G. Arca Diaz et al.,
“Near infrared spectroscopy in the management of status epilepticus in a young infant,”
Eur. J. Paediatr. Neurol., 10
(1), 19
–21
(2006). http://dx.doi.org/10.1016/j.ejpn.2005.11.001 Google Scholar
R. J. Cooper et al.,
“Transient haemodynamic events in neurologically compromised infants: a simultaneous EEG and diffuse optical imaging study,”
NeuroImage, 55
(4), 1610
–1616
(2011). http://dx.doi.org/10.1016/j.neuroimage.2011.01.022 NEIMEF 1053-8119 Google Scholar
K. Haginoya et al.,
“The usefulness of subtraction ictal SPECT and ictal near-infrared spectroscopic topography in patients with West syndrome,”
Brain Dev., 35
(10), 887
–893
(2013). http://dx.doi.org/10.1016/j.braindev.2013.08.011 Google Scholar
F. Wallois et al.,
“Haemodynamic changes during seizure-like activity in a neonate: a simultaneous AC EEG-SPIR and high-resolution DC EEG recording,”
Neurophysiol. Clin., 39
(4–5), 217
–227
(2009). http://dx.doi.org/10.1016/j.neucli.2009.08.001 Google Scholar
J. Jeppesen et al.,
“Exploring the capability of wireless near infrared spectroscopy as a portable seizure detection device for epilepsy patients,”
Seizure, 26 43
–48
(2015). http://dx.doi.org/10.1016/j.seizure.2015.01.015 SEIZE7 1059-1311 Google Scholar
M. D. Sokoloff et al.,
“Phenobarbital and neonatal seizures affect cerebral oxygen metabolism: a near-infrared spectroscopy study,”
Pediatr. Res., 78
(1), 91
–96
(2015). http://dx.doi.org/10.1038/pr.2015.64 PEREBL 0031-3998 Google Scholar
E. E. Rizki et al.,
“Determination of epileptic focus side in mesial temporal lobe epilepsy using long-term noninvasive fNIRS/EEG monitoring for presurgical evaluation,”
Neurophotonics, 2
(2), 025003
(2015). http://dx.doi.org/10.1117/1.NPh.2.2.025003 Google Scholar
H. Singh et al.,
“Mapping cortical haemodynamics during neonatal seizures using diffuse optical tomography: a case study,”
Neuroimage Clin., 5 256
–265
(2014). http://dx.doi.org/10.1016/j.nicl.2014.06.012 Google Scholar
S. A. Vinette et al.,
“Artifact reduction in long-term monitoring of cerebral hemodynamics using near-infrared spectroscopy,”
Neurophotonics, 2
(2), 025004
(2015). http://dx.doi.org/10.1117/1.NPh.2.2.025004 Google Scholar
Y. Sato et al.,
“Ictal near-infrared spectroscopy and electrocorticography study of supplementary motor area seizures,”
J. Biomed. Opt., 18
(7), 076022
(2013). http://dx.doi.org/10.1117/1.JBO.18.7.076022 JBOPFO 1083-3668 Google Scholar
F. Wallois et al.,
“EEG-NIRS in epilepsy in children and neonates,”
Neurophysiol. Clin., 40
(5–6), 281
–292
(2010). http://dx.doi.org/10.1016/j.neucli.2010.08.004 Google Scholar
A. Machado et al.,
“Optimal optode montage on electroencephalography/functional near-infrared spectroscopy caps dedicated to study epileptic discharges,”
J. Biomed. Opt., 19
(2), 026010
(2014). http://dx.doi.org/10.1117/1.JBO.19.2.026010 JBOPFO 1083-3668 Google Scholar
D. K. Nguyen et al.,
“Non-invasive continuous EEG-fNIRS recording of temporal lobe seizures,”
Epilepsy Res., 99
(1–2), 112
–126
(2012). http://dx.doi.org/10.1016/j.eplepsyres.2011.10.035 EPIRE8 0920-1211 Google Scholar
D. K. Nguyen et al.,
“Noninvasive continuous functional near-infrared spectroscopy combined with electroencephalography recording of frontal lobe seizures,”
Epilepsia, 54
(2), 331
–340
(2013). http://dx.doi.org/10.1111/epi.12011 EPILAK 0013-9580 Google Scholar
P. Pouliot et al.,
“Hemodynamic changes during posterior epilepsies: an EEG-fNIRS study,”
Epilepsy Res., 108
(5), 883
–890
(2014). http://dx.doi.org/10.1016/j.eplepsyres.2014.03.007 EPIRE8 0920-1211 Google Scholar
P. Pouliot et al.,
“Nonlinear hemodynamic responses in human epilepsy: a multimodal analysis with fNIRS-EEG and fMRI-EEG,”
J. Neurosci. Methods, 204
(2), 326
–340
(2012). http://dx.doi.org/10.1016/j.jneumeth.2011.11.016 JNMEDT 0165-0270 Google Scholar
A. Machado et al.,
“Detection of hemodynamic responses to epileptic activity using simultaneous electro-encephalography (EEG)/near infra red spectroscopy (NIRS) acquisitions,”
NeuroImage, 56
(1), 114
–125
(2011). http://dx.doi.org/10.1016/j.neuroimage.2010.12.026 NEIMEF 1053-8119 Google Scholar
K. Peng et al.,
“fNIRS-EEG study of focal interictal epileptiform discharges,”
Epilepsy Res., 108
(3), 491
–505
(2014). http://dx.doi.org/10.1016/j.eplepsyres.2013.12.011 EPIRE8 0920-1211 Google Scholar
A. Kassab et al.,
“Functional near-infrared spectroscopy caps for brain activity monitoring: a review,”
Appl. Opt., 54
(3), 576
(2015). http://dx.doi.org/10.1364/AO.54.000576 APOPAI 0003-6935 Google Scholar
E. Lareau et al.,
“Multichannel wearable system dedicated for simultaneous electroencephalography/near-infrared spectroscopy real-time data acquisitions,”
J. Biomed. Opt., 16
(9), 096014
(2011). http://dx.doi.org/10.1117/1.3625575 JBOPFO 1083-3668 Google Scholar
M. Sawan et al.,
“Wireless recording systems: from noninvasive EEG-NIRS to invasive EEG devices,”
IEEE Trans. Biomed. Circuits Syst., 7
(2), 186
–195
(2013). http://dx.doi.org/10.1109/TBCAS.2013.2255595 Google Scholar
J. Safaie et al.,
“Toward a fully integrated wireless wearable EEG-NIRS bimodal acquisition system,”
J. Neural Eng., 10
(5), 056001
(2013). http://dx.doi.org/10.1088/1741-2560/10/5/056001 1741-2560 Google Scholar
K. Peng et al.,
“Using patient-specific hemodynamic response function in epileptic spike analysis of human epilepsy: a study based on EEG-fNIRS,”
NeuroImage, 126
(1), 239
–255
(2016). NEIMEF 1053-8119 Google Scholar
D. T. Delpy et al.,
“Estimation of optical pathlength through tissue from direct time of flight measurement,”
Phys. Med. Biol., 33
(12), 1433
–1442
(1988). http://dx.doi.org/10.1088/0031-9155/33/12/008 PHMBA7 0031-9155 Google Scholar
T. J. Huppert et al.,
“HomER: a review of time-series analysis methods for near-infrared spectroscopy of the brain,”
Appl. Opt., 48
(10), D280
–D298
(2009). http://dx.doi.org/10.1364/AO.48.00D280 APOPAI 0003-6935 Google Scholar
K. J. Friston et al., Statistical Parametric Mapping: The Analysis of Functional Brain Images, Academic Press, Waltham, Massachusetts
(2007). Google Scholar
K. J. Worsley and K. J. Friston,
“Analysis of fMRI time-series revisited—again,”
NeuroImage, 2
(3), 173
–181
(1995). http://dx.doi.org/10.1006/nimg.1995.1023 NEIMEF 1053-8119 Google Scholar
M. M. Plichta et al.,
“Model-based analysis of rapid event-related functional near-infrared spectroscopy (NIRS) data: a parametric validation study,”
NeuroImage, 35
(2), 625
–634
(2007). http://dx.doi.org/10.1016/j.neuroimage.2006.11.028 NEIMEF 1053-8119 Google Scholar
M. M. Monti,
“Statistical analysis of fMRI time-series: a critical review of the GLM approach,”
Front. Hum. Neurosci., 5 28
(2011). http://dx.doi.org/10.3389/fnhum.2011.00028 Google Scholar
K. J. Friston et al.,
“Event-related fMRI: characterizing differential responses,”
NeuroImage, 7
(1), 30
–40
(1998). http://dx.doi.org/10.1006/nimg.1997.0306 NEIMEF 1053-8119 Google Scholar
J. C. Ye et al.,
“NIRS-SPM: statistical parametric mapping for near-infrared spectroscopy,”
NeuroImage, 44
(2), 428
–447
(2009). http://dx.doi.org/10.1016/j.neuroimage.2008.08.036 NEIMEF 1053-8119 Google Scholar
K. E. Jang et al.,
“Wavelet minimum description length detrending for near-infrared spectroscopy,”
J. Biomed. Opt., 14
(3), 034004
(2009). http://dx.doi.org/10.1117/1.3127204 JBOPFO 1083-3668 Google Scholar
S. Tak and J. C. Ye,
“Statistical analysis of fNIRS data: a comprehensive review,”
NeuroImage, 85
(1), 72
–91
(2014). http://dx.doi.org/10.1016/j.neuroimage.2013.06.016 NEIMEF 1053-8119 Google Scholar
A. T. Berg et al.,
“Revised terminology and concepts for organization of seizures and epilepsies: report of the ILAE Commission on Classification and Terminology, 2005–2009,”
Epilepsia, 51
(4), 676
–685
(2010). http://dx.doi.org/10.1111/j.1528-1167.2010.02522.x EPILAK 0013-9580 Google Scholar
M. Suh et al.,
“Neurovascular coupling and oximetry during epileptic events,”
Mol. Neurobiol., 33
(3), 181
–197
(2006). http://dx.doi.org/10.1385/MN:33:3:181 MONBEW 0893-7648 Google Scholar
J. Gotman,
“Epileptic networks studied with EEG-fMRI,”
Epilepsia, 49
(Suppl. 3), 42
–51
(2008). http://dx.doi.org/10.1111/j.1528-1167.2008.01509.x EPILAK 0013-9580 Google Scholar
K. J. Staley and F. E. Dudek,
“Interictal spikes and epileptogenesis,”
Epilepsy Curr., 6
(6), 199
–202
(2006). http://dx.doi.org/10.1111/j.1535-7511.2006.00145.x Google Scholar
J. Cohen-Adad et al.,
“Activation detection in diffuse optical imaging by means of the general linear model,”
Med. Image Anal., 11
(6), 616
–629
(2007). http://dx.doi.org/10.1016/j.media.2007.06.002 Google Scholar
C. Matteau-Pelletier et al.,
“Noise in diffuse optical imaging and wavelet-based response estimation,”
IEEE Trans. Med. Imaging, 28
(3), 415
–422
(2009). http://dx.doi.org/10.1109/TMI.2008.2006524 ITMID4 0278-0062 Google Scholar
K. J. Friston et al.,
“Nonlinear responses in fMRI: the balloon model, Volterra kernels, and other hemodynamics,”
NeuroImage, 12
(4), 466
–477
(2000). http://dx.doi.org/10.1006/nimg.2000.0630 NEIMEF 1053-8119 Google Scholar
H. Li, S. Tak and J. C. Ye,
“Lipschitz–Killing curvature based expected Euler characteristics for p-value correction in fNIRS,”
J. Neurosci. Methods, 204
(1), 61
–67
(2012). http://dx.doi.org/10.1016/j.jneumeth.2011.10.016 JNMEDT 0165-0270 Google Scholar
J. Chumbley et al.,
“Topological FDR for neuroimaging,”
NeuroImage, 49
(4), 3057
–3064
(2010). http://dx.doi.org/10.1016/j.neuroimage.2009.10.090 NEIMEF 1053-8119 Google Scholar
J. Jacobs et al.,
“Hemodynamic responses to interictal epileptiform discharges in children with symptomatic epilepsy,”
Epilepsia, 48
(11), 2068
–2078
(2007). http://dx.doi.org/10.1111/j.1528-1167.2007.01192.x EPILAK 0013-9580 Google Scholar
Y. Lu et al.,
“Using voxel-specific hemodynamic response function in EEG-fMRI data analysis,”
NeuroImage, 32
(1), 238
–247
(2006). http://dx.doi.org/10.1016/j.neuroimage.2005.11.040 NEIMEF 1053-8119 Google Scholar
M. A. Lindquist et al.,
“Modeling the hemodynamic response function in fMRI: efficiency, bias and mis-modeling,”
NeuroImage, 45
(1), S187
–S198
(2009). http://dx.doi.org/10.1016/j.neuroimage.2008.10.065 NEIMEF 1053-8119 Google Scholar
S. F. Storti et al.,
“Modelling hemodynamic response function in epilepsy,”
Clin. Neurophysiol., 124
(11), 2108
–2118
(2013). http://dx.doi.org/10.1016/j.clinph.2013.05.024 CNEUFU 1388-2457 Google Scholar
S. Proulx et al.,
“Increased sensitivity of fast BOLD fMRI with a subject-specific hemodynamic response function and application to epilepsy,”
NeuroImage, 93
(1), 59
–73
(2014). http://dx.doi.org/10.1016/j.neuroimage.2014.02.018 NEIMEF 1053-8119 Google Scholar
J. Jacobs et al.,
“Variability of the hemodynamic response as a function of age and frequency of epileptic discharge in children with epilepsy,”
NeuroImage, 40
(2), 601
–614
(2008). http://dx.doi.org/10.1016/j.neuroimage.2007.11.056 NEIMEF 1053-8119 Google Scholar
L. Lemieux et al.,
“Noncanonical spike-related BOLD responses in focal epilepsy,”
Hum. Brain Mapp., 29
(3), 329
–345
(2008). http://dx.doi.org/10.1002/hbm.20389 HBRME7 1065-9471 Google Scholar
J. Virtanen et al.,
“Accelerometer-based method for correcting signal baseline changes caused by motion artifacts in medical near-infrared spectroscopy,”
J. Biomed. Opt., 16
(8), 087005
(2011). http://dx.doi.org/10.1117/1.3606576 JBOPFO 1083-3668 Google Scholar
F. Scholkmann et al.,
“How to detect and reduce movement artifacts in near-infrared imaging using moving standard deviation and spline interpolation,”
Physiol. Meas., 31
(5), 649
–662
(2010). http://dx.doi.org/10.1088/0967-3334/31/5/004 PMEAE3 0967-3334 Google Scholar
M. A. Yücel et al.,
“Targeted principle component analysis: a new motion artifact correction approach for near-infrared spectroscopy,”
J. Innov. Opt. Health Sci., 7
(2), 1350066
(2014). http://dx.doi.org/10.1142/S1793545813500661 Google Scholar
S. Brigadoi et al.,
“Motion artifacts in functional near-infrared spectroscopy: a comparison of motion correction techniques applied to real cognitive data,”
NeuroImage, 85
(1), 181
–191
(2014). http://dx.doi.org/10.1016/j.neuroimage.2013.04.082 NEIMEF 1053-8119 Google Scholar
T. J. Germon et al.,
“Cerebral near infrared spectroscopy: emitter-detector separation must be increased,”
Br. J. Anaesth., 82
(6), 831
–837
(1999). http://dx.doi.org/10.1093/bja/82.6.831 BJANAD 0007-0912 Google Scholar
G. E. Strangman, Z. Li and Q. Zhang,
“Depth sensitivity and source–detector separations for near infrared spectroscopy based on the colin27 brain template,”
PLoS One, 8
(8), e66319
(2013). http://dx.doi.org/10.1371/journal.pone.0066319 POLNCL 1932-6203 Google Scholar
S. Brigadoi and R. J. Cooper,
“How short is short? Optimum source–detector distance for short-separation channels in functional near-infrared spectroscopy,”
Neurophotonics, 2
(2), 025005
(2015). http://dx.doi.org/10.1117/1.NPh.2.2.025005 Google Scholar
Q. Zhang, G. E. Strangman and G. Ganis,
“Adaptive filtering to reduce global interference in non-invasive NIRS measures of brain activation: how well and when does it work?,”
NeuroImage, 45
(3), 788
–794
(2009). http://dx.doi.org/10.1016/j.neuroimage.2008.12.048 NEIMEF 1053-8119 Google Scholar
L. Gagnon et al.,
“Improved recovery of the hemodynamic response in diffuse optical imaging using short optode separations and state-space modeling,”
NeuroImage, 56
(3), 1362
–1371
(2011). http://dx.doi.org/10.1016/j.neuroimage.2011.03.001 NEIMEF 1053-8119 Google Scholar
L. Gagnon et al.,
“Further improvement in reducing superficial contamination in NIRS using double short separation measurements,”
NeuroImage, 85
(1), 127
–235
(2013). http://dx.doi.org/10.1016/j.neuroimage.2013.01.073 Google Scholar
W. V. Paesschen et al.,
“SPECT perfusion changes during complex partial seizures in patients with hippocampal sclerosis,”
Brain, 126
(5), 1103
–1111
(2003). http://dx.doi.org/10.1093/brain/awg108 BRAIAK 0006-8950 Google Scholar
F. Pittau, F. Dubeau and J. Gotman,
“Contribution of EEG/fMRI to the definition of the epileptic focus,”
Neurology, 78
(19), 1479
–1487
(2012). http://dx.doi.org/10.1212/WNL.0b013e3182553bf7 NEURAI 0028-3878 Google Scholar
J. Gotman et al.,
“Combining EEG and fMRI: a multimodal tool for epilepsy research,”
J. Magn. Reson. Imaging, 23
(6), 906
–920
(2006). http://dx.doi.org/10.1002/jmri.20577 Google Scholar
BiographyKe Peng is currently a PhD student in biomedical engineering at École Polytechnique de Montréal, Canada. He received his BSc degree in automation from Tsinghua University, China, in 2008, and his MScA degree in computer engineering from École Polytechnique de Montréal, Canada, in 2012. Philippe Pouliot holds a PhD in physics from Rutgers University. He was a researcher in theoretical particle physics at the University of California at Santa Barbara, University of Texas at Austin, and Imperial College, London, UK. He is now a researcher in biomedical engineering at École Polytechnique de Montréal. His current research interests include neuroscience, epilepsy, aging, atherosclerosis, biophysical models, multimodal imaging (fMRI, fNIRS, OCT, 2-photon microscopy), and developing mathematical and software tools for data analysis. Frédéric Lesage is a professor of electrical engineering at the École Polytechnique de Montréal and director of the Optical and Molecular Imaging Laboratory. He has pursued an interdisciplinary career in applied mathematics, physics, and imaging. His current research activities pertain to the development of novel imaging techniques for neuronal conditions, involving the analysis of optical signals impervious to physiological background noise, 3-D image reconstruction using multimodal instruments, time-domain optical parameter recovery, and multimodal imaging (fMRI-optical and EEG-optical). Dang Khoa Nguyen completed his residency in neurology and a PhD in neuroscience at the Université de Montréal as well as a fellowship in epilepsy at the Yale University. He currently practices at Notre-Dame Hospital where he is the director of the Epilepsy Monitoring Unit. One of his research interests is the development of NIRS-EEG to monitor seizures in various clinical settings, including epilepsy monitoring units, acute stroke units, and intensive care units. |


