
|
|
1.IntroductionNamed the “method of the year 2010” according to Nature magazine,1 optogenetics is revolutionizing neuroscience. For the first time, researchers are capable of producing direct links between cellular activity and behavior.2,3 Optogenetics also provided tools for unveiling the mechanisms behind the generation of basic phenomena like brain oscillations4 and blood oxygenation level-dependent signals in fMRI.5 However, later reassessment showed that some of the claims of early works may have been affected by limitations of either the opsins or the efficiency of light stimulation.6,7 Another issue largely overlooked in optogenetic experiments involving local field potential (LFP) recordings is the photovoltaic effect.2 First described by the French physicist Alexandre-Edmond Becquerel, the effect was noticed when metal electrodes in a slightly acidic solution were exposed to light, which resulted in the generation of electricity. The photovoltaic effect is produced by photonic excitation of electrons at the electrode valence band that absorbs the photon energy; these excited electrons leave their orbit, generating an electric potential.8,9 Virtually every metallic conductor is prone to the photovoltaic effect as the conduction property of a given material implies weak binding of electrons at outer orbits. As light propagates through the inhomogeneous media, it may interact with the electrode and molecule species in the vicinity of the electrode.10 For instance, free ions in the media can be attracted to the electrode due to its average electrostatic potential with respect to the media and produce a double charged layer on its surface.11 Also, molecular dipoles as fatty chains and/or fatty acids can become polarized by these electric fields storing charge.11 Moreover, some molecular species have an affinity to attach to the surface crystalline structure of some materials (carboxylic acids to platinum or to gold).12 It is, therefore, likely that light disturbs the organization of the free charges and dipoles in the vicinity of the electrode and the net effect charges the electrode while polarizing it. Electrode polarization also arises directly from the photovoltaic effect, which is dependent on the photon energy and on the work function to free an electron from the material.8 Light stimulation of brain tissue during LFP recordings produces the photovoltaic effect when photons reach the recording electrode. In this work, we also refer to the effect as an “optoelectric artifact” since it generates signals unrelated to brain activity. The photovoltaic effect can be minimized by placing the electrode at a distance from the light source and/or using low energy photons when possible (green light instead of blue). Decreasing light intensity to the point that the amplitude of the artifact falls below the background noise is another strategy. However, these solutions are not practical since several research questions require studying local versus distant circuits.13 Moreover, optogenetic proteins require a minimum light intensity to produce membrane depolarization/hyperpolarization.14 Here, we assess how the photovoltaic effect may influence LFP recordings using the same methodological approach used by many other laboratories. We analyzed how different light stimulation protocols alter the power spectrum density (PSD), spike detection, current source density (CSD), and cross-frequency coupling (CFC) of hippocampal LFP signals recorded from multichannel silicon probes in mice. We found that photovoltaic artifacts can emulate several features of genuine LFP activity including small phase shifts in different recording channels, broad PSD peaks, and coupling between low and high oscillation frequencies. 2.Methods2.1.SubjectsAdult (2- to 4-month old) B6 and 129P2-Pvalbtm1(Cre)Arbr/J15 (Jax stock 008069; PV-Cre), Gt(ROSA)26 Sortm14(CAG−tdTomato)Hze/J (, Jax Stock 007909), and C57/BL6 mice of either sex were used. Animals were kept in a 12-h light on/light off cycle (7 AM to 7 PM), and maintained at . All animal procedures were approved by the local Swedish ethical committee (C248/11, C157/11, Uppsala Animal Ethics Committee, Jordbruksverket; Protocol 003/12, CEUA, UFRN, Brazil). 2.2.Virus InjectionMice were anesthetized with 2% isoflurane. Animals were placed in a stereotaxic frame (Stoelting) and injected with the adeno-associated virus vector AAV2/9.EF1a.DIO.hChR2(H134R)-EYFP.WPRE.hGH (University of Pennsylvania Vector Core Facility) at a titer of . Vectors () were injected unilaterally at three consecutive depths in the hippocampus [action potential (AP): , ML: , and DV: ] for a total volume of . The flow rate was ; after each infusion, the needle was left in place for 1 min. The scalp incision was sutured and animals were housed in a P2 facility after the injections. Expression was confirmed by post hoc histological analysis of hippocampal sections. 2.3.In Vivo Electrophysiology and Signal ProcessingExtracellular recordings in anesthetized animals were collected under ketamine ( () or urethane () anesthesia. Acute silicon-substrate multichannel A1-16-electrode probes (16 recording sites spaced apart and distributed along a single shank, Neuronexus) were inserted in CA1 of the right ventral hippocampus16,17 using a stereotaxic frame (AP: , ML: , and DV: 3.6 mm). Through a second orifice, an optical fiber (Thorlabs, diameter, 0.39 numerical aperture) was inserted (AP: , ML: , and DV: 2.8 mm) in a 10 to 30 deg angle in relation to the recording probe. For CSD analysis,18 we have used a transverse silicon-substrate A16-1 multishank probe (one recording site per shank; intersite distance, Neuronexus). Unless otherwise noted, a sinusoid function (varying from 0 to maximum amplitude) at various frequencies drove a 473-nm laser using 1 to 5 mW power at the tip of the fiber (Shangai Dream Lasers analog modulated). The driving function was generated by a digital-to-analog converter (National Instruments) using a custom MATLAB® (Mathworks) program with the data acquisition toolbox or a custom C# software. The data acquisition system (Intan) and the software for function generation were integrated by a modification of the Intan program to allow communication of data and TTL pulses (indicating stimulation times) and simultaneous LFP recording. Recordings were conducted in 3-min sessions during which cells were stimulated for 30 s. 2.4.Data AnalysisPSDs from the 16 recording sites were averaged, producing a mean PSD for each animal, which counted as a single sample for the statistical analysis (sample size is equal to the number of animals). To allow merging of data from different animals, PSD values were normalized. (PSDs were divided by the total power between 0 and 14 Hz before light stimulation.) PSDs for each condition (pre, during and after light) were calculated for contiguous 30-s LFP segments. The CSD analysis shown in Fig. 2(e) was obtained by for adjacent sites in the A16-1 probe for theta-filtered (3 to 8 Hz) LFP signals during blue light stimulation. Phase-amplitude CFC was computed by means of the modulation index described in detail in Ref. 19. All signal filtering was done using the MATLAB® function eegfilt from the EEGLAB toolbox.20 For the comodulation maps, we bandpass filtered signals using 10-Hz windows and 5-Hz steps for the amplitude frequencies, and 2-Hz windows at 0.5-Hz steps for the phase frequencies. For computing the mean theta-gamma modulation index, we obtained a single modulation index for each animal by filtering the LFP recorded from a contact in stratum radiatum (SR) between 3 and 8 Hz for theta, and 30 and 80 Hz for gamma. For single unit separation, signals were bandpass filtered (500 to 5000 Hz) and APs automatically detected and clustered using the wave-clus software21 with standard settings.22 Isolated units were separated into regular spiking (RS) cells and interneurons (IN) based on mean firing frequency ( and ). The segregation of RS and IN was further shown by differences in AP waveforms: RS displayed a mean AP half width of and IN of (, , test; see Fig. 8 and Ref. 4). In addition, the ratio between the amplitude of the peak and the adjacent trough4 was equal to for RS and for IN. Theta firing phase preference for isolated units was calculated by bandpass filtering (3 to 8 Hz) the LFP from the middle channel of the probe. The instantaneous phase [] of the theta-filtered signal was calculated using the analytical representation of the signal based on the Hilbert’s transform (hilbert function in MATLAB®, Signal Processing Toolbox). Each spike time was associated with a phase value obtained from . The strength of theta-phase coupling (length of the mean resultant vector, ) was obtained with the function circ_r from the Circular Statistics Toolbox for MATLAB®.23 3.ResultsIn order to test whether the photovoltaic effect can produce LFP-like signals in typical optogenetic settings, we used silicon-substrate electrodes and an optical fiber to record LFP and deliver blue light in the intermediate/ventral hippocampal region. We placed 16-channel electrodes covering a large portion of CA1 SR with one or two channels perforating the stratum pyramidale (SP). An optical fiber ( diameter) angled 10 deg to 20 deg in relation to the electrode targeting CA1 stratum oriens (SO)/SR [Fig. 1(b)] was used to stimulate control (no viral injection) or PV+ mice virally transfected with an adeno-associated viral vector carrying ChR2-eYFP (PV-ChR2). Sinusoid and square pulses at various frequencies were used to modulate the laser. Laser sinusoid modulation was produced by a sinusoid with amplitudes varying between 0 and 5 V using a digital-to-analog converter [Fig. 1(a)]. Except in cell damage experiments, laser power was restricted to . Note the difference between the modulation voltage and the actual output of the laser [measured with a photodiode—Fig. 1(a)]. This and higher laser powers have been used in previous optogenetic studies.24–26 Recently, it was reported that 4 to 5 mW at the tip of the fiber corresponding to light power at the recording site efficiently drives theta activity in the hippocampus during glutamatergic neuron stimulation in the medial septum, while light power lower than did not affect baseline activity.26 Using the Kubelka Munk model, we have simulated the light spread from a -diameter fiber with a numerical aperture of 0.48 [Fig. 1(b)]. A single fiber conveys light to very small volumes of the hippocampus [Fig. 1(b)]. We also stained (post hoc) light stimulated tissue with ethidium homodimer, staining to assess whether the laser powers used in this study produced cellular damage. Repeated stimulation using light power produced no visible damage. However, when the laser power at the tip was greater than , we observed a vast number of dead/damaged cells [Fig. 1(c)]. Fig. 1Experimental setup and light parameters used. (a) Modulation protocol (red) and laser output (blue) measured with a photodiode. (b) Electrode and fiber position in the hippocampus and light spread in the tissue using Kubelka Munk model. (c) Fluorescence images (inverted) showing the effect of sinusoid light stimulation with peak power of (left) and (right) . Ethidium-staining indicates the loss of plasmatic membrane integrity. 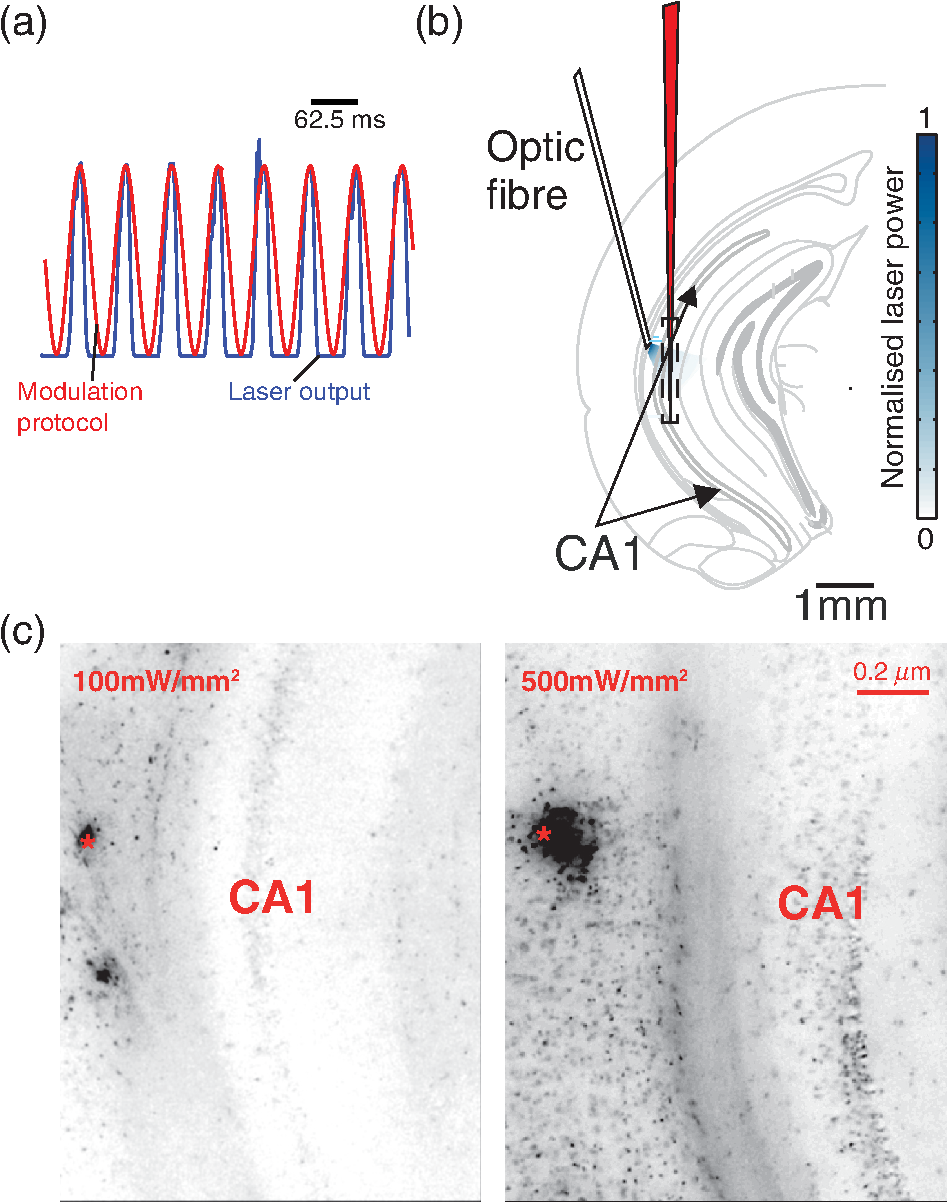 We next investigated how rhythmic light stimulation affected LFP recording electrodes placed in the hippocampus using animals without ChR2 expression. In this experiment, the purpose was to simulate a scenario where optogenetic stimulation could trigger theta oscillations. light stimulation generated large photovoltaic artifacts in the multichannel silicon probes (Fig. 2). Artifacts showed both the appearance and spectral features of genuine LFP [Figs. 2(a)–2(c)]. Sinusoidal stimulation at theta frequencies produced a peak at the PSD plot that resembled genuine theta oscillations. The peak was reflected in time-frequency power representations [Fig. 2(c)]. However, spectral peaks across different recording sites were uneven [Fig. 2(d)], implying that light illuminates the probe asymmetrically. This finding may aid to exclude spurious signals generated by the photovoltaic effect from genuine LFP. CSD analysis reflected an anisotropic photovoltaic effect across different recording sites. Figure 2(e) shows examples of CSD plots where current sources for light stimulation were coincidently observed at the SP of CA1 (identified by the presence of multiunit activity—see Fig. 3). Artifact LFP will show a strong dependency on the spatial relationship between electrode and light source while genuine LFP should be dependent on the postsynaptic spatial domains of stimulated cells.13 Fig. 2Light artifact shows appearance and spectral features of genuine LFP in control animals. (a) Representative trace from a channel showing signal 3 s before and 3 s during 4-Hz sinusoidal light stimulation. (b) and (c) Spectrogram and power spectrum for 4 Hz stimulation recording. The dashed eclipse highlights the artifact in 4 Hz and the arrows indicate harmonics (8 and 16 Hz). Both PSD and spectrogram refer to 30 s of data (10 s prestimulation, 10 s 4 Hz stimulation, and 10 s poststimulation). (d) Example of PSDs from different recording sites in response to 4 Hz stimulation. (e) CSD of recordings (4- and 8-Hz light stimulation) from a probe placed across different CA1 strata (SO, SP, SR, and SLM). The SP was identified by the presence of multiunit activity. 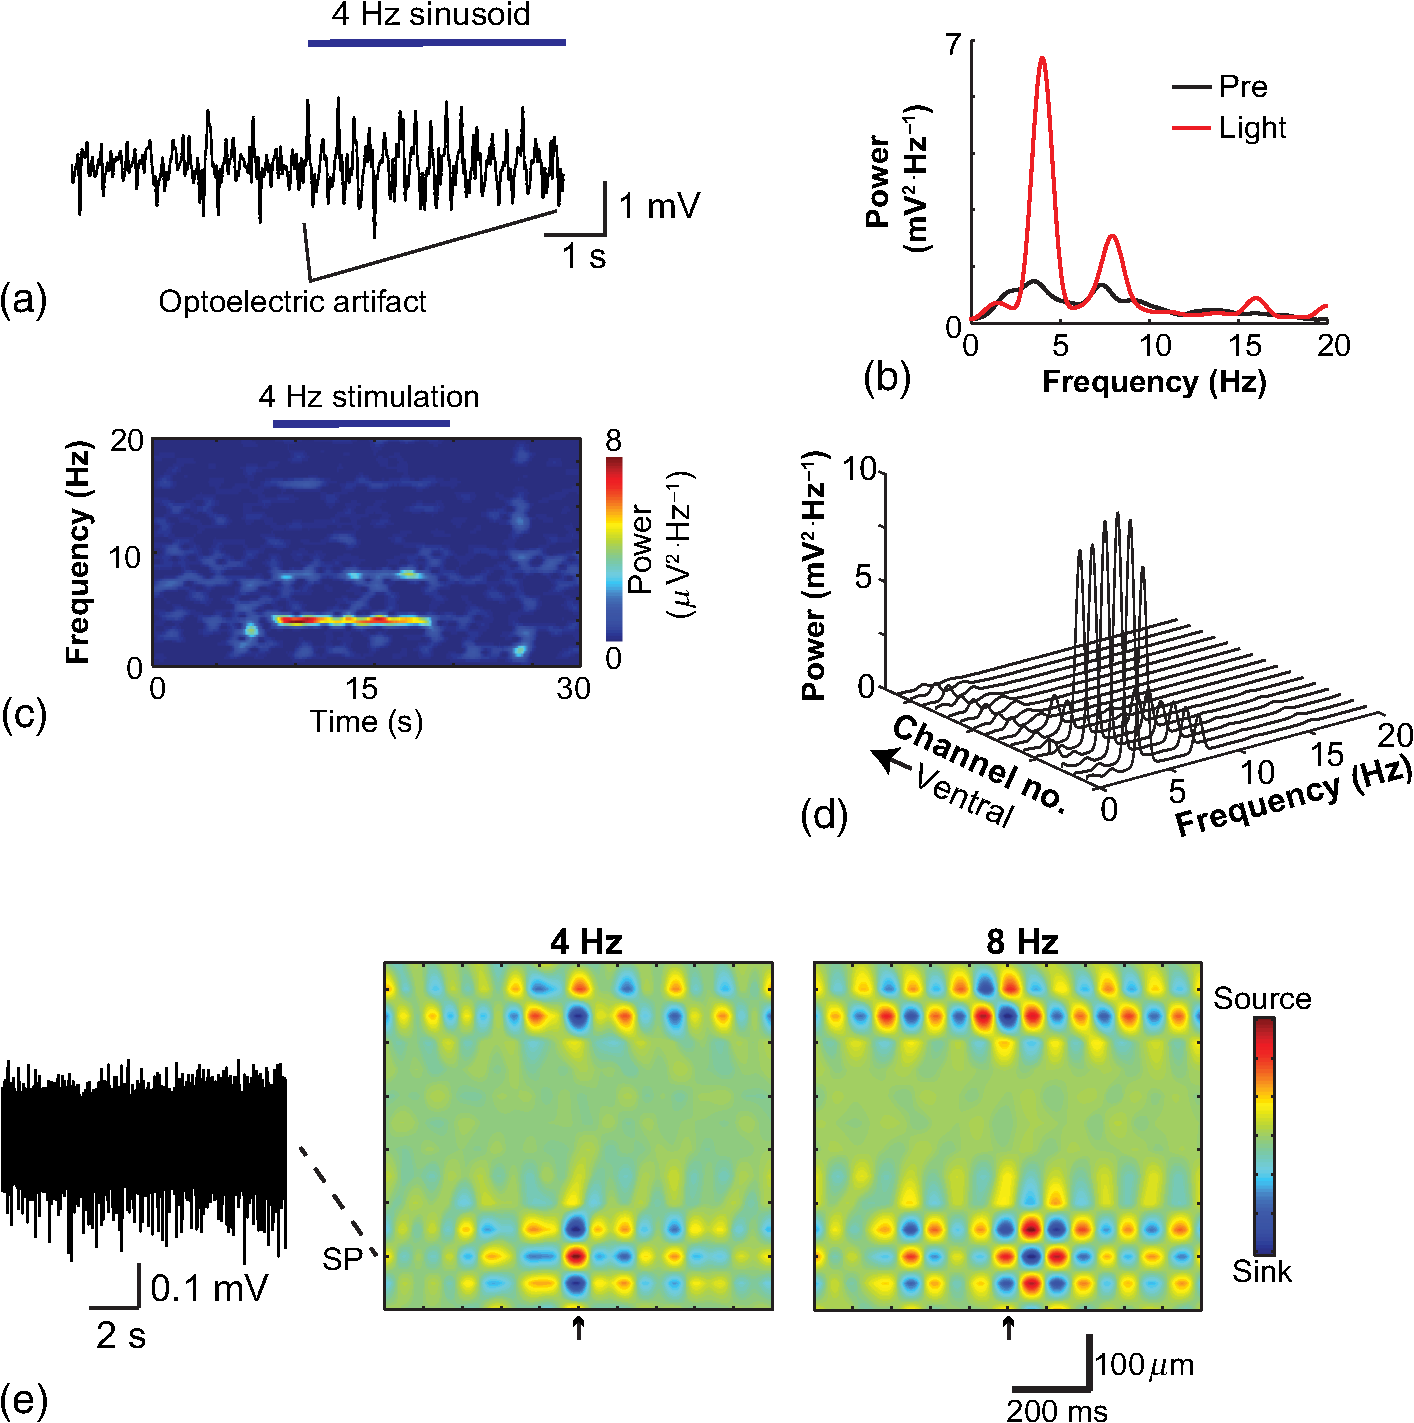 Fig. 3Square light pulses generate spurious spikes. (a) Power spectrum for 8 Hz sinusoidal (red) and square pulses light stimulation (black). Note the same artifact size for both protocols at the stimulation frequency and prominent peaks at harmonics frequencies for square pulses, but not for sinusoidal stimulation. (b) Raw extracellular recordings in vHipp CA1 illustrating the effect of square (20 ms) and sinusoid light stimulation. Note the presence of square light artifacts. (c) Black traces show bandpass filtered (500 to 5000 Hz) extracellular recording from the same probe site during square and sinusoid stimulation. Note that square (8 Hz, 20-ms duration), but not sinusoidal, light stimulation produced artifactual spike detection at deflection points. Inset shows spurious spike waveforms automatically detected by the clustering program used in this work. (d) Absolute artifact power for 8 Hz (sinusoidal and square pulses light stimulation) in dependence of light intensity. Note exponential increase in the artifact size with increasing light intensity. (e) 1-ms square pulse at showing dependency of the relative artifact power in relation to light frequency. 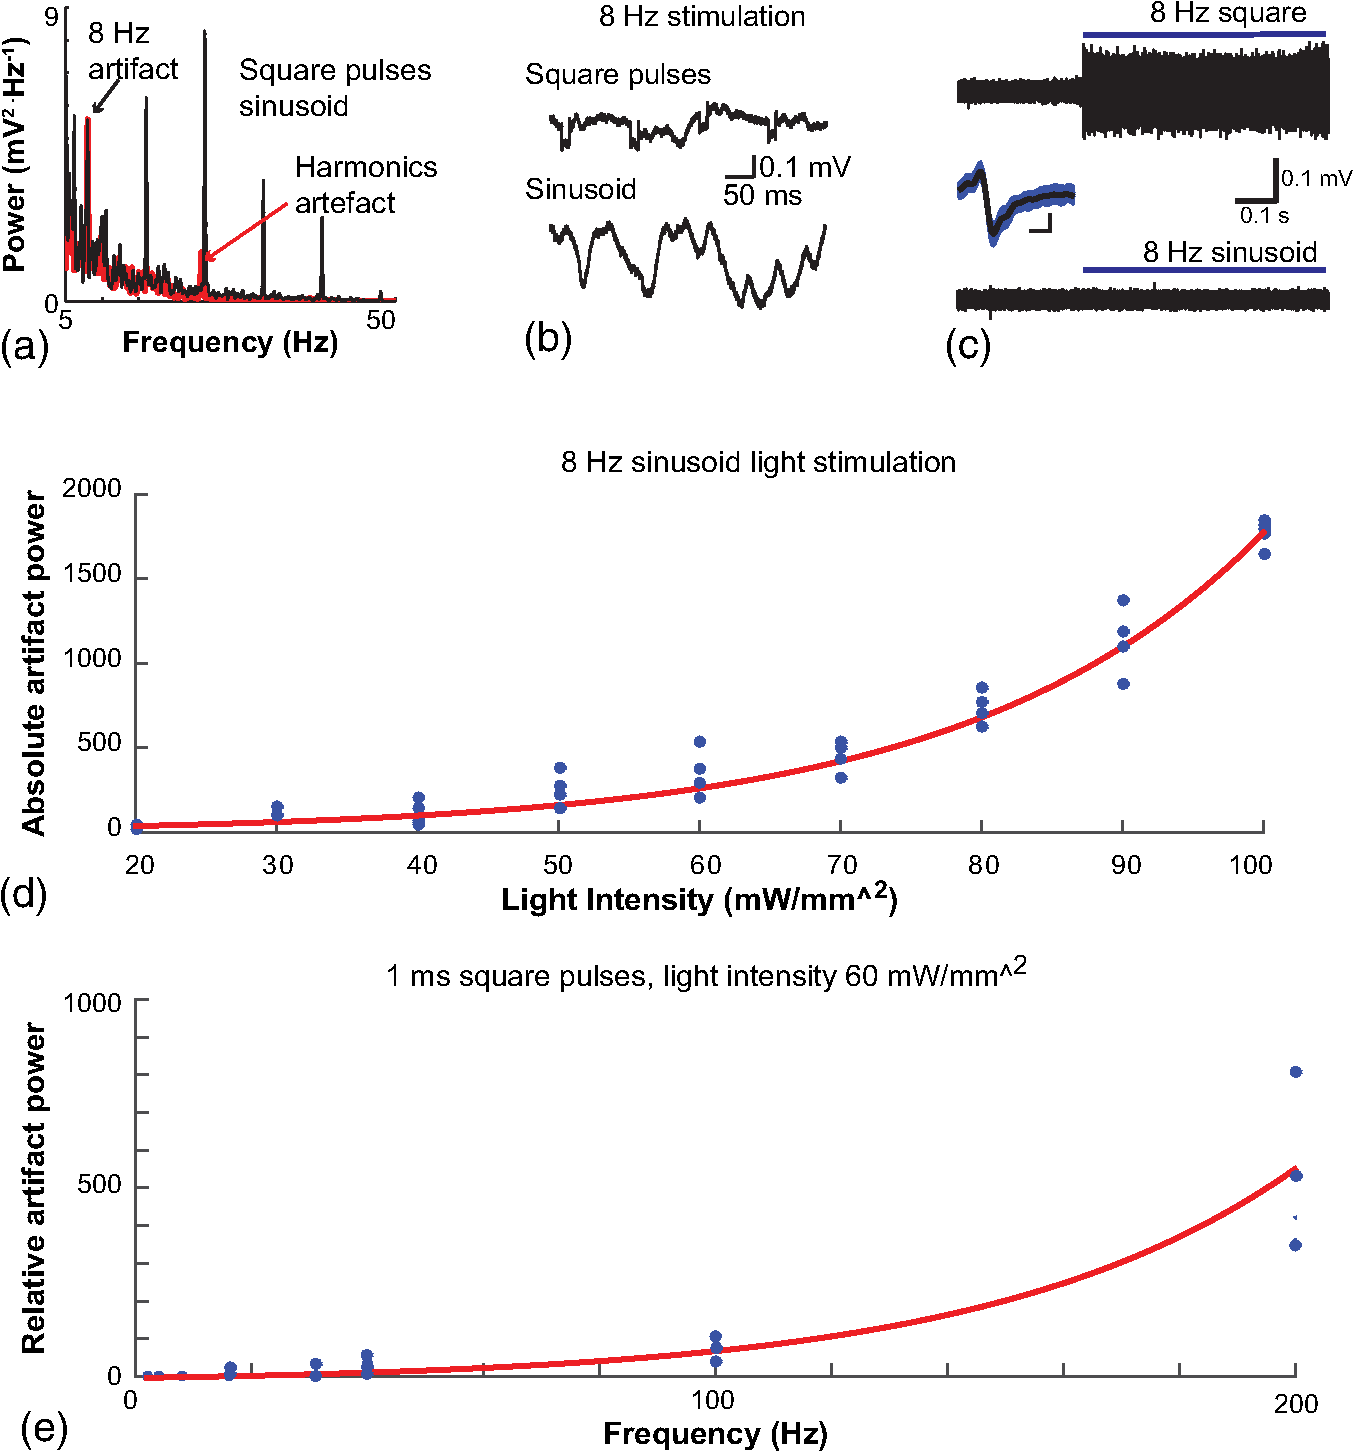 Previous optogenetics studies, which assessed the role of specific cell populations on the generation of particular oscillatory modalities, have applied light modulation by square pulses.4,27 Thus, we tested spectral differences between light stimulation using sinusoid or square light pulses. For 8 Hz stimulation, square pulses generated PSD peaks at the stimulation frequency similar to the sinusoid stimulation [Fig. 3(a)]. However, the former also produced several harmonic peaks (since square waves cannot be represented by a sum of sinusoids and produce harmonic peaks which amplitude decays in a geometric fashion). In addition, square pulses, but not sinusoid modulation of the stimulation laser, also produced artifact spikes if the LFP signal was bandpass filtered (0.3 to 3 kHz) for multiunit detection [; Fig. 3(c)]. These results confirm the observations recently discussed in Ref. 28 and suggest that sinusoidal light stimulation is preferable to minimize light-induced “spike” artifacts. We assessed the absolute artifact power dependence on light intensity [Fig. 3(d)]. The relationship between artifact power and laser intensity could be fitted by a function of the form (for 8 Hz to : , , ). We then optically stimulated the tissue with protocols previously used to optogenetically generate gamma oscillations: various frequencies of 1 ms square pulse stimulation at light intensity.4 With this pulse duration and laser power, we did not observe any artifact peaks in the power spectra for 2, 4, and 8 Hz stimulations, while for stimulation frequencies , the artifact size increased exponentially , , , ) [Fig. 3(d)]. Thus, we conclude that when the length of the square pulses was kept constant, the artifact power increased exponentially with increasing light frequency. We next assessed whether light stimulation with frequencies above the range of genuine LFP rhythms could affect the amplitude of the LFP at lower frequencies. We used three stimulation frequencies outside the theta activity range—16, 32, and 40 Hz (Fig. 4). We did not observe any significant change in the baseline frequency range () for 16 Hz [Figs. 4(a) and 4(b), , , repeated measures ANOVA], 32 Hz [Figs. 4(b) and 4(c), , , repeated measures ANOVA] and 40 Hz stimulation [Figs. 4(b) and 4(c), , , repeated measures ANOVA], while artifact peaks at stimulation frequencies were observed in all three cases [Fig. 4(b)]. These results indicate that light stimulation frequencies above the frequency of the oscillation of interest may be used to study the cellular mechanisms of rhythmogenesis. Fig. 4Higher light stimulation frequencies do not affect lower LFP frequencies in control animals. (a) Representative LFP recordings (bandpass filtered 13 to 19 Hz) before and during 16-Hz sinusoidal light stimulation (upper panel) and corresponding spectrogram (lower panel) (b) Averaged power spectra across all control animals for 16-, 32-, and 40-Hz light stimulation. (c) Boxplots showing mean theta power. Note no significant difference in theta band power before, during, and after light stimulation for all stimulation frequencies. 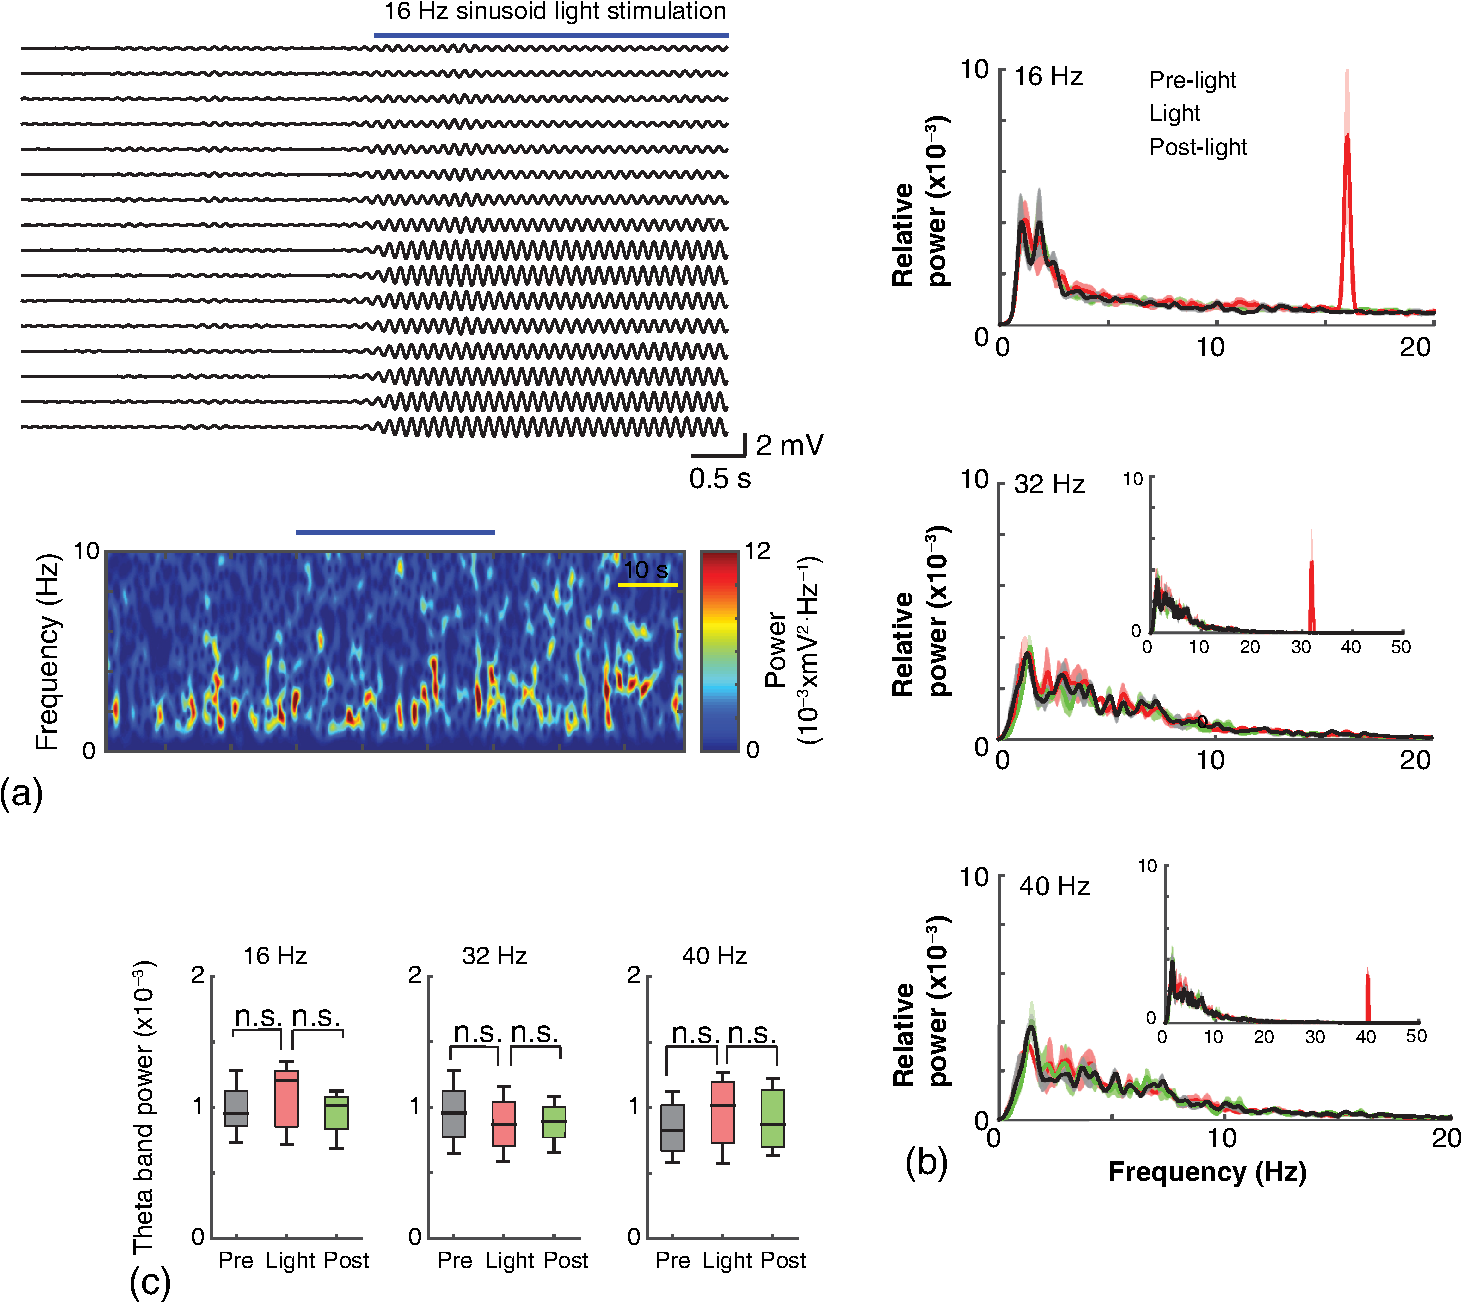 Spurious LFP generated by the photovoltaic effect should not modulate ongoing oscillations. Based on this, we studied CFC during light stimulation in control animals.29 We found that square pulses generated CFC plots with comodulation peaks at multiples (harmonics) of the stimulation frequency in all animals () while sinusoid stimulation produced a single evident peak at a single harmonic frequency [Fig. 5(a)]. We then compared genuine CFC to spurious CFC generated by the photovoltaic effect. For these experiments, we used animals anesthetized with urethane in order to record theta oscillations. In addition, due to the small amplitude of urethane-induced theta oscillations in the ventral hippocampus, these experiments were performed in the dorsal hippocampus (stereotaxic coordinates: 2-mm ML, 2-mm AP, and 2-mm DV, ). Theta oscillations (4 Hz) in urethane-anesthetized mice were induced by tail pinch [Fig. 5(b)]. These oscillations, however, did not modulate higher frequency oscillations [Fig. 5(c)]. Nevertheless, light stimulation at 4 Hz generated CFC plots with comodulation indices at harmonic frequencies of [, Fig. 5(c)]. These results suggest that CFC analysis may provide further evidence for excluding spurious light-driven LFP from genuine LFP. Fig. 5Light stimulation itself induces CFC. (a) Square pulses generate CFC plots with comodulation peaks at multiples (harmonics) of the stimulation frequency while sinusoid stimulation produces a single evident peak at a single harmonic frequency. (b) Representative spectrogram of tail pinch-induced theta oscillations (4 Hz) in urethane-anesthetized animals. (c) CFC plots of LFP during urethane-induced theta (left and right panels) and when light stimulation at theta frequency was superimposed to the LFP (middle panel). 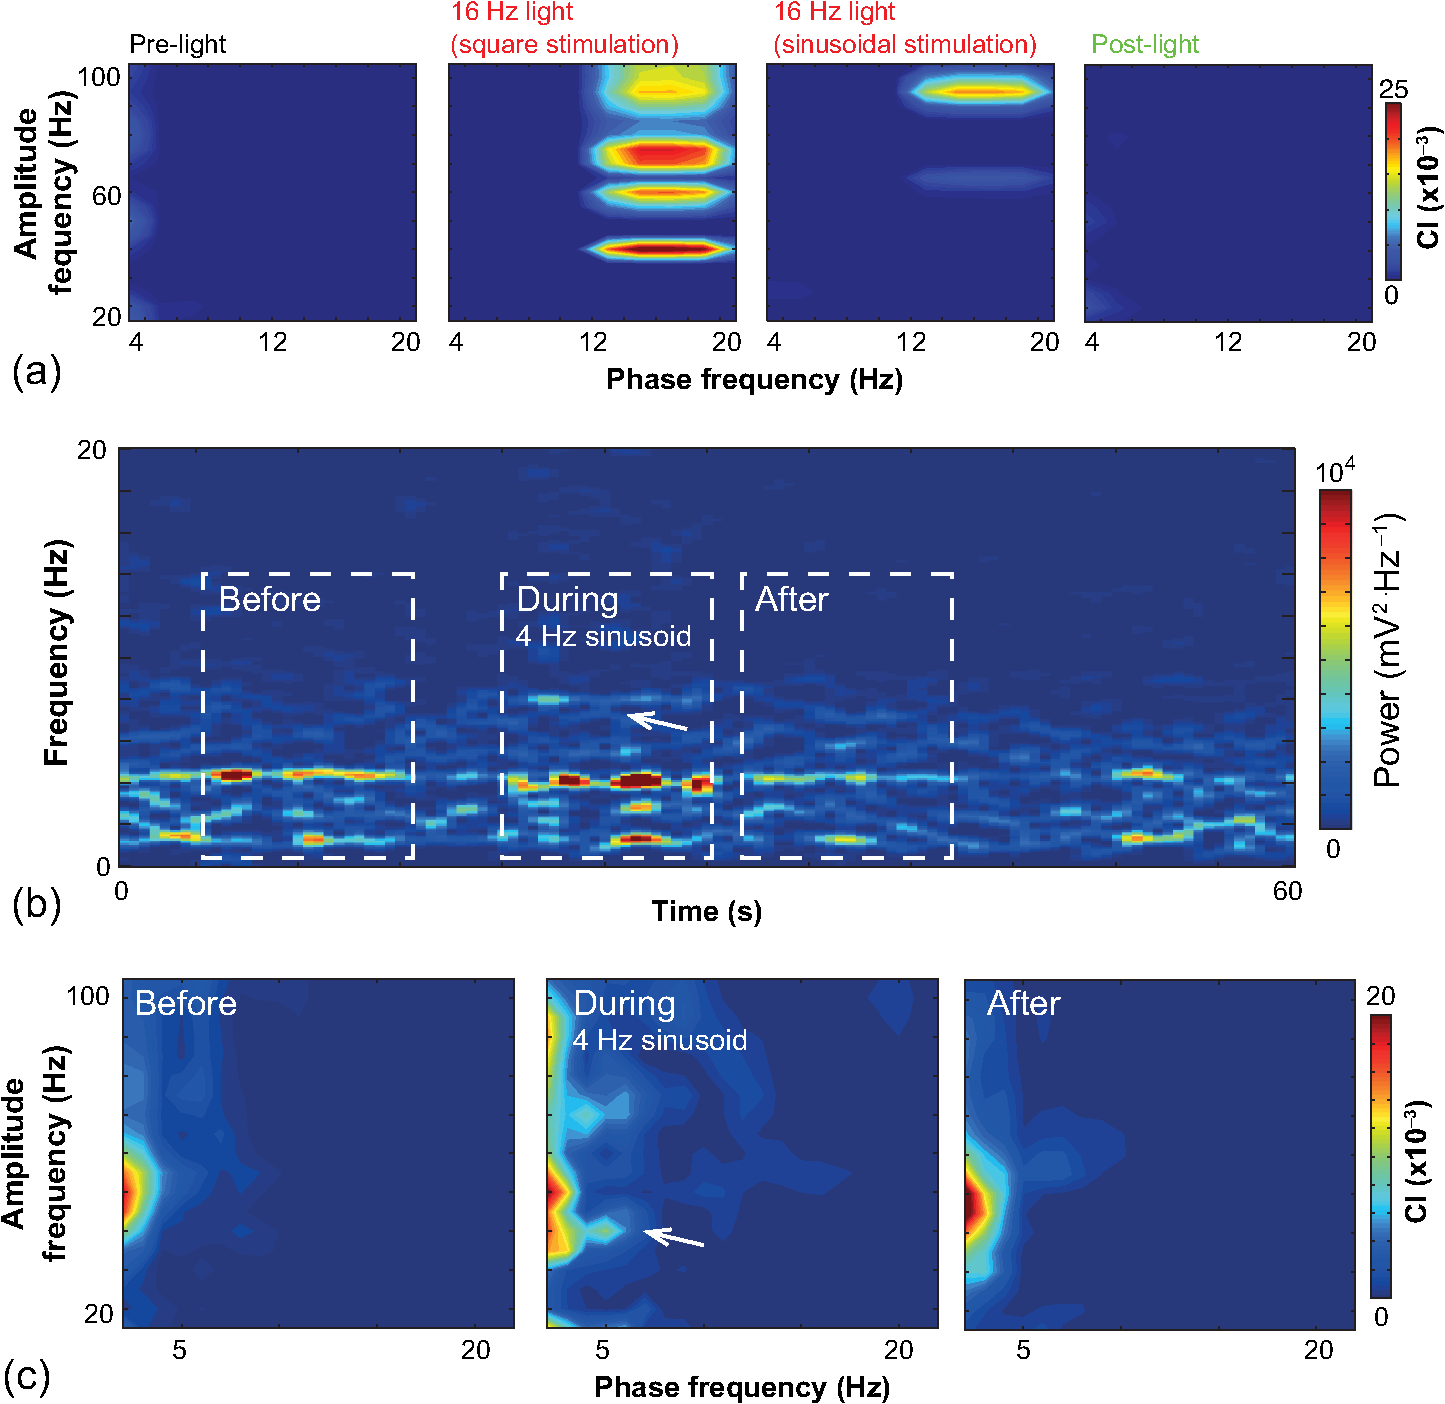 A previous study has shown that stimulation of PV+ IN can generate gamma oscillations in the neocortex and theta oscillations in the hippocampus.4,27 Hence, we then investigated how genuine optogenetically driven oscillations differ from spurious signals caused by the photovoltaic effect of light stimulation itself. We stimulated PV-Cre mice injected with ChR2-lx virus (PV/ChR2) in the hippocampus and applied sinusoidal light stimulation at 16, 32, and 40 Hz. Differently from control animals, 16-Hz light stimulation of hippocampal PV/ChR2 neurons significantly decreased theta activity power [Fig. 6(a), , , repeated measures ANOVA]. Similar results were observed for 32-Hz (, , repeated measures ANOVA) and 40-Hz (, , repeated measures ANOVA) light stimulation [Figs. 6(b) and 6(c)]. Square pulse stimulation also inhibited baseline activity and produced light artifacts similar to the ones observed in control animals [Figs. 7(a) and 7(b)]. Mean normalized theta power before light stimulation was equal to before, , , , , Friedman test. Despite the near absence of LFP during light stimulation, we still detected spurious CFC for both 16 Hz sinusoidal and square pulses stimulation in all traces [Fig. 7(c), ]. Extracellular spike recordings in PV/ChR2 mice revealed no change in IN spiking frequency [Figs. 8(a) and 8(b), mice, , paired test] but inhibited RS in putative pyramidal cells [Figs. 8(a) and 8(b), mice, , paired test]. Identified IN fired strongly phase locked to the 16-Hz light stimulation [Fig. 8(c), cells, mean , Rayleigh test]. These results suggest that activation of Cre+ cells from PV-Cre mice produce strong inhibition of baseline LFP with no apparent resonance in theta or low gamma oscillations. Fig. 6Driving PV+ neurons with 16-, 32-, and 40-Hz light stimulation decreases theta power. (a) (top) ChR2-YFP expression in vHipp CA1 of a PV-Cre mouse. Note the broad distribution of cell bodies in all hippocampal strata (arrows). (middle) Representative LFP recordings before and during photoactivation of PV/ChR2 cells. (bottom) Spectrogram (mean over all 16 channels). (b) Averaged power spectra across all PV/ChR2 animals. (c) Boxplots showing mean theta power. Note significant decrease in LFP power during all stimulation protocols. 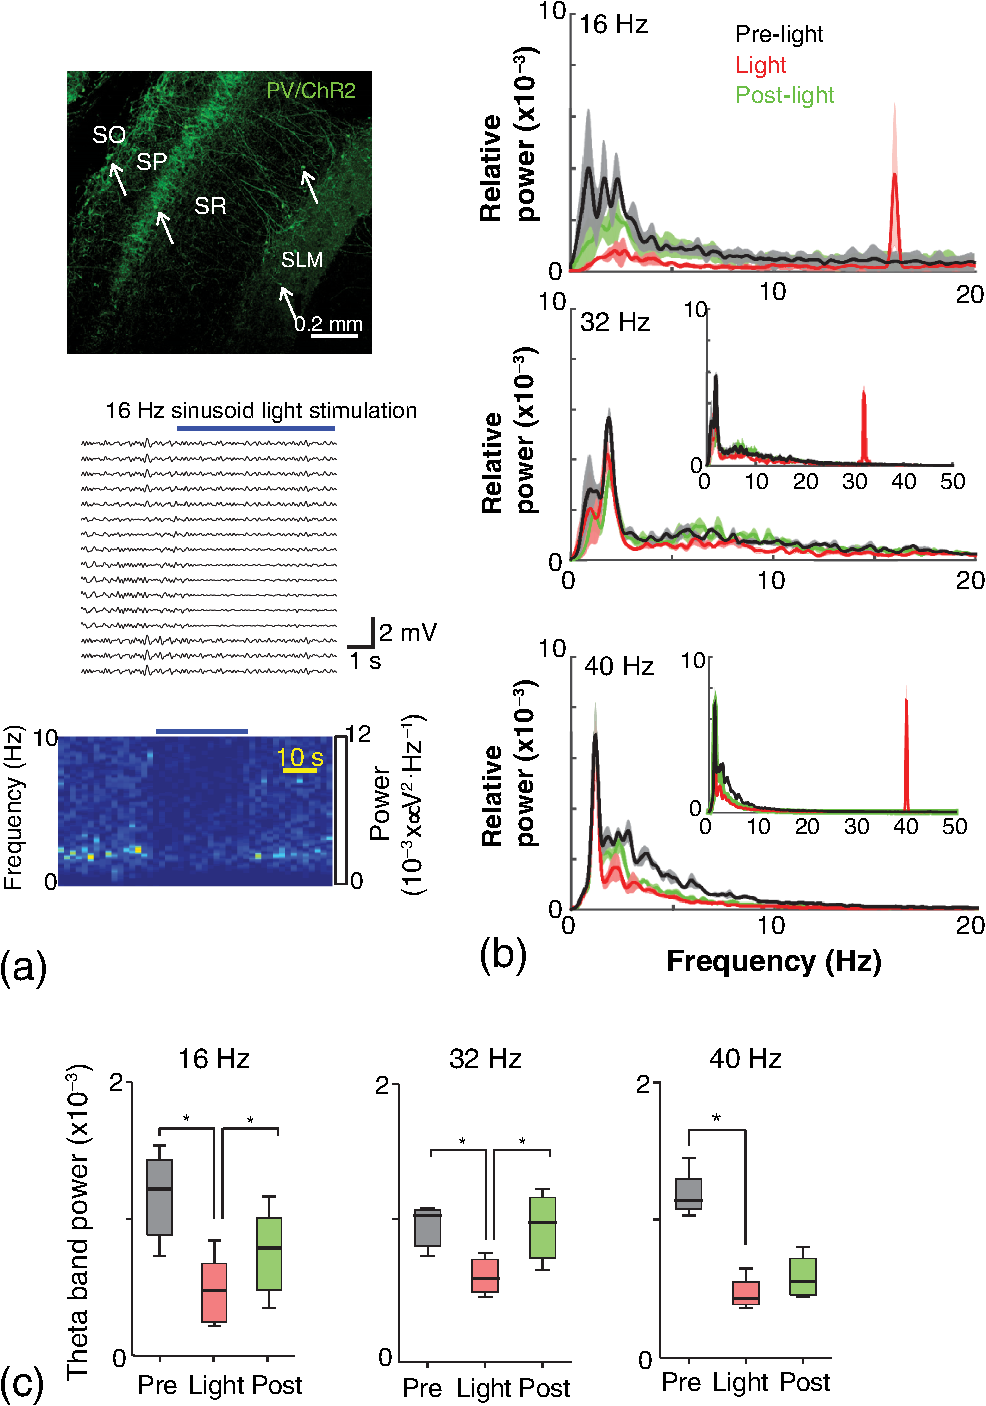 Fig. 7Light stimulation in PV/Chr2 animals disrupts LFP and induces spurious CFC. (a) Averaged power spectrum in PV/Chr2 animals showing LFP power before, during, and after 16-Hz square pulse (10 ms) stimulation protocol. Note strong decrease in LFP power during stimulation period. (b) Uneven artifact peak size across different recording sites. (c) Artifactual CFC was detected for both 16 Hz square pulses and sinusoidal light stimulation. 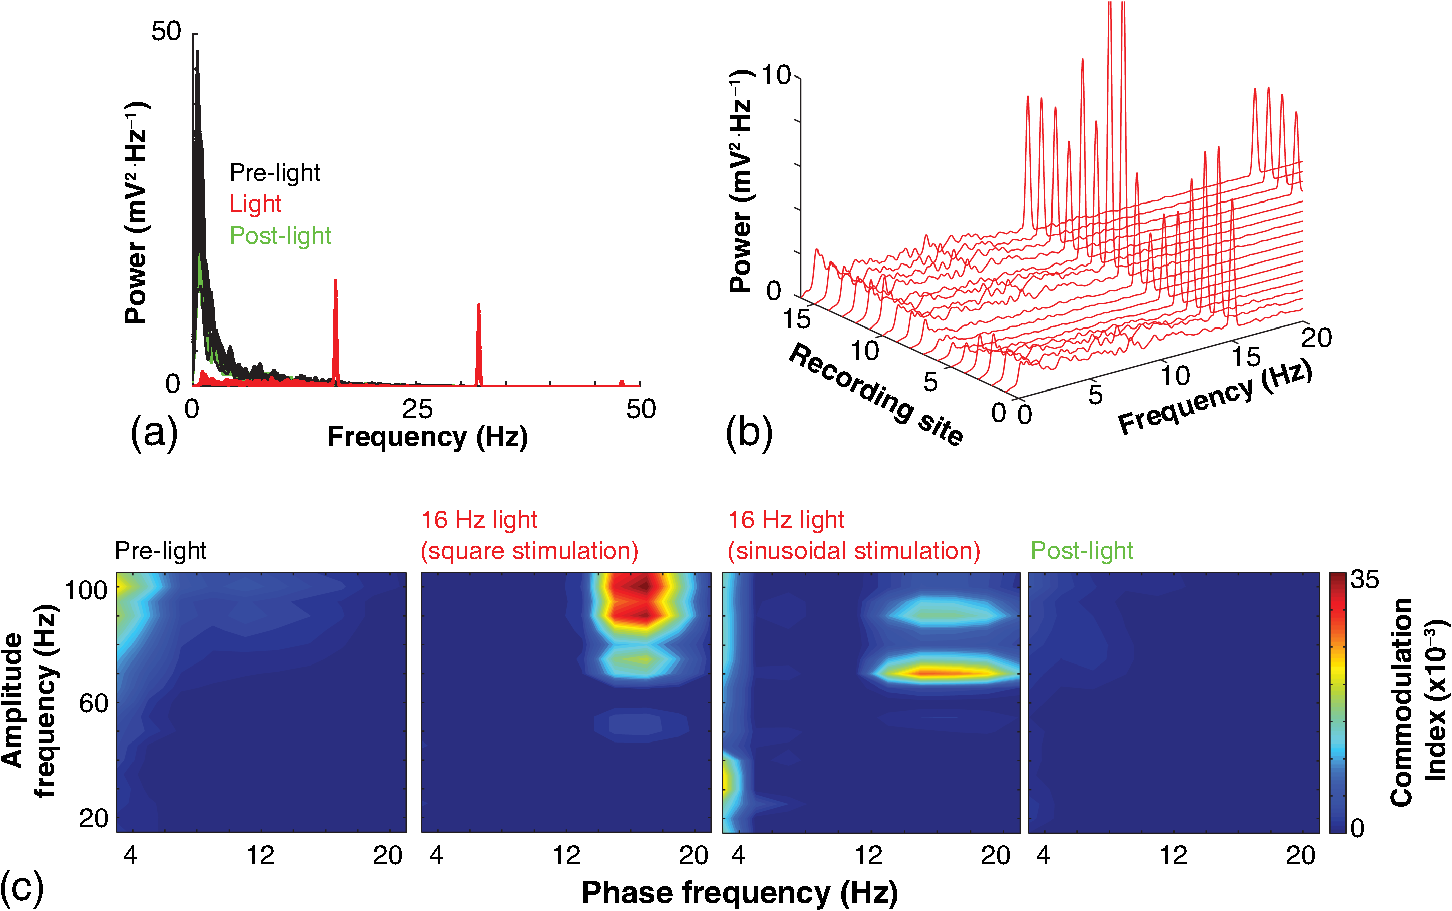 Fig. 8Light stimulation in PV/ChR2 mice inhibits the firing of RS but not IN firing. (a) Identified waveforms for RS and IN in PV/ChR2 mice. (b) A representative 500 to 5000 Hz bandpass filtered trace; green and blue arrows highlight RS and IN units firing, respectively [waveforms for these units are shown in (a)]. Note absence of RS firing during light stimulation. (c) Boxplots showing average spiking frequency of RS and IN before and during 16-Hz light stimulation of PV/ChR2 mice. Notice suppression of RS firing while no change in IN firing frequency was observed. (d) Identified INs display strong phase-coupling to the 16-Hz light stimulation. 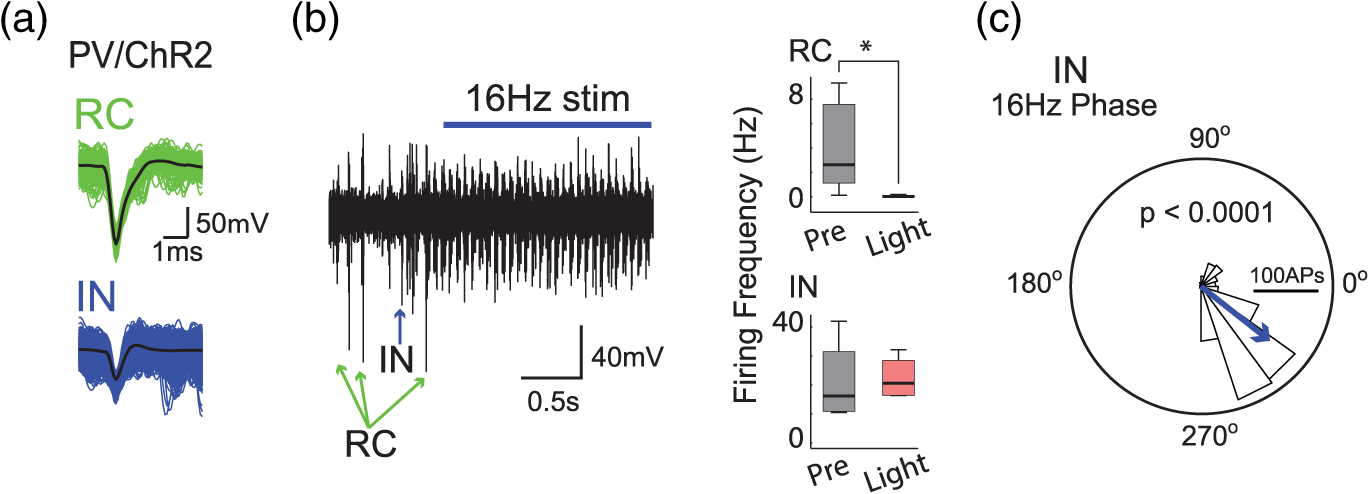 4.DiscussionHere, we have analyzed the interference of the photovoltaic effect on LFP recordings in commonly used silicon-substrate electrodes. We found that intermittent light stimulation can dramatically affect LFP even with relatively low laser power in animals without opsin expression. Waveforms generated by the direct effect of the light onto electrode sites can mimic genuine hippocampal oscillations in both the time and frequency domains. Light stimulation can also produce spike-like artifacts when signals are bandpass filtered for spike detection. CFC analysis of photoinduced artifacts revealed stereotyped modulation of high frequency components of the signal by the low frequency components. In addition, when expressing ChR2 specifically in parvalbumin+ neurons, we have failed to produce any genuine oscillatory pattern that could unequivocally be separated from the spurious rhythms produced by the direct effect of light. Instead, we observed a dramatic decrease in the total power of LFP recordings accompanied by strong inhibition of pyramidal cells during light stimulation. Silicon probes are powerful tools to obtain recordings from multiple brain regions with minimal damage. Their usage with optogenetics may help to understand the role of individual neuron groups in different behavioral tasks.30 However, there is little data regarding the direct effect of light onto these probes. We show that silicon probes are very sensitive for the detection of photovoltaic currents. It was proposed that fibers with a small diameter (e.g., ) and low light intensity could prevent the generation of photovoltaic currents in the recording sites.30–32 This approach can be used when illuminating a small number of cells in a nondeterministic manner. However, this would drastically restrict the strength of the technique as there are experiments where it is necessary to robustly stimulate large areas in deep brain regions.28 As shown in Fig. 1, there is a fine line between light-induced tissue damage and light delivery that is powerful enough to activate ChR2 or Arch in relatively large volumes. The relationship between light power and penetration in the brain is nonlinear and decays exponentially. Hence, relatively high light power is needed if cells distant from the fibers are to be stimulated. In addition, higher laser power is necessary for the stimulation of neuropil.33,34 Previous studies using optogenetics have demonstrated a pivotal role of PV+ neurons in the generation of gamma and theta oscillations.4,27 Hence, we tested whether light-induced brain oscillations could be separated from rhythmic photovoltaic currents. In a previous study, light stimulation at gamma frequencies generated oscillations at the stimulation frequency.4 The same was observed in the induction of theta oscillations in the isolated hippocampus.27 To our surprise, we could not separate genuine oscillations caused by rhythmical activation of PV+ neurons from spurious rhythms produced by the light stimulation alone. Instead, we observed a strong decrease in baseline LFP power. This decrease was possibly caused by the strong inhibition of pyramidal cells (that cease to fire when PV+ IN are stimulated). The role of the fast-spiking subclass of PV+ IN in gamma generation was first proposed from modeling studies.35 Several studies have attempted to isolate the role of fast spiking IN in gamma and other types of oscillations using the PV-Cre mouse.4,27,36,37 While fast-spiking IN express PV, there are several other types of neurons with often rival functions that also express PV.38 For example, in the hippocampus, PV expression can be found in IN that provide somatic inhibition, but also in dendritic inhibiting cells.38 In fact, Cre+ cells can be found in all hippocampal layers [Fig. 6(a)]. Thus, it seems difficult to isolate the role of fast spiking IN in rhythmogenesis in experiments using PV-Cre mice. In summary, we found that light stimulation can produce LFP-like signals that mimic several spectral features of genuine brain oscillations in silicon probes. The anisotropic spread of light generates uneven potentials across different recording sites that, in turn, give rise to nonzero current source densities. Variable current source densities may indeed serve as an indicative of spurious oscillatory activity induced by the light itself. For example, if light stimulation of perisomatic inhibiting IN expressing ChR2 gives rise to gamma oscillations, CSD analysis should always show sources at perisomatic regions regardless of small variations in fiber positioning. Some strategies have been proposed to prevent optoelectric artifacts in LFP recordings, including angling the fiber in relation to the electrode and using glass electrodes.39 However, angling the fiber will not prevent light from reaching recording sites due to scattering, while glass electrodes are not suitable for chronic and multisite recordings. To prevent light-induced artifacts, two recent studies40,41 have suggested using graphene-based electrodes. Another recent study42 proposed using indium-tin-oxide electrodes with transparent substrates. We have also been experimenting with transparent materials and our preliminary results indicate that these electrodes are indeed less susceptible to photovoltaic artifacts (data not shown). Until better strategies to circumvent light-induced artifacts are developed, our results suggest that caution should be taken in experiments involving optogenetic stimulation and LFP recording. AcknowledgmentsThis work was supported by the Kjell and Märta Beijers Foundation, the Swedish Research Council, the Swedish Foundation for International Cooperation in Research and Higher Education, the Brazilian Agency CAPES. References
“Method of the year 2010,”
Nat. Methods, 8
(1), 1
–1
(2011). http://dx.doi.org/10.1038/nmeth.f.321 1548-7091 Google Scholar
J. A. Cardin et al.,
“Targeted optogenetic stimulation and recording of neurons in vivo using cell-type-specific expression of channelrhodopsin-2,”
Nat. Protoc., 5
(2), 247
–254
(2010). http://dx.doi.org/10.1038/nprot.2009.228 1754-2189 Google Scholar
I. Gold and D. Stoljar,
“A neuron doctrine in the philosophy of neuroscience,”
Behav. Brain Sci., 22
(5), 809
–830
(1999). BBSCDH 0140-525X Google Scholar
J. A. Cardin et al.,
“Driving fast-spiking cells induces gamma rhythm and controls sensory responses,”
Nature, 459
(7247), 663
–667
(2009). http://dx.doi.org/10.1038/nature08002 Google Scholar
J. H. Lee et al.,
“Global and local fMRI signals driven by neurons defined optogenetically by type and wiring,”
Nature, 465
(7299), 788
–792
(2010). http://dx.doi.org/10.1038/nature09108 Google Scholar
R. Berry et al.,
“X-optogenetics and U-optogenetics: feasibility and possibilities,”
Photonics, 3
(1), 23
–39
(2015). http://dx.doi.org/10.3390/photonics2010023 Google Scholar
N. K. Logothetis,
“Bold claims for optogenetics,”
Nature, 468
(7323), E3E4
(2010). http://dx.doi.org/10.1038/nature09532 Google Scholar
C. Brabec, Organic Photovoltaics: Concepts and Realization, Springer-Verlag, Berlin Heidelberg
(2003). Google Scholar
R. Williams,
“Becquerel photovoltaic effect in binary compounds,”
J. Chem. Phys., 32
(5), 1505
–1514
(1960). http://dx.doi.org/10.1063/1.1730950 JCPSA6 0021-9606 Google Scholar
S. I. Al-Juboori et al.,
“Light scattering properties vary across different regions of the adult mouse brain,”
PLoS ONE, 8
(7), e67626
(2013). http://dx.doi.org/10.1371/journal.pone.0067626 POLNCL 1932-6203 Google Scholar
W. M. Grill,
“Signal considerations for chronically implanted electrodes for brain interfacing,”
Indwelling Neural Implants: Strategies for Contending with the In Vivo Environment, 42
–58 CRC Press/Taylor & Francis, Boca Raton, Florida
(2008). Google Scholar
G. Crisponi et al.,
“Spectrophotometric and potentiometric study on platinum(II) chelates of mercapto carboxylic acids,”
Polyhedron, 19
(24–25), 2435
–2440
(2000). http://dx.doi.org/10.1016/S0277-5387(00)00542-8 PLYHDE 0277-5387 Google Scholar
Y. Kajikawa and C. E. Schroeder,
“How local is the local field potential?,”
Neuron, 72
(5), 847
–858
(2011). http://dx.doi.org/10.1016/j.neuron.2011.09.029 NERNET 0896-6273 Google Scholar
J. Y. Lin,
“Optogenetic excitation of neurons with channelrhodopsins: light instrumentation, expression systems, and channelrhodopsin variants,”
Prog. Brain Res., 196 29
–47
(2012). http://dx.doi.org/10.1016/B978-0-444-59426-6.00002-1 PBRRA4 0079-6123 Google Scholar
S. Hippenmeyer et al.,
“A developmental switch in the response of DRG neurons to ETS transcription factor signaling,”
PLoS Biol., 3
(5), e159
(2005). http://dx.doi.org/10.1371/journal.pbio.0030159 Google Scholar
T. Christensen et al.,
“Transcriptome differentiation along the dorso-ventral axis in laser-captured microdissected rat hippocampal granular cell layer,”
Neuroscience, 170
(3), 731
–741
(2010). http://dx.doi.org/10.1016/j.neuroscience.2010.07.016 Google Scholar
M. S. Fanselow and H.-W. Dong,
“Are the dorsal and ventral hippocampus functionally distinct structures?,”
Neuron, 65
(1), 7
–19
(2010). http://dx.doi.org/10.1016/j.neuron.2009.11.031 NERNET 0896-6273 Google Scholar
J. Brankack, M. Stewart and S. E. Ox,
“Current source density analysis of the hippocampal theta rhythm: associated sustained potentials and candidate synaptic generators,”
Brain Res., 615
(2), 310
–327
(1993). Google Scholar
A. B. L. Tort et al.,
“Measuring phase-amplitude coupling between neuronal oscillations of different frequencies,”
J. Neurophysiol., 104
(2), 1195
–1210
(2010). http://dx.doi.org/10.1152/jn.00106.2010 JONEA4 0022-3077 Google Scholar
R. Q. Quiroga, Z. Nadasdy and Y. Ben-Shaul,
“Unsupervised spike detection and sorting with wavelets and superparamagnetic clustering,”
Neural Comput., 16
(8), 1661
–1687
(2004). http://dx.doi.org/10.1162/089976604774201631 NEUCEB 0899-7667 Google Scholar
P. Berens,
“CircStat: a MATLAB toolbox for circular statistics,”
J. Stat. Software, 31 1
–21
(2009). Google Scholar
D. J. Calu et al.,
“Optogenetic inhibition of dorsal medial prefrontal cortex attenuates stress-induced reinstatement of palatable food seeking in female rats,”
J. Neurosci., 33
(1), 214
–226
(2013). http://dx.doi.org/10.1523/JNEUROSCI.2016-12.2013 JNRSDS 0270-6474 Google Scholar
I. Diester et al.,
“An optogenetic toolbox designed for primates,”
Nat. Neurosci., 14
(3), 387
–397
(2011). http://dx.doi.org/10.1038/nn.2749 NANEFN 1097-6256 Google Scholar
F. Fuhrmann et al.,
“Locomotion, theta oscillations, and the speed-correlated firing of hippocampal neurons are controlled by a medial septal glutamatergic circuit,”
Neuron, 86
(5), 1253
–1264
(2015). http://dx.doi.org/10.1016/j.neuron.2015.05.001 NERNET 0896-6273 Google Scholar
B. Amilhon et al.,
“Parvalbumin interneurons of hippocampus tune population activity at theta frequency,”
Neuron, 86
(5), 1277
–1289
(2015). http://dx.doi.org/10.1016/j.neuron.2015.05.027 NERNET 0896-6273 Google Scholar
L. Roux et al.,
“In vivo optogenetic identification and manipulation of GABAergic interneuron subtypes,”
Curr. Opin. Neurobiol., 26 88
–95
(2014). http://dx.doi.org/10.1016/j.conb.2013.12.013 COPUEN 0959-4388 Google Scholar
A. B. L. Tort et al.,
“Dynamic cross-frequency couplings of local field potential oscillations in rat striatum and hippocampus during performance of a T-maze task,”
Proc. Natl. Acad. Sci. U. S. A., 105
(51), 20517
–20522
(2008). http://dx.doi.org/10.1073/pnas.0810524105 Google Scholar
G. Buzsáki et al.,
“Tools for probing local circuits: high-density silicon probes combined with optogenetics,”
Neuron, 86
(1), 92
–105
(2015). http://dx.doi.org/10.1016/j.neuron.2015.01.028 NERNET 0896-6273 Google Scholar
E. Stark et al.,
“Inhibition-induced theta resonance in cortical circuits,”
Neuron, 80
(5), 1263
–1276
(2013). http://dx.doi.org/10.1016/j.neuron.2013.09.033 NERNET 0896-6273 Google Scholar
E. Stark et al.,
“Pyramidal cell–interneuron interactions underlie hippocampal ripple oscillations,”
Neuron, 83
(2), 467
–480
(2014). http://dx.doi.org/10.1016/j.neuron.2014.06.023 NERNET 0896-6273 Google Scholar
R. L. Arlow, T. J. Foutz and C. C. McIntyre,
“Theoretical principles underlying optical stimulation of myelinated axons expressing channelrhodopsin-2,”
Neuroscience, 248 541
–551
(2013). http://dx.doi.org/10.1016/j.neuroscience.2013.06.031 Google Scholar
C. Towne et al.,
“Optogenetic control of targeted peripheral axons in freely moving animals,”
PLoS One, 8
(8), e72691
(2013). http://dx.doi.org/10.1371/journal.pone.0072691 POLNCL 1932-6203 Google Scholar
X. J. Wang and G. Buzsáki,
“Gamma oscillation by synaptic inhibition in a hippocampal interneuronal network model,”
J. Neurosci. Off. J. Soc. Neurosci., 16
(20), 6402
–6413
(1996). Google Scholar
M. Carlén et al.,
“A critical role for NMDA receptors in parvalbumin interneurons for gamma rhythm induction and behavior,”
Mol. Psychiatry, 17
(5), 537
–548
(2012). http://dx.doi.org/10.1038/mp.2011.31 Google Scholar
V. S. Sohal et al.,
“Parvalbumin neurons and gamma rhythms enhance cortical circuit performance,”
Nature, 459
(7247), 698
–702
(2009). http://dx.doi.org/10.1038/nature07991 Google Scholar
T. Klausberger et al.,
“Complementary roles of cholecystokinin- and parvalbumin-expressing GABAergic neurons in hippocampal network oscillations,”
J. Neurosci., 25
(42), 9782
–9793
(2005). http://dx.doi.org/10.1523/JNEUROSCI.3269-05.2005 JNRSDS 0270-6474 Google Scholar
J. A. Cardin et al.,
“Targeted optogenetic stimulation and recording of neurons in vivo using cell-type-specific expression of channelrhodopsin-2,”
Nat. Protoc., 5
(2), 247
–254
(2010). http://dx.doi.org/10.1038/nprot.2009.228 1754-2189 Google Scholar
D. Kuzum et al.,
“Transparent and flexible low noise graphene electrodes for simultaneous electrophysiology and neuroimaging,”
Nat. Commun., 5 5259
(2014). http://dx.doi.org/10.1038/ncomms6259 NCAOBW 2041-1723 Google Scholar
D.-W. Park et al.,
“Graphene-based carbon-layered electrode array technology for neural imaging and optogenetic applications,”
Nat. Commun., 5 5258
(2014). http://dx.doi.org/10.1038/ncomms6258 NCAOBW 2041-1723 Google Scholar
P. Ledochowitsch et al.,
“Strategies for optical control and simultaneous electrical readout of extended cortical circuits,”
J. Neurosci. Methods,
(2015). http://dx.doi.org/10.1016/j.jneumeth.2015.07.028 JNMEDT 0165-0270 Google Scholar
BiographySanja Mikulovic recieved her Master’s degree in computational and mathematical biology from Technical University of Vienna, Austria. She is currentely in the final year of her PhD studies in neuroscience in the Neurodynamics Lab, Uppsala University, Sweden. Stefano Pupe has a Bachelor’s and a Master’s degree in psychology from the Federal University of Rio Grande do Sul, and a PhD in Neuroscience from the Federal University of Rio Grande do Norte, in Brazil. He is currently a postdoc at the Medical University of Vienna. Helton Maia Peixoto received his MD in 2010 and PhD in 2015 in electrical and computational engineering from Federal University of Rio Grande do Norte (UFRN). He is currently a Laboratory Technician at the Neurodynamics Lab (Brain Institute, UFRN, Brazil). George C. Do Nascimento received his doctoral degree in chemistry from the Federal University of Pernambuco (Brazil) in 2003. He is currently a postdoctoral fellow at the Neuroscience Department of Uppsala University in Sweden and an associate professor of Biomedical Engineering at UFRN, Brazil. Klas Kullander, PhD in 1997, postdoc at EMBL between 1998–2001, contracted by the Swedish Research Council and Royal Swedish Academy of Sciences as scientist until 2012. Now full professor at Uppsala University with the major focus to unravel the basis for neuronal network function using genetically modified mice. He maintains an interest in neuronal circuits amenable to genetic and functional investigations, including circuits in the spinal cord, hippocampus and cortex. He has published 74 original articles, reviews and book chapters. Adriano B. L. Tort received his MD in 2002 from UFRGS, southern Brazil. In 2005, he graduated from the same university with a BS in physics, an MS in mathematics, and a PhD in neuroscience. He worked as a research associate at the Center for BioDynamics at Boston University from 2006 to 2009. He is currently an associate professor of Neuroscience at the Brain Institute at UFRN, northeastern Brazil, where he leads the Computational Neurophysiology Lab. |


