
|
|
1.IntroductionRecent advances in optical stimulation methodology have generated increased interest in advanced light projection systems that will allow realizing the full potential of the field. In particular, optogenetics and other modes of photostimulation face a major challenge when delivering light to neural populations requiring single cell resolution control, brain-wide neural populations requiring control of individual regions, and access to deep brain structures where distal optical control is not possible due to scattering and absorption. Light delivery to deep structures using fibers or waveguides is accomplished in systems integrating light delivery with a microelectrode or multielectrode arrays enabling recording from nearby brain structures concurrently with photostimulation.1–6 To further enable patterned activation of neuronal populations, systems based on optoelectronic arrays for multisite activation were also introduced.7–10 Multisite stimulation and high spatial resolution control through optoelectronic fiber bundles were also recently introduced, enabling control over multiple sites at the output of the fibers at various depths of the probe,11 or scanning the stimulation field.12 More recently, Zorzos and colleagues13 presented an implantable three-dimensional (3-D) waveguide array capable of delivering light pattern to sets of neural targets in brain tissue. This system relies on coupling a pattern generated using a digital micromirror device (DMD) to a 3-D waveguide array using a fiber bundle. The main strength of this approach is that it enables the illumination of a number of regions with high spatiotemporal resolution simultaneously; it requires, however, a high-intensity light source resulting in low energy efficiency due to the DMD projection method, which blocks the light to regions where stimulation is not required. An alternative projection method that inherently allows the generation of flexible patterns with high energy efficiency is computer-generated holography (CGH).14,15 In CGH, the desired pattern is generated by calculating a phase modulation image,16 which is then projected on a spatial light modulator (SLM) illuminated by a coherent light source, with only minimal power losses occurring during phase modulation. In the generated holograms, power is diffractively divided over the pattern’s illuminated area, and the method is, therefore, capable of achieving high energy efficiency, as has been effectively demonstrated in various two- and three-dimensional neurophotonic projection applications.15,17–19 Here, we present a versatile, fiber bundle based holographic projection system for efficient high spatiotemporal control of neural circuits (which we term Holobundle). In our system, a transmissive SLM-generated hologram is coupled to a fiber bundle input plane for multisite pattern delivery. In a recent report, Szabo and colleagues20 presented a CGH-fiber bundle solution for all-optical single-cell resolution control of activity and combined with single-cell resolution imaging of the neuronal responses, potentially enabling bidirectional all-optogenetic control. This system was tested in freely behaving mice expressing ChR2-tdTomato and the calcium indicator GCaMP5G for visualization of neural responses, and successful imaging and control of brain activity was demonstrated, albeit in a relatively restricted area (a diameter of ). While our overall strategy is similar to Szabo et al.,20 we focus on the design of a wide-area, nonimaging system that can potentially activate distributed networks (e.g., multiple distal brain regions) and can be based on an unconstrained incoherent fiber bundle (a random fiber mapping between its two sides). In Sec. 2, we describe the system design and calibration procedure. In Sec. 3, we describe the experimental methods used to test the system. In Sec. 4, we report the results of the experiments, focusing on the performance characteristics of the Holobundle, illustrating its ability to combine high spatiotemporal resolution with energy efficient pattern generation. The physiological experimental results in cortical cell cultures demonstrate the system’s ability to control activity of cells expressing ChR2. Finally, in Sec. 5, we discuss the advantages, prospects, and limitations of the system. 2.Holographic Fiber Bundle Projection System2.1.Optical Design and CharacteristicsThe simplified schematic of a fiber bundle based holographic projection system is illustrated in Fig. 1(a), and the projection and calibration system’s components are presented in detail in Fig. 1(b). The output of a diode-pumped solid-state laser (473 nm) is passed through a half-wave plate (rotated to match the SLM preferred polarization), expanded through a beam expander, and illuminates a transmissive SLM (LC 2002, Holoeye Inc., San Diego, California) as a collimated beam. The SLM, located in the Fourier plane of an imaging lens (the SLM plane), dynamically generates the desired pattern in its image plane (the reconstruction plane) by modulating the beam wavefront’s phase component (0 to range, , pitch, 60 Hz refresh rate). A second post-SLM telescope (L1 and L2 lenses), which is used to determine the spatial resolution, and the Fourier transforming objective lens (CFI Plan Fluor , Nikon, Japan) create the desired pattern, which is then projected onto the input surface of the fiber bundle to illuminate the desired fibers [input and output patterns; Fig. 1(a)]. We used an incoherent fiber bundle [Schott AG, Elmsford, New York; 282 individual fibers with core diameter and a numerical aperture (NA) of 0.64 at 584 nm]. Fig. 1Holobundle design overview. (a) Illustration of the fiber bundle based holographic projection system concept. (b) Schematic diagram of the system’s components: laser source; , half-wave plate; BE, beam expander (Keplerian telescope); SLM, spatial light modulator; L1 and L2, lenses (comprising a beam reducer); B, square slit for zero-order blocking; OBJ, objective lens; fiber bundle, to which the pattern is coupled. The diagram also includes optional components added for the calibration processes (BS, L3, CCD camera surrounded with a dashed line). (c) Image of a pattern generated at the fiber bundle’s input (left panel) shows the zero-order and twin image contaminations inherently accompanying computer generated holograms. (d) The bundle (diameter ) was matched to one quadrant (right panel) as a practical solution implemented for mitigating this effect. 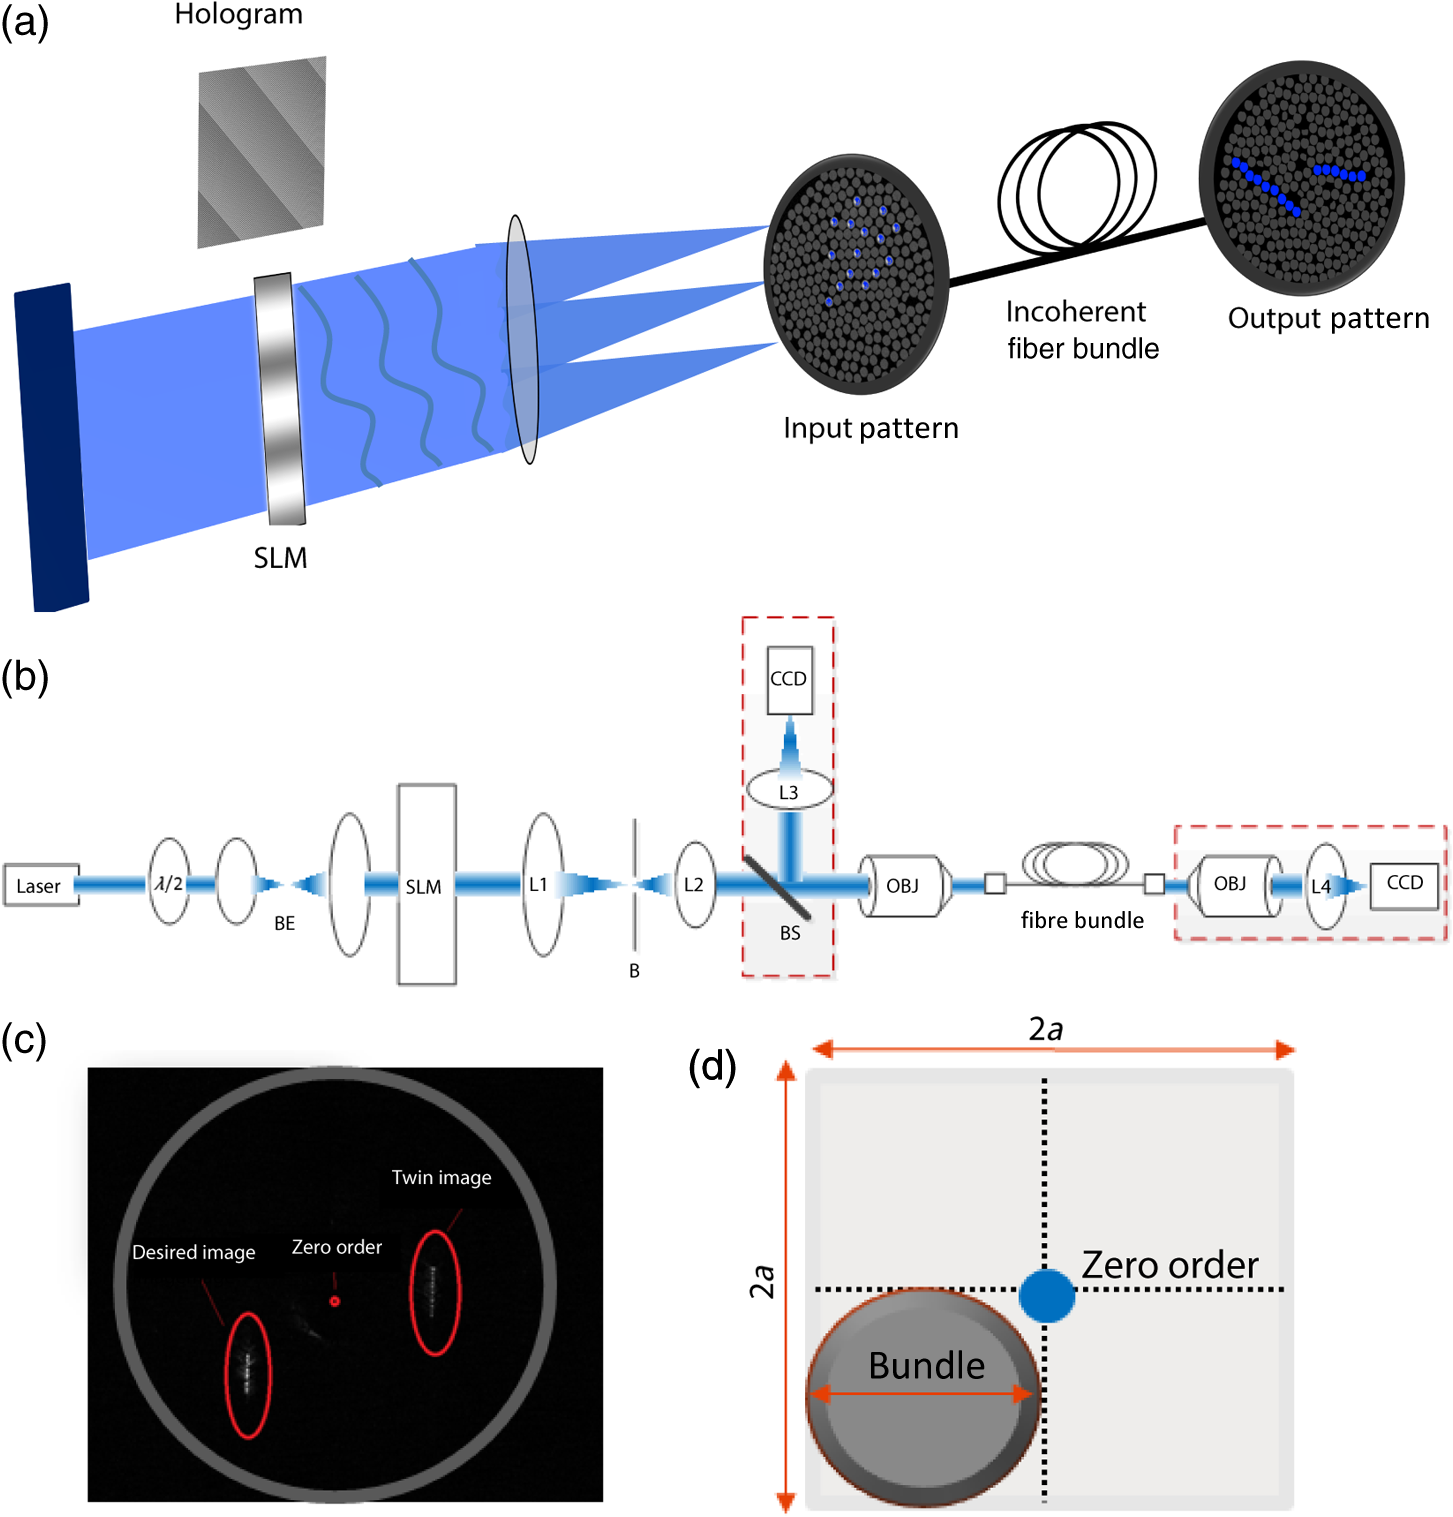 In designing an SLM-based projection system, two limitations must be taken into consideration [Fig. 1(c)]. First, the imperfect diffraction efficiency of the SLM causes a considerable portion of light to pass without any modulation, consequently generating a high-intensity light spot at the center of the hologram (termed zero-order of diffraction), resulting in a major source of power loss and undesired light emission. Second, the conjugate complex reconstruction of a digital hologram, which has the same intensity as the desired pattern, results in unwanted illumination (a twin image of the desired pattern). In light of these two limitations, we designed our optical system such that the generated field of view (FOV) is four times greater than the fiber bundle diameter size () as illustrated in Fig. 1(d); such a design discards the zero-order and twin image artifacts. The FOV of the system () is generally constrained by the maximal SLM shift ,15 where is the SLM pixel pitch, is the objective focal length, is the wavelength, and is the magnification of the telescope (L1 and L2). The theoretically attained spatial resolution is determined by the Airy disk’s diameter and depends on the objective’s NA, in our setup, and was empirically measured to have a full width at half maximum (FWHM) of [larger probably due to the underfilling of the objective’s input aperture, Fig. 2(a)]. Fig. 2Projection system characteristics. (a) Acquired image of respective single-point patterns generated at the bundle’s input (left) and output (right) surfaces, the corresponding spatial characteristics of the input spot (bottom left), and three-dimensional projection of the output spot as it propagates in a tissue phantom (bottom right). (b) Segmented fiber bundle images with the target patterns marked in red (left panels) versus images of the actual patterns obtained (right). (c) The bundle’s measured output power intensity as a function of the number of illuminated fibers (red points) and its best fit to (solid blue line). (d) Measured contrast ratios of generated output patterns as a function of the number of lit fibers (red points) and best fit to a function (solid blue line). Scale bars: . 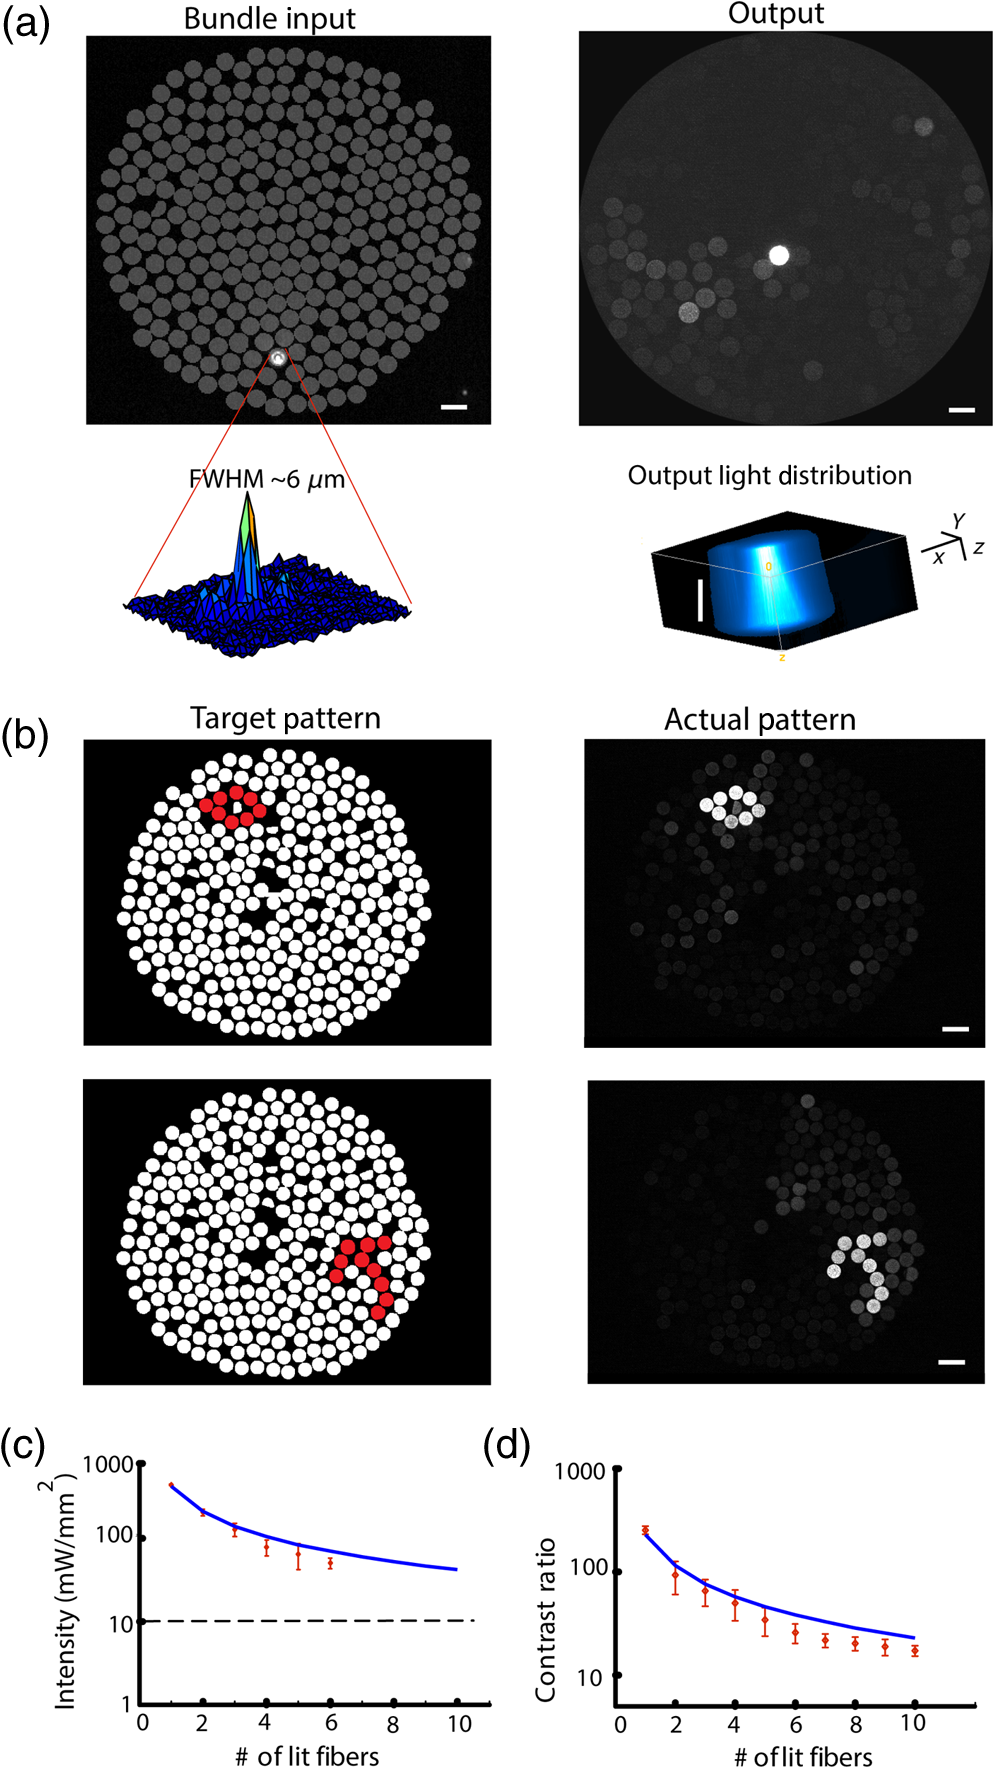 2.2.Calibration ProcessTo control the illumination pattern of individual fibers in the bundle, we performed a two-step calibration process. First, we mapped the fiber bundle reconstruction plane where the pattern is formed (fiber bundle input) to the SLM plane. To perform the SLM-input mapping, two beam splitters were added to the projection system: the first illuminates the input surface of the bundle from its other end, while the second enables the imaging of the fiber bundle and projected the hologram on its surface using a charge-coupled device camera [the schematic of the calibration system is shown in Fig. 1(b)]. Next, the transformation matrix between the image and the SLM planes was derived under the assumption of an affine transformation. Second, in order to allow for long-range fiber bundles, such that a low-cost system can be built as well as systems with extended bundle range [which is required for settings where the light source need to be far from the target location, as in magnetic resonance imaging (MRI)], we used an incoherent fiber bundle. Consequently, a mapping between the input and output of the bundle is necessary. This mapping was achieved through a multistep process: (1) the fibers were labeled and their center of mass found through segmentation of input and output images; (2) holograms of a single spot corresponding to the center of each input fiber, using the SLM input transformation matrix (defined in the calibration process), were created; (3) an output movie resulting from projecting these holograms on the input surface was recorded; and (4) the movie was converted to a lookup table of input-output fiber pairs’ coordinates. 3.Experimental MethodsAnimal experiments and procedures were approved by the Institutional Animal Care Committee at Technion–Israel Institute of Technology and are in accord with the NIH Guide for the Care and Use of Laboratory Animals. Cortical tissue was obtained from zero- to two-days-old Sprague-Dawley rats. Cells were plated on polyethyleneimine coated multielectrode arrays (MEA; 200/30IR-ITO, Multi Channel Systems MCS GmbH, Reutlingen, Germany) and were transfected with the light gated ion channel ChR2 using the viral construct AAV9.hSyn.hChR2(H134R)-eYFP.WPRE.hGH (Vector Core Facility, University of Pennsylvania, Philadelphia, Pennsylvania). The cell cultures were maintained in minimum essential medium Eagle (MEM; M2279, Sigma-Aldrich, St. Louis, Missouri) containing 10% Nu serum (BD Biosciences), 30 nM Gentamycine (G1397, Sigma-Aldrich), 2 mM L-glutamine, 4.3 mM insulin, and 15 mM glucose (MEM 10%). To block network dynamics, the synaptic blockers CNQX (at ) and APB (at ) were added 10 to 15 min prior to the stimulation sessions. Activation experiments were performed two to three weeks post-transfection. Evoked electrophysiological activity was amplified using a custom programmed 64 channel amplifier (FA64I, Multi Channel Systems MCS GmbH), sampled at 10 KHz using a data acquisition board (E6071, National Instruments), and was recorded, displayed, and analyzed (off-line) using custom software developed in MATLAB® (The Mathworks, Waltham, Massachusetts). Analysis of the optically induced electrophysiological signals involved spike detection and characterization of several spike train features. The first step was to detect spiking events that crossed threshold values, which varied between three and five times the signal’s standard deviation. Next, the different detected spike trains were analyzed. In addition, for further characterization of the system’s spatial performance, we investigated the stimulation fields obtained in the previously described cell cultures by illuminating randomly ordered fibers and performing spike triggered average analysis on the recorded data. 4.Results4.1.Projected Pattern CharacteristicsAfter performing calibration, the projection of desired patterns can be readily achieved. The spatial characteristics of the achieved patterns at the input and output surface of the fiber bundle and the ability to project flexible patterns by switching on desired fibers in the bundle are demonstrated in Fig. 2. The high spatial resolution with which the input pattern is generated is demonstrated in the left panel of Fig. 2(a), where an acquired image of a single point at the input surface of the bundle is presented. The spot’s FWHM at the input surface was , demonstrating the high spatial resolution [Fig. 2(a)] and contributing to fiber-specific coupling. The corresponding output, which was also characterized by high spatial resolution with an FWHM of corresponding to a beam waist size () of using for a Gaussian spot, is presented in the right panel of Fig. 2(a). The system’s capability of projecting highly flexible patterns is presented in Fig. 2(b), in which the left panel illustrates the desired pattern at the output and the right panel illustrates the actual pattern obtained at the fiber bundle output. For a thorough characterization of the system, we also measured the power at the output of the fiber bundle as a function of the number of illuminated fibers [Fig. 2(c)], where the peak intensity was estimated using . From these measurements, we can infer that given the ChR2 activation thresholds18,21 (1 to ), we have sufficient intensity for the parallel activation of cells through more than 40 fibers. Another important feature to characterize is the output contrast: its monotonic decrease as a function of the number of illuminated fibers is illustrated in Fig. 2(d) and appears to generally match the expected behavior. In addition, as part of the output characterization process, we also investigated the properties of the generated spot as it propagates in a tissue resembling phantom (4% agarose preparation that contains fluorescein to induce fluorescence upon illumination). The spot was imaged at different depths, with the aid of a piezoelectric element, starting at the focal point and going deeper into the phantom. The results show a spot FWHM of at the focal plane and at depth [Fig. 2(a), bottom right panel], which is consistent with the divergence resulting from the fiber's NA (0.64). 4.2.Targeted Optogenetic StimulationIn order to validate the system’s ability to elicit targeted optogenetic stimulation with high spatial resolution, we used cortical cell cultures transfected with the optogenetic probe ChR2, conjugated to the fluorescent protein eYFP that was used to visualize the network and guide targeting [Fig. 3(a)]. For the targeted activation, fibers in the vicinity of the desired cells were lit for 70 ms pulses (5 s intervals) with an intensity of , roughly of the maximal attainable intensity [Fig. 3(a)], and the resulting electrophysiological raw signals and raster graphs were analyzed. In these experiments, the fibers were illuminated sequentially (F1, F2, and F3), and we can observe from the raw data, Fig. 3(b), that each fiber induced activity only on the channels in their vicinity (the color coded channels 3, 8, 22, and 24), while more distant channels were not activated (data not shown). These responses were highly reproducible across multiple representative stimulus repetitions [Fig. 3(b)]. The raster graphs for a set of 20 repetitions further highlight a high degree of selectivity and reproducibility achieved [Fig. 3(c)]. Peristimulus time histogram analysis for a subset of channels [Fig. 3(c), bottom right] shows a roughly 10-fold increase in firing rate, beginning 41 to 80 ms following stimulus onset. Fig. 3Targeted optogenetic stimulation results. (a) Targeted stimulation loci (F1 to F3, white discs) superposed on bright-field (top panel) and fluorescent (bottom panel) images of ChR2-expressing cells grown on a multielectrode array. The responsive electrodes (channels 3, 8, 22, and 24) are marked with colored circles. Scale bar: . (b) Raw electrophysiological traces recorded on the responsive channels (3, 8, and 24) during representative stimulus repetitions, demonstrating selective stimulation of the cells in the near vicinity of the selected fibers. (c) Raster and peristimulus time histogram (PSTH) graphs for the responsive electrodes marked in (a) channels 3, 8, 22, and 24, the latter omitted from the PSTH. Insets: average spike waveforms of the induced responses.  To more directly examine the spatial specificity aspects of targeted cellular stimulation, stimulation field18 mapping was performed by illuminating randomly ordered fibers, a single fiber at a time [Fig. 4(a)]. We observed relatively confined stimulation fields () in the majority of responding channels, as demonstrated in Fig. 4(b) (five of seven responding channels in this experiment). Each simulation field was fit to an ellipse with the corresponding center and radius, derived using center and second moment of mass calculations for each responsive channel [solid line Fig. 4(b)]. This data strongly highlights the high spatial resolution with which optical stimulation was achieved using the fiber bundle based holographic projection system. Fig. 4Random optogenetic stimulation results and stimulation fields map. (a) Representative stimulus (top) and two electrophysiological response traces (channels 22 and 9 in middle and bottom traces, respectively). The stimulus pulses indicate the illumination times of randomly ordered fibers, and arrows indicate optogenetically induced spikes. (b) The response stimulation fields and their elliptical contour fits, showing fibers that elicited responses on each responding electrode channel; different channels are color coded with blue and yellow as in (a). 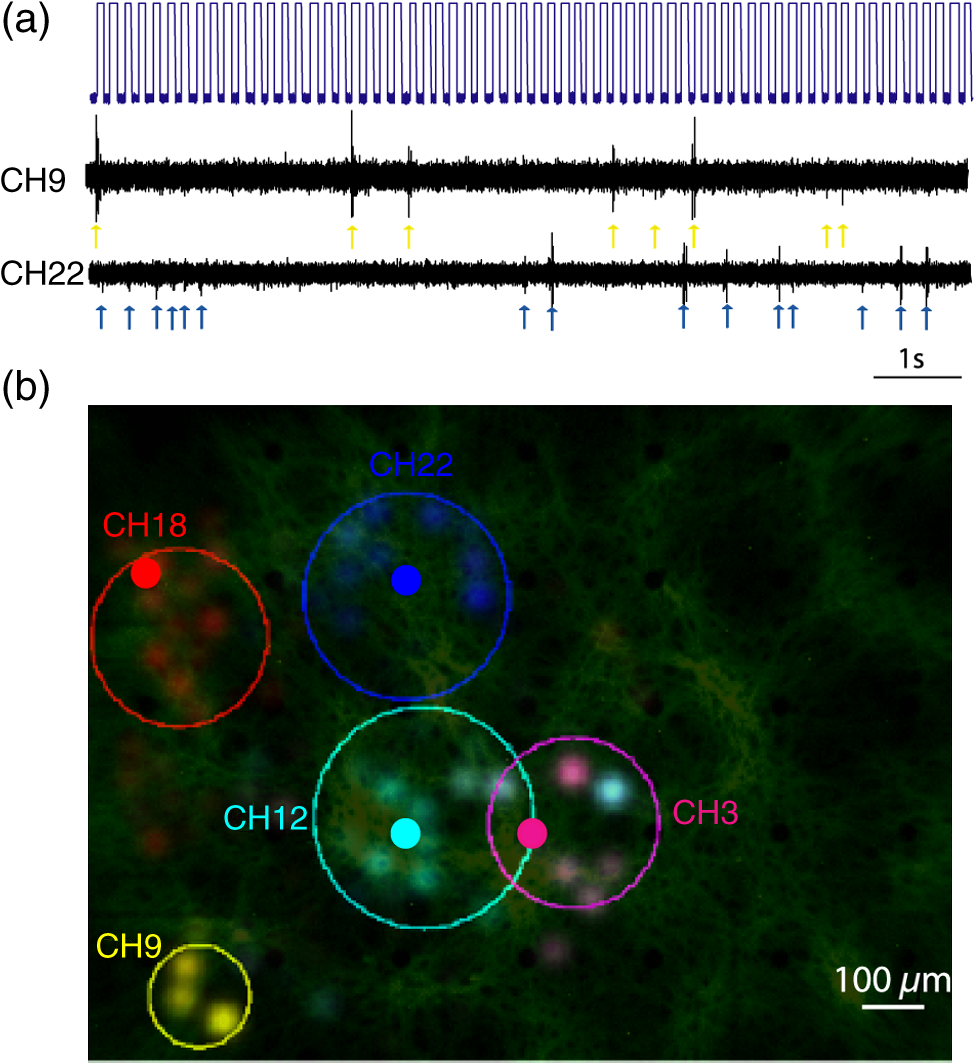 5.DiscussionIn this study, we designed and tested an optical system for efficient and high-resolution spatiotemporal control of neural circuits. The system, Holobundle, is composed of a holographic projection system and a fiber bundle. The Holobundle combines the advantageous features of computer-generated holography based on a transmissive SLM and the flexibility of pattern delivery through a fiber bundle in a compact design. The system was experimentally validated using both physical measurements and photostimulation experiments of ChR2-expressing cortical neurons cultured on an MEA. These experiments demonstrated the ability to project patterns of illumination controlling individual fibers within the fiber bundle with lateral dimensions of (FWHM) at the output surface of the bundle ( at its input surface) with good inter-fiber contrast (, expected to further significantly improve for future SLMs) and sufficient intensity for the parallel activation of more than 40 fibers. These estimates are supported by both the targeted and random photostimulation experiments, which demonstrate that the calibrated system readily produces reliable and consistent targeted activation of optogenetically transduced cells with high spatial resolution. Our solution has several major differences from a related holographic fiber bundle system recently reported by Szabo et al.20 First, it enables pattern projection onto a relatively large FOV ( or larger, constrained primarily by the dimensions of the fiber bundle) as compared to diameter FOV accessed in their system. Second, we introduced a semi-automatic calibration procedure that allows overcoming the random fiber mapping between the bundle’s two edges, thereby making a much wider and more economical array of incoherent fiber bundles accessible to this type of application, albeit at the expense of the possibility to image the resulting activity through the same bundle. There are several potential benefits to the use of incoherent bundles. First, in comparison to the practically infinite variety of incoherent bundles, the selection of coherent imaging bundles is much more restricted, they are usually composed of very small diameter fibers (several microns), their lengths are often up to 1 to 2 m, and their overall diameters are mostly limited to (c.f., the 0.5 to 1 m fiber bundles in Ferezou et al.22 and the custom 2-m-long, 0.6-mm-diameter bundle in Szabo et al.20). As our primary future goal with this system is to enable patterned optogenetics in vivo work inside the MRI environment up to 5 to 7 m away from our optical setup, with a larger FOV of several millimeters, we looked to avoid such limitations. Second, individual pixels in coherent bundle are a few microns, and illuminating of effective areas will require illuminating a number of adjacent fibers with patches of light (see Refs. 15 and 18), leading to a significantly higher computational complexity and to the well-known holographic speckle phenomenon. Moreover, the NA of the smaller fibers is typically quite large, complicating efficient coupling to a waveguide array. The design choice was primarily based on our anticipation that Holobundle arrays will be used for access to wide-area networks both in vitro and in vivo. Current fiber- and waveguide-based optogenetic delivery systems are, in most cases, not geared to image resulting cellular activity patterns in a bidirectional all-optical mode. Although undeniably of much interest, at present, the issue of practical bidirectional all-optogentic interface is probably still an open challenge. For example, Szabo et al. reported GCaMP5G imaging illumination intensities of , which likely partially activate and desensitize ChR2, leading to the extremely intense and long stimuli required for eliciting responses (24 60-ms-long pulses at 50 to to elicit ). Two-color probe combinations are also still facing major hurdles due to the blue shoulders of red actuators and response-mimicking artifacts of red genetically encoded calcium indicators. Moreover, a major driver of our development was the fact that fiber bundles are a particularly attractive light delivery solution for optogenetic functional MRI experiments23–26 due to their intrinsic MRI compatibility and the ability to place the system’s optoelectronic components remotely. Holobundles can potentially also be coupled to 3-D waveguides27 for the control and investigation of network dynamics in nonsuperficial neuronal cell layers and 3-D networks28 and for applications in deep brain stimulation. AcknowledgmentsThe authors acknowledge financial support by a grant from the Israeli Ministry of Science, Technology, and Space. ReferencesV. Gradinaru et al.,
“Targeting and readout strategies for fast optical neural control in vitro and in vivo,”
J. Neurosci., 27 14231
–14238
(2007). http://dx.doi.org/10.1523/JNEUROSCI.3578-07.2007 JNRSDS 0270-6474 Google Scholar
J. Zhang et al.,
“Integrated device for optical stimulation and spatiotemporal electrical recording of neural activity in light-sensitized brain tissue,”
J. Neural Eng., 6 055007
(2009). http://dx.doi.org/10.1088/1741-2560/6/5/055007 1741-2560 Google Scholar
P. Anikeeva et al.,
“Optetrode: a multichannel readout for optogenetic control in freely moving mice,”
Nat. Neurosci., 15 163
–170
(2011). http://dx.doi.org/10.1038/nn.2992 NANEFN 1097-6256 Google Scholar
M. M. Halassa et al.,
“Selective optical drive of thalamic reticular nucleus generates thalamic bursts and cortical spindles,”
Nat. Neurosci., 14 1118
–1120
(2011). http://dx.doi.org/10.1038/nn.2880 NANEFN 1097-6256 Google Scholar
J. Y. Lin,
“Optogenetic excitation of neurons with channelrhodopsins. Light instrumentation, expression systems, and channelrhodopsin variants,”
Prog. Brain Res., 196 29
–47
(2012). http://dx.doi.org/10.1016/B978-0-444-59426-6.00002-1 PBRRA4 0079-6123 Google Scholar
F. Wu et al.,
“An implantable neural probe with monolithically integrated dielectric waveguide and recording electrodes for optogenetics applications,”
J. Neural Eng., 10 056012
(2013). http://dx.doi.org/10.1088/1741-2560/10/5/056012 1741-2560 Google Scholar
J. G. Bernstein et al.,
“Prosthetic systems for therapeutic optical activation and silencing of genetically-targeted neurons,”
Proc. SPIE, 6854 68540H
(2008). http://dx.doi.org/10.1117/12.768798 Google Scholar
S. Royer et al.,
“Multi-array silicon probes with integrated optical fibers: light-assisted perturbation and recording of local neural circuits in the behaving animal,”
Eur. J. Neurosci., 31 2279
–2291
(2010). http://dx.doi.org/10.1111/j.1460-9568.2010.07250.x EJONEI 0953-816X Google Scholar
C. T. Wentz et al.,
“A wirelessly powered and controlled device for optical neural control of freely-behaving animals,”
J. Neural Eng., 8 046021
(2011). http://dx.doi.org/10.1088/1741-2560/8/4/046021 1741-2560 Google Scholar
E. Stark, T. Koos and G. Buzsaki,
“Diode probes for spatiotemporal optical control of multiple neurons in freely moving animals,”
J. Neurophysiol., 108 349
–363
(2012). http://dx.doi.org/10.1152/jn.00153.2012 JONEA4 0022-3077 Google Scholar
A. N. Zorzos, E. S. Boyden and C. G. Fonstad,
“Multiwaveguide implantable probe for light delivery to sets of distributed brain targets,”
Opt. Lett., 35 4133
–4135
(2010). http://dx.doi.org/10.1364/OL.35.004133 OPLEDP 0146-9592 Google Scholar
Y. Hayashi et al.,
“Spatio-temporal control of neural activity in vivo using fluorescence microendoscopy,”
Eur. J. Neurosci., 36 2722
–2732
(2012). http://dx.doi.org/10.1111/j.1460-9568.2012.08191.x EJONEI 0953-816X Google Scholar
A. N. Zorzos et al.,
“Three-dimensional multiwaveguide probe array for light delivery to distributed brain circuits,”
Opt. Lett., 37 4841
–4843
(2012). http://dx.doi.org/10.1364/OL.37.004841 OPLEDP 0146-9592 Google Scholar
O. Bryngdahl and F. I. Wyrowski,
“Digital holography—computer-generated holograms,”
Prog. Opt., 28 1
–86
(1990). http://dx.doi.org/10.1016/S0079-6638(08)70288-9 POPTAN 0079-6638 Google Scholar
L. Golan et al.,
“Design and characteristics of holographic neural photo-stimulation systems,”
J. Neural Eng., 6 066004
(2009). http://dx.doi.org/10.1088/1741-2560/6/6/066004 1741-2560 Google Scholar
R. W. Gerchberg and W. O. Saxton,
“A practical algorithm for the determination of phase from image and diffraction plane pictures,”
Optik, 35 237
–246
(1972). OTIKAJ 0030-4026 Google Scholar
A. Vaziri and V. Emiliani,
“Reshaping the optical dimension in optogenetics,”
Curr. Opin. Neurobiol., 22 128
–137
(2012). http://dx.doi.org/10.1016/j.conb.2011.11.011 COPUEN 0959-4388 Google Scholar
I. Reutsky-Gefen et al.,
“Holographic optogenetic stimulation of patterned neuronal activity for vision restoration,”
Nat. Commun., 4 1509
(2013). http://dx.doi.org/10.1038/ncomms2500 NCAOBW 2041-1723 Google Scholar
A. M. Packer, B. Roska and M. Häusser,
“Targeting neurons and photons for optogenetics,”
Nat. Neurosci., 16 805
–815
(2013). http://dx.doi.org/10.1038/nn.3427 NANEFN 1097-6256 Google Scholar
V. Szabo et al.,
“Spatially selective holographic photoactivation and functional fluorescence imaging in freely behaving mice with a fiberscope,”
Neuron, 84 1157
–1169
(2014). http://dx.doi.org/10.1016/j.neuron.2014.11.005 NERNET 0896-6273 Google Scholar
E. S. Boyden et al.,
“Millisecond-timescale, genetically targeted optical control of neural activity,”
Nat. Neurosci., 8 1263
–1268
(2005). http://dx.doi.org/10.1038/nn1525 NANEFN 1097-6256 Google Scholar
I. Ferezou, S. Bolea and C. C. H. Petersen,
“Visualizing the cortical representation of whisker touch: voltage-sensitive dye imaging in freely moving mice,”
Neuron, 50 617
–629
(2006). http://dx.doi.org/10.1016/j.neuron.2006.03.043 NERNET 0896-6273 Google Scholar
J. H. Lee et al.,
“Global and local fMRI signals driven by neurons defined optogenetically by type and wiring,”
Nature, 465 788
–792
(2010). http://dx.doi.org/10.1038/nature09108 Google Scholar
M. Desai et al.,
“Mapping brain networks in awake mice using combined optical neural control and fMRI,”
J. Neurophysiol., 105 1393
–1405
(2011). http://dx.doi.org/10.1152/jn.00828.2010 JONEA4 0022-3077 Google Scholar
I. Kahn et al.,
“Characterization of the functional MRI response temporal linearity via optical control of neocortical pyramidal neurons,”
J. Neurosci., 31 15086
–15091
(2011). http://dx.doi.org/10.1523/JNEUROSCI.0007-11.2011 JNRSDS 0270-6474 Google Scholar
I. Kahn et al.,
“Optogenetic drive of neocortical pyramidal neurons generates fMRI signals that are correlated with spiking activity,”
Brain Res., 1511 33
–45
(2013). http://dx.doi.org/10.1016/j.brainres.2013.03.011 BRREAP 0006-8993 Google Scholar
T. V. F. Abaya et al.,
“A 3D glass optrode array for optical neural stimulation,”
Biomed. Opt. Express, 3 3087
(2012). http://dx.doi.org/10.1364/BOE.3.003087 BOEICL 2156-7085 Google Scholar
H. Dana et al.,
“Hybrid multiphoton volumetric functional imaging of large-scale bioengineered neuronal networks,”
Nat. Commun., 5 3997
(2014). http://dx.doi.org/10.1038/ncomms4997 NCAOBW 2041-1723 Google Scholar
BiographyNairouz Farah is a faculty member and a lab manager in the Department of Optometry at Bar Ilan University, where she teaches courses on methods in vision research. She holds a BSc in electrical engineering from the Technion–Israel Institute of Technology, an MSc in bioengineering and medical imaging from University College London, England, and a PhD degree in biomedical engineering from the Technion–Israel Institute of Technology. Alexandra Levinsky is an algorithm developer at Head-Sense Medical. This project was part of her MSc research in the Technion's Autonomous Systems Program (TASP), in the laboratories of Profs. Shy Shoham and Itamar Kahn. She holds a BSc degree in electrical and biomedical engineering from Tel Aviv University and is currently completing her MSc in the Technion–Israel Institute of Technology. Inbar Brosh is a lab manager in the Department of Biomedical Engineering at the Technion–Israel Institute of Technology. She works at the Neural Interface Engineering Lab (NIEL) and the Biomechanics of Ultrasound Interaction with Cells and Tissues Lab. She holds a BSc degree in life science and MSc and PhD degrees in medical science from Ben Gurion University, and was a postdoctoral fellow at Haifa University. Itamar Kahn is an assistant professor of neuroscience in the Rappaport Faculty of Medicine at Technion–Israel Institute of Technology. His research focuses on understanding the basic principles of communication between distal brain systems. He has worked on methods for mouse imaging, including optogenetic control combined with fMR and fMRI of awake behaving mice in intact animals and genetic models of developmental disorders. Shy Shoham is a biomedical engineering associate professor at the Technion–Israel Institute of Technology, where his lab develops photonic, acoustic, and computational tools for interfacing with retinal and brain circuits. He holds a BSc degree in physics (Tel-Aviv University), a PhD degree in bioengineering (University of Utah) and was a Lewis-Thomas fellow at Princeton University. He is on the editorial boards of The Journal of Neural Engineering and Translational Vision and Technology. |


