
|
|
1.IntroductionDopamine (DA) is an important neurotransmitter primarily found in deep brain regions that has drawn considerable interest in recent years. Its role is closely related to behaviors involving reward seeking, motor control, learning, attention, and emotion in both the healthy and diseased brain.1,2 Several neurological and psychiatric disorders such as depression, drug addiction, attention deficit hyperactivity disorder, and Parkinson’s disease are the consequences of DA transmission deficiency or excessiveness.3–5 Therefore, understanding the dopaminergic system dynamics and their relationship to modulation of DA release by external stimuli is important in unfolding the underlying mechanisms and treating these disorders. Three major dopaminergic pathways map the brain’s DA system. In the mesolimbic pathway, the dopaminergic neurons in the ventral tegmental area (VTA) project to the nucleus accumbens (NAc); in the nigrostriatal pathway projections originate in the substantia nigra (SN) and project to striatum; in mesocortical pathway projections run from the VTA to the prefrontal cortex.2 In particular, on the DA system map, the NAc is known as the brain’s “reward center;”6 alterations of DA level in the NAc can dramatically influence the animal’s behavior. This is seen in experiments of intracranial electrical self-stimulation. Animals continuously press the lever for stimulation to elicit DA release in the NAc at the expense of food consumption,7,8 which is the direct evidence of the significant role of mesolimbic DA in reward-related behavior. The neuromodulation technique used most extensively in previous studies is electrical stimulation, which produces a noncell-type-specific excitation. As there is a significant population of nondopaminergic neurons coexisting with dopaminergic neurons,9 recruiting all subtypes of neurons may result in complex dopaminergic system dynamics and evoke neurological consequences not related to DA release, which may be undesirable in potential therapeutic treatment. An alternative approach for more controlled manipulation of the dopaminergic system is to use optogenetics which allows cell-type specific manipulation of neural activity through light-gated ion channels. Optogenetics has been employed in recent studies for targeted DA release. Specifically, Threlfell et al.10 demonstrated light induced DA release from cholinergic interneurons and dopaminergic neurons in mouse striatum. Bass et al.11 studied the DA release in rat striatum with different quantities and durations of light pulses, and compared optical and electrical stimulations. Melchior et al.12 have recently compared optically and electrically induced DA release in detail utilizing pharmacological methods. A few in vivo studies have used light induced DA as an indicator to investigate behavioral conditioning.13,14 However, there has not been a detailed study to bring in all the key aspects of optogenetic stimulation, such as the light power density, light waveform shape, and the temporal pattern of delivered stimuli. Additionally, the DA dynamics in the NAc are much less well understood than those in the striatum.15 The DA dynamics in the NAc are also especially important for many animal behaviors because of the central functional role of the NAc. Therefore, an understanding of these dynamics is crucial for developing physiologically realistic stimulation paradigms for future in vivo studies. Here, we report a quantitative study of dopaminergic dynamics and their manipulation by optogenetics technique in a specifically bred ChR2 transgenic mouse model [conditionally expresses ChR2(H134)-EYFP by DAT-Cre] focusing on the NAc. Previous studies on optically induced DA release used a virus injection to induce opsin expression.11,16 In transgenic opsin-expressing animals, expression does not depend on the viral diffusion or efficacy of transduction in the physically heterogeneous brain, and therefore is more stable and has better cross-animal consistency. In this model, we were able to elicit transient high concentrations of extracellular DA using optical stimulation at a particularly low-light power density of 0.1 to compared to the previously used value of around to elicit DA release10 or other typical levels used across in vitro and in vivo mammalian studies.17,18 Importantly, minimal light artifacts were observed under this regime of low-power density, which allows simultaneous and overlapping light stimulation and fast-scan cyclic voltammetry (FSCV). By controlling stimulation parameters such as light power and pulse width, optically induced DA concentrations can be precisely modulated across the dynamical range of to sub-. Surprisingly, optogenetically induced DA release was observed to also depend significantly on the temporal shape at the rising edge of stimulus waveform. We also found that the optogenetically induced DA efflux, as a consequence of direct axonal and terminal excitation, is attenuated during various temporal patterns of consecutive light stimulation. Details of such behavior were investigated by studying the kinetics behind the recovery of the releasable DA pool after an initial DA release event. We further estimated a number of key time constants that define DA clearance in the uptake process, during which a transporter protein pumps DA back into the cytosol. The time constants are expected to be dramatically different between the DA uptake process and the recovery of the releasable DA pool since more complicated mechanisms are involved in the latter case. In general, we provide a detailed terminal dopaminergic dynamics study using optogenetics tools in the NAc. The different light stimulation parameters discussed here will provide guidance for designing practical stimulation paradigms to induce DA release. Our results therefore, set the stage for future studies on reward, motivation, and emotion related behaviors where the modulation of DA level in the NAc is important. 2.Methods2.1.Animals and ExperimentsA transgenic DAT-Cre mouse line was crossed with a floxed ChR2(H134R)-EYFP mouse line to produce offspring (both from Jackson Laboratories). These offsprings were genotyped (Transnetyx) and those that tested positive for the presence of Cre were used in experiments ( animals). Brain slices were cut from adult mice 2 to 3 months in age, both male and female. For the slicing procedure, the mice were anesthetized with a solution of ketamine () and xylazine () and decapitated. The brain was quickly removed and submerged in an ice-cold oxygenated artificial cerebro-spinal fluid (ACSF) cutting solution containing (in mM): 125 NaCl, 2.7 KCl, 25 , 1.22 , 10 dextrose, 2 CaCl, 2 , 1 ascorbic acid. Coronal slices, in thickness, were cut with a vibrating blade microtome (Leica VT1000S, Leica Biosystems) in the same ice-cold ACSF cutting solution. The slices were incubated for 30 min at 32°C and then maintained at room temperature (20°C) in oxygenated ACSF cutting solution.19 Animal care and experiments were performed in accordance with the National Research Council Guide for the Care and Use of Laboratory Animals (Brown University Institutional Animal Care and Use Committee). 2.2.Histology and ImmunochemistryFor histological analysis, the transgenic mouse was terminally anesthetized with Beuthanasia-D. Perfusion was performed transcardially with saline followed by 4% paraformaldehyde in phosphate-buffered saline (PBS) solution. The brain was extracted and sequentially fixed in 4% paraformaldehyde in PBS solution (1 day) and then 30% sucrose solution (until brain sunk in solution). The brain was then frozen with dry ice and cut into coronal slices with a microtome. For tyrosine hydroxylase (TH) immunostaining, slices were sequentially washed in phosphate buffer (PB; twice, 5 min each), PBS (three times, 5 min each), and then left in block solution for 1 h. The block solution was prepared with 0.1% Tween (Sigma–Aldrich, Missouri), 0.25% Triton-X (Sigma–Aldrich, Missouri), and 10% normal donkey serum (EMD Millipore, MA) in PBS. Slices were then immersed in primary antibody (1:1000 AB152 Anti-Tyrosine Hydroxylase in block solution, EMD Millipore, Massachusetts), covered with tin foil, and rotated for 2.5 days in a cold room (4°C). Slices were thoroughly washed five times in PBS (5 min each) and again blocked in block solution for 1 h. The slices were then transferred to secondary antibody solution (1:500, Alexa Fluor® 594 donkey anti-rabbit IgG in block solution; Life technology, CA) for 2 h. Afterward, they were again washed in PBS (three times, 5 min each) and PB (twice, 5 min each), and mounted on microscope slides. Specific slices containing VTA ( anterior–posterior) and NAc ( AP) were selected and examined under a Zeiss LSM 510 Meta confocal laser scanning microscope to verify the colocalization of ChR2-EYFP with TH. 2.3.Optogenetic Stimulation of Brain SlicesSlices containing the NAc ( AP) were placed in a recording chamber under a microscope (Eclipse E600FN, Nikon, Melville, New York) and superfused with room temperature oxygenated ACSF recording solution containing (in mM): 125 NaCl, 2.7 KCl, 25 , 1.22 , 10 dextrose, 1 CaCl, 1 . The expression of ChR2-EYFP was observed under the microscope with an excitation wavelength of 490 nm by a Polychrome 5000 lamp from Till Photonics (Bavaria, Germany). After confirming opsin expression in the slices, excitation of the dopaminergic cells was performed with a blue laser (473 nm, CrystaLaser, Reno, Nevada), the output of which was coupled to the microscope and projected through the objective onto the slice. Home-made carbon fiber electrodes (CFE) were inserted under the microscope into the NAc area close to the anterior commissure of the coronal forebrain slices ( AP) with the aid of a micromanipulator. Under constant light from the laser, we centered the light around the CFE to ensure that the dopaminergic projections in the NAc are receiving the light excitation when laser pulses are sent through the objective. The light power was measured by a power meter (PM100D, Thorlabs, Newton, New Jersey). 2.4.Fast-Scan Cyclic VoltammetryCarbon fibers (Goodfellow, Coraopolis, Pennsylvania) were vacuum aspirated into glass pipettes (Sutter Instrument, Novato, California) and subjected to heat assisted pulling (Micropipette puller P97, Sutter Instrument). Exposed carbon fibers were trimmed to around . These homemade carbon-fiber microelectrodes were connected to a Dagan CHEM-CLAMP voltammetry amplifier through a 1 MOhm head stage (). We used two National Instrument PCI cards: NI PCI 6024e was used for voltammetry data acquisition and command voltage waveform output; NI PCI 6321 was used for synchronization and triggering of optical stimuli. The data acquisition software used was Demon Voltammetry.20 The head stage, electrode, and recording media were placed inside a Faraday cage to prevent extraneous electric noise. The command voltage of FSCV was scanned from to 1.2 V and back to at with a sampling frequency of 10 Hz. Cyclic voltammograms in the 1 s before stimulation onset were averaged and used as the baseline for background subtraction. We examined background subtracted cyclic voltammograms [Fig. 2(c)] in each recording to identify the typical oxidation peak at 0.6 V and reduction peak at , respectively, to confirm that the recorded chemical species is DA, with minimal interference from other chemicals.21 Electrodes were calibrated by standard DA solution.22,23 The concentration traces of recorded DA were generated using the calibration factors. In the optogenetic experiments, we paused for at least 5 min between each FSCV recording session to allow DA recovery and ensure consistency among multiple DA release events. The FSCV setup was turned on 10 min before applying stimulation to ensure a stable baseline in each session. As a control, we performed the FSCV recording experiment with the electrode placed in the NAc in wild type animals without ChR2, and did not observe any induced DA signals. 2.5.Data AnalysisDA concentration traces recorded by FSCV were generated in Demon Voltammetry.20 The FSCV color plots follow the standard two-dimensional (2-D) representation with time along the axis, command voltage along the axis and pseudo color along the axis showing the oxidation current measured from electrodes (background subtracted). These 2-D color plots were also generated in Demon Voltammetry. Data across multiple animals were grouped together for investigation of different light stimulation parameters; the amplitudes of DA release were normalized to allow comparison across animals with respect to one highest value we recorded in each animal. The exact peak DA levels depend on factors such as local density of dopaminergic neuron terminals; and therefore, vary with the electrodes’ different position in the NAc tissue, among different slices, and across animals. The average peak DA level observed was estimated by electrode calibration to be 524 nM (; ). For curve fitting and modeling, data was exported and analyzed in MATLAB®. The model we adapted for kinetic analyses is the Michaelis–Menten model, which is the classical enzyme kinetics model commonly used to characterize DA uptake.24 To fit the model, an objective function calculating the sum of squared error between recorded data and simulated data was created in MATLAB®. Simulated data was obtained by MATLAB® differential equation solver, given the Michaelis–Menten equation in Eq. (1). stands for the DA released by optical stimulation; is the extracellular DA concentration; is the maximal uptake rate; is the apparent affinity constant of DAT. Using the optimization toolbox in MATLAB®, the minimum of the sum of squared error function was then determined by the Nelder–Mead simplex algorithm to yield best-fit parameters. Statistical analysis performed in Figs. 3(b) and 3(d) used one-way ANOVA combined with multiple comparison test (Tukey–Kramer) to reveal the difference in the means from multiple groups.3.Results3.1.Direct Light Stimulation Targeting Dopaminergic Cell Terminals Elicits DA Release in Transgenic Mouse Brain SlicesWe used optogenetics to evoke transient, relatively high concentrations25 of extracellular DA release in the NAc area of eight adult transgenic mice. Only mice identified as positive (+) for Cre [i.e., expressing ChR2(H134R)-EYFP] by genotyping were used. Brain slices were checked under a fluorescent microscope to confirm opsin expression before each recording experiment. Opsin expression was found in the VTA and SN in the midbrain, and in the NAc and CPu in the forebrain area [Fig. 1(a)], which is in agreement with previous studies on dopaminergic cell distribution in the mouse brain.26 Expression in other areas was not observed in the forebrain and midbrain slices. Histology experiments were done with immunostaining of TH to verify the colocalization of ChR2-EYFP with TH in both the VTA and NAc. Dopaminergic cell bodies stained with TH and showing yellow fluorescent protein (YFP) fluorescence were found in the VTA [Fig. 1(b)]. In the NAc, which contains the axons and terminals of DA neuron, YFP fluorescent neuronal projections overlapped well with the TH-labeled structures [Fig. 1(c)]. Such traces were not seen in the anterior commissure [bottom right corner, Fig. 1(c)], which does not contain dopaminergic projections. These histological results confirmed that our optogenetic stimulation of ChR2 was indeed affecting dopaminergic projections, as expected in these transgenic animals conditionally express ChR2 by DAT-Cre. Fig. 1ChR2-EYFP expression in transgenic mouse brain slices. (a) Fluorescent microscope images (excitation wavelength for YFP: 490 nm) show existence of YFP fluorescence in caudate putamen (left) and nucleus accumbens (NAc) (middle; AC: anterior commissure) in forebrain coronal slices ( AP; scale bars are 0.2 mm). Expression is also seen in midbrain coronal slices of SN/VTA (right; AP; scale bar is 0.5 mm). (b) Histological analysis with tyrosine hydroxylase (TH) immunostaining in the VTA ( AP) where DA cell bodies can be seen. TH is shown in red (left); YFP fluorescence is in green (middle); merged image is on the right. Scale bars indicate . (c) Same histological images in the NAc ( AP) show dopaminergic neuron projections (but not cell bodies). Scale bars indicate .  To measure phasic terminal DA release events modulated by optogenetics, FSCV electrodes were inserted into brain slices at the NAc. Light was delivered through the objective forming a illuminated spot around the electrode tip. As analog input controlled laser pulses were delivered onto the brain slices, simultaneous FSCV recording tracked the extracellular concentration of DA. As shown in [Figs. 2(a) and 2(b)], an abrupt increase of DA concentration followed by gradual decay over a few seconds was observed following a 25-ms light pulse. The background subtracted cyclic voltammograms displayed clear oxidation and reduction peaks at and [Fig. 2(c)], which are known to correspond to DA. The optogenetic induction of immediate DA release was reproducible in all adult transgenic animal subjects with different peak concentrations. During multiple stimulation events in one brain slice when the electrode was maintained at the same position, the time profiles of DA release showed little variation as seen in Fig. 2(b) (error bars are , peak concentration at ). DA signals were not seen in control experiments with the CFE placed out of the brain slice [Fig. 2(d)]. The optical stimulation power required to induce DA release was found to be relatively low (), which minimizes potential light artifacts at our typical stimulation parameters. The absence of any artifacts during induced DA release combined with the cell-type specificity in optogenetics enables us to investigate clean DA dynamics in the NAc, as well as to obtain accurate estimates of any kinetic parameters. Fig. 2Optogenetically induced dopamine (DA) release in NAc and the modulation effect of light power. (a) Recorded standard fast-scan cyclic voltammetry (FSCV) two-dimensional (2-D) color plot under a 25-ms square pulse light stimulation at . axis shows background-subtracted voltammetry current in pseudocolor. (b) Mean DA concentration trace under the same stimulation parameter with small vertical bars represent ( recordings in the same slice). (c) Background subtracted cyclic voltammogram at optical DA release peak; oxidation current is seen at 0.6 V and reduction current around . (d) One control experiment where the electrode is not inserted in the brain slices but under the same light stimulation parameters shows no DA signals and minimal light artifact. (e) Optically induced DA peak level as a function of light power, across three animals. ( recordings in total; recordings are separated by 5 to 10 min to allow DA recovery. Vertical bars represent ±SEM. Pulse width is fixed at 100 ms.) (f) Stacked DA concentration traces under the six different light power in one of the animals. 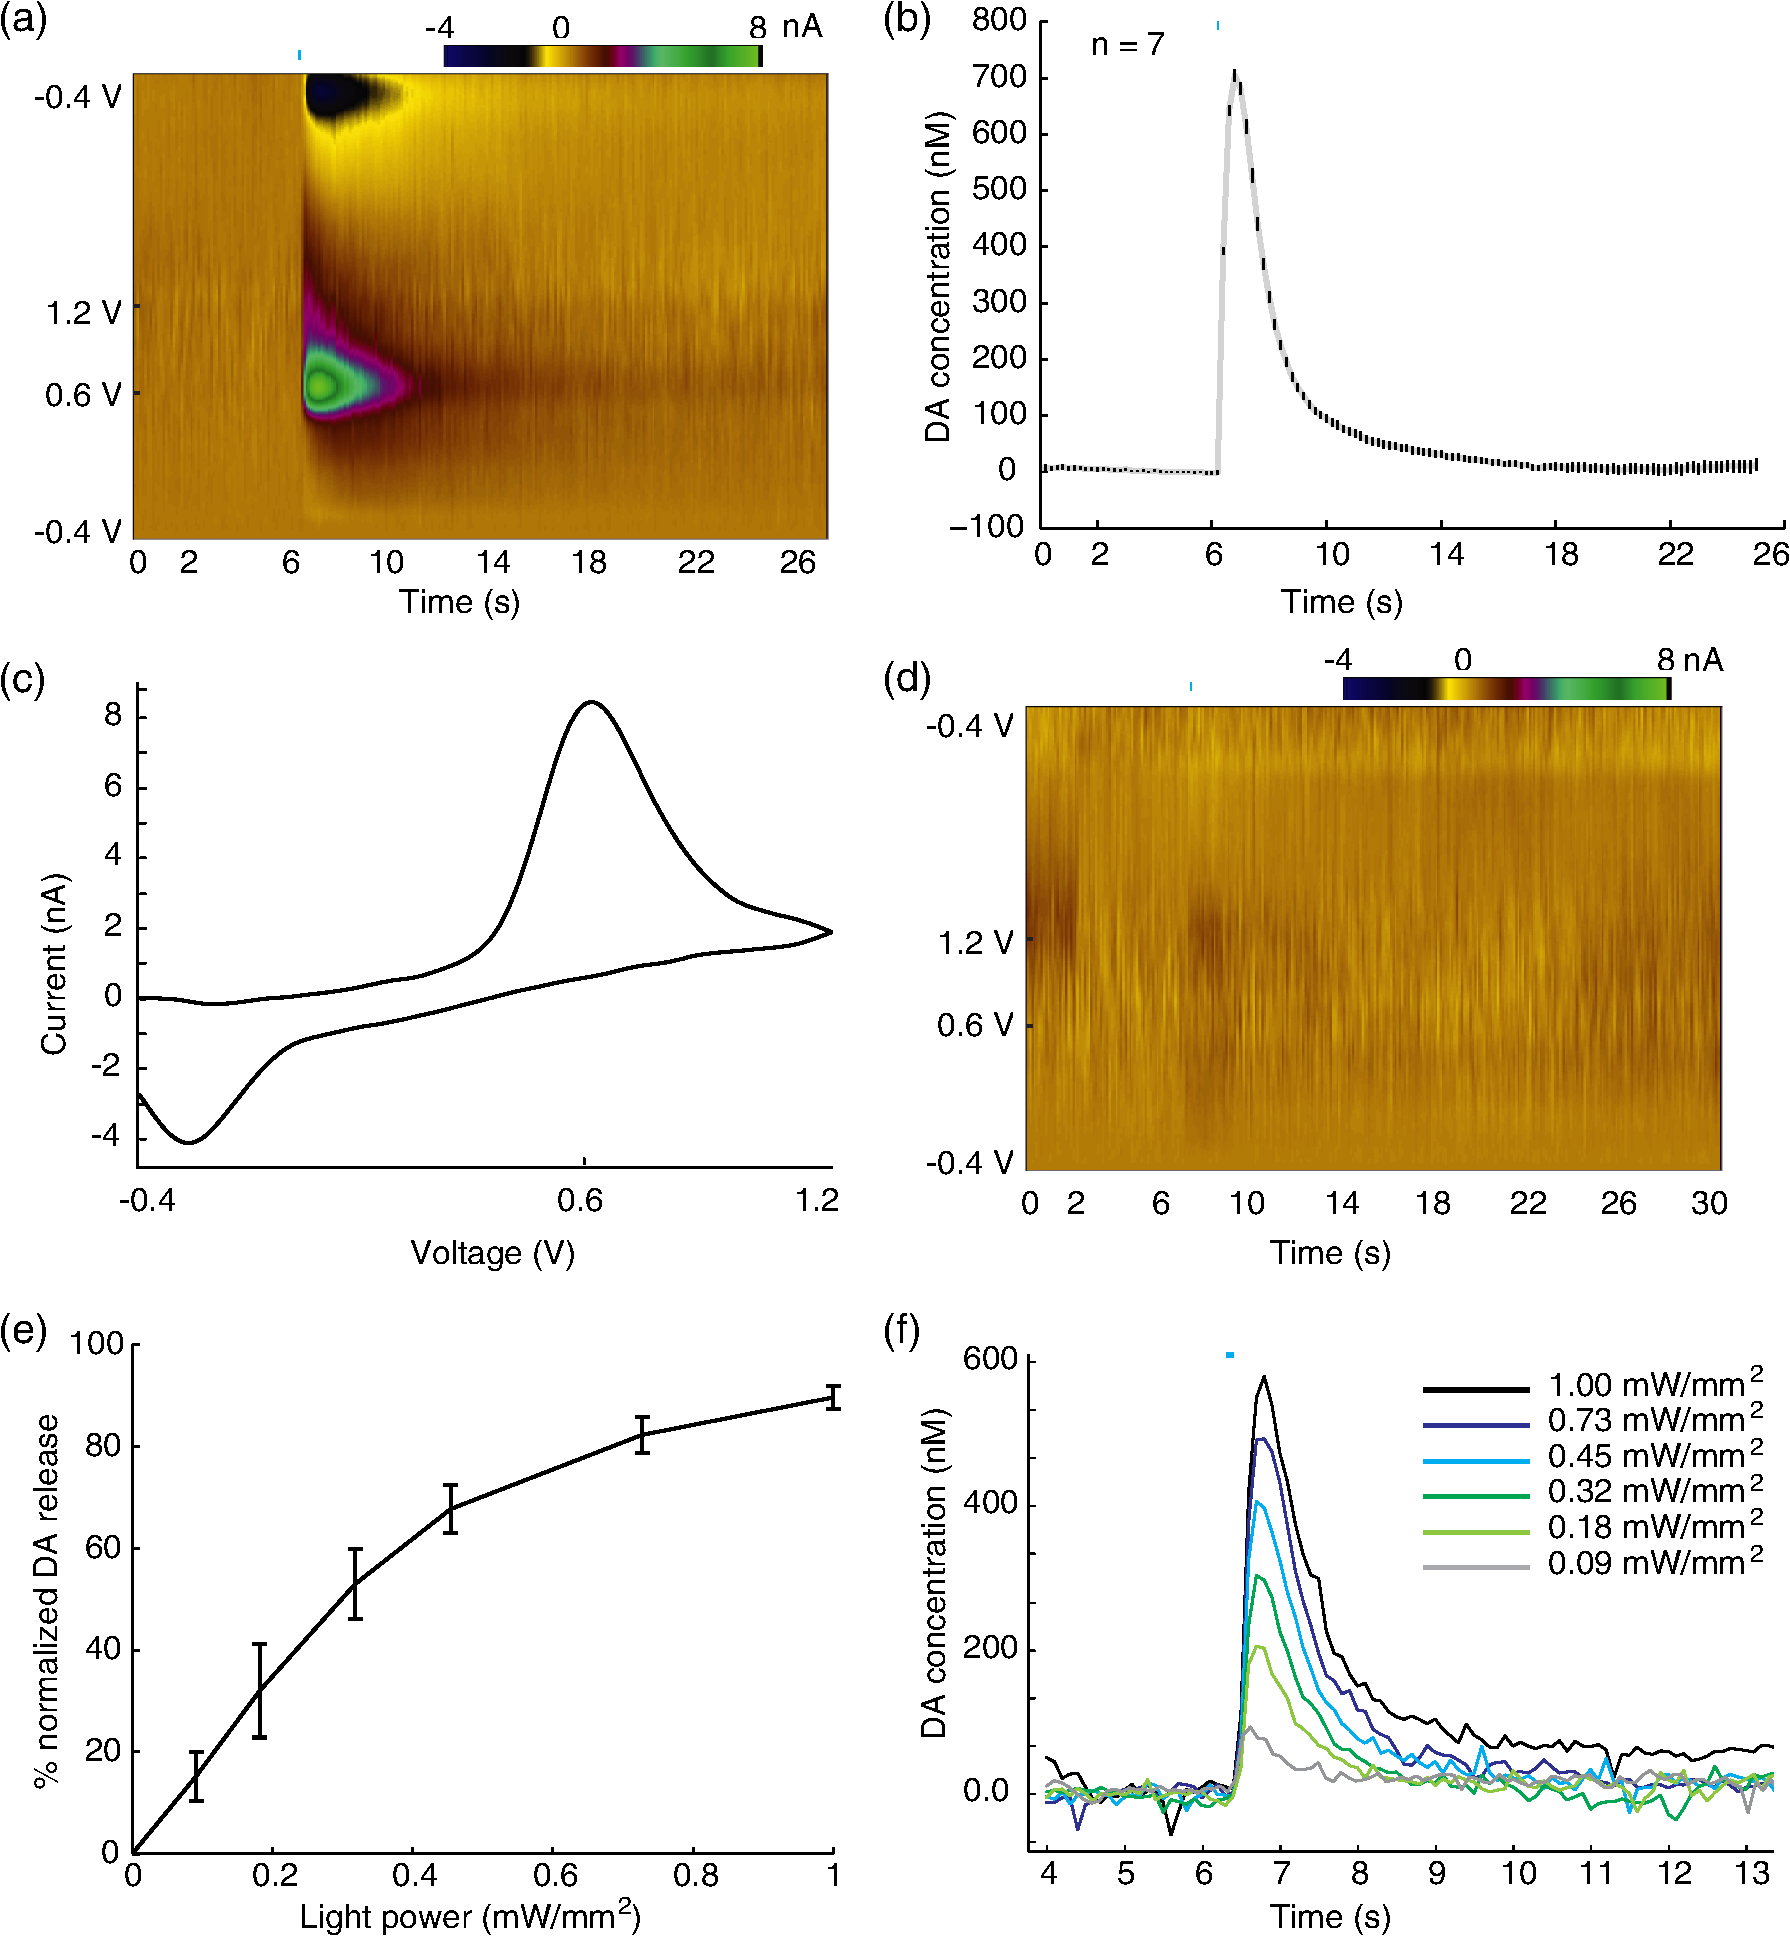 3.2.Optogenetic Modulation of Scalable DA Release EventsIt is known that the spontaneous release of DA during animals’ natural behaviors has more variability, and is often lower in concentration27 than the DA release induced by an electrical pulse. This indicates that only a portion of the stored presynaptic DA pool is typically released into the extracellular space during natural behavior. To mimic the DA release events in naturally behaving animals, it is essential to achieve scalable DA release with certain precision. We investigated the effects of altering the optical stimulation power and light pulse width. Across three transgenic animals, a series of stimulations with different light powers were delivered with simultaneous FSCV, ranging from 0.09 to . To minimize the effects brought by light pulse width, we used square pulses fixed at 100-ms long. As demonstrated in Figs. 2(e) and 2(f), the amplitude of the induced DA concentration increased as the light power was increased. A good linear fit was not obtained between the DA levels and light power density in Fig. 2(e), indicating a nonlinear and complex correlation. We also observed an increased DA response as the light pulse width was increased while the light power was held constant () across four transgenic animals. In Fig. 3(a), short light pulses of 3-ms induced relatively small DA release. However, a sharp increase of DA level was seen as the light pulse width increased. This increased DA release reached a plateau around 15 ms. This indicates that when the light stimulation is sufficiently long (), the amount of released DA reaches a saturation point for the effect of pulse width. Previous studies in electrically elicited DA release24,28 have been using the number of stimulation pulses as the primary approach to modulate DA release concentrations. We found that increasing the pulse width in optogenetics can result in a similar effect as multipulse stimulations as shown in Fig. 3(b). Across three transgenic animals, four pulses of 4 ms (25 Hz) stimulation increased the amount of DA release to around 200% of that from a single 4-ms pulse; whereas a longer 25-ms pulse also elicited higher DA release. The release levels between four pulses of 4 ms (25 Hz, takes a total time of 124 ms) and a single 25 ms pulse is similar (one-way ANOVA and multiple comparison test, ). Therefore, optical stimulations appear to be more versatile and effective since longer pulse width or stronger light power can lead to increased DA release, in addition to increasing the number of pulses. However, applying large quantity of stimulation pulses over an extended period has the potential to result in even higher DA release;12,24 whereas increasing the pulse width beyond 15 ms does not seem to further increase DA release concentrations. Fig. 3The effects of light pulse width and waveform shape on the concentration of DA release. (a) Optically induced DA peak level as a function of light pulse width across four animals ( recordings in total; recordings are separated by 5 to 10 min to allow DA recovery. Vertical bars represent . Light power is fixed at ). (b) The induced DA release levels from light stimulations of a 4-ms pulse, four pulses of 4 ms (25 Hz), and a 25-ms pulse; , 10, 22 recordings respectively, across three animals. DA level evoked by the 4-ms pulse is different than the other two cases (one-way ANOVA and multiple comparison test, ; concentration normalized with respect to DA release of 25 ms pulses. (c) Standard FSCV 2-D color plots under a 1-s square pulse (top) versus a 200 ms ramp square pulse stimulation (bottom). axis shows background-subtracted voltammetry current in pseudo color; data is from single recordings. (d) DA peak level as a function of added ramp time to the 1-s square pulse. (In total recordings across four different animals. Recordings are separated by 5 to 10 min to allow DA recovery.) -axis is normalized with respect to the DA release induced by nonramp square pulses in each animal. Among adjacent ramp durations, DA peak level is significantly different between 50 and 75 ms ramp waveforms (one-way ANOVA and multiple comparison test, ).  3.3.Temporal Shape of Light Stimulus Waveform Affects the Amplitude of Transient DA ResponseIn agreement with previous findings,10,11 our results indicate that higher extracellular DA concentrations can be induced by increasing either the intensity, the duration, or the number of light pulses, all of which correspond to increased light energy delivery into the targeted brain area. However, we found that controlling the energy delivery is not the only way to modulate DA release; the light pulse waveform also plays an important role. We demonstrate here that the optogenetically evoked transient DA signal is significantly dependent on the stimulus waveform at the onset of the light stimulus. We performed a series of FSCV recordings where the temporal shape of the rising edge of the light pulse was varied. The abrupt rising edge of a square pulse was replaced by a short linear ramp of varying slope at the onset of 1-s light stimulations. These temporal waveforms with initial ramps ranging from 12.5 to 300 ms were applied as analog inputs to the blue laser driver. All stimulations shared the same 1-s square pulse shape after the initial ramp. A comparison is shown in Fig. 3(c) between a stand-alone 1-s square pulse and a 1-s square pulse with a 200 ms initial ramp. Lower DA response is observed in the latter case despite the fact that more total light energy was delivered to the targeted brain area. More systematically, we investigated this effect in four transgenic mouse subjects by gradually increasing the ramp duration [Fig. 3(d)]. Results show that peak DA concentration varies dramatically with ramp duration. For example, the released DA concentrations are significantly different between waveforms with 50 and 75 ms added-ramp (one-way ANOVA and multiple comparison test, ). In fact, any of the DA release from 12.5, 25, and 50 ms ramp waveforms is larger than that from 75, 100, and 300 ms ramp waveforms (one-way ANOVA and multiple comparison test, ). Longer ramps preceding the square pulse invariably resulted in lower peak DA concentrations, even though more total light energy is delivered. Our findings thus demonstrate the induced transient DA efflux is critically dependent on the shape of temporal waveforms of optogenetic stimulation at the moment of light onset. On the other hand, difference in induced extracellular DA concentration is not necessarily a result from change in the amplitude and length of light stimulations. 3.4.Recovery of Presynaptic DA Revealed by Optogenetics and Kinetic AnalysesAs shown, upon the onset of optical stimulus, stored presynaptic DA is released, causing a transient local high concentration of extracellular DA in the submicromolar range. The extracellular DA then returns to the cytosol through DAT uptake to be prepared for a future release event. The DA must also be sequestered into synaptic vesicles to be recovered into a readily releasable state, in addition to simply being transported back into the cytosol.29 The releasable presynaptic DA pool is recovered dynamically during this process. Optogenetics is an ideal tool to unfold the dynamics behind the recovery of releasable presynaptic DA because conventional electrical stimulation also excites nondopaminergic neurons in the brain which may interfere with extracellular DA release, whereas optogenetics allows the selective activation of dopaminergic cells. For this optogenetic study, we used stimulation protocols with series of two consecutive light pulses applied at varying intervals. The voltammetry signature of DA is validated by the FSCV colorplot [Fig. 4(a)]. As shown in Fig. 4(b), the initial light pulse in each recording always elicits about the same peak DA concentration. As the interpulse interval is increased from 2 to 40 s, the second pulse elicits DA concentrations of gradually increasing amplitude. At short interpulse intervals of 2, 3, and 4 s, the readily releasable DA is less than 20% of the original amount, indicating depletion of releasable presynaptic DA. For recording with 40-s interpulse interval [Fig. 4(c)], the second pulse elicits DA level to 70% of that from the initial pulse, suggesting most of the releasable DA pool is restored. Complete recovery can be achieved on a scale of minutes, since 5-min intervals between the trials were sufficiently long so that the initial DA peak for each trial remained nearly constant in magnitude (). The recovery of DA in the two transgenic mouse subjects studied in this manner showed consistent results [Fig. 4(d)]. When compared with the extracellular clearance of DA recorded by FSCV [Fig. 4(d), red line], the recovery of readily releasable presynaptic DA takes place on a much longer time scale. Fig. 4Recovery of releasable presynaptic DA pool and extracellular DA kinetic analyses. (a) FSCV color plot in one recording in which two light pulses of optogenetic stimulation were set 6 s apart. (b) Series of recorded DA concentration traces under two light pulses with interpulse intervals of 2, 3, 4, 6, 10, 15, 20 s. Stimulations were kept at power and 1 s in length; data is from a set of seven recordings in one of the animals from d. Recordings are separated by 5 to 10 minutes to allow DA recovery. (c) Same DA concentration trace at 40 s interpulse interval. (d) Recovered releasable presynaptic DA on second pulses as a function of interpulse interval in two adult transgenic mice (blue and black). Red line indicates the clearance of extracellular dopamine molecules (i.e., DA concentration recorded by FSCV). (e) In the uptake kinetic analysis, simulated (red) versus recorded (black) FSCV DA concentration signal. FWHH, , is shown. 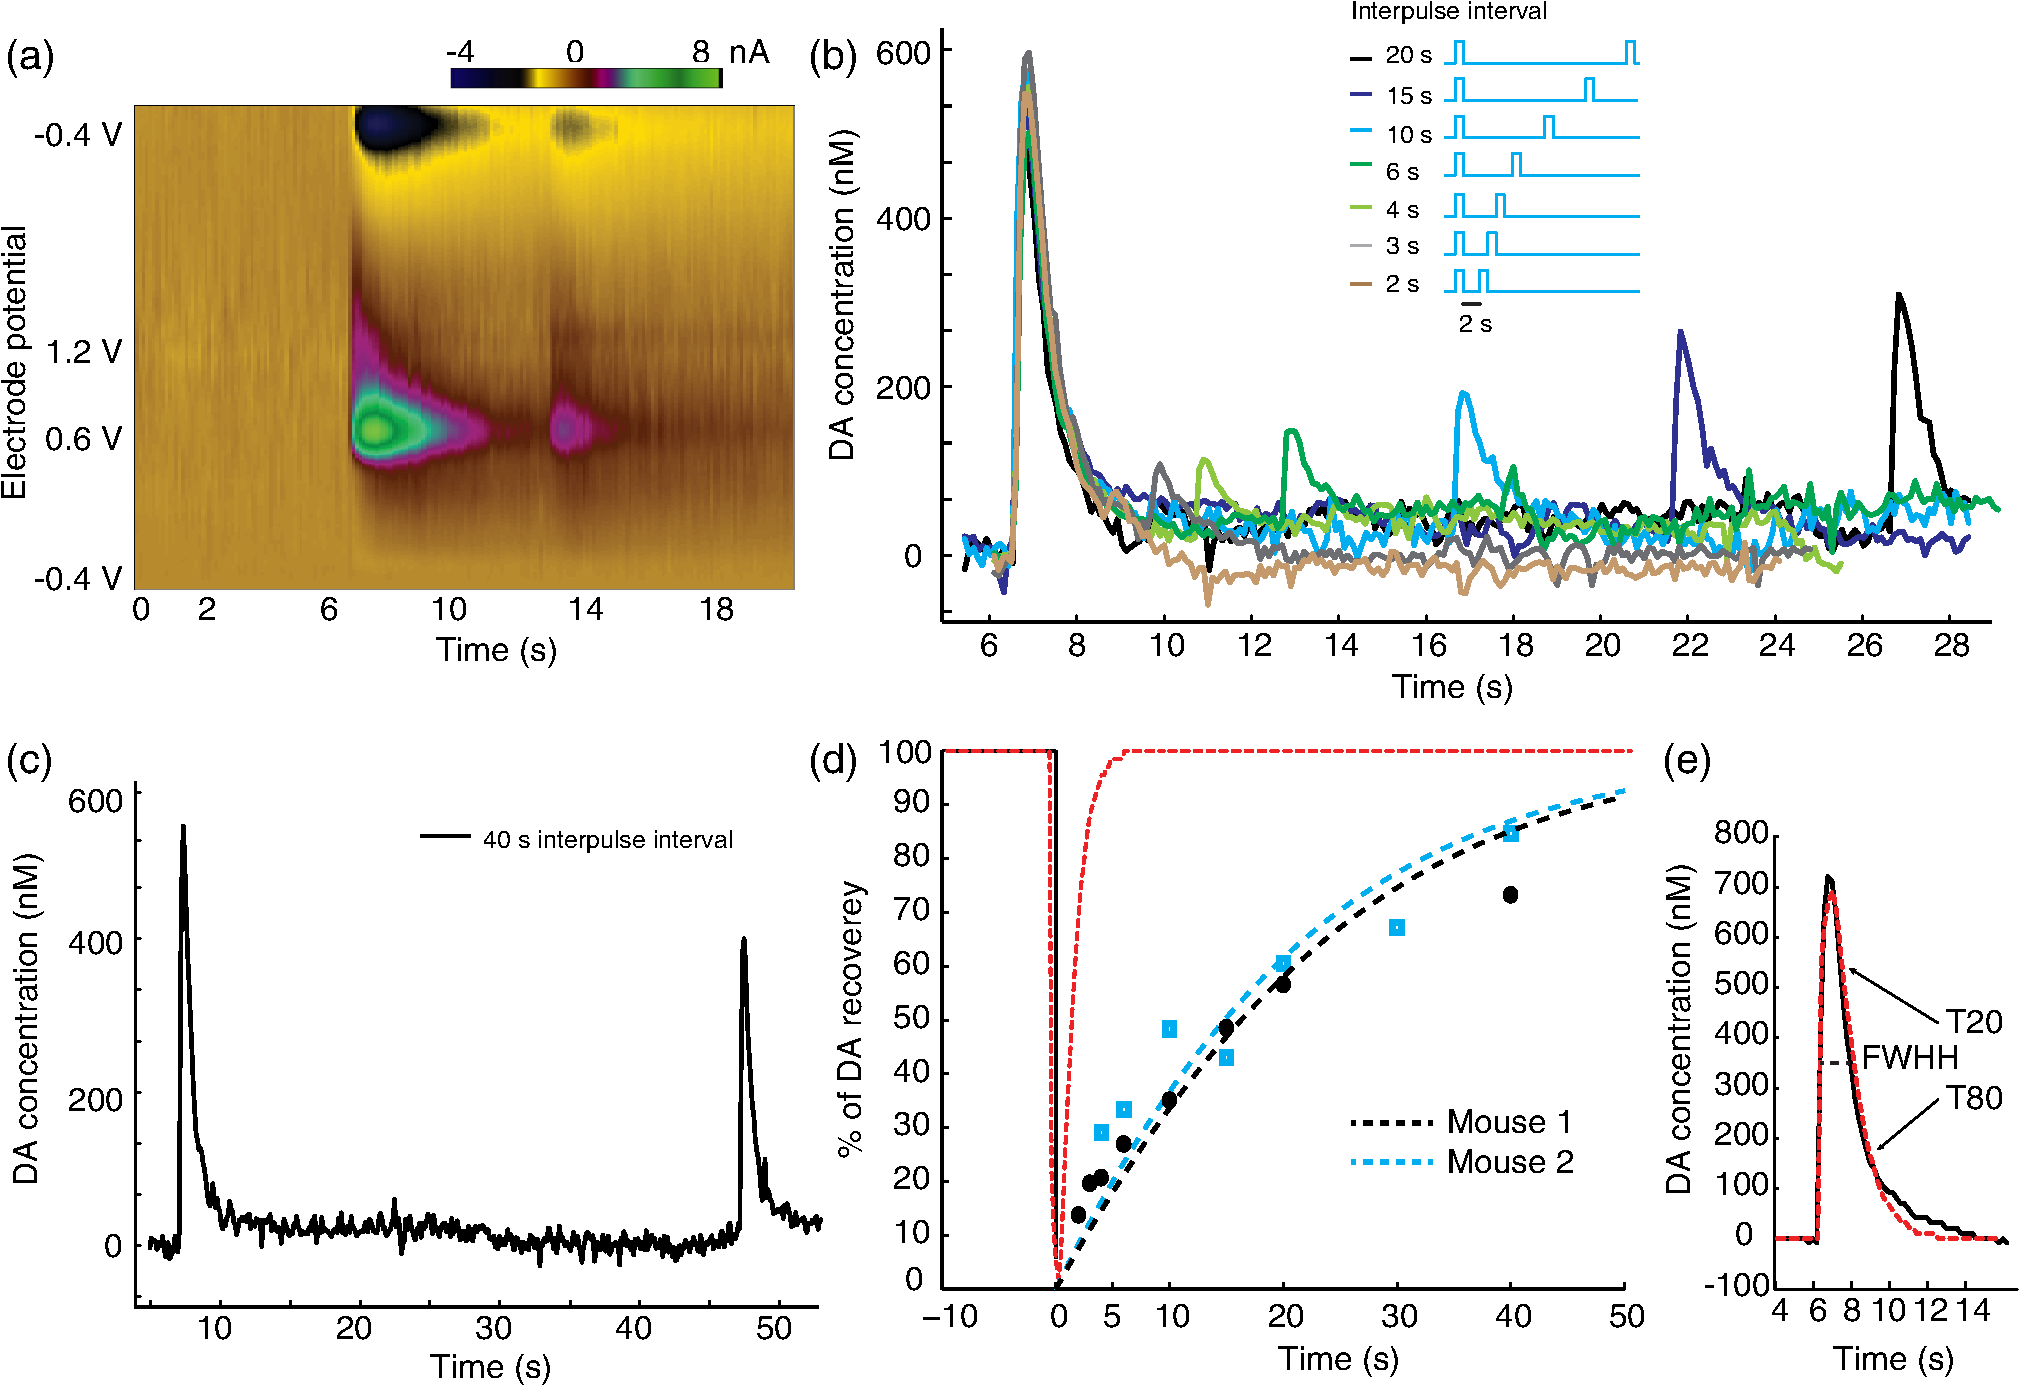 We further performed kinetic analyses on the uptake and recovery process of optogenetically induced DA concentration data. Michaelis–Menten kinetics (Methods) is used to model the DA uptake. The estimated best fit parameters were found to be the following: is taking of 30 [, Fig. 4(e)]; the first-order rate constant () is . This estimation is similar to the previously reported electrically evoked DA uptake rate constant of 4.0 to in the mouse NAc area31 and also lower than the reported rate constant in the CPu area.15 In addition, several other parameters describing the uptake kinetics such as full-width at half height (FWHH), (the time of 20% substrate clearance), and (the time of 80% clearance)20 were also extracted from the data. Optogenetically induced DA release peaks by single 1-s square pulses have a mean FWHH of , of , and of . We also applied Michaelis–Menten kinetics analysis to the releasable DA pool recovery data. In this case, a value of is used32,33 to fit the model, yielding values of 0.0585 and , respectively, for the two transgenic animals [Fig. 4(d), , 0.881]. The recovery of releasable presynaptic DA seems to be adequately fitted with the Michaelis–Menten model. The value obtained for recovery of releasable DA was much lower than the value obtained for DA uptake, which indicates that uptake into cytosol alone is not sufficient to prepare DA molecules for another immediate release. Therefore, this validates that other processes are involved in the recovery of releasable presynaptic DA. 4.DiscussionIn this study, a transgenic animal model was developed and used in which ChR2 is selectively expressed by specifically targeting dopaminergic neurons through DA transporter–Cre recombinase. By optogenetic stimulation of the NAc in forebrain slices, dopaminergic cell terminals were directly excited through the opsin, inducing a transient high concentration of DA (up to 700 nM). This optically induced DA release events had features similar to those induced by electrical pulses, i.e., oxidation current at 0.6 V in the cyclic voltammogram, similar peak concentration levels, and similar time profiles of release and uptake. We found optogenetically induced terminal DA release in this transgenic animal model appears to be very effective and controllable. The light power required to induce measurable DA release is remarkably low at . This light power is much lower than typical values used in the literature across in vitro and in vivo mammalian studies [;10 3 to (Ref. 17)]. We demonstrated that optogenetics has the capability to scale DA levels readily by varying the light power, pulse width, and shape of waveforms, which is helpful in mimicking the DA release level that occurs in natural behaviors where the DA concentration is smaller and more variable than those elicited by electrical stimulation.27 On a more microscopic scale, the demonstrated optical modulation of extracellular DA levels depends on the characteristics of the light-gated ion channel ChR2. With increasing light power delivered to the brain slices, the number of photons incident on an individual ChR2 protein per second increases linearly.18 Assuming a constant channel open probability in one “hit,” more opsin molecules will be activated at the DA neuron terminals under higher light power. This results in action potential generation or membrane depolarization leading to increased recruitment of DA axons and terminals. In the case of the optical ramp experiment, adding a ramp as a leading edge to an otherwise square pulse dramatically decreases the level of DA release. During the ramp, due to gradually increasing photon density, the opsins on DA terminals will be activated at statistically varying times instead of being activated simultaneously as when subjected to a square pulse. By contrast, a “nonramp” simple square pulse turns on a high photon density abruptly leading to synchronized excitation of a large number of opsins, which causes more DA axons to be recruited and therefore higher DA release. A previous study also showed how bursting-style electrical stimulation at the median forebrain bundle evoked far greater DA efflux than temporally equally spaced stimulation.34 We therefore speculate that the following is likely a general property of terminal dopaminergic response: more synchronized excitations, either through opsins or midbrain synaptic inputs, will result in higher DA release. This also suggests that lower physiological DA levels may not necessarily result from damage of DA neurons, but can be also due to loss of input synchrony. Future intracellular current validation experiments can serve to confirm this speculation. The recovery of the readily releasable presynaptic DA pool was tracked by applying two consecutive light pulses. A gradual recovery effect on the releasable DA (sometimes referred as paired-pulse inhibition35) was time-tracked over intervals of 2 to 40 s. Compared to similar studies which employ electric stimulation,36 we observed a stronger DA release inhibition effect 2 to 10 s after an optical pulse; whereas the qualitative trend of recovery is similar. We speculate that light stimulation may achieve better clearance of the releasable DA pool at the first pulse, since it can be delivered on a longer time scale due to the absence of artifacts. In addition, our results proved that the paired-pulse inhibition effect in electrical stimulations can be reproduced in the cell-type specific environment in optogenetics without recruiting other nondopaminergic neurons in the brain, thus excluding the possibility of other neuron types causing this effect. During the recovery of presynaptic DA pool, a number of processes are involved such as the DA transportation from the cytosol to presynaptic vesicles,37 docking of DA vesicles,38 or autoreceptor inhibition. Autoreceptor inhibition is shown to primarily happen within around 0.5 to 2 s after the first DA release, and therefore should not contribute to the general recovery effect seen on longer time scale.36 Therefore, our observed DA recovery is more likely related to the formation of presynaptic DA vesicles. A vesicular monoamine transporter-2 protein, which mediates DA transportation from cytosol to synaptic vesicles, also primarily obeys the Michaelis–Menten kinetics. We performed the Michaelis–Menten kinetic analysis on the recovery patterns of the DA pool, revealing values of 0.0585 and for the two animals, respectively. The average value of DA recovery is around 20 times lower than the of extracellular DA uptake. Beyond our basic studies, such quantitative understanding of DA dynamics has potential relevance for understanding drug addiction and reward-driven behavior, since the timing of DA release relative to behavioral events and the extent of attenuation is important. In addition, our results demonstrated that both the slower kinetics of recovery of the presynaptic DA pool and the faster kinetics of DA uptake by DAT can be studied using optogenetics in a cell-type specific stimulation context. With less interference from nondopaminergic cells and other artifacts, more accurate DA terminal kinetic analyses can be performed, which may contribute to future theoretical and/or modeling studies. DA transmission in the NAc in particular is critically involved in an animal’s reward-driven behavior, learning, emotions, and so on. A transient DA release in the NAc is often seen at anticipation or receipt of natural reward stimuli (such as for food39). Artificially induced transient DA release events (or “rewards”) can be an effective way for optogenetics to play a significant role in animals’ natural behaviors. Thus quantitative understanding of the interaction between the light and the terminal dopaminergic dynamics in the NAc is an important step forward. Behaviorally, realistic stimulation paradigms can be developed accordingly in the application of future in vivo experiments. 5.ConclusionsIn sum, our results demonstrate the feasibility of optogenetic modulation of DA release events in the NAc under various stimulation conditions in a simple optogenetic framework using transgenic animals. Optogenetics is shown to be both capable and efficient in eliciting high concentration extracellular DA release events, through targeted stimulation of exclusively dopaminergic cell axons and terminals in the NAc. A remarkably low-light power of around is required to elicit measurable DA release. Extracellular concentrations of DA release can be manipulated by controlling various parameters such as the light power, light pulse width, shape of waveform onset, or the temporal pattern of pulses delivered. Kinetic time constants and parameters for the recovery of the readily releasable DA pool as well as for DA uptake were obtained under this cell-type specific stimulation scenario. These results suggest that the combination of targeted optogenetic stimulation and simultaneous FSCV in transgenic animals provides a useful approach for the quantitative study of terminal dopaminergic dynamics. Further studies may utilize this approach to investigate various questions related to DA transmission in both healthy and diseased brain, or to design potential behavioral experiments with optogenetically modulated DA release. AcknowledgmentsWe wish to thank Saundra Patrick from Barry Connors’ lab at Brown University for providing the ChR2-EYFP transgenic mice. We thank Dr. Jordan Yorgason, Dr. Rodrigo España, and Wake Forest University Health Sciences for sharing the Demon Voltammetry and Analysis software. We thank the personnel at the Brown University Animal Care Facility for their assistance with animal care. This research was supported by the Defense Advanced Research Projects Agency (DARPA REPAIR N66001-10-C-2010, Co-PI: AN) and the National Science Foundation grants CBET-1402803 and CBET-1264816 (AN). ReferencesI. H. Franken, J. Booij and W. van den Brink,
“The role of dopamine in human addiction: from reward to motivated attention,”
Eur. J. Pharmacol., 526 199
–206
(2005). http://dx.doi.org/10.1016/j.ejphar.2005.09.025 Google Scholar
R. Cools,
“Role of dopamine in the motivational and cognitive control of behavior,”
Neuroscience, 14
(4), 381
–395
(2008). http://dx.doi.org/10.1177/1073858408317009 Google Scholar
W. Schultz,
“Behavioral dopamine signals,”
Trends Neurosci., 30
(5), 203
–210
(2007). http://dx.doi.org/10.1016/j.tins.2007.03.007 Google Scholar
B. W. Dunlop and C. B. Nemeroff,
“The role of dopamine in the pathophysiology of depression,”
Arch. Gen. Psychiatry, 64 327
–337
(2007). http://dx.doi.org/10.1001/archpsyc.64.3.327 Google Scholar
C. W. Olanow,
“The scientific basis for the current treatment of Parkinson’s disease,”
Annu. Rev. Med., 55 41
–60
(2004). http://dx.doi.org/10.1146/annurev.med.55.091902.104422 Google Scholar
C. A. Dackis and C. P. O’Brien,
“Cocaine dependence: a disease of the brain’s reward centers,”
J. Subst. Abuse Treat., 21 111
–117
(2001). http://dx.doi.org/10.1016/S0740-5472(01)00192-1 JSATEG Google Scholar
P. A. Garris et al.,
“Dissociation of dopamine release in the nucleus accumbens from intracranial self-stimulation,”
Nature, 398
(4), 67
–69
(1999). Google Scholar
A. G. Phillips, C. D. Blaha and H. C. Fibiger,
“Neurochemical correlates of brain-stimulation reward measured by ex vivo and in vivo analyses,”
Neurosci. Biobehav. Rev., 13
(2–3), 99
–104
(1989). http://dx.doi.org/10.1016/S0149-7634(89)80017-X NBREDE 0149-7634 Google Scholar
C. L. Liang et al.,
“Mitochondria mass is low in mouse substantia nigra dopamine neurons: implications for Parkinson’s disease,”
Exp. Neurol., 203
(2), 370
–380
(2007). http://dx.doi.org/10.1016/j.expneurol.2006.08.015 EXNEAC 0014-4886 Google Scholar
S. Threlfell et al.,
“Striatal dopamine release is triggered by synchronized activity in cholinergic interneurons,”
Neuron, 75
(1), 58
–64
(2012). http://dx.doi.org/10.1016/j.neuron.2012.04.038 NERNET 0896-6273 Google Scholar
C. E. Bass et al.,
“Terminal effects of optogenetic stimulation on dopamine dynamics in rat striatum,”
J. Neurosci. Methods, 214
(2), 149
–155
(2013). http://dx.doi.org/10.1016/j.jneumeth.2013.01.024 JNMEDT 0165-0270 Google Scholar
J. R. Melchior et al.,
“Optogenetic versus electrical stimulation of dopamine terminals in the nucleus accumbens elicits local modulation of presynaptic release,”
J. Neurochem.,
(2015). http://dx.doi.org/10.1111/jnc.13177 JONRA9 0022-3042 Google Scholar
A. R. Adamantidis et al.,
“Optogenetic interrogation of dopaminergic modulation of the multiple phases of reward-seeking behavior,”
J. Neurosci., 31
(30), 10829
–10835
(2011). http://dx.doi.org/10.1523/JNEUROSCI.2246-11.2011 JNRSDS 0270-6474 Google Scholar
H. Tsai et al.,
“Phasic firing in dopaminergic neurons is sufficient for behavioral conditioning,”
Science, 324 1080
(2009). http://dx.doi.org/10.1126/science.1168878 SCIEAS 0036-8075 Google Scholar
J. A. Stamford et al.,
“Diffusion and uptake of dopamine in rat caudate and nucleus accumbens compared using fast cyclic voltammetry,”
Brain Res., 448 381
–385
(1988). http://dx.doi.org/10.1016/0006-8993(88)91282-6 Google Scholar
G. D. Stuber et al.,
“Dopaminergic terminals in the nucleus accumbens but not the dorsal striatum co-release glutamate,”
J. Neurosci., 30
(24), 8229
–8233
(2010). http://dx.doi.org/10.1523/JNEUROSCI.1754-10.2010 JNRSDS 0270-6474 Google Scholar
I. Diester et al.,
“An optogenetic toolbox designed for primates,”
Nat. Neurosci., 14
(3), 387
–397
(2011). http://dx.doi.org/10.1038/nn.2749 Google Scholar
N. Grossman et al.,
“Modeling study of the light stimulation of a neuron cell with channelrhodopsin-2 mutants,”
IEEE Trans. Biomed. Eng., 58
(6), 1742
–1751
(2011). http://dx.doi.org/10.1109/TBME.2011.2114883 IEBEAX 0018-9294 Google Scholar
J. G. Roberts et al.,
“Real-time chemical measurements of dopamine release in the brain,”
Dopamine: Methods and Protocols, 275
–294 Humana Press(2013). Google Scholar
J. T. Yorgason, R. A. España and S. R. Jones,
“Demon voltammetry and analysis software: analysis of cocaine-induced alterations in dopamine signaling using multiple kinetic measures,”
J. Neurosci. Methods, 202
(2), 158
–164
(2011). http://dx.doi.org/10.1016/j.jneumeth.2011.03.001 JNMEDT 0165-0270 Google Scholar
R. M. Wightman et al.,
“Dopamine release is heterogeneous within microenvironments of the rat nucleus accumbens,”
Eur. J. Neurosci., 26
(7), 2046
–2054
(2007). https://doi.org/10.1111/j.1460-9568.2007.05772.x EJONEI 0953-816X Google Scholar
T. L. Vickrey, B. Condron and B. J. Venton,
“Rapid detection of endogenous dopamine changes in drosophila melanogaster using fast-scan cyclic voltammetry,”
Anal. Chem., 81
(22), 9306
–9313
(2009). https://doi.org/10.1021/ac901638z ANCHAM 0003-2700 Google Scholar
M. L. A. V. Heien et al.,
“Real-time measurement of dopamine fluctuations after cocaine in the brain of behaving rats,”
PNAS, 102
(29), 10023
–10028
(2005). https://doi.org/10.1073/pnas.0504657102 Google Scholar
E. W. Wightman, R. M. Kristensen and W. C. Kuhr,
“Real-time characterization of dopamine overflow and uptake in the rat striatum,”
Neuroscience, 25
(2), 513
–523
(1988). https://doi.org/10.1016/0306-4522(88)90255-2 Google Scholar
M. K. Zachek et al.,
“Microfabricated FSCV-compatible microelectrode array for real-time monitoring of heterogeneous dopamine release,”
Analyst, 135
(7), 1556
–1563
(2010). https://doi.org/10.1039/c0an00114g ANLYAG 0365-4885 Google Scholar
D. L. Felten and J. R. Sladek,
“Monoamine distribution in primate brain. V. Monoaminergic nuclei: Anatomy, pathways and local organization,”
Brain Res. Bull., 10
(2), 171
–284
(1983). https://doi.org/10.1016/0361-9230(83)90045-X BRBUDU 0361-9230 Google Scholar
J. J. Clark et al.,
“Chronic microsensors for longitudinal, subsecond dopamine detection in behaving animals,”
Nat. Methods, 7
(2), 126
–130
(2010). https://doi.org/10.1038/nmeth.1412 1548-7091 Google Scholar
P. A. Garris et al.,
“Real-time measurement of electrically evoked extracellular dopamine in the striatum of freely moving rats,”
J. Neurochem., 68
(1), 152
–161
(1997). https://doi.org/10.1046/j.1471-4159.1997.68010152.x JONRA9 0022-3042 Google Scholar
J. M. Brown, G. R. Hanson and A. E. Fleckenstein,
“Cocaine-induced increases in vesicular dopamine uptake: role of dopamine receptors,”
J. Pharmacol. Exp. Ther., 298
(3), 1150
–1153
(2001). JPETAB 0022-3565 Google Scholar
S. B. Ross,
“Synaptic concentration of dopamine in the mouse striatum in relationship to the kinetic properties of the dopamine receptors and uptake mechanism,”
J. Neurochem., 56
(1), 22
–29
(1991). https://doi.org/10.1111/j.1471-4159.1991.tb02557.x JONRA9 0022-3042 Google Scholar
E. A. Budygin et al.,
“Lack of cocaine effect on dopamine clearance in the core and shell of the nucleus accumbens of dopamine transporter knock-out mice,”
J. Neurosci., 22
(10), RC222
(2002). JNRSDS 0270-6474 Google Scholar
J. D. Erickson et al.,
“Distinct pharmacological properties and distribution in neurons and endocrine cells of two isoforms of the human vesicular monoamine transporter,”
Proc. Natl. Acad. Sci. U. S. A., 93
(10), 5166
–5171
(1996). https://doi.org/10.1073/pnas.93.10.5166 Google Scholar
S. R. Jones et al.,
“Dopamine Neuronal Transport Kinetics and Effects of Amphetamine,”
J. Neurochem., 73 2406
–2414
(1999). https://doi.org/10.1046/j.1471-4159.1999.0732406.x JONRA9 0022-3042 Google Scholar
F. G. Gonon,
“Nonlinear relationship between impulse flow and dopamine released by rat midbrain dopaminergic neurons as studied by in vivo electrochemistry,”
Neuroscience, 24
(1), 19
–28
(1988). https://doi.org/10.1016/0306-4522(88)90307-7 Google Scholar
M. J. Higgins and T. W. Stone,
“Bicuculline-resistant paired-pulse inhibition in the rat hippocampal slice,”
Br. J. Pharmacol., 109
(4), 1164
–1168
(1993). https://doi.org/10.1111/j.1476-5381.1993.tb13744.x Google Scholar
P. E. M. Phillips, P. J. Hancock and J. A. Stamford,
“Time window of autoreceptor-mediated inhibition of limbic and striatal dopamine release,”
Synapse, 44
(1), 15
–22
(2002). https://doi.org/10.1002/syn.10049 SYNAET 1098-2396 Google Scholar
S. J. Farnsworth et al.,
“Cocaine alters vesicular dopamine sequestration and potassium-stimulated dopamine release: the role of D2 receptor activation,”
J. Phar., 328
(3), 807
–812
(2009). Google Scholar
T. D. Parsons et al.,
“The last seconds in the life of a secretory vesicle,”
Cold Spring Harb. Symp. Quant. Biol., 60 389
–396
(1995). https://doi.org/10.1101/SQB.1995.060.01.043 CSHSAZ 0091-7451 Google Scholar
M. F. Roitman et al.,
“Dopamine operates as a subsecond modulator of food seeking,”
J. Neurosci., 24
(6), 1265
–1271
(2004). https://doi.org/10.1523/JNEUROSCI.3823-03.2004 JNRSDS 0270-6474 Google Scholar
BiographyYao Lu is a PhD candidate at Brown University. He received his BS degree in chemistry from Tsinghua University, China, in 2010, and his MS degree in chemistry from Brown University in 2013. His current research interests include optogenetic study on the dopaminergic system transmission, two-way optogenetic device development, and primate cortical dynamics from MEA recordings. Nicolette Driscoll is an undergraduate student in biomedical engineering at Brown University. She works in the area of neuroengineering. Ilker Ozden obtained his PhD in Physics from Brown University. He worked as a postdoctoral fellow in the laboratory of Samuel S.-H. Wang at Princeton University. He is currently an assistant professor of engineering (Research) at Brown University. Zeyang Yu is a PhD student in biomedical engineering at Brown University. He works in the area of neuroscience/neuroengineering. He conducted research in intracortical electrical stimulation induced cortical plasticity and deep brain stimulation in rodent model of Parkinson's disease. He is interested in using optogenetics-based methods to understand circuit mechanisms and develop novel treatments for neurodegenerative diseases, such as Parkinson’s disease. Arto V. Nurmikko is a L. Herbert Ballou University professor of engineering and physics at Brown. He received his degrees from University of California, Berkeley, with postdoctoral stays at MIT and Hebrew University. He conducts research in neuroengineering, brain sciences, nanophotonics and microelectronics, especially for the translation of device research to new technologies in biomedical, life science, and photonics applications. |


