|
The inherent advantages of red-shifted fluorescent proteins and fluorescent protein-based biosensors for the study of signaling processes in neurons and other tissues have motivated the development of a plethora of new tools. Relative to green fluorescent proteins (GFPs) and other blue-shifted alternatives, red fluorescent proteins (RFPs) provide the inherent advantages of lower phototoxicity, lower autofluorescence, and deeper tissue penetration associated with longer wavelength excitation light. All other factors being the same, the multiple benefits of using RFPs make these tools seemingly ideal candidates for use in neurons and, ultimately, the brain. However, for many applications, the practical utility of RFPs still falls short of the preferred GFPs. We present an overview of RFPs and RFP-based biosensors, with an emphasis on their reported applications in neuroscience. |
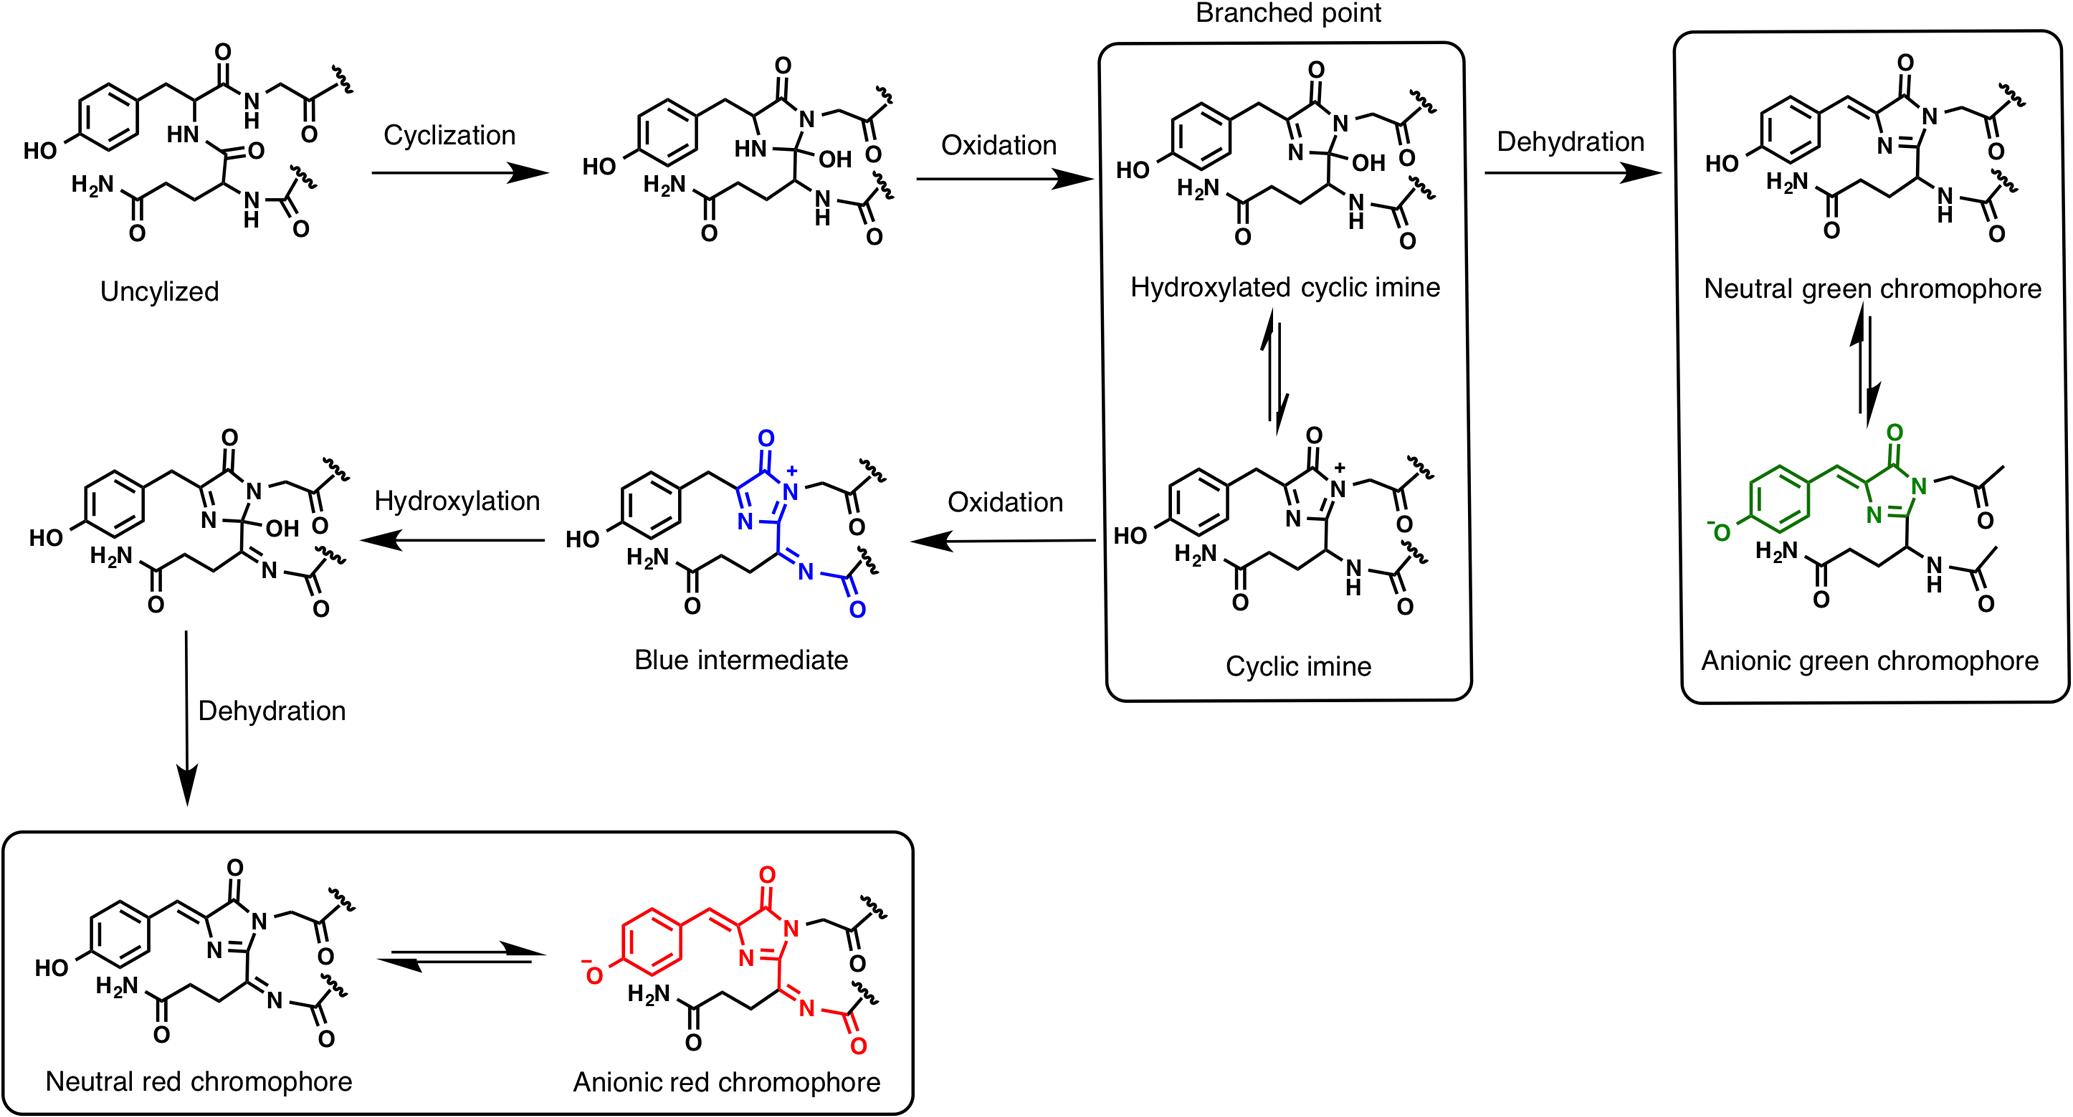
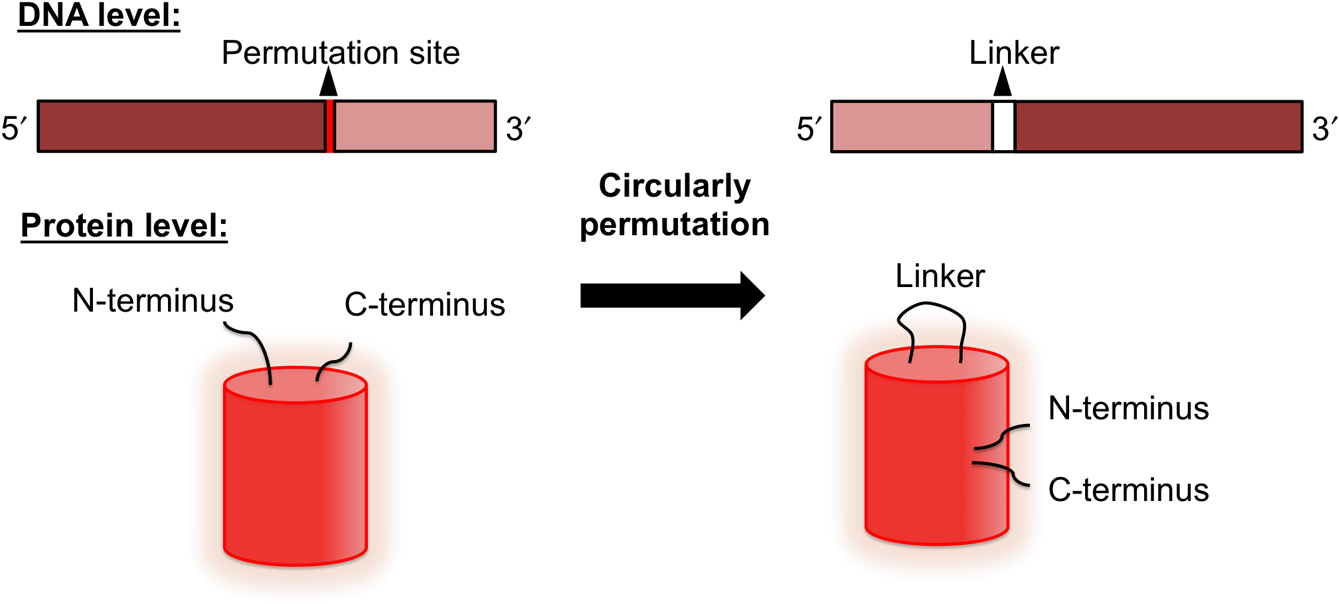
1.Red Fluorescent ProteinsEngineered fluorescent proteins (FPs) are the foundation of an indispensible toolbox for life science research that has revolutionized the ability of researchers to undertake real-time imaging of biomolecules in live cells. The current importance and ubiquity of FP-based techniques is discordant with the humble circumstances of the discovery of the first FP in the early 1960s. While extracting the bioluminescent protein Aequorin from Aequorea victoria jellyfish, Shimomura1 noticed a second protein, Aequorea victoria green FP (avGFP), that gave “a very bright, greenish fluorescence.” In the following decades, advances in molecular biology facilitated the elucidation of the chromophore structure,2 amino acid sequence, and gene sequence of avGFP.3 However, it was not until 1994 when the recombinant avGFP transgene was first used as a tool for molecular imaging. Specifically, it was used for visualization of gene expression in the worm Caenorhabditis elegans, thus demonstrating avGFP’s ability to fluoresce in cells from species other than jellyfish.4 Following this discovery, avGFP gained widespread acceptance as a revolutionary tool to visualize and track molecules and biochemical events in living cells and organisms. During the same period, improved variants of avGFP were engineered by manipulation and modification of the gene sequence.5–8 This resulted in creation of brighter green fluorescent variants6,8 and a number of variants with fluorescence maxima in the blue, cyan, green, and yellow regions of the visible spectrum.5,7 An avGFP variant that emits red fluorescence has been reported, but it is not bright enough to be practically useful for live cell imaging.9 One of the most significant advances following the cloning and recombinant expression of the avGFP transgene was the discovery of cyan, green, yellow, and red avGFP homologues in nonbioluminescent reef corals and sea anemones.10 The first reef coral-derived red FP (RFP) to be extensively studied and engineered was isolated from the sea anemone Discosoma sp. This RFP, originally designated as drFP583 but more commonly known as DsRed,11 has an excitation wavelength maximum () at 558 nm and an emission wavelength maximum () at 583 nm. Unfortunately, DsRed has a very slow maturation rate () and a substantial fraction of the protein molecules form a dead-end green fluorescent chromophore. The green product limits the utility of DsRed for multicolor imaging experiments with green fluorescent protein (GFP) variants.12 More critically, DsRed is an obligate tetramer with a tendency to form even higher order oligomers. Accordingly, any target protein fused to DsRed becomes tetrameric itself. This artificial “tetramerization” can disrupt the native localization of the target protein and, particularly in cases where the target protein is itself an oligomer, lead to protein aggregation.13,14 These drawbacks limit the applications of wild-type DsRed for imaging of subcellular structures and protein localization and served as the impetus for the engineering of a monomeric version. 1.1.Monomerization of RFPsThrough the use of protein engineering, tetrameric DsRed was converted into monomeric RFP 1 (mRFP1; ; ).15 In the DsRed tetramer, each subunit is engaged in distinct contacts with two of the other three subunits via two different interaction surfaces (Fig. 1). In order to monomerize DsRed, the protein–protein contacts at each interface were destabilized through mutations to charged residues such as lysine and arginine. Disruption of one interface yielded a dimeric intermediate and subsequent disruption of the remaining interface produced the monomeric FP (Fig. 1). While this process had the desirable outcome of producing monomeric variants, it also had the undesirable outcome of decreasing the intrinsic fluorescent brightness. A total of 33 mutations were introduced during the course of engineering mRFP1, including 13 interface-disrupting mutations and 20 fluorescence-rescuing mutations.16 Fig. 1Conversion of the wild-type tetrameric red fluorescent protein (RFP) DsRed to an engineered monomeric RFP. (a) Cartoon representation of the structure of wild-type tetrameric RFP DsRed. (b) Disruption of the first A–B interface produces an A–C dimer intermediate and subsequent disruption of the A–C interface produces a monomeric RFP. Interface-disrupting mutations are typically detrimental to the proper folding and chromophore maturation of the intermediate dimer or monomer; therefore, these variants must be rescued by directed evolution. Cartoon structures are based on PDB ID 1G7K.14 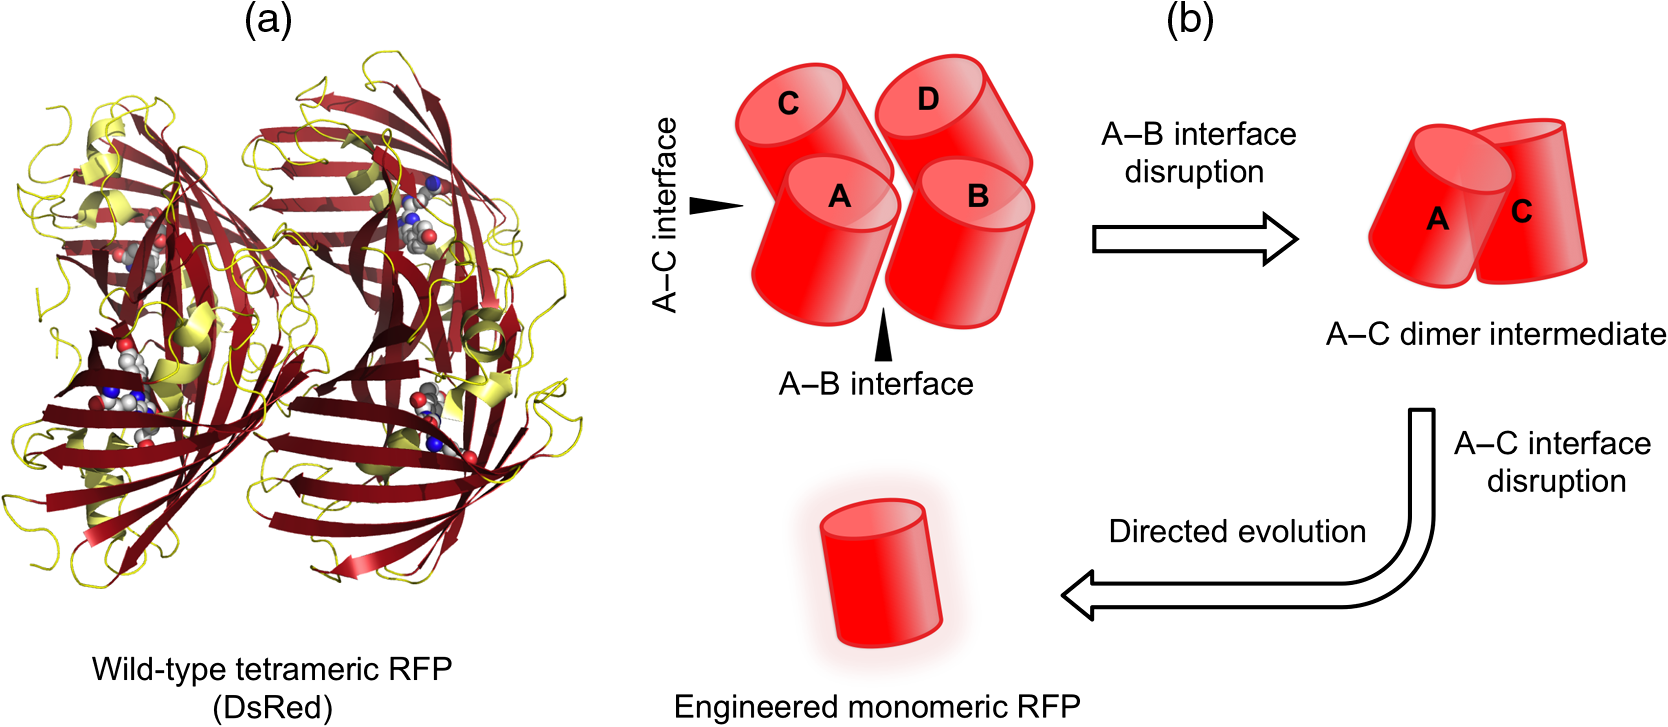 The monomeric nature of mRFP1 addresses the most critical shortcoming associated with tetrameric DsRed. Other favorable properties of mRFP1 include a much shorter maturation time () and a 25-nm red-shifted fluorescence emission at 607 nm. These advantages make mRFP1 suitable for the construction of fusion proteins for live cell fluorescence imaging, as well as in the multicolor fluorescence imaging with avGFP variants.15 Unfortunately, mRFP1 also exhibits disadvantages such as reduced fluorescence brightness and photostability. Efforts to further improve mRFP1 focused on higher brightness, color diversification, and improved photostability. These efforts eventually produced a number of useful RFP variants that are now known as the mFruit series.16,17 The prototypical RFP in the mFruit series is mCherry, which is generally considered to be the successor of mRFP1. 1.2.Structure and Chromophore Formation in RFPsThe x-ray crystal structures of DsRed and mCherry (as examples of prototypical RFPs) reveal that these proteins have a cylindrical shape created by eleven -strands wrapped around a central helix.18 This distinctive tertiary structure, which is shared with avGFP,13,14,19,20 is often referred to as a -can or a -barrel. The -barrel is in height and in diameter (Fig. 2). The chromophore is located near the middle of the central helix and is protected from the external environment by the eleven -strands that surround it. Fig. 2Structure of a representative monomeric RFP, mCherry. The secondary structure is shown in a cartoon representation with the helix colored in yellow, -strands colored in red, and loops colored in orange. The chromophore is shown in a stick representation with carbon atoms colored in gray, nitrogen atoms colored in blue, and oxygen atoms colored in red (PDB ID 2H5Q). 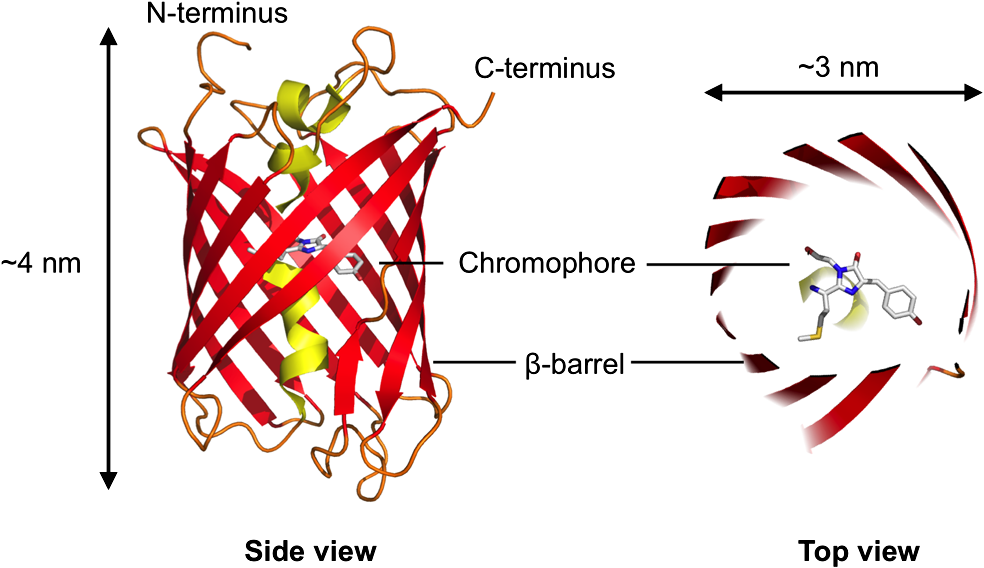 DsRed forms its chromophore from three sequential amino acids: Gln65, Tyr66, and Gly67.11 There have been several reports of investigations into the mechanism of chromophore formation.11,21,22 The currently preferred proposed mechanism invokes a branched pathway that can lead to either green or red chromophores.23 In this branched mechanism, the formation of the chromophore starts with the cyclization of the main chain to form a five-membered ring intermediate. This five-membered ring intermediate undergoes an initial step of oxidation to form a hydroxylated cyclic imine, which equilibrates with a cyclic imine. At this point, the mechanism branches. One branch results from the dehydration of the hydroxylated cyclic imine and leads to formation of the green fluorescent chromophore. On the other branch, irreversible oxidation of the cyclic imine leads to an intermediate with blue fluorescence. Further dehydroxylation and dehydration lead to formation of the red fluorescent chromophore of DsRed (Fig. 3).23,24 Insight into the mechanism of formation of the RFP chromophore, and the influence of its local environment on its spectral properties, opens new avenues for engineering FPs. Accordingly, a variety of RFP-derived colors have been engineered through engineering of the chromophore structure and its immediate environment, as will be described below. 1.3.Classification of RFPsFPs are now available in a wide range of colors spanning the visible spectrum.25–27 Relative to the more blue-shifted FPs, RFPs have a number of inherent advantages. Specifically, they are spectrally distinct from the commonly used avGFP variants, which makes them particularly useful for multicolor imaging applications. In addition, red-shifted fluorescence is associated with reduced background autofluorescence, lower phototoxicity, and better tissue penetration due to lower absorption.15,16,28 All other factors being the same, these properties should make RFPs superior probes for fluorescence imaging, particularly for in vivo applications. Before further discussing RFPs and RFP-based biosensors, it is important to mention that all of the widely used FPs are the products of a combination of rational design and directed evolution. Engineering by rational design involves making changes to the amino acid sequence using insights derived from inspection of high-resolution protein structures, possibly supplemented with additional insights obtained from computer modeling. In practice, rational design alone rarely results in useful new FPs due to unanticipated negative effects, such as diminished protein folding efficiency. By contrast, directed evolution does not require prior information on the protein structure. Instead, random mutagenesis is carried out on the gene encoding the protein-of-interest to produce large libraries of mutants, which are then screened for variants with the desired properties. The power of directed evolution for protein engineering is well established but suffers from being relatively labor intensive and requiring an effective screening protocol. This approach may also lead to the accumulation of multiple “silent” mutations in addition to the beneficial ones. Nonetheless, the thoughtful combination of both strategies has significantly benefited not only the engineering of RFPs and RFP-based biosensors but also essentially all of the FP variants currently available. For the sake of this review, we have categorized RFPs into three classes based on their fluorescence spectral profiles. These three classes are standard RFPs (i.e., short Stokes shift with emission maxima in the 550 to 620 nm range), far RFPs (i.e., emission maxima at ), and long Stokes shift (LSS) RFPs (Table 1). Phototransformable RFPs including photoactivatable RFPs,29 photoswitchable RFPs,30,31 and photoconvertible RFPs32 will not be further discussed in this review.33 It is important to note that the blanket designation of all of these proteins as “red” is misleading, since many of them emit wavelengths of light that would appear orange to the naked eye. Table 1Properties of selected red fluorescent protein (RFPs).
Note: EC: extinction coefficient; QY: quantum yield; brightness: the product of EC and QY; pKa: pH value at which the fluorescence intensity is 50% of maximal; bleaching: time for fluorescence intensity to be photobleached by 50% under arc-lamp illumination; maturation: time for fluorescence intensity to reach 50% maximal upon exposure to oxygen; N.D.: not determined. 1.4.Standard RFPsThe class of standard RFPs can be further subdivided into the “orange” RFPs with emission maximum at 550 to 580 nm and the “red” RFPs with emission maximum at 580 to 620 nm. One of the most important advances in generating standard RFPs in the orange and red spectral regions occurred during further evolution of mRFP1. Gln66, the first amino acid in the chromophore-forming tripeptide, is a critical determinant of the spectral profile of mRFP1 derivatives. For example, the Gln66Met mutation of mRFP1.1 and mCherry (; ) causes a slight red shift in the excitation and emission relative to mRFP1. Mutation of Gln66 to Cys or Thr was found to cause a blue shift in fluorescence. This observation inspired the development of mTangerine (; Gln66Cys), mOrange (; Gln66Thr) and mStrawberry (; Gln66Thr). The gene for the brightly fluorescent dimeric intermediate created during the process of DsRed monomerization was fused to a second copy of itself to create a “tandem dimer” RFP termed tdTomato ( and ). Due to the formation of an intramolecular pseudodimer, tdTomato behaves like an exceptionally bright monomeric RFP, making this a popular tool for many applications.16 Later RFP engineering efforts focused on improving the photostability of the mFruit variants. Such efforts led to the production of mOrange2 ( and ) with a 25-fold increase in photostability relative to mOrange.17 Due to their high brightness and photostability, mOrange and mCherry are generally the mFruit FPs of choice for live cell fluorescence imaging experiments when orange or red fluorescence is required. Several of the other mFruit FPs, including mTangerine and mStrawberry, are not often used for imaging as they suffer from low intrinsic brightness and poor photostability. In addition to the DsRed-derived monomeric variants, a second lineage of standard monomeric RFPs was engineered from the sea anemone Entacmaea quadricolor RFPs eqFP578 and eqFP611.48,34 For example, TagRFP (; ) is a bright monomeric RFP engineered from the dimeric RFP eqFP578.34 The Ser158Thr variant of TagRFP, designated as TagRFP-T, has improved photostability by approximately ninefold.17 Another member of the eqFP578 variant family is FusionRed ( and ), which exhibits decreased cytotoxicity when expressed in mammalian cells.37 The eqFP611 lineage has also yielded mRuby ( and ) and the brighter mRuby2 variant ( and ), which exhibit a relatively LSS () between the excitation and emission maxima.35,36 Although a growing number of engineered standard, far, and LSS RFPs have an “m” (as an abbreviation for monomeric) in front of their name, many do not behave as monomers when expressed in cells.49 In some cases, the protein may form dimers or higher order oligomers, which can lead to aggregation and/or cytotoxicity.37 Yet other RFPs, many of which are unambiguously monomeric, can form bright puncta in certain cells types due to accumulation in lysosomes or autophagosomes.50,51 1.5.Far RFPsFar RFPs with an emission maximum over 620 nm are of particular importance for in vivo and deep-tissue imaging in small animal models such as mice and rats. The spectral region between 600 and 1200 nm, bounded at the low wavelength by hemoglobin absorption and at the long wavelength by the increasing absorption of water, is known as the near-infrared “optical window.” This “optical window” has motivated FP engineers to push the excitation and emission wavelengths of RFP into the far-red and even the near infrared region.28 Early efforts in creating further red-shifted RFPs from mRFP1 yielded mPlum ( and ), mRaspberry ( and ),40 and mGrape ( and ).28 mCherry has also served as a template for the engineering of longer wavelength emission with the aid of a computationally designed library.52 This effort led to the creation of mRouge with a relatively long wavelength emission (maximum at 637 nm) but relatively low brightness (quantum yield of 0.03). Generally speaking, the far RFPs derived from DsRed are relatively dim and have not proven particularly useful for in vivo applications. Entacmaea quadricolor lineage has served as a more promising source of far RFPs than the DsRed lineage. For example, the eqFP578-derived mKate ( and ), mKate2 ( and ), and mNeptune ( and ) variants were engineered to exhibit bright far-red emission above 630 nm.28,38,39 Further efforts led to the development of two additional bright far-red mKate derivatives, mCardinal43 and TagRFP657.41 These variants have excitation maxima of 604 and 611 nm, respectively, and 659-nm emission maxima for both. To date, the most red-shifted emission maximum for an RFP is 675 nm for the mKate variant TagRFP675.42 1.6.LSS RFPsLSS typically refers to fluorophores for which the difference between the fluorescence excitation and emission maxima is larger than . The availability of LSS FPs provides researchers with a greater selection of spectrally resolvable colors for multicolor imaging application. LSS RFPs absorb blue light (usually in the range of to 460 nm) and fluoresce in the red region of the visible spectrum. They hold particular promise for two-photon fluorescence excitation due to the fact that they can be excited at the same two-photon wavelength as enhanced GFP (EGFP) using widely available pulsed laser systems. The first reported LSS RFP, known as mKeima, was developed from a chromoprotein from the stony coral Montipora sp.44 Later efforts were aimed at developing new LSS RFPs from standard and far RFPs. For example, three new LSS RFPs, LSSmKate1, LSSmKate2,46 and mBeRFP45 were engineered by providing an excited state proton transfer (ESPT) pathway for the mKate chromophore. Blue light excitation causes the chromophore to enter the excited state, which is associated with a decreased for the phenol group of the chromophore. Accordingly, following excitation of the neutral chromophore, the proton is transferred through the hydrogen bonds of the ESPT pathway to generate the lower energy excited state anionic state, which then emits red fluorescence. LSSmKate1 and LSSmKate2 outperform mKeima in terms of pH-stability, photostability, and brightness. Unlike mKeima and mBeRFP, LSSmKates lack the additional excitation peak associated with the anionic ground state of the red chromophore (i.e., normal Stokes shift red fluorescence) at around 560 nm. The lack of this peak facilitates their combined use with standard RFPs in multicolor fluorescence imaging. The strategy of engineering ESPT pathways into standard RFPs has also been applied to some of the mFruit RFPs, including mOrange and mCherry, to generate variants with blue-shifted fluorescence excitation.53 Further development produced LSSmOrange, which exhibits the highest brightness among all the LSS RFPs.47 2.RFP-Based BiosensorsFor monitoring of transcription and/or translation, visualization of organelles and other subcellular structures, and imaging of biomolecule motility and dynamics, the FP has a “passive” role.54,55 For many other applications, the FP is designed to play an “active” role, meaning that its inherent fluorescence intensity or hue will change in response to a specific cellular process of interest. These “active” FP constructs are interchangeably referred to as biosensors, sensors, indicators, or reporters. Examples of such FP-based biosensors include ones for intracellular pH,56–59 concentration of various ions,60 second messengers such as ATP,61 redox potential,62 membrane voltage,63 reactive oxygen species,64 and various enzyme activities.65 The utility of these biosensors can be extended by combining them with specific promoters and/or targeting signals for specific organelles, cells, or tissues, for either in vitro or in vivo applications. Needless to say, the inherent advantages associated with RFPs (i.e., reduced autofluorescence, reduced phototoxicity, and deeper tissue imaging) extend to RFP-based biosensors. As will be described in the following sections, the last decade has seen an increasing number of examples of researchers taking an established GFP-based biosensor and converting it to a red fluorescent homologue. While the resulting biosensor does have the inherent advantage of red shifted fluorescence, it often has other drawbacks that can limit its real-world performance relative to its green fluorescent brethren. 2.1.Classification of RFP-Based BiosensorsBiosensors are generally composed of two parts: a molecular recognition/binding element that interacts with the target and a signal-transducing element that converts the interaction into a detectable signal, such as fluorescence. Several approaches have been employed to convert RFPs into effective signal-transducing elements for a variety of recognition events. Based on the design strategies employed, RFP-based biosensors can be categorized into four main classes: FP complementation-based biosensors, Förster resonance energy transfer (FRET)-based biosensors, dimerization-dependent FP (ddFP)-based biosensors, and single FP-based biosensors. 2.2.RFP Biosensors Based on ComplementationComplementation-based biosensors are based on the interaction-induced reassembly of a complete and functional FP from two (or more) nonfunctional fragments. To use FP complementation to visualize a protein–protein interaction, one FP fragment is genetically fused to one gene of an interacting protein pair and the other fragment is fused to the other gene of the pair. Before complementation, both of the fragments are partially or fully unfolded and nonfluorescent. Interaction of the two fused partners brings the nonfluorescent FP fragments into close proximity and enables the formation of the functional FP (Fig. 4).66,67 The first report of an RFP complementation system described one based on the Gln66Thr variant of mRFP1.68 Later efforts used mCherry, mPlum, and mKate as the basis for FP complementation systems with longer emission wavelength and brighter fluorescence.69–71 Recently, an mNeptune-based complementation system was introduced and successfully applied for in vivo imaging of RNA–protein and protein–protein interactions.72 Fig. 4Biosensor design based on RFP complementation. Two potentially interacting proteins are fused to the two fragments of a split RFP. Interaction between the two protein partners bring the RFP fragments in close proximity, leading to reconstitution of an intact RFP and a corresponding increase in red fluorescence.  All FP complementation systems are associated with some drawbacks and limitations, including background self-association and temperature sensitivity.73 As FP complementation is effectively irreversible, it is useful for trapping both constitutive and transient protein–protein interactions. However, as formation of a mature chromophore in the reconstituted FP usually requires tens of minutes,71,74 FP complementation is unsuitable for dynamic visualization of reversible protein–protein interactions. Fortunately, the limitations imposed by the irreversibility and slow kinetics can be overcome using alternative biosensing strategies such as FRET or ddFPs. 2.3.RFP Biosensors Based on FRETFRET is the phenomenon of radiationless energy transfer via dipole–dipole interaction between two chromophores that have compatible energy levels and are close in distance (). The basic design principle of all FRET-based biosensors is to couple a specific binding event or covalent modification of a protein to a change of the energy transfer efficiency between the higher energy donor FP and the lower energy acceptor FP. A variety of FP FRET-based biosensors for detection of protein–protein interaction, ion concentrations, small molecule concentrations, and enzyme activities have been developed (Fig. 5).75 Fig. 5Representative Förster resonance energy transfer (FRET)-based biosensors with RFPs. (a) Intermolecular biosensors for protein–protein interaction. Unlike FP complementation-based biosensors, the FRET-based biosensors of protein–protein interactions are reversible. (b) Ion/small molecule biosensors. An intramolecular protein complex is formed, or a conformation changed, upon the binding of a specific ion or small molecule. (c) Protease biosensors where the two FPs are initially linked by a protease substrate sequence.  The design of intermolecular FRET-based biosensors for protein–protein interaction detection is similar to that of FP complementation. However, rather than having the interacting proteins of interest fused to the FP fragments, they are fused to the donor FP and acceptor FP. FRET efficiency increases when the two protein partners interact to form a complex. For biosensor designs intended for detection of a protein conformational change, an intramolecular FRET-based biosensor can be constructed by linking both donor and acceptor FPs in a single polypeptide. The intramolecular biosensor design offers a more consistent signal output due to the fixed ratio of donor and acceptor concentrations in different cells. The cyan and yellow FP-based FRET donor and receptor pair is an excellent choice for the construction of genetically encoded FRET biosensors due to the large spectral overlap and their relatively high brightness. However, the development of various monomeric RFP variants has now provided new and exciting possibilities to construct red-shifted FRET pairs. For example, mRuby2, currently one of the brightest monomeric RFPs, has been paired with a bright GFP variant, Clover.36 This new FRET pair confers a greater dynamic range and photostability compared to various existing cyan FP (CFP)- and yellow FP (YFP)-based FRET biosensors. The availability of new RFPs also provides opportunities to construct new FRET pairs with novel spectral properties. One of the main justifications for such efforts is to achieve spectral compatibility with the CFP–YFP pair.76,77 For example, the mOrange–mCherry pair is spectrally orthogonal to the CFP–YFP pair, though FRET biosensors based on this pair tend to have only modest signal changes.78,79 The orange–red FRET pair was recently improved by developing self-associating variants of mOrange and mCherry by reversion of the hydrophobic dimeric interface breaking mutations.80,81 LSS mOrange and mKate2 are yet another orange–red FRET pair that has been simultaneously imaged with a CFP–YFP FRET pair using a single laser excitation wavelength.47 Generally speaking, the single most important advantage of FRET-based biosensors is that they provide ratiometric fluorescent changes that can typically be calibrated, making this class of indicators most appropriate for quantitative imaging. The single major disadvantage of FRET-based biosensors is that the fluorescent changes are often quite small (as low as a few percent, though there are some with much larger changes).82 A second disadvantage is that FRET-based biosensors require two distinct emission channels for ratiometric imaging, making it challenging to use more than one type of biosensor in a single experiment. 2.4.RFP Biosensors Based on ddFPsddFPs are a relatively recent addition to the FP toolbox that provide an alternative platform for biosensor design.83,84 The ddFP strategy is based on a pair of FPs, engineered from dTomato, which exhibit minimal to no fluorescence in their monomeric states. Upon heterodimerization, the chromophore environment of one FP is modified such that the anionic state of the chromophore is stabilized, leading to an increase in red fluorescence. The first ddFP to be engineered was a red variant (ddRFP) with a 10-fold increase in red fluorescence intensity upon heterodimer formation. The dimerization-dependent fluorescence change of ddRFP was used for detection of reversible -dependent association of calmodulin (CaM) and M13 in live cells, as well as imaging of caspase-3 activity during apoptosis (Fig. 6).84 Green and yellow ddFP pairs were later engineered and applied for detection of membrane–membrane contacts at the mitochondria associated membrane.83 Fig. 6ddRFPs and ddRFP-based biosensors. (a) Fluorescence intensity increase upon the formation of heterodimeric ddRFP pair. (b) ddRFP-based caspase-3 biosensor. (c) ddRFP-based biosensor. 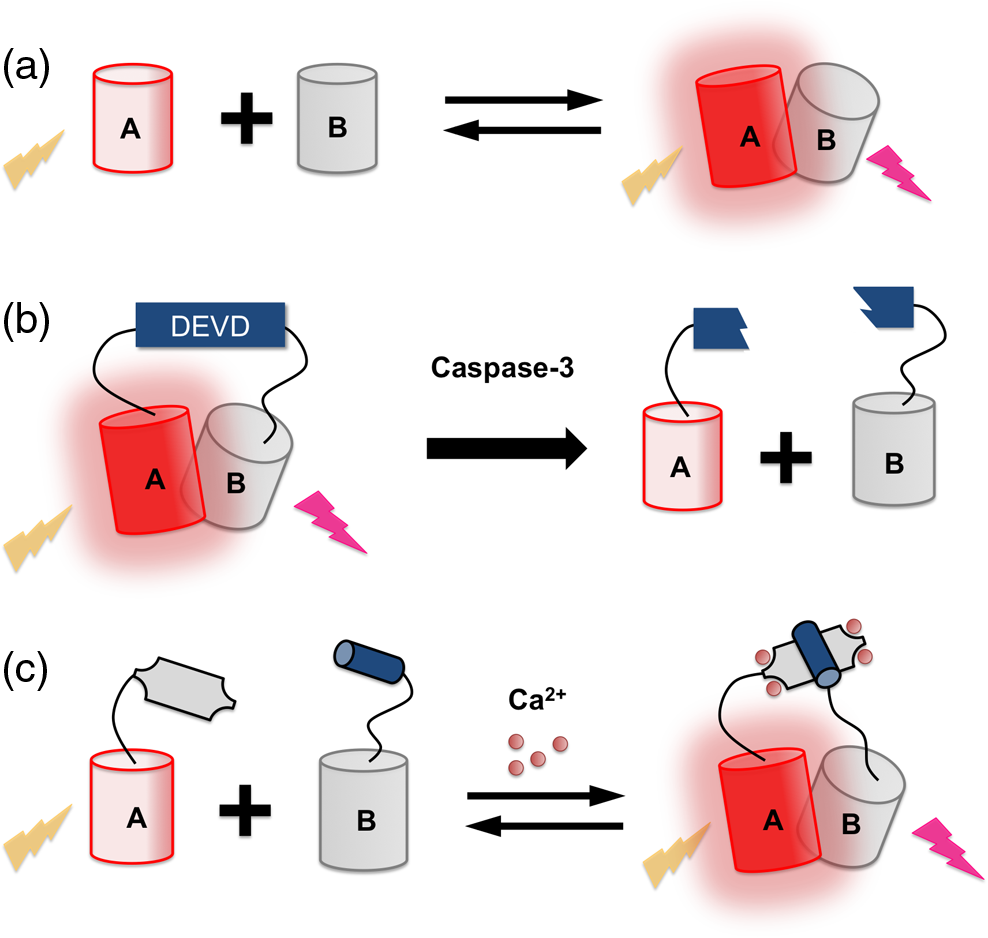 Although conceptually analogous to FP complementation, the advantage of ddFP lies in the reversibility of heterodimer formation. Accordingly, they can be used to visualize dynamic and reversible protein–protein interactions in live cells, similar to how FRET is used. Compared to FRET-based biosensors, ddFPs do have an inherent advantage for multiparameter imaging. Specifically, a ddFP occupies just one color channel (i.e., green, yellow, or red) while FRET-based biosensors occupies two (i.e., donor and acceptor). One drawback of ddFPs is that they will spontaneously dimerize at relatively high concentrations (above ). By contrast, FRET pairs have only a weak tendency to dimerize and the dissociation constants are typically much higher ().81 2.5.RFP Biosensors Based on a Single FPAs their name implies, single FP-based biosensors contain only one engineered FP signal-transduction domain. The biosensor is engineered such that the FP responds to the biochemical stimulus of interest with a reversible change in fluorescence intensity (intensiometric), excitation spectral profile (excitation ratiometric), or emission spectral profile (emission ratiometric). The major advantage of single FP-based biosensors is that they typically exhibit a substantially larger intensity change at a single wavelength than a FRET-based biosensor. Furthermore, single FP-based biosensors have the benefit of using a smaller region of the visible spectrum window, enabling the simultaneous use of more than one fluorophore color. Yet another advantage relative to intramolecular FRET-based biosensors is the smaller protein size. One way to create a single FP-based biosensor is to take advantage of the intrinsic sensitivities of certain FP variants [Fig. 7(a)]. For example, all FPs exhibit some pH dependence and some have apparent close to physiologically relevant pH values. Among the many examples of such FP-based pH biosensors, the most widely used are the pHlourin variants of avGFP.56 The chloride ion sensitivity of YFP is another example of intrinsic FP sensitivity.85,86 It has also been proven possible to rationally engineer intrinsic sensitivity into an FP by incorporating an analyte binding site directly on the exterior of the FP barrel. For example, the reduction/oxidation sensitive roGFP87,88 and the calcium ion () sensitive CatchER were engineered in this way.89 Fig. 7Single FP-based biosensors. (a) Single FP-based pH biosensor based on intrinsic sensitivity. (b) Single FP-based biosensor with an extrinsic binding domain. 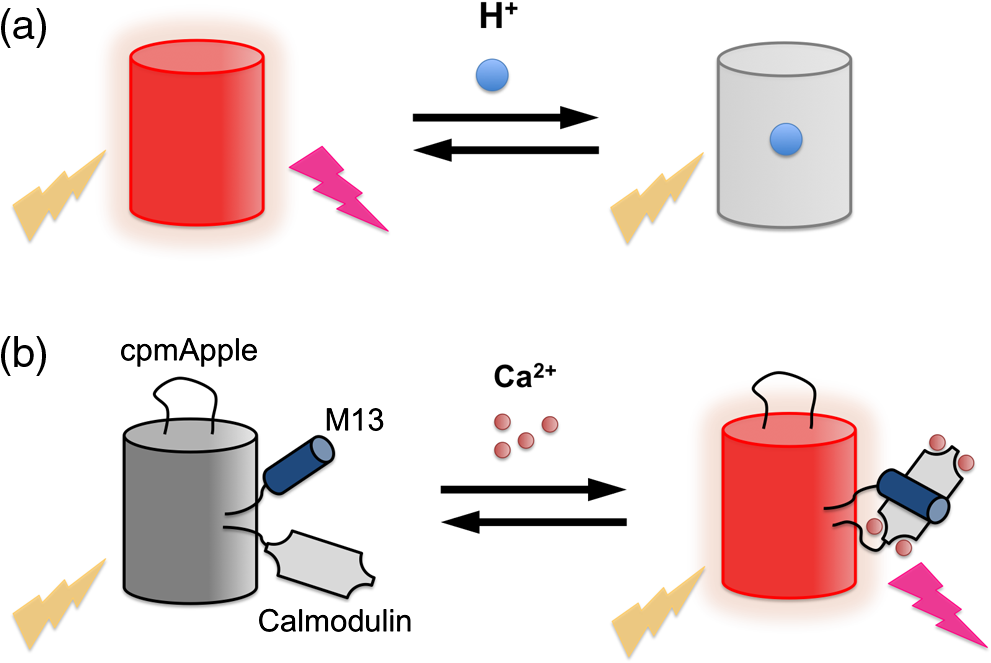 The majority of intrinsic single FP-based biosensors are green or yellow fluorescent, and only a few intrinsic red single FP-based biosensors have been described. Examples include mNectarine, which was applied for detection of nucleoside transport,90 and pHTomato, which was used to report synaptic neurotransmitter release at nerve terminals.57 An excitation ratiometric pH biosensor, pHRed, was engineered from LSS RFP mKeima and used to image energy-dependent changes of cytosolic and mitochondrial pH.58 Recently, a pH-sensitive RFP, known as pHuji, was engineered from mApple and used for imaging of endocytosis and exocytosis.59 Another strategy for engineering a single FP-based biosensor is to genetically incorporate an extrinsic analyte recognition domain into the FP. The extrinsic domain is typically fused to one of the termini or inserted into a solvent-exposed region of the FP in order to minimize disruption of the protein structure. For the FP to work as an effective signal transducer, the extrinsic recognition domain must be in relatively close proximity to the chromophore to allosterically modulate the chromophore environment upon interaction with the target analyte. It is important to note that the FP chromophore is well protected in the center of the barrel structure, and the termini and loop region are relatively distant from the chromophore. An extrinsic recognition domain fused to one of the termini is unlikely to have much influence on the chromophore environment. To circumvent this problem, researchers rely on the strategy of circular permutation (Fig. 8). Circularly permutated FPs are generated by genetically linking the original N- and C-termini with a short polypeptide linker and introducing new N- and C-termini at a position elsewhere in the protein.91,92 For FP-based biosensor construction, the new N- and C-termini are introduced close to the chromophore such that conformational changes in the extrinsic recognition element cause alterations in the chromophore environment and, correspondingly, in the fluorescence intensity or hue of the FP.93–96 3.Emerging Toolset for Neurophotonics Based on RFPsAn increasing number of RFP-based probes are being applied in neurophotonic applications. Representative applications include tagging of specific neuron subsets,97 visualizing membrane depolarization,98 and monitoring ion concentration dynamics of downstream signaling cascades.99 Importantly, RFP-based neural activity biosensors offer the possibility of combining with blue-light activated optogenetic actuators, such as channelrhodopsin-2 (ChR2), for simultaneous stimulation and readout of neuronal activities. 3.1.RFP-Based Ca2+ Biosensorsis the principal secondary messenger associated with neuronal signaling pathways and is reliably elevated during the firing of action potentials. Accordingly, FP-based biosensors are exceptionally useful for the imaging of neuronal activity in contexts ranging from in vitro cultured cells to in vivo brain activity in behaving animals. Over the last decade, the GCaMP-type single FP-based biosensors have emerged as the predominant technology for in vivo imaging of neuronal activity.100,101 GCaMP is composed of cpGFP with M13 and CaM fused to the N- and C- termini, respectively. Structural studies reveal that in its free state, the fluorescence is quenched because the chromophore is exposed to bulk solvent. In the presence of , CaM wraps around M13 and forms a new interaction with the chromophore that stabilizes the phenolate (i.e., the fluorescent form) state. Following the GCaMP-type design strategy, a red biosensor known as R-GECO160 was created by replacing the cpGFP in an improved GCaMP variant with a circularly permuted variant of mApple. R-GECO1 was further optimized and engineered into spectrally diversified and low-affinity variants, including an improved R-GECO1.2, a blue-shifted O-GECO, a red-shifted CAR-GECO,102 a highlightable GR-GECO,103 an LSS REX-GECO104 and low-affinity red-GECO variants.105 RCaMP, a similar single RFP-based biosensor, was engineered from the cpmRuby template.106 Further improved variants of R-GECO1, confusingly named R-CaMP1.07 and R-CaMP2, have recently been reported.107,108 The development of mApple-based R-GECO160 and mRuby-based RCaMP,106 has unlocked new opportunities for simultaneous multicolor optical imaging for neural activities as well as integration of optogenetics for orthogonal activation and measurement. For example, R-GECO1 has been used to report neural activity in vivo in the zebrafish retinotectal system, with comparable performance to the green biosensor GCaMP3.109 CAR-GECO1, a red-shifted variant based on R-GECO1, was used for optogenetic activation and imaging concurrently in combination with channelrhodopsin-2(T159C)-EGFP in mouse neocortical slice culture.102 RCaMP, along with green glutamate sensor, was used for imaging synaptic input and output in Caenorhabditis elegans neurons.93 The LSS REX-GECO1 was used in the eye and optic tectum of albino Xenopus laevis tadpoles for two-photon fluorescence imaging of dynamics in vivo.104 Due to an inherent tendency of mApple to undergo photoactivation (i.e., a temporary increase in brightness that can be easily confused with a true elevation) with blue light, one must be cautious when using R-GECO series indicators with optogenetic tools requiring violet/blue activation light.102 In comparison, this photoactivation effect was not observed from mRuby-based RCaMP series indicators. Therefore, RCaMP should be a better-suited indicator for use with ChR2 or other violet/blue light activatable optogenetic tools. 3.2.RFP-Based Voltage BiosensorsFor imaging of neuronal activity, the signals obtained from an FP-based biosensor are, necessarily, only a surrogate for action potentials. Nevertheless, this indirect measure has proven to be very useful, largely because biosensors have traditionally been far superior to voltage biosensors in terms of their brightness and magnitude of fluorescence response. The tradeoffs associated with the reliance on signals (which have much slower temporal dynamics than voltage changes) are that neither fast series of spiking events, nor subthreshold voltage changes, can be visualized. In order to overcome these limitations, biosensors that directly report on membrane voltage are needed.110 Accordingly, the FP research community has been pursuing the development of voltage indicators for as long as they have been pursuing FP-based biosensors, though with more modest success to date. Both FRET-based and single FP-based voltage sensors for imaging of membrane potential changes in neurons have been reported. These indicators are constructed by tethering an FP, or a FRET pair of FPs, to a voltage-sensitive membrane protein, such that a voltage-dependent conformation change alters either the brightness of the FP or the FRET efficiency, respectively. Some notable examples include FlaSh/Flare,111,112 SPARC,113 and the voltage-sensitive FPs.110,114,115 These indicators have undergone improvements resulting in variants with faster kinetics,116 improved cell surface targeting,117 and larger signal changes.113 Despite these improvements, voltage indicators have been notoriously challenging to apply in research applications, especially when judged against highly optimized and robust GCaMP-type indicators. One of the most pressing issues with FP-based voltage sensors was their relatively small signal changes, with all sensors reported prior to 2012 exhibiting maximal fluorescence changes of .118,119 In 2012, Jin et al.120 reported a GFP-based voltage biosensor, Arclight, with an unprecedented 35% decrease in fluorescence intensity in response to a 100 mV depolarization. Arclight provides sufficient brightness and signal change to enable detection of single action potentials and subthreshold activities in individual neurons and dendrites, although with relatively slow response kinetics. Further engineered Arclight variants provided faster kinetics but at the expense of reduced signal changes.121 Accelerated sensor of action potentials 1 (ASAP1) is another recently developed green fluorescent voltage sensor.95 As its name implies, it offers faster kinetics relative to Arclight and enables continuous monitoring of membrane potential in neurons at kilohertz frame rates using standard epifluorescence microscopy. Efforts to develop red fluorescent voltage indicators have lagged behind the efforts to develop green ones. VSFP_cpmKate, VSFP3.1_TagRFP, and VSFP3.1_mKate2 are some examples of voltage indicators that emit in the red region of the visible spectrum.122,123 However, the fluorescence brightness, response amplitude, and kinetics of these red-shifted VSFPs are not comparable to that of Arclight or ASAP1. In unpublished work, our group has developed a red fluorescent voltage biosensor, designated FlicR1, which is based on the voltage-sensing domain of Arclight and the cpmApple of R-GECO1 (Ahmed Abdelfattah, unpublished results). 3.3.RFP-Based Synaptic Transmission BiosensorsYet another important application of FP-based biosensors is the detection of synaptic transmission. The first FP designed for the purpose of detecting vesicle fusion at the synapse was synapto-pHluorin.56,124 To engineer synapto-pHluorin, a pH-sensitive variant of avGFP, known as superecliptic pHluorin (SEP),125 was fused to the luminal side of the vesicular protein, synaptobrevin. SEP is initially quenched by the acidic conditions of the vesicle lumen but increases in fluorescence -fold upon release of the vesicle contents following fusion with the plasma membrane. Fusing SEP to proteins highly localized to synaptic vesicles, such as synaptophysin126 or the glutamate transporter VGlut1,127 resulted in improved signal-to-noise ratios. As with other classes of biosensors, efforts to develop an RFP-based biosensor of synaptic fusion lagged far behind the development of the GFP-based biosensor. By taking advantage of the pH-sensitive property of the orange FP mOrange2, a red-shifted biosensor was constructed by fusion to VGlut1.128 Designated as VGlut1-mOrange2, this probe was used in conjunction with GCaMP3 to simultaneously image synaptic vesicle recycling and changes in cytosolic . In a similar application, the pH-sensitive pHTomato RFP was coexpressed with GCaMP3 for concomitant imaging of neurotransmitter release and presynaptic transients at single nerve terminals.57 Coexpression of pHTomato and ChR2 provided an all-optical approach for multiplex control and tracking of distinct circuit pathways. Another approach to visualizing synaptic transmission is to detect the neurotransmitter itself. For example, the genetically encoded biosensor GluSnFR is a FRET-based biosensor that incorporates the periplasmic glutamate-binding protein GltI as a molecular recognition element.129 A single FP-based green glutamate biosensor called iGluSnFR was also engineered by insertion of a cpGFP into the glutamate-binding domain GltI.93 In unpublished work, our group has converted iGluSnFR93 into a red fluorescent variant by substituting the cpGFP with the cpmApple domain from R-GECO1 (Jiahui Wu, unpublished results). 4.Conclusion and OutlookSince the advent of DsRed and its subsequent monomerization, the number of useful RFP variants and RFP-based biosensors has continued to grow steadily. These enhanced RFPs and RFP-based biosensors have brought new color options to the existing FP spectrum and provided new possibilities for multiparameter investigations of biological problems. Unfortunately, despite the great strides that have been made, few of the RFPs and RFP-based biosensors come close to matching their green fluorescent counterparts in terms of utility for neuroscience research. Both anecdotally and in published reports, many RFP and RFP-based biosensors have been reported to perform suboptimally in transfected neural tissues or transgenic animals.97 While this is disappointing, one important factor to keep in mind is that optimization of some of the most effective GFP-based biosensors (e.g., GCaMP) has been ongoing for more than a decade. In comparison, practically all of the RFP-based biosensors reviewed here were reported within the past 4 years and are early-generation versions that will surely improve with future optimization. One of the problems most commonly encountered with RFPs is their unexpectedly dim fluorescence and protein mislocalization or accumulation, often manifested as bright puncta in the soma. Mounting evidence attributes these bright puncta to accumulation of RFPs in lysosomes or autophagosomes.50,51 RFPs can also suffer from reversible conversion to a transient dark state.130,131 Protein engineers continue to work on creating ever-better RFPs, yet, to date, an RFP that matches the best avGFP variants in all performance characteristics remains elusive. Nevertheless, we remain confident that such an RFP, or far RFP, will be engineered in the near future. In addition, we expect that with further efforts and advanced screening techniques,132 the performance of RFP-based biosensors will catch up to and eventually exceed their green counterparts. Ultimately, we expect that the inherent benefits associated with longer wavelength fluorescence will allow RFPs to surpass GFPs as the default fluorophores for live cell imaging and neurophotonic applications. AcknowledgmentsWe thank the Natural Sciences and Engineering Research Council of Canada, the Canadian Institutes of Health Research, the Alberta Glycomics Centre, the University of Alberta (Queen Elizabeth II scholarship to T.L.), and Alberta Innovates (scholarship to Y.S.) for funding support. ReferencesO. Shimomura, F. H. Johnson and Y. Saiga,
“Extraction, purification and properties of aequorin, a bioluminescent protein from the luminous hydromedusan, Aequorea,”
J. Cell. Comp. Physiol., 59
(3), 223
–239
(1962). http://dx.doi.org/10.1002/(ISSN)1553-0809 JCCPAY 0095-9898 Google Scholar
O. Shimomura,
“Structure of the chromophore of Aequorea green fluorescent protein,”
FEBS Lett., 104
(2), 220
–222
(1979). http://dx.doi.org/10.1016/0014-5793(79)80818-2 FEBLAL 0014-5793 Google Scholar
D. C. Prasher et al.,
“Primary structure of the Aequorea victoria green-fluorescent protein,”
Gene, 111
(2), 229
–233
(1992). http://dx.doi.org/10.1016/0378-1119(92)90691-H GENED6 03781119 Google Scholar
M. Chalfie et al.,
“Green fluorescent protein as a marker for gene-expression,”
Science, 263
(5148), 802
–805
(1994). http://dx.doi.org/10.1126/science.8303295 SCIEAS 0036-8075 Google Scholar
R. Heim, D. C. Prasher and R. Y. Tsien,
“Wavelength mutations and posttranslational autoxidation of green fluorescent protein,”
Proc. Natl. Acad. Sci. U. S. A., 91
(26), 12501
–12504
(1994). http://dx.doi.org/10.1073/pnas.91.26.12501 PNASA6 0027-8424 Google Scholar
R. Heim, A. B. Cubitt and R. Y. Tsien,
“Improved green fluorescence,”
Nature, 373
(6516), 663
–664
(1995). http://dx.doi.org/10.1038/373663b0 NATUAS 0028-0836 Google Scholar
R. Heim and R. Y. Tsien,
“Engineering green fluorescent protein for improved brightness, longer wavelengths and fluorescence resonance energy transfer,”
Curr. Biol., 6
(2), 178
–182
(1996). http://dx.doi.org/10.1016/S0960-9822(02)00450-5 CUBLE2 0960-9822 Google Scholar
T. T. Yang, L. Cheng and S. R. Kain,
“Optimized codon usage and chromophore mutations provide enhanced sensitivity with the green fluorescent protein,”
Nucleic Acids Res., 24
(22), 4592
–4593
(1996). http://dx.doi.org/10.1093/nar/24.22.4592 NARHAD 0305-1048 Google Scholar
A. S. Mishin et al.,
“The first mutant of the Aequorea victoria green fluorescent protein that forms a red chromophore,”
Biochemistry, 47
(16), 4666
–4673
(2008). http://dx.doi.org/10.1021/bi702130s BICHAW 0006-2960 Google Scholar
M. V. Matz et al.,
“Fluorescent proteins from nonbioluminescent Anthozoa species,”
Nat. Biotechnol., 17
(10), 969
–973
(1999). http://dx.doi.org/10.1038/13657 NABIF9 1087-0156 Google Scholar
G. S. Baird, D. A. Zacharias and R. Y. Tsien,
“Biochemistry, mutagenesis, and oligomerization of DsRed, a red fluorescent protein from coral,”
Proc. Natl. Acad. Sci. U. S. A., 97
(22), 11984
–11989
(2000). http://dx.doi.org/10.1073/pnas.97.22.11984 PNASA6 0027-8424 Google Scholar
M. Cotlet et al.,
“Identification of different emitting species in the red fluorescent protein DsRed by means of ensemble and single-molecule spectroscopy,”
Proc. Natl. Acad. Sci. U. S. A., 98
(25), 1439
–14403
(2001). http://dx.doi.org/10.1073/pnas.251532698 PNASA6 0027-8424 Google Scholar
L. A. Gross et al.,
“The structure of the chromophore within DsRed, a red fluorescent protein from coral,”
Proc. Natl. Acad. Sci. U. S. A., 97
(22), 11990
–11995
(2000). http://dx.doi.org/10.1073/pnas.97.22.11990 PNASA6 0027-8424 Google Scholar
D. Yarbrough et al.,
“Refined crystal structure of DsRed, a red fluorescent protein from coral, at 2.0-A resolution,”
Proc. Natl. Acad. Sci. U. S. A., 98
(2), 462
–467
(2001). http://dx.doi.org/10.1073/pnas.98.2.462 PNASA6 0027-8424 Google Scholar
R. E. Campbell et al.,
“A monomeric red fluorescent protein,”
Proc. Natl. Acad. Sci. U. S. A., 99
(12), 7877
–7882
(2002). http://dx.doi.org/10.1073/pnas.082243699 PNASA6 0027-8424 Google Scholar
N. C. Shaner et al.,
“Improved monomeric red, orange and yellow fluorescent proteins derived from Discosoma sp. red fluorescent protein,”
Nat. Biotechnol., 22
(12), 1567
–1572
(2004). http://dx.doi.org/10.1038/nbt1037 NABIF9 1087-0156 Google Scholar
N. C. Shaner et al.,
“Improving the photostability of bright monomeric orange and red fluorescent proteins,”
Nat. Methods, 5
(6), 545
–551
(2008). http://dx.doi.org/10.1038/nmeth.1209 1548-7091 Google Scholar
X. Shu et al.,
“Novel chromophores and buried charges control color in mFruits,”
Biochemistry, 45
(32), 9639
–9647
(2006). http://dx.doi.org/10.1021/bi060773l BICHAW 0006-2960 Google Scholar
S. Pletnev et al.,
“A crystallographic study of bright far-red fluorescent protein mKate reveals pH-induced cis-trans isomerization of the chromophore,”
J. Biol. Chem., 283
(43), 28980
–28987
(2008). http://dx.doi.org/10.1074/jbc.M800599200 JBCHA3 0021-9258 Google Scholar
M. Ormo et al.,
“Crystal structure of the Aequorea victoria green fluorescent protein,”
Science, 273
(5280), 1392
–1395
(1996). http://dx.doi.org/10.1126/science.273.5280.1392 SCIEAS 0036-8075 Google Scholar
V. V. Verkhusha et al.,
“Common pathway for the red chromophore formation in fluorescent proteins and chromoproteins,”
Chem. Biol., 11
(6), 845
–854
(2004). http://dx.doi.org/10.1016/j.chembiol.2004.04.007 CBOLE2 1074-5521 Google Scholar
R. N. Day and M. W. Davidson,
“The fluorescent protein palette: tools for cellular imaging,”
Chem. Soc. Rev., 38
(10), 2887
–2921
(2009). http://dx.doi.org/10.1039/b901966a CSRVBR 0306-0012 Google Scholar
R. L. Strack et al.,
“Chromophore formation in DsRed occurs by a branched pathway,”
J. Am. Chem. Soc., 132
(24), 8496
–8505
(2010). http://dx.doi.org/10.1021/ja1030084 JACSAT 0002-7863 Google Scholar
F. V. Subach and V. V. Verkhusha,
“Chromophore transformations in red fluorescent proteins,”
Chem. Rev., 112
(7), 4308
–4327
(2012). http://dx.doi.org/10.1021/cr2001965 CHREAY 0009-2665 Google Scholar
W. Tomosugi et al.,
“An ultramarine fluorescent protein with increased photostability and pH insensitivity,”
Nat. Methods, 6
(5), 351
–353
(2009). http://dx.doi.org/10.1038/nmeth.1317 1548-7091 Google Scholar
N. C. Shaner, P. A. Steinbach and R. Y. Tsien,
“A guide to choosing fluorescent proteins,”
Nat. Methods, 2
(12), 905
–909
(2005). http://dx.doi.org/10.1038/nmeth819 1548-7091 Google Scholar
N. C. Shaner, G. H. Patterson and M. W. Davidson,
“Advances in fluorescent protein technology,”
J. Cell Sci., 120
(24), 4247
–4260
(2007). http://dx.doi.org/10.1242/jcs.005801 JNCSAI 0021-9533 Google Scholar
M. Z. Lin et al.,
“Autofluorescent proteins with excitation in the optical window for intravital imaging in mammals,”
Chem. Biol., 16
(11), 1169
–1179
(2009). http://dx.doi.org/10.1016/j.chembiol.2009.10.009 CBOLE2 1074-5521 Google Scholar
F. V. Subach et al.,
“Photoactivatable mCherry for high-resolution two-color fluorescence microscopy,”
Nat. Methods, 6
(2), 153
–159
(2009). http://dx.doi.org/10.1038/nmeth.1298 1548-7091 Google Scholar
A. C. Stiel et al.,
“Generation of monomeric reversibly switchable red fluorescent proteins for far-field fluorescence nanoscopy,”
Biophys. J., 95
(6), 2989
–2997
(2008). http://dx.doi.org/10.1529/biophysj.108.130146 BIOJAU 0006-3495 Google Scholar
F. V. Subach et al.,
“Red fluorescent protein with reversibly photoswitchable absorbance for photochromic FRET,”
Chem. Biol., 17
(7), 745
–755
(2010). http://dx.doi.org/10.1016/j.chembiol.2010.05.022 CBOLE2 1074-5521 Google Scholar
O. M. Subach et al.,
“A photoswitchable orange-to-far-red fluorescent protein, PSmOrange,”
Nat. Methods, 8 771
–777
(2011). http://dx.doi.org/10.1038/nmeth.1664 1548-7091 Google Scholar
V. Adam et al.,
“Phototransformable fluorescent proteins: Future challenges,”
Curr. Opin. Chem. Biol., 20 92
–102
(2014). http://dx.doi.org/10.1016/j.cbpa.2014.05.016 COCBF4 1367-5931 Google Scholar
E. M. Merzlyak et al.,
“Bright monomeric red fluorescent protein with an extended fluorescence lifetime,”
Nat. Methods, 4
(7), 555
–557
(2007). http://dx.doi.org/10.1038/nmeth1062 1548-7091 Google Scholar
S. Kredel et al.,
“mRuby, a bright monomeric red fluorescent protein for labeling of subcellular structures,”
PLoS One, 4
(2), e4391
(2009). http://dx.doi.org/10.1371/journal.pone.0004391 1932-6203 Google Scholar
A. J. Lam et al.,
“Improving FRET dynamic range with bright green and red fluorescent proteins,”
Nat. Methods, 9
(10), 1005
–1012
(2012). http://dx.doi.org/10.1038/nmeth.2171 1548-7091 Google Scholar
II Shemiakina et al.,
“A monomeric red fluorescent protein with low cytotoxicity,”
Nat. Commun., 3 1204
(2012). http://dx.doi.org/10.1038/ncomms2208 NCAOBW 2041-1723 Google Scholar
D. Shcherbo et al.,
“Bright far-red fluorescent protein for whole-body imaging,”
Nat. Methods, 4
(9), 741
–746
(2007). http://dx.doi.org/10.1038/nmeth1083 1548-7091 Google Scholar
D. Shcherbo et al.,
“Far-red fluorescent tags for protein imaging in living tissues,”
Biochem. J., 418
(3), 567
–574
(2009). http://dx.doi.org/10.1042/BJ20081949 BIJOAK 0264-6021 Google Scholar
L. Wang et al.,
“Evolution of new nonantibody proteins via iterative somatic hypermutation,”
Proc. Natl. Acad. Sci. U. S. A., 101
(48), 16745
–16749
(2004). http://dx.doi.org/10.1073/pnas.0407752101 PNASA6 0027-8424 Google Scholar
K. S. Morozova et al.,
“Far-red fluorescent protein excitable with red lasers for flow cytometry and superresolution STED nanoscopy,”
Biophys. J., 99
(2), L13
–15
(2010). http://dx.doi.org/10.1016/j.bpj.2010.04.025 BIOJAU 0006-3495 Google Scholar
K. D. Piatkevich et al.,
“Extended Stokes shift in fluorescent proteins: chromophore-protein interactions in a near-infrared TagRFP675 variant,”
Sci. Rep., 3 1847
(2013). http://dx.doi.org/10.1038/srep01847 SRCEC3 2045-2322 Google Scholar
J. Chu et al.,
“Non-invasive intravital imaging of cellular differentiation with a bright red-excitable fluorescent protein,”
Nat. Methods, 11
(5), 572
–578
(2014). http://dx.doi.org/10.1038/nmeth.2888 1548-7091 Google Scholar
T. Kogure et al.,
“A fluorescent variant of a protein from the stony coral Montipora facilitates dual-color single-laser fluorescence cross-correlation spectroscopy,”
Nat. Biotechnol., 24
(5), 577
–581
(2006). http://dx.doi.org/10.1038/nbt1207 NABIF9 1087-0156 Google Scholar
J. Yang et al.,
“mBeRFP, an improved large stokes shift red fluorescent protein,”
PLoS One, 8
(6), e64849
(2013). http://dx.doi.org/10.1371/journal.pone.0064849 1932-6203 Google Scholar
K. D. Piatkevich et al.,
“Monomeric red fluorescent proteins with a large Stokes shift,”
Proc. Natl. Acad. Sci. U. S. A., 107
(12), 5369
–5374
(2010). http://dx.doi.org/10.1073/pnas.0914365107 PNASA6 0027-8424 Google Scholar
D. M. Shcherbakova et al.,
“An orange fluorescent protein with a large Stokes shift for single-excitation multicolor FCCS and FRET imaging,”
J. Am. Chem. Soc., 134
(18), 7913
–7923
(2012). http://dx.doi.org/10.1021/ja3018972 JACSAT 0002-7863 Google Scholar
J. Wiedenmann et al.,
“A far-red fluorescent protein with fast maturation and reduced oligomerization tendency from Entacmaea quadricolor (Anthozoa, Actinaria),”
Proc. Natl. Acad. Sci. U. S. A., 99
(18), 11646
–11651
(2002). http://dx.doi.org/10.1073/pnas.182157199 PNASA6 0027-8424 Google Scholar
L. M. Costantini et al.,
“Assessing the tendency of fluorescent proteins to oligomerize under physiologic conditions,”
Traffic, 13
(5), 643
–649
(2012). http://dx.doi.org/10.1111/j.1600-0854.2012.01336.x 1398-9219 Google Scholar
H. Katayama et al.,
“GFP-like proteins stably accumulate in lysosomes,”
Cell Struct. Funct., 33
(1), 1
–12
(2008). http://dx.doi.org/10.1247/csf.07011 CSFUDY 0386-7196 Google Scholar
S. Maday, K. E. Wallace and E. L. Holzbaur,
“Autophagosomes initiate distally and mature during transport toward the cell soma in primary neurons,”
J. Cell Biol., 196
(4), 407
–417
(2012). http://dx.doi.org/10.1083/jcb.201106120 JCLBA3 0021-9525 Google Scholar
R. A. Chica et al.,
“Generation of longer emission wavelength red fluorescent proteins using computationally designed libraries,”
Proc. Natl. Acad. Sci. U. S. A., 107
(47), 20257
–20262
(2010). http://dx.doi.org/10.1073/pnas.1013910107 PNASA6 0027-8424 Google Scholar
K. D. Piatkevich et al.,
“Engineering ESPT pathways based on structural analysis of LSSmKate red fluorescent proteins with large Stokes shift,”
J. Am. Chem. Soc., 132
(31), 10762
–10770
(2010). http://dx.doi.org/10.1021/ja101974k JACSAT 0002-7863 Google Scholar
J. Zhang et al.,
“Creating new fluorescent probes for cell biology,”
Nat. Rev. Mol. Cell Biol., 3
(12), 906
–918
(2002). http://dx.doi.org/10.1038/nrm976 NRMCBP 1471-0072 Google Scholar
B. Wu et al.,
“Modern fluorescent proteins and imaging technologies to study gene expression, nuclear localization, and dynamics,”
Curr. Opin. Cell Biol., 23
(3), 310
–317
(2011). http://dx.doi.org/10.1016/j.ceb.2010.12.004 COCBE3 0955-0674 Google Scholar
G. Miesenbock, D. A. De Angelis and J. E. Rothman,
“Visualizing secretion and synaptic transmission with pH-sensitive green fluorescent proteins,”
Nature, 394
(6689), 192
–195
(1998). http://dx.doi.org/10.1038/28190 NATUAS 0028-0836 Google Scholar
Y. Li and R. W. Tsien,
“pHTomato, a red, genetically encoded indicator that enables multiplex interrogation of synaptic activity,”
Nat. Neurosci., 15
(7), 1047
–1053
(2012). http://dx.doi.org/10.1038/nn.3126 NANEFN 1097-6256 Google Scholar
M. Tantama, Y. P. Hung and G. Yellen,
“Imaging intracellular pH in live cells with a genetically encoded red fluorescent protein sensor,”
J. Am. Chem. Soc., 133
(26), 10034
–10037
(2011). http://dx.doi.org/10.1021/ja202902d JACSAT 0002-7863 Google Scholar
Y. Shen et al.,
“pHuji, a pH-sensitive red fluorescent protein for imaging of exo- and endocytosis,”
J. Cell Biol., 207
(3), 419
–432
(2014). http://dx.doi.org/10.1083/jcb.201404107 JCLBA3 0021-9525 Google Scholar
Y. Zhao et al.,
“An expanded palette of genetically encoded Ca(2)(+) indicators,”
Science, 333
(6051), 1888
–1891
(2011). http://dx.doi.org/10.1126/science.1208592 SCIEAS 0036-8075 Google Scholar
J. Berg, Y. P. Hung and G. Yellen,
“A genetically encoded fluorescent reporter of ATP:ADP ratio,”
Nat. Methods, 6
(2), 161
–166
(2009). http://dx.doi.org/10.1038/nmeth.1288 1548-7091 Google Scholar
M. B. Cannon and S. J. Remington,
“Re-engineering redox-sensitive green fluorescent protein for improved response rate,”
Protein Sci., 15
(1), 45
–57
(2006). http://dx.doi.org/10.1110/ps.051734306 PRCIEI 0961-8368 Google Scholar
D. Dimitrov et al.,
“Engineering and characterization of an enhanced fluorescent protein voltage sensor,”
PLoS One, 2
(5), e440
(2007). http://dx.doi.org/10.1371/journal.pone.0000440 1932-6203 Google Scholar
T. Yano et al.,
“A novel fluorescent sensor protein for visualization of redox states in the cytoplasm and in peroxisomes,”
Mol. Cell Biol., 30
(15), 3758
–3766
(2010). MCBDEU Google Scholar
R. H. Newman, M. D. Fosbrink and J. Zhang,
“Genetically encodable fluorescent biosensors for tracking signaling dynamics in living cells,”
Chem. Rev., 111
(5), 3614
–3666
(2011). http://dx.doi.org/10.1021/cr100002u CHREAY 0009-2665 Google Scholar
I. Ghosh, A. D. Hamilton and L. Regan,
“Antiparallel leucine zipper-directed protein reassembly: application to the green fluorescent protein,”
J. Am. Chem. Soc., 122
(23), 5658
–5659
(2000). http://dx.doi.org/10.1021/ja994421w JACSAT 0002-7863 Google Scholar
C. G. Wilson, T. J. Magliery and L. Regan,
“Detecting protein-protein interactions with GFP-fragment reassembly,”
Nat. Methods, 1
(3), 255
–262
(2004). http://dx.doi.org/10.1038/nmeth1204-255 1548-7091 Google Scholar
G. Jach et al.,
“An improved mRFP1 adds red to bimolecular fluorescence complementation,”
Nat. Methods, 3
(8), 597
–600
(2006). http://dx.doi.org/10.1038/nmeth901 1548-7091 Google Scholar
J. Y. Fan et al.,
“Split mCherry as a new red bimolecular fluorescence complementation system for visualizing protein-protein interactions in living cells,”
Biochem. Biophys. Res. Commun., 367
(1), 47
–53
(2008). http://dx.doi.org/10.1016/j.bbrc.2007.12.101 BBRCA9 0006-291X Google Scholar
J. O. Keem et al.,
“Splitting and self-assembling of far-red fluorescent protein with an engineered beta strand peptide: application for alpha-synuclein imaging in mammalian cells,”
Biomaterials, 32
(34), 9051
–9058
(2011). http://dx.doi.org/10.1016/j.biomaterials.2011.08.029 BIMADU 0142-9612 Google Scholar
J. Chu et al.,
“A novel far-red bimolecular fluorescence complementation system that allows for efficient visualization of protein interactions under physiological conditions,”
Biosens. Bioelectron., 25
(1), 234
–239
(2009). http://dx.doi.org/10.1016/j.bios.2009.06.008 BBIOE4 0956-5663 Google Scholar
Y. Han et al.,
“In vivo imaging of protein-protein and RNA-protein interactions using novel far-red fluorescence complementation systems,”
Nucleic Acids Res., 42
(13), e103
(2014). http://dx.doi.org/10.1093/nar/gku408 NARHAD 0305-1048 Google Scholar
G. S. Filonov and V. V. Verkhusha,
“A near-infrared BiFC reporter for in vivo imaging of protein-protein interactions,”
Chem. Biol., 20
(8), 1078
–1086
(2013). http://dx.doi.org/10.1016/j.chembiol.2013.06.009 CBOLE2 1074-5521 Google Scholar
S. Cabantous et al.,
“A new protein-protein interaction sensor based on tripartite split-GFP association,”
Sci. Rep., 3 2854
(2013). http://dx.doi.org/10.1038/srep02854 SRCEC3 2045-2322 Google Scholar
L. Lindenburg and M. Merkx,
“Engineering genetically encoded FRET sensors,”
Sensors, 14
(7), 11691
–11713
(2014). http://dx.doi.org/10.3390/s140711691 SNSRES 0746-9462 Google Scholar
H. W. Ai et al.,
“Fluorescent protein FRET pairs for ratiometric imaging of dual biosensors,”
Nat. Methods, 5
(5), 401
–403
(2008). http://dx.doi.org/10.1038/nmeth.1207 1548-7091 Google Scholar
H. J. Carlson and R. E. Campbell,
“Genetically encoded FRET-based biosensors for multiparameter fluorescence imaging,”
Curr. Opin. Biotechnol., 20
(1), 19
–27
(2009). http://dx.doi.org/10.1016/j.copbio.2009.01.003 CUOBE3 0958-1669 Google Scholar
J. Goedhart et al.,
“Sensitive detection of p65 homodimers using red-shifted and fluorescent protein-based FRET couples,”
PLoS One, 2
(10), e1011
(2007). http://dx.doi.org/10.1371/journal.pone.0001011 1932-6203 Google Scholar
A. Piljic and C. Schultz,
“Simultaneous recording of multiple cellular events by FRET,”
ACS Chem. Biol., 3
(3), 156
–160
(2008). http://dx.doi.org/10.1021/cb700247q ACBCCT 1554-8929 Google Scholar
L. H. Lindenburg et al.,
“Robust red FRET sensors using self-associating fluorescent domains,”
ACS Chem. Biol., 8
(10), 2133
–2139
(2013). http://dx.doi.org/10.1021/cb400427b ACBCCT 1554-8929 Google Scholar
L. H. Lindenburg et al.,
“Quantifying stickiness: thermodynamic characterization of intramolecular domain interactions to guide the design of Forster resonance energy transfer sensors,”
Biochemistry, 53
(40), 6370
–6381
(2014). http://dx.doi.org/10.1021/bi500433j BICHAW 0006-2960 Google Scholar
R. E. Campbell,
“Fluorescent-protein-based biosensors: modulation of energy transfer as a design principle,”
Anal. Chem., 81
(15), 5972
–5979
(2009). http://dx.doi.org/10.1021/ac802613w ANCHAM 0003-2700 Google Scholar
S. C. Alford et al.,
“Dimerization-dependent green and yellow fluorescent proteins,”
ACS Synth. Biol., 1
(12), 569
–575
(2012). http://dx.doi.org/10.1021/sb300050j ASBCD6 2161-5063 Google Scholar
S. C. Alford et al.,
“A fluorogenic red fluorescent protein heterodimer,”
Chem. Biol., 19
(3), 353
–360
(2012). http://dx.doi.org/10.1016/j.chembiol.2012.01.006 CBOLE2 1074-5521 Google Scholar
S. Jayaraman et al.,
“Mechanism and cellular applications of a green fluorescent protein-based halide sensor,”
J. Biol. Chem., 275
(9), 6047
–6050
(2000). http://dx.doi.org/10.1074/jbc.275.9.6047 JBCHA3 0021-9258 Google Scholar
L. J. Galietta, P. M. Haggie and A. S. Verkman,
“Green fluorescent protein-based halide indicators with improved chloride and iodide affinities,”
FEBS Lett., 499
(3), 220
–224
(2001). http://dx.doi.org/10.1016/S0014-5793(01)02561-3 FEBLAL 0014-5793 Google Scholar
G. T. Hanson et al.,
“Investigating mitochondrial redox potential with redox-sensitive green fluorescent protein indicators,”
J. Biol. Chem., 279
(13), 13044
–13053
(2004). http://dx.doi.org/10.1074/jbc.M312846200 JBCHA3 0021-9258 Google Scholar
C. T. Dooley et al.,
“Imaging dynamic redox changes in mammalian cells with green fluorescent protein indicators,”
J. Biol. Chem., 279
(21), 22284
–22293
(2004). http://dx.doi.org/10.1074/jbc.M312847200 JBCHA3 0021-9258 Google Scholar
S. Tang et al.,
“Design and application of a class of sensors to monitor Ca2+ dynamics in high Ca2+ concentration cellular compartments,”
Proc. Natl. Acad. Sci. U. S. A., 108
(39), 16265
–16270
(2011). http://dx.doi.org/10.1073/pnas.1103015108 PNASA6 0027-8424 Google Scholar
D. E. Johnson et al.,
“Red fluorescent protein pH biosensor to detect concentrative nucleoside transport,”
J. Biol. Chem., 284
(31), 20499
–20511
(2009). http://dx.doi.org/10.1074/jbc.M109.019042 JBCHA3 0021-9258 Google Scholar
H. J. Carlson, D. W. Cotton and R. E. Campbell,
“Circularly permuted monomeric red fluorescent proteins with new termini in the beta-sheet,”
Protein Sci., 19
(8), 1490
–1499
(2010). http://dx.doi.org/10.1002/pro.v19:8 PRCIEI 0961-8368 Google Scholar
B. Shui et al.,
“Circular permutation of red fluorescent proteins,”
PLoS One, 6
(5), e20505
(2011). http://dx.doi.org/10.1371/journal.pone.0020505 1932-6203 Google Scholar
J. S. Marvin et al.,
“An optimized fluorescent probe for visualizing glutamate neurotransmission,”
Nat. Methods, 10
(2), 162
–170
(2013). http://dx.doi.org/10.1038/nmeth.2333 1548-7091 Google Scholar
M. Tantama et al.,
“Imaging energy status in live cells with a fluorescent biosensor of the intracellular ATP-to-ADP ratio,”
Nat. Commun., 4 2550
(2013). http://dx.doi.org/10.1038/ncomms3550 NCAOBW 2041-1723 Google Scholar
F. St-Pierre et al.,
“High-fidelity optical reporting of neuronal electrical activity with an ultrafast fluorescent voltage sensor,”
Nat. Neurosci., 17
(6), 884
–889
(2014). http://dx.doi.org/10.1038/nn.3709 NANEFN 1097-6256 Google Scholar
J. S. Marvin et al.,
“A genetically encoded, high-signal-to-noise maltose sensor,”
Proteins, 79
(11), 3025
–3036
(2011). Google Scholar
D. Cai et al.,
“Improved tools for the Brainbow toolbox,”
Nat. Methods, 10
(6), 540
–547
(2013). http://dx.doi.org/10.1038/nmeth.2450 1548-7091 Google Scholar
H. Mutoh et al.,
“Optogenetic monitoring of membrane potentials,”
Exp. Physiol., 96
(1), 13
–18
(2011). http://dx.doi.org/10.1113/expphysiol.2010.053942 EXPHEZ 0958-0670 Google Scholar
S. Su et al.,
“Genetically encoded calcium indicator illuminates calcium dynamics in primary cilia,”
Nat. Methods, 10
(11), 1105
–1107
(2013). http://dx.doi.org/10.1038/nmeth.2647 1548-7091 Google Scholar
J. Nakai, M. Ohkura and K. Imoto,
“A high signal-to-noise Ca2+ probe composed of a single green fluorescent protein,”
Nat. Biotechnol., 19
(2), 137
–141
(2001). http://dx.doi.org/10.1038/84397 NABIF9 1087-0156 Google Scholar
T. Nagai et al.,
“Circularly permuted green fluorescent proteins engineered to sense Ca2+,”
Proc. Natl. Acad. Sci. U. S. A., 98
(6), 3197
–3202
(2001). http://dx.doi.org/10.1073/pnas.051636098 PNASA6 0027-8424 Google Scholar
J. Wu et al.,
“Improved orange and red Ca(2)+/- indicators and photophysical considerations for optogenetic applications,”
ACS Chem. Neurosci., 4
(6), 963
–972
(2013). http://dx.doi.org/10.1021/cn400012b ACNCDM 1948-7193 Google Scholar
H. Hoi et al.,
“Highlightable Ca2+ indicators for live cell imaging,”
J. Am. Chem. Soc., 135
(1), 46
–49
(2013). http://dx.doi.org/10.1021/ja310184a JACSAT 0002-7863 Google Scholar
J. Wu et al.,
“A long Stokes shift red fluorescent Ca(2+) indicator protein for two-photon and ratiometric imaging,”
Nat. Commun., 5 5262
(2014). http://dx.doi.org/10.1038/ncomms6262 NCAOBW 2041-1723 Google Scholar
J. Wu et al.,
“Red fluorescent genetically encoded Ca2+ indicators for use in mitochondria and endoplasmic reticulum,”
Biochem. J., 464
(1), 13
–22
(2014). http://dx.doi.org/10.1042/BJ20140931 BIJOAK 0264-6021 Google Scholar
J. Akerboom et al.,
“Genetically encoded calcium indicators for multi-color neural activity imaging and combination with optogenetics,”
Front. Mol. Neurosci., 6 2
(2013). http://dx.doi.org/10.3389/fnmol.2013.00002 FMNRAJ 1662-5099 Google Scholar
M. Ohkura et al.,
“An improved genetically encoded red fluorescent Ca2+ indicator for detecting optically evoked action potentials,”
PLoS One, 7
(7), e39933
(2012). http://dx.doi.org/10.1371/journal.pone.0039933 1932-6203 Google Scholar
M. Inoue et al.,
“Rational design of a high-affinity, fast, red calcium indicator R-CaMP2,”
Nat. Methods, 12
(1), 64
–70
(2015). http://dx.doi.org/10.1038/nmeth.3185 1548-7091 Google Scholar
A. S. Walker, J. Burrone and M. P. Meyer,
“Functional imaging in the zebrafish retinotectal system using RGECO,”
Front. Neural Circuits, 7 34
(2013). http://dx.doi.org/10.3389/fncir.2013.00034 FNCRA5 1662-5110 Google Scholar
A. Perron et al.,
“Second and third generation voltage-sensitive fluorescent proteins for monitoring membrane potential,”
Front. Mol. Neurosci., 2 5
(2009). http://dx.doi.org/10.3389/neuro.02.005.2009 FMNRAJ 1662-5099 Google Scholar
M. S. Siegel and E. Y. Isacoff,
“A genetically encoded optical probe of membrane voltage,”
Neuron, 19
(4), 735
–741
(1997). http://dx.doi.org/10.1016/S0896-6273(00)80955-1 NERNET 0896-6273 Google Scholar
B. J. Baker et al.,
“Three fluorescent protein voltage sensors exhibit low plasma membrane expression in mammalian cells,”
J. Neurosci. Methods, 161
(1), 32
–38
(2007). http://dx.doi.org/10.1016/j.jneumeth.2006.10.005 JNMEDT 0165-0270 Google Scholar
K. Ataka and V. A. Pieribone,
“A genetically targetable fluorescent probe of channel gating with rapid kinetics,”
Biophys. J., 82
(1), 509
–516
(2002). http://dx.doi.org/10.1016/S0006-3495(02)75415-5 BIOJAU 0006-3495 Google Scholar
R. Sakai et al.,
“Design and characterization of a DNA-encoded, voltage-sensitive fluorescent protein,”
Eur. J. Neurosci., 13
(12), 2314
–2318
(2001). http://dx.doi.org/10.1046/j.0953-816x.2001.01617.x EJONEI 0953-816X Google Scholar
A. Lundby et al.,
“Engineering of a genetically encodable fluorescent voltage sensor exploiting fast Ci-VSP voltage-sensing movements,”
PLoS One, 3
(6), e2514
(2008). http://dx.doi.org/10.1371/journal.pone.0002514 1932-6203 Google Scholar
G. Guerrero et al.,
“Tuning FlaSh: redesign of the dynamics, voltage range, and color of the genetically encoded optical sensor of membrane potential,”
Biophys. J., 83
(6), 3607
–3618
(2002). http://dx.doi.org/10.1016/S0006-3495(02)75361-7 BIOJAU 0006-3495 Google Scholar
L. Jin et al.,
“Random insertion of split-cans of the fluorescent protein venus into Shaker channels yields voltage sensitive probes with improved membrane localization in mammalian cells,”
J. Neurosci. Methods, 199
(1), 1
–9
(2011). http://dx.doi.org/10.1016/j.jneumeth.2011.03.028 JNMEDT 0165-0270 Google Scholar
J. M. Kralj et al.,
“Electrical spiking in Escherichia coli probed with a fluorescent voltage-indicating protein,”
Science, 333
(6040), 345
–348
(2011). http://dx.doi.org/10.1126/science.1204763 SCIEAS 0036-8075 Google Scholar
L. Sjulson and G. Miesenbock,
“Optical recording of action potentials and other discrete physiological events: a perspective from signal detection theory,”
Physiology (Bethesda), 22 47
–55
(2007). http://dx.doi.org/10.1152/physiol.00036.2006 PHYSCI 1548-9213 Google Scholar
L. Jin et al.,
“Single action potentials and subthreshold electrical events imaged in neurons with a fluorescent protein voltage probe,”
Neuron, 75
(5), 779
–785
(2012). http://dx.doi.org/10.1016/j.neuron.2012.06.040 NERNET 0896-6273 Google Scholar
Z. Han et al.,
“Fluorescent protein voltage probes derived from ArcLight that respond to membrane voltage changes with fast kinetics,”
PLoS One, 8
(11), e81295
(2013). http://dx.doi.org/10.1371/journal.pone.0081295 1932-6203 Google Scholar
S. G. Gautam et al.,
“Exploration of fluorescent protein voltage probes based on circularly permuted fluorescent proteins,”
Front. Neuroeng., 2 14
(2009). http://dx.doi.org/10.3389/neuro.16.014.2009 FNREIF 1662-6443 Google Scholar
A. Perron et al.,
“Red-shifted voltage-sensitive fluorescent proteins,”
Chem. Biol., 16
(12), 1268
–1277
(2009). http://dx.doi.org/10.1016/j.chembiol.2009.11.014 CBOLE2 1074-5521 Google Scholar
G. Miesenbock,
“Synapto-pHluorins: genetically encoded reporters of synaptic transmission,”
Cold Spring Harb. Protoc., 2012
(2), 213
–217
(2012). Google Scholar
S. Sankaranarayanan et al.,
“The use of pHluorins for optical measurements of presynaptic activity,”
Biophys. J., 79
(4), 2199
–2208
(2000). http://dx.doi.org/10.1016/S0006-3495(00)76468-X BIOJAU 0006-3495 Google Scholar
Y. Zhu, J. Xu and S. F. Heinemann,
“Two pathways of synaptic vesicle retrieval revealed by single-vesicle imaging,”
Neuron, 61
(3), 397
–411
(2009). http://dx.doi.org/10.1016/j.neuron.2008.12.024 NERNET 0896-6273 Google Scholar
J. Balaji and T. A. Ryan,
“Single-vesicle imaging reveals that synaptic vesicle exocytosis and endocytosis are coupled by a single stochastic mode,”
Proc. Natl. Acad. Sci. U. S. A., 104
(51), 20576
–20581
(2007). http://dx.doi.org/10.1073/pnas.0707574105 PNASA6 0027-8424 Google Scholar
H. Li et al.,
“Concurrent imaging of synaptic vesicle recycling and calcium dynamics,”
Front. Mol. Neurosci., 4 34
(2011). http://dx.doi.org/10.3389/fnmol.2011.00034 FMNRAJ 1662-5099 Google Scholar
S. A. Hires, Y. Zhu and R. Y. Tsien,
“Optical measurement of synaptic glutamate spillover and reuptake by linker optimized glutamate-sensitive fluorescent reporters,”
Proc. Natl. Acad. Sci. U. S. A., 105
(11), 4411
–4416
(2008). http://dx.doi.org/10.1073/pnas.0712008105 PNASA6 0027-8424 Google Scholar
A. P. Siegel et al.,
“Strengths and weaknesses of recently engineered red fluorescent proteins evaluated in live cells using fluorescence correlation spectroscopy,”
Int. J. Mol. Sci., 14
(10), 20340
–20358
(2013). http://dx.doi.org/10.3390/ijms141020340 IJMCFK 1661-6596 Google Scholar
K. M. Dean et al.,
“Analysis of red-fluorescent proteins provides insight into dark-state conversion and photodegradation,”
Biophys. J., 101
(4), 961
–969
(2011). http://dx.doi.org/10.1016/j.bpj.2011.06.055 BIOJAU 0006-3495 Google Scholar
T. J. Wardill et al.,
“A neuron-based screening platform for optimizing genetically-encoded calcium indicators,”
PLoS One, 8
(10), e77728
(2013). http://dx.doi.org/10.1371/journal.pone.0077728 1932-6203 Google Scholar
BiographyYi Shen undertook his PhD research with professor Robert E. Campbell in the Department of Chemistry at the University of Alberta, Edmonton, Canada. His research projects were focused on the development of new RFPs and RFP-based pH sensors. Tiffany Lai is an MSc student at the University of Alberta, Edmonton, Canada. She earned her BSc from McGill University. Her research project focuses on the applications of ddFPs for life science research. Robert E. Campbell is a professor of chemistry of the University of Alberta, Edmonton, Canada. He earned his BSc and PhD degrees from the University of British Columbia and undertook postdoctoral research at the University of California, San Diego. His research program focuses on the development of FPs and FP-based tools for live cell imaging. As of March 2015, plasmids developed in his lab have been requested more than 2900 times. |
||||||||||||||||||||||||||||||||||||||||||||||||||||||||||||||||||||||||||||||||||||||||||||||||||||||||||||||||||||||||||||||||||||||||||||||||||||||||||||||||||||||||||||||||||||||||||||||||||||||||||||||||||||||||||||||||||||||||||||||||||||||||||||||||||||||||||||||||||||||||