
|
|
1.IntroductionThe change in blood perfusion in highly interconnected pial arterioles is strongly related to the neural activities in the cerebral cortex,1 thus the ability to measure this change can provide important insights about the vascular reaction in the case of an ischemia.2 Pial arterioles are responsive to a disruption of blood flow3,4 in various ways depending on their sizes and their spatial locations with respect to anastomoses. Penetrating arterioles are other important components of blood flow regulation, as they play an essential role in delivering blood from a highly collateralized pial arteriole network to capillaries in the cerebral cortex. The blood flow regulation in penetrating arterioles is crucial for the subsequent survival of tissue within the penumbra region. Interestingly, penetrating arterioles are not interconnected. Hence, in the case of a disruption of blood flow such as in stroke, the source of blood to the vital pathways to the penumbra is regulated by pial arterioles.4 Failure in supplying penetrating arterioles can cause a direct change in downstream capillaries and lead to a region of neuronal death.5 Within the highly collateralized pial arteriole network, the major cerebral arteries, such as the middle cerebral artery (MCA) and anterior cerebral artery (ACA), are interconnected by arteriolo-arteriolar anastomoses (AAAs), with penetrating arterioles attaching to them as T-junctions.6 The combined blood flow from MCA and ACA sources descends into the cortex after passing through T-junctions on the surface. However, little is known about AAA’s role in the hemodynamic compensation through penetrating arterioles. Thus, evaluating the vessel diameter, the red blood cell (RBC) velocity and total flow changes in a significant number of pial and penetrating arterioles in relation to the AAAs can provide a valuable insight about the active hemodynamic regulation during focal stroke. Two-photon excited fluorescence microscopy (2PM) has been a well-accepted tool for quantifying RBC flow dynamics in single vessels in cerebral microvasculature. It has been widely applied for investigating neuronal connectivity,7 as well as blood flow activity by labeling RBCs.2 However, it has several limitations. It provides a small field of view8 and only measures the RBC velocity in vessels that are oriented parallel to the imaging plane. Additionally, the measurements need to be made one vessel at a time, which is time consuming. As a result, it is difficult to acquire large data sets during the time-constrained experiments, such as in the investigation of middle cerebral artery occlusion (MCAO) models in rodents. Lately, Doppler optical coherence tomography9 has been applied to image cerebral microvasculature and can measure absolute blood flow speed in multiple vessels at once.10 Due to its inherent low sensitivity to blood flow within highly scattering tissue, optical microangiography (OMAG) is developed that analyzes both intensity and phase information embedded in OCT spectral interferograms to produce a three-dimensional (3-D) cerebral blood perfusion map in vivo.11 Its further development has made OMAG sensitive to capillary blood flows that perfuse within the living tissue,12,13 which has been successfully used in the study of mouse cerebral microvasculature14 and its response to systemic hypoxia, normoxia, and hyperoxia.15 A recent study also validated the accuracy of OMAG for capillary vessel imaging compared to 2 PM using a mouse cerebral microvasculature model.16 Moreover, OMAG has been used in cutaneous imaging applications by utilizing a Doppler principle, called DOMAG,17 to image the capillary morphology in healthy and inflamed human finger skin18,19 and the vascular abnormalities in human facial skin with acne vulgaris.20 In this paper, we apply the OMAG technique to evaluate the vessel diameter, the RBC axial velocity and total blood flow changes in a large number of pial and penetrating arterioles across the penumbra region in the parietal cortex before, during, and after the MCAO. We focus on analyzing vasodynamics at different spatial locations with respect to the AAA territory between the MCA and ACA distal branches. The open-skull cranial window is applied to the region of interest (ROI) to achieve high quality images up to depth within a area.21 OMAG images are taken during 60 min of the MCAO and the reperfusion periods and compared with the basal conditions. The following questions are being investigated: How do the AAAs redistribute blood in response to MCAO, and how is it related to the changes in the pial and the penetrating arterioles? Our system and methods provide significant advantages to investigate these important questions. Thanks to the highly sensitive OMAG, we are able to resolve pial microvasculature up to the capillary level and provide the clear images of penetrating arterioles up to a depth. In contrast to 2PM, our techniques make it possible to image a larger number of vessels in a short-time period during a time-constrained MCAO experiment, thus providing the ability to compare various regions within the penumbra. 2.System and Methods2.1.Animal ModelsAll experimental animal procedures performed in this study are approved by the Institute of Animal care and Use Committee (IACUC) of the University of Washington (Protocol number: 4262-01). Six male 12-week-old C57/BL6 mice weighing between 23 and 25 g were purchased from Charles River Laboratories (Seattle, Washington). The mice were deeply anesthetized using 1.5% to 2% isoflurane ( O2, air) during the experiments and euthanized at the end of the experiments. The body temperature of the animal was maintained at 36.8°C through a homoeothermic blanket system (507220-F, Harvard Apparatus, Massachusetts). All the mice were subjected to three imaging sessions (baseline, MCA occlusion, reperfusion) through a cranial window covering the distal branches of MCA and ACA, as well as the AAAs. The surgical procedure is briefly described as follows: First, a standard cranial window22 was created on the left parietal cortex 1 mm lateral from the sagittal suture and 1 mm posterior from the bregma by drilling a circular groove and lifting the central island. A circular cover glass was placed over the exposed brain surface and sealed onto the bone with dental cement. Then the cranial window was subjected to a baseline imaging by OMAG (see Sec. 2.3). After the baseline imaging was taken, the mouse was subjected to an MCAO using the Longa method,23 which involves an intraluminal filament insertion from an isolated external carotid artery and a temporary ligation of the ipsilateral common carotid artery (CCA). The occluding filament was slowly advanced through internal carotid artery toward the cranial base until a mild resistance was felt. A laser Doppler flowmeter microtip was placed perpendicular to the calvarium from the superior nuchal line to the nasion as the guidance to a successful occlusion. Another set of OMAG images was taken at the same region under the window during the occlusion period of 60 min. For reperfusion, the filament was removed so that MCA could be reperfused, and OMAG images were again acquired to represent the reperfusion. However, due to the time constraint of the experiment, we were unable to image reperfusion without untying the CCA. For this short-time period of untying the CCA, we used the laser Doppler flowmetry to monitor. There was about a 28% decrease in total flux with the ligated CCA compared to the baseline over the average of six mice. 2.2.System SetupA fiber-based SD-OCT system was used for the experiments.24 Briefly, in this system, a superluminescent diode (Thorlabs Inc., Newton, New Jersey) was used as the light source, which has a central wavelength of 1340 nm with a bandwidth of 110 nm, providing a axial resolution in the air. In the sample arm, scan lens (Thorlabs Inc., Newton, New Jersey) was used to achieve lateral resolution (full width at half maximum of the point spread function) with a 0.12-mm depth of field. The output light from the interferometer was routed to a home-built spectrometer, which had a designed spectral resolution of that provided a detectable depth range of on each side of the zero delay line. The line rate of the linescan camera (1024 pixel detector-array, Goodrich Inc., Princeton, New Jersey) employed in the spectrometer was 92 kHz. The system had a measured dynamic range of 105 dB with a light power of 3.5 mW at the sample surface. The operations for probe beam scanning, data acquisition, data storage, and hand-shaking between them are controlled by a custom software package written in Labview. 2.3.Optical MicroangiographyTo visualize the volumetric microvasculature, a unique OMAG scanning protocol was applied12 to obtain detailed cerebral microvasculature and flow velocities in the arterioles. Briefly, in this protocol, 400 A-lines covering a distance of constituted each B-frame (fast axis). In the slow axis (C-scan), there are 400 steps, also covering a distance of . At each step, eight-repeated B-frames are acquired. With this scanning protocol, the data cube of one complete 3-D scan was composed of () voxels, which took to acquire with an imaging rate of 180 fps. To obtain microvasculature down to the capillary level at the each step, an eigendecomposition-based clutter filtering algorithm25 was used to separate structural tissue from flowing RBCs from the eight repeated B-frames. Hence, the final 3-D vascular image was composed of () voxels. The lumen diameters of vessels were calculated manually from OMAG images using a MATLAB graphical user interface. Accordingly, the full width at half maximum of the pixel intensities is located on the vessels and the diameters are calculated between these locations based on the resolution. After each OMAG scan, DOMAG scanning was performed covering the same area to show the axial velocity map of cerebral blood flow (CBF).26 Briefly, with this method, a phase-resolved technique9 was used to calculate the axial flow velocity of the RBC where is the center wavelength of the light source, is the tissue refractive index, and and are the phase difference and time interval between adjacent A-lines, respectively. The maximal and minimal detectable velocities are determined by the time interval , the -ambiguity and the system phase noise level.9 In order to have an axial velocity range of , Doppler processing of complex signals was applied among A-lines in each step by using a 3 A-line interval to increase between processed A-lines. A phase variance mask was then employed to segment meaningful Doppler flow signals from the noisy phase background. Each B-scan in DOMAG protocol consisted of 10,000 A-lines by acquiring 25 A-lines at each 400 discrete steps. In the slow scan direction (C-scan), there are 600 discrete steps, i.e., 600 B-scans. The data cube of each processed 3-D vascular image was composed of () voxels, which took to acquire with a 6 fps imaging speed. More details about this imaging protocol can be found in Ref. 26. We integrated DOMAG images in the en face plane10 to calculate the flow in penetrating arterioles.To acquire the CBF images over a large area of the cortex, these imaging protocols are repeated to create a mosaic image. OMAG and DOMAG algorithms are first applied to the data sets acquired at the basal condition. After applying MCAO to the mouse, the imaging protocol was repeated over the same area during occlusion and reperfusion by keeping the discrepancies minimum between the three imaging sessions in terms of the location of the focus of the probe beam and the positioning and orientation of the sample. 3.Results3.1.Pial and Penetrating Arteriole Vasodynamics under Basal ConditionsPial and penetrating arteriole vasodynamics in the mouse cortex are imaged through a cranial window () using the OMAG technique. The volumetric en face average intensity projection (AIP) of the 3-D OCT structural image is used here to better visualize and localize the diving and rising vessels. Because of the light absorption and the strong scattering effect from RBCs, the vessels parallel to the probing beam appear as darker spots in the en face AIP of the structural image in contrast to other regions and the vessels that are approximately perpendicular to the probe beam. This phenomenon helps make the detection of penetrating vessels easier, especially at the T-junctions that are mostly invisible in the en face maximum intensity projection (MIP) of OMAG images. Figure 1(a) shows the mosaic image of nine en face AIP of 3-D OCT structural images. Fig. 1Pial and penetrating arteriole vasodynamics under basal conditions: (a) en face average intensity projection (AIP) of the cortical structure through the cranial window. (b) En face maximum intensity projection (MIP) of optical microangiography (OMAG) within in depth from the cortical surface. (c) Closer view of a region marked by a dashed yellow box in (b). (d) En face map to show penetrating arterioles in OMAG image. Red, green, and yellow dots correspond to MCA, ACA, and AAA T-junction sourced arterioles, respectively. (e) En face MIP of DOMAG that shows axial velocity distribution within depth from cortical surface. (f) Closer view of a region marked by a dashed yellow box in (d). In (c) and (f), penetrating arterioles are marked by circles. Scale bar represents 0.35 mm in (a, b, d, e) and 0.15 mm in (c, f). 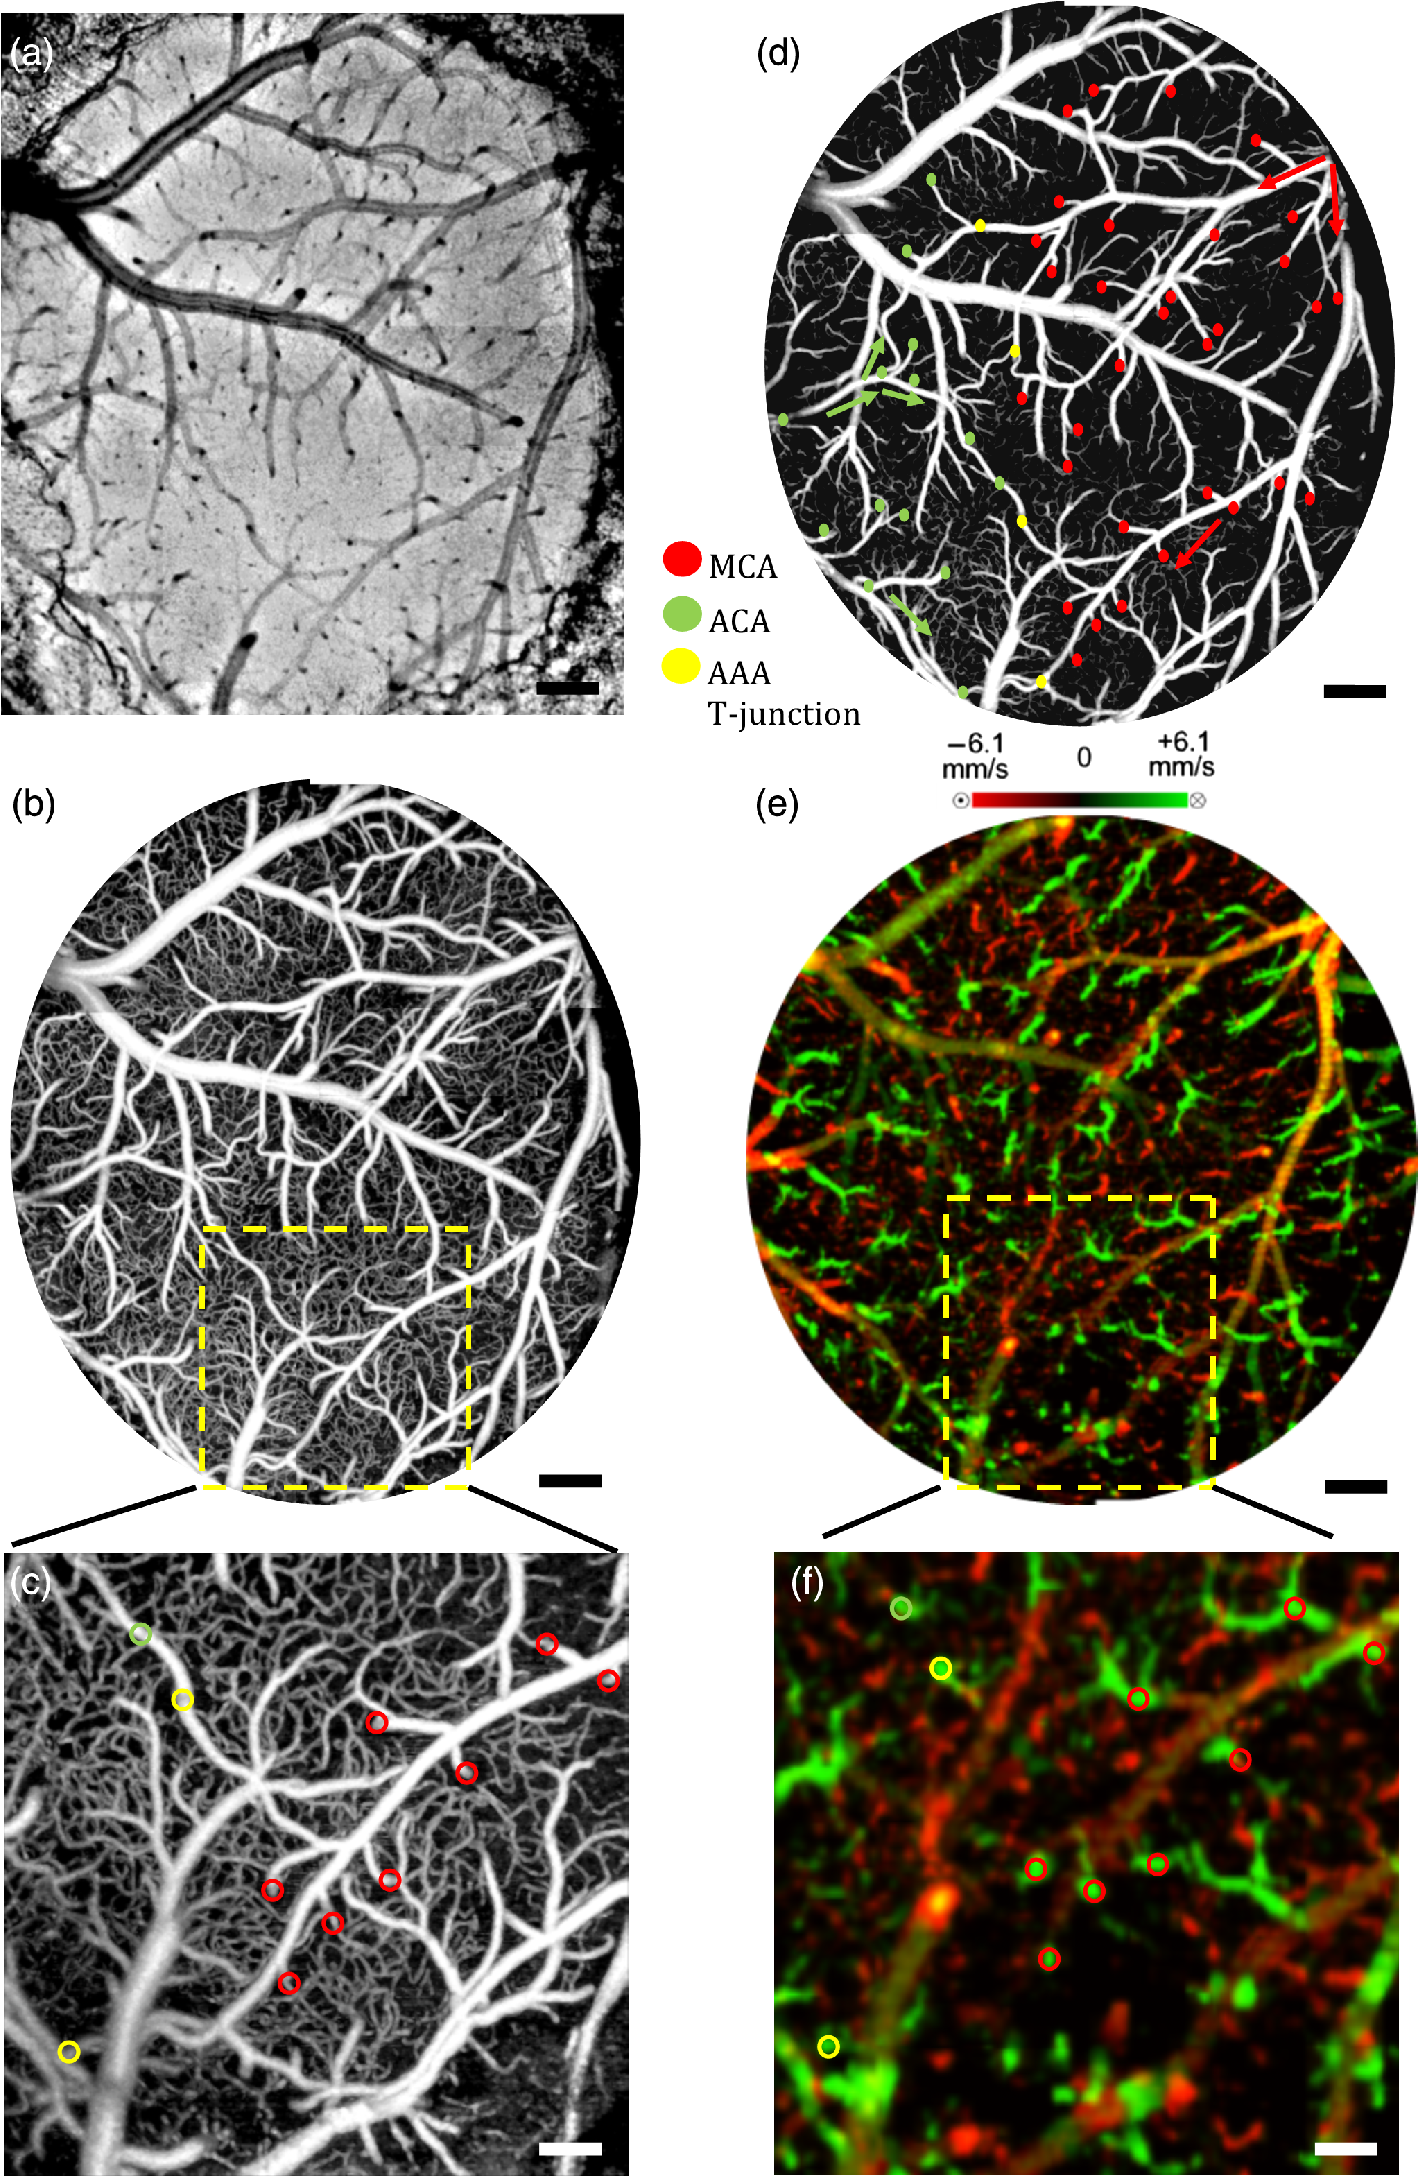 The CBF images are obtained by merging nine OMAG images and four DOMAG images as a mosaic image. The OMAG image of blood vessels in the pial region of the cerebral cortex is given in Fig. 1(b). To be able to focus on the pial arterioles, only the en face MIP of the capillary loop region up to a depth is demonstrated, which was arranged to stay in the depth of focus of the probe beam. Moreover, the RBC axial flow velocity map of the pial and the penetrating vessels are demonstrated using DOMAG in Fig. 1(e). The bidirectional en face MIP in Fig. 1(e) shows the diving arterioles and the rising venules as green and red colors, respectively, where the RBC axial flow velocity information is coded with a color bar in a range of . The dense scanning protocol enables the imaging of various RBCs at multiple locations to form continuous lines; however, the discontinuities are still present due to the very low relative axial velocities of RBCs when they are nearly perpendicular to the probe beam. A few out-of-range flows are also observed as phase-wrapped signals, shown in yellow color. The closer views of an ROI in Figs. 1(b) and 1(e) are shown in Figs. 1(c) and 1(f). The penetrating arterioles are located manually in the high contrast version of Fig. 1(b) and are shown in Fig. 1(d). In doing so, the en face AIP of the OCT structural image [Fig. 1(a)] is used as a guide to detect the locations of the penetrating arterioles, then the DOMAG image [Fig. 1(e)] is employed to differentiate the MCA and the ACA branches from veins and to localize the AAA T-junctions. In the particular case presented in Fig. 1, the penetrating arterioles that are identified as the MCA and the ACA branches are marked with red and green dots, respectively [Fig. 1(d)]. Moreover, the AAA T-junctions are found in between the ACA and the MCA branches and are denoted with yellow dots in Fig. 1(d). The penetrating arterioles that have connections to ACA are chosen from the clear part of the cranial window. We did not make selections based on speed or diameter. The corresponding arterioles are also pointed out in the ROI images with circles in Figs. 1(c) and 1(f). After random sampling ( animals), the average lumen diameters of 143 pial and 127 penetrating arterioles are calculated to be 40.7 and , respectively. 3.2.Pial and Penetrating Arteriole Vasodynamics in Response to Middle Cerebral Artery OcclusionChanges in the pial and penetrating arteriole vasodynamics in response to MCAO are studied using OMAG and DOMAG techniques. Figures 2(b) and 2(c) show the blood flow changes in the penetrating arterioles during the 60 min occlusion. When the MCA branches fails to support the penetrating arterioles, flow is reversed in the pial arterioles and the ACA branches take over some of the penetrating arterioles as shown in Fig. 2(b). However, this collateral support fails in providing blood to some of the MCA connected penetrating arterioles which mainly reside in the weak AAA territory as pointed out in Fig. 2(c). Moreover, in consistence with the previous literature,4 the blood flows in the penetrating arterioles are never reversed. On the other hand, T-junction locations may shift as in the case pointed out with a dashed circle in Fig. 2(e). The average lumen diameter of the pial and the penetrating arterioles, corresponding to the baseline case, are decreased to 38.8 and , respectively. Fig. 2Changes of red blood cell (RBC) flow patterns in the pial arteriole network during MCAO and reperfusion: (a, d) En face AIP of the cortical structure through the cranial window (a) during occlusion and (d) during reperfusion, respectively. (b, e) En face OMAG MIP of the microcirculation network within depth from the cortical surface (b) during occlusion and (e) during reperfusion, respectively. Map of the diving arterioles on OMAG image is shown. Red, green, and yellow dots correspond to MCA, ACA, and AAA T-junction sourced arterioles, respectively. Yellow dots in (b) are showing the location of T-junctions in the baseline while they were supplied by MCA and ACA. Blue dots correspond to the diving arterioles that are at not-detectable level compared to basal condition. Dashed circle in (e) points out the shift in the location of T-junction point. (c, f) En face DOMAG MIP of velocity distribution within depth from cortical surface (c) during occlusion and (f) during reperfusion, respectively. Dashed circle in (c) points out the area with failed collateral support. Scale bar represents 0.35 mm. 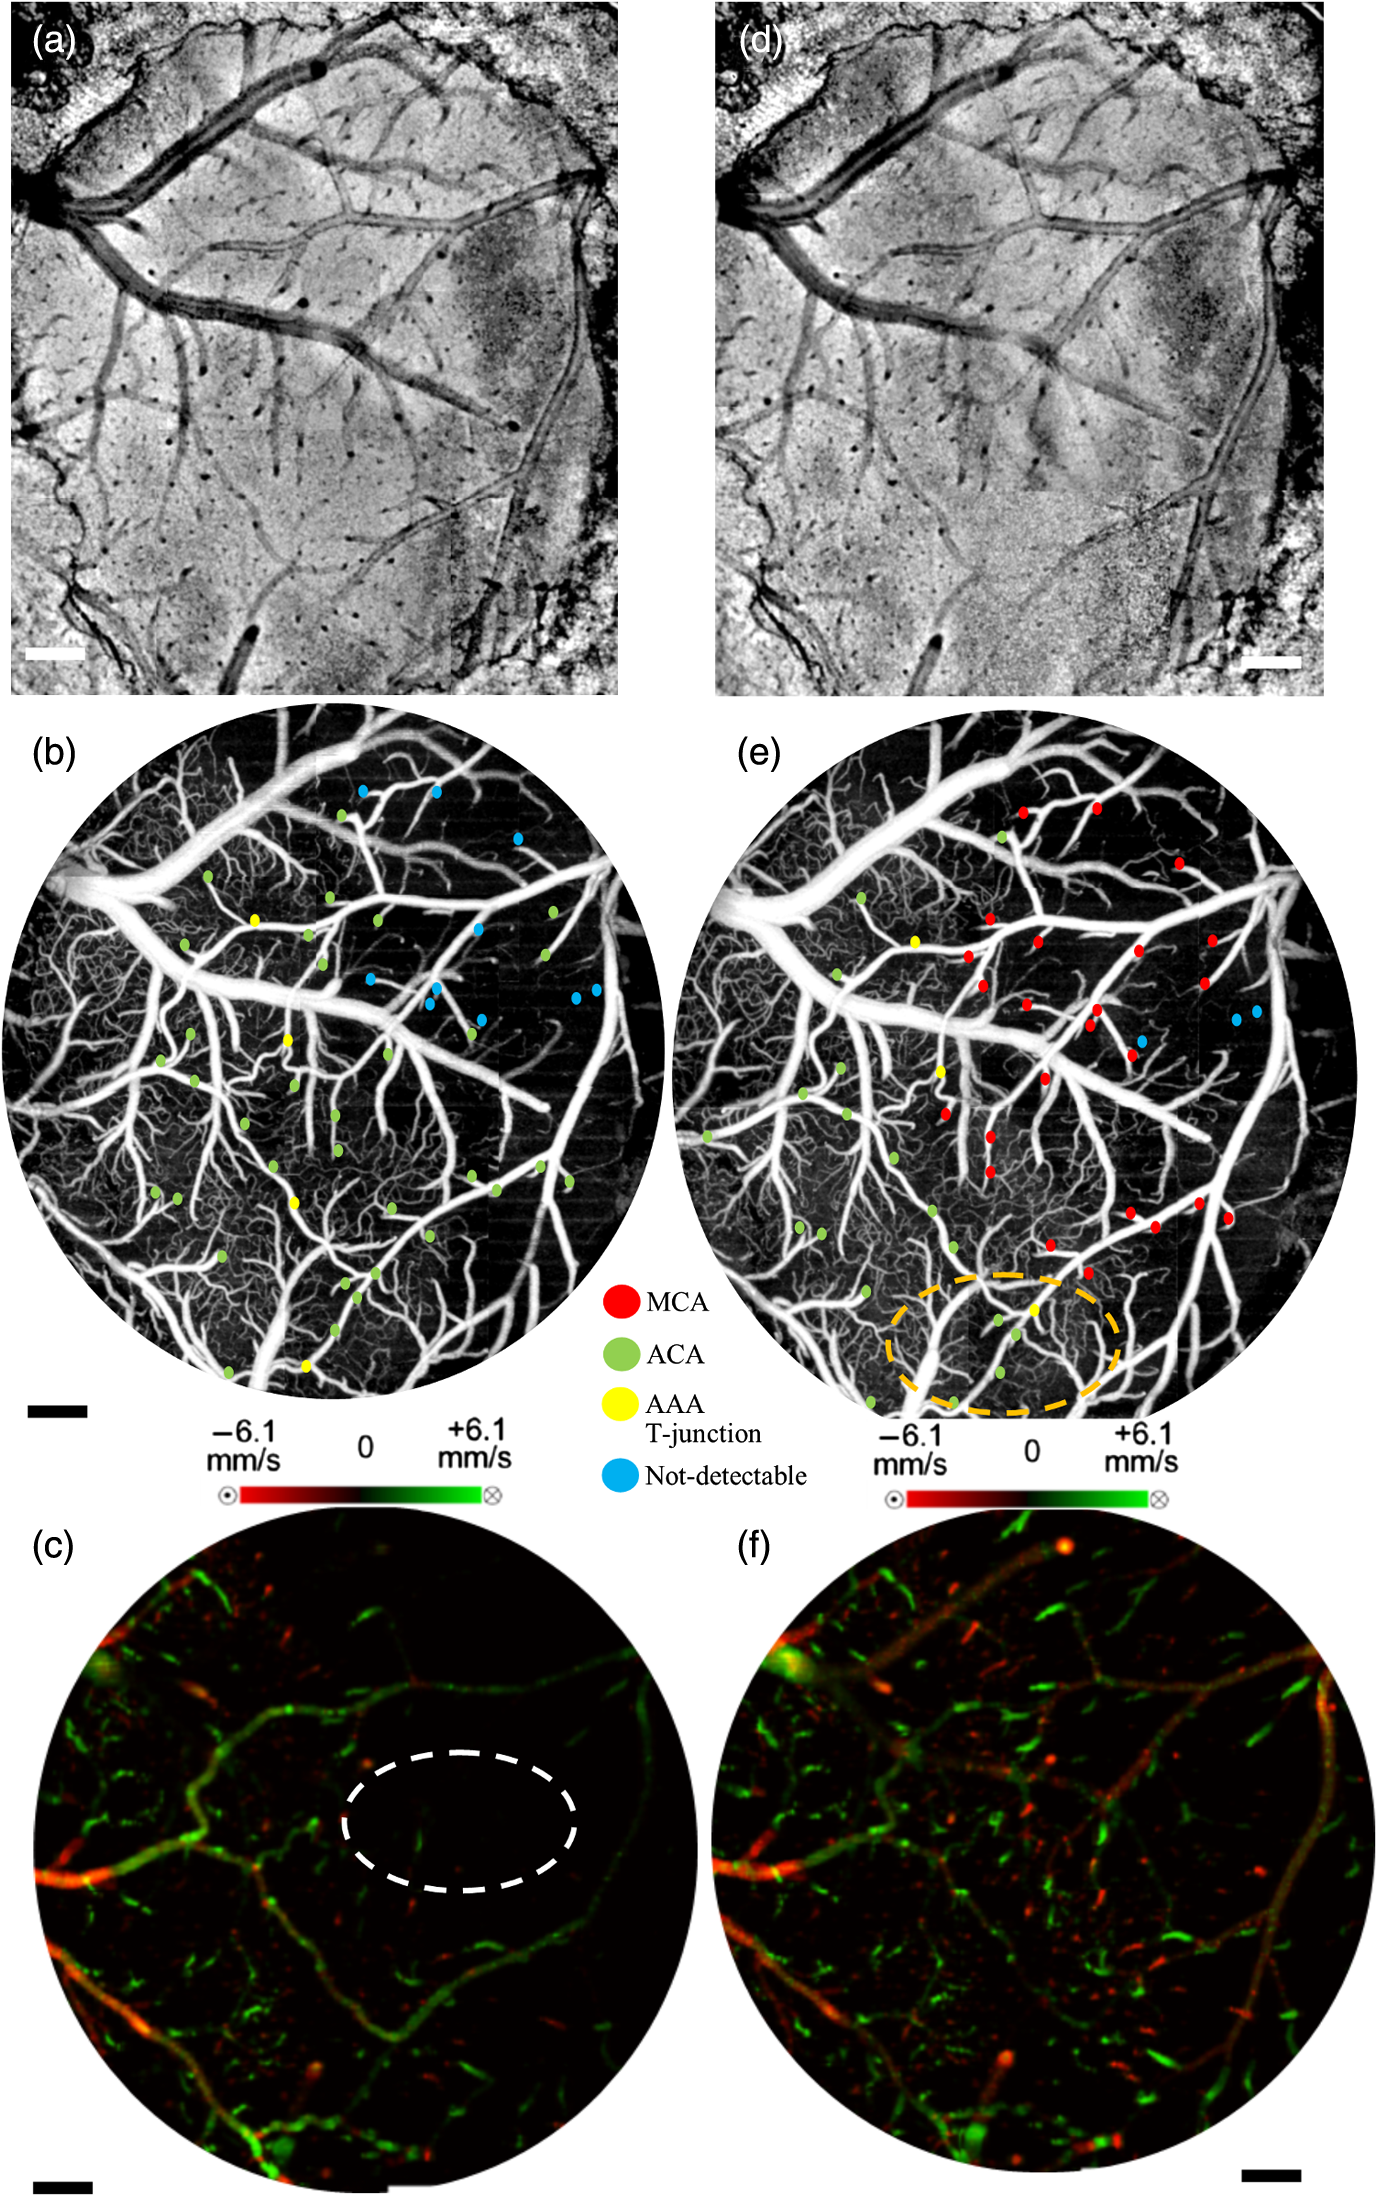 During the reperfusion, some of the AAAs stay active in supplying blood to four of the penetrating arterioles via ACA and three of the MCA connected penetrating arterioles remain inactive, as shown in Fig. 2(e). On the other hand, most of the capillaries distant from the AAA territory disappear during the occlusion and do not reappear after the reperfusion. The average lumen diameters of the corresponding pial and penetrating arterioles return back to their baseline values with a slight increase, which are measured at 41.1 and , respectively. The comparison of the average lumen diameters among basal, occlusion and reperfusion conditions for the pial and the penetrating arterioles is shown in Fig. 5(a). The MCAO model used in this study generates incomplete recovery during reperfusion due to the sustained blocking of CCA branch vessels. This can be observed in Fig. 3(b), where the velocity and the flow changes in the penetrating arterioles during the occlusion and the reperfusion with respect to the baseline are compared. A relatively larger decrease in the total blood flow compared to the mean RBC axial velocity can be explained by the disappearance of some of the penetrating arterioles during the occlusion and the reperfusion as shown in Fig. 2. Moreover, the lumen diameter changes of the penetrating arterioles (shrink or dilate) occur in response to the stroke whereas the lumen diameters of the pial arterioles are only slightly affected as demonstrated in Fig. 3. Fig. 3The lumen diameter distribution of the pial arterioles under (a) basal condition, (b) basal and occlusion conditions (overlaid), and (c) basal and reperfusion conditions (overlaid); and the penetrating arterioles under (d) basal condition, (e) basal and occlusion conditions (overlaid), and (f) basal and reperfusion conditions (overlaid), respectively. 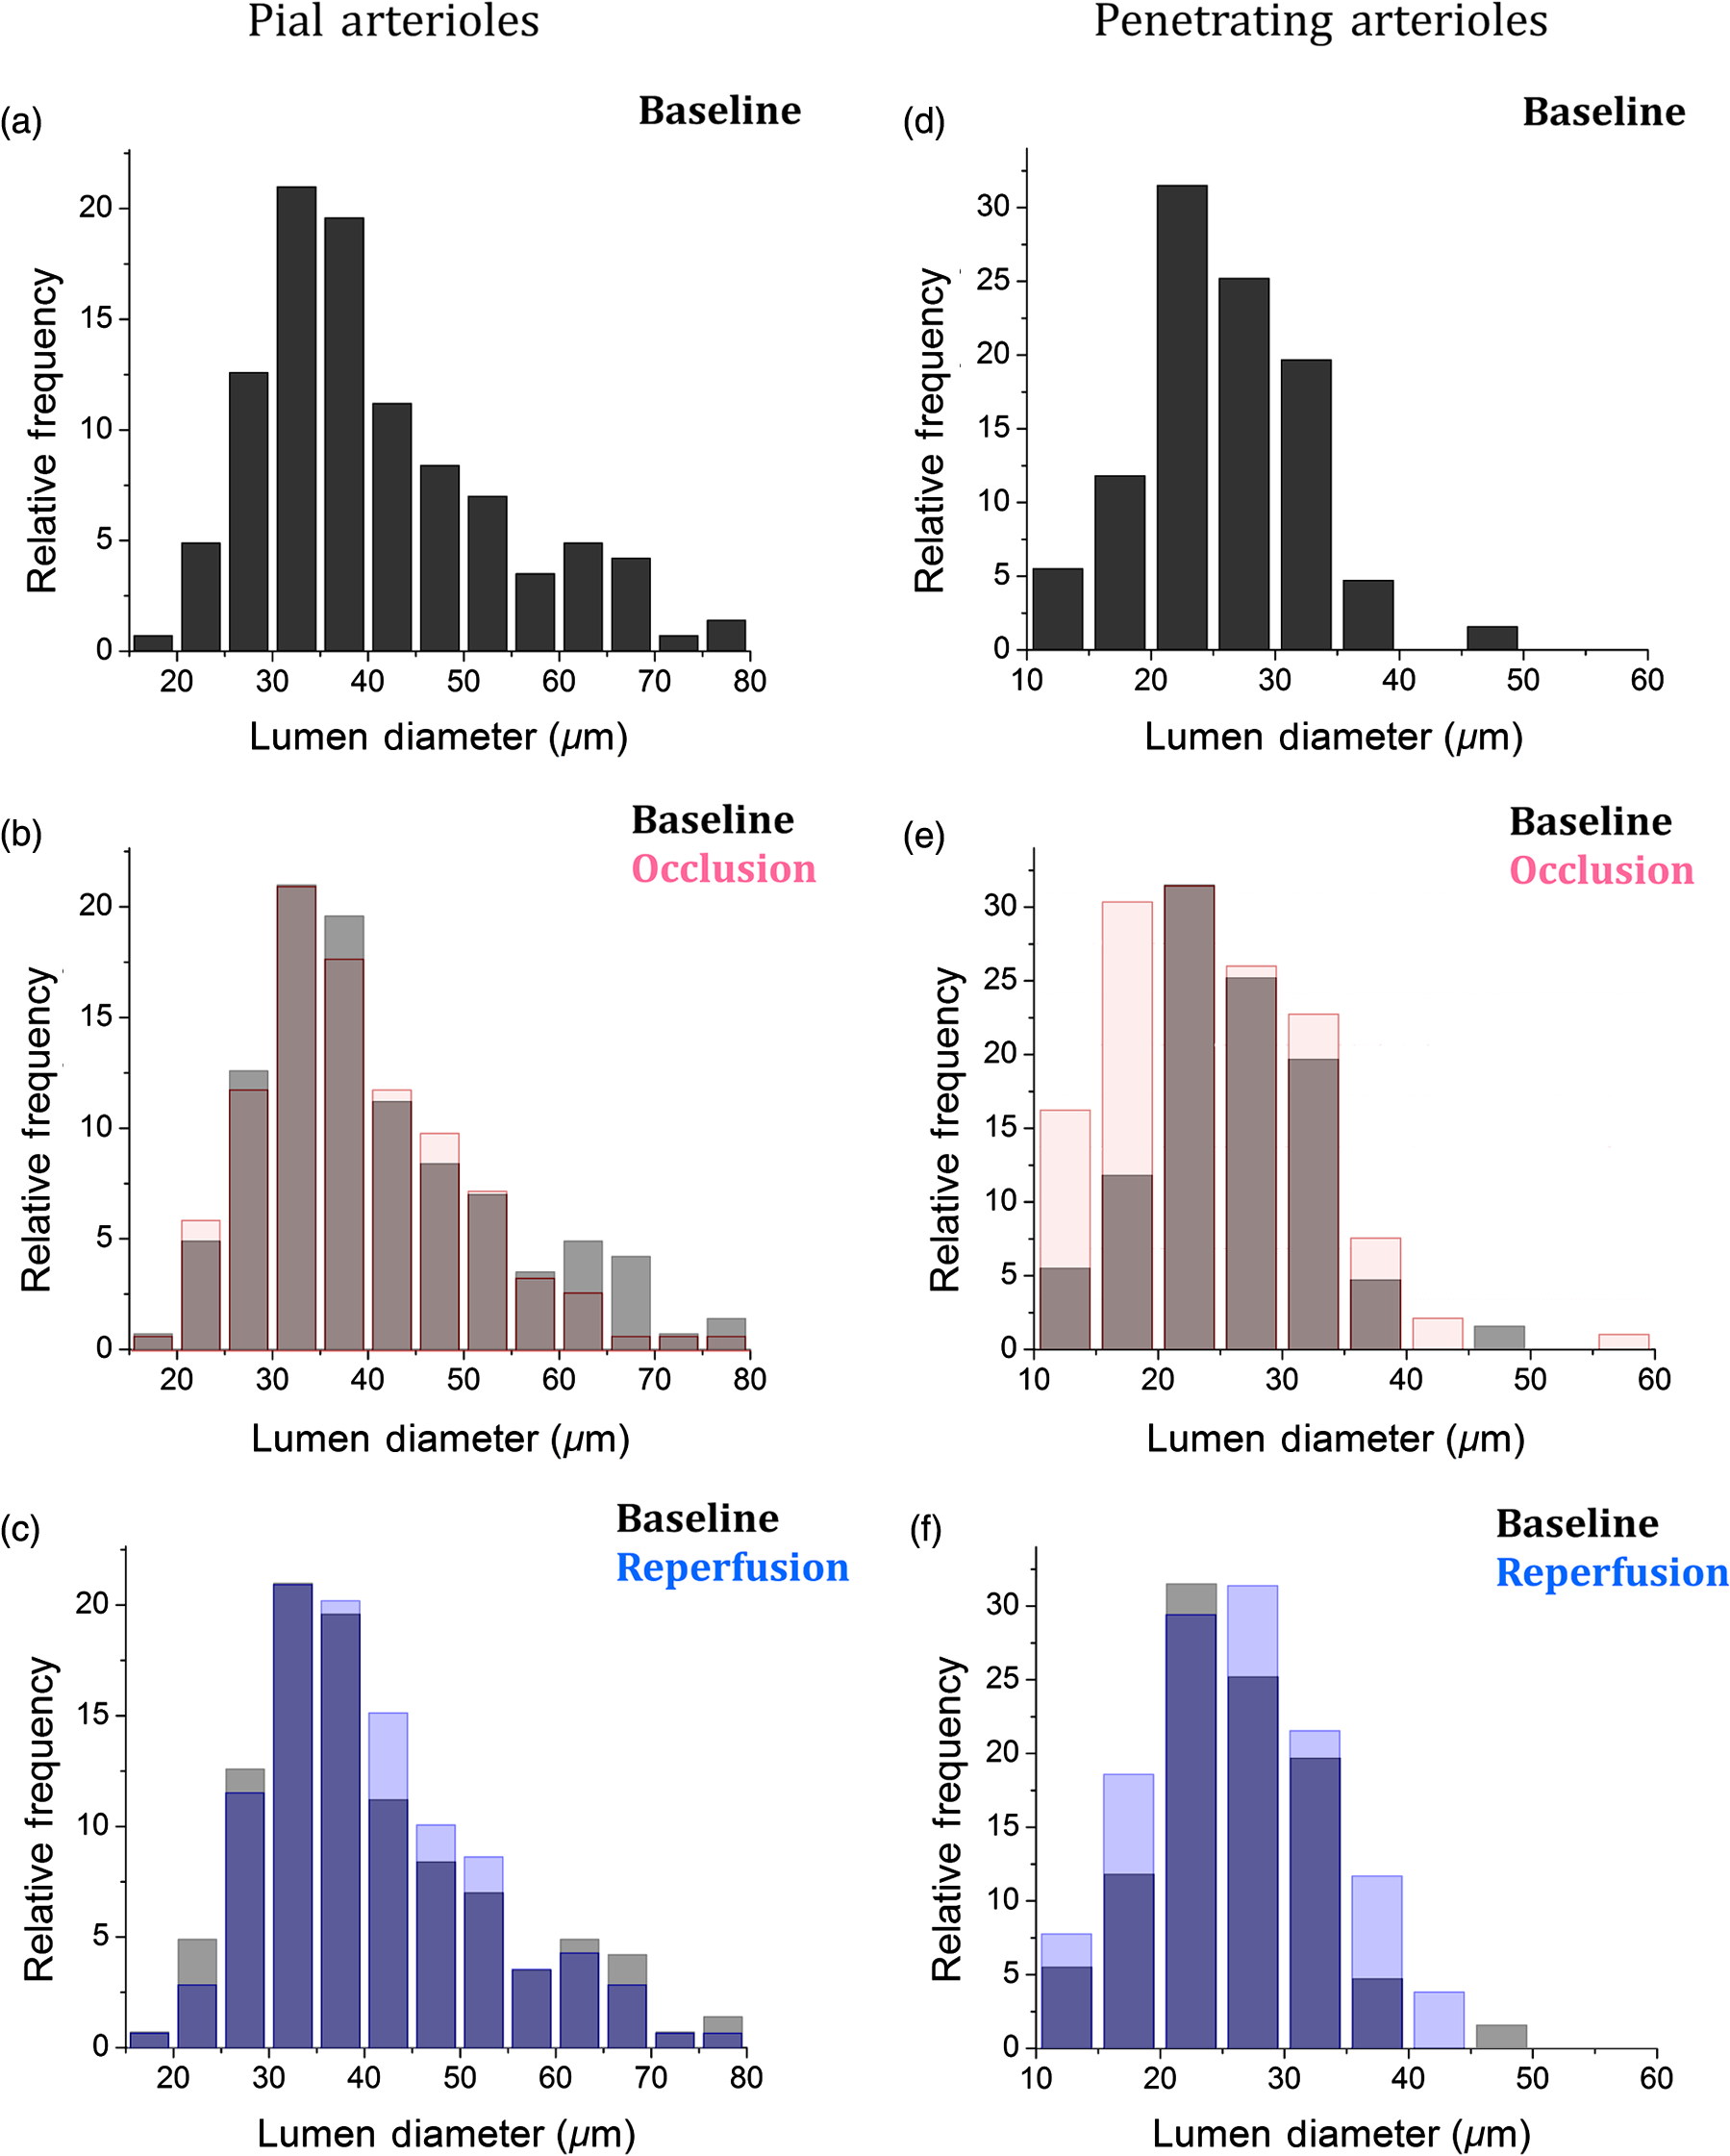 3.3.Pial Arteriole Vasodynamics in Relation to AAA FormationAAA’s role in the response of the pial and the penetrating arterioles to MCAO is analyzed using both the OMAG and the DOMAG results. Two ROIs are selected in the DOMAG images for all cases where the presence of AAAs is either strong or weak [Figs. 4(a)–4(c)]. These regions are also located in the OMAG images and the corresponding penetrating arterioles are marked in Figs. 4(d)–4(f). Then the mean lumen diameter, the total blood flow and the RBC axial velocity in the penetrating arterioles and the pial arterioles within these regions are compared. Figure 5(b) shows that the penetrating arterioles that are close to the strong AAA territories dilate whereas the pial arterioles do not, which is consistent with the previous finding.4 Although the dilation effect in the average lumen diameter is subtle, it is statistically significant. On the other hand, the penetrating arterioles constrict significantly in the weaker AAA territories as shown in Fig. 5(c). Moreover, the total blood flow and the RBC mean axial velocity in the penetrating arterioles close to a weak AAA suffered from a significantly larger drop compared to the ones close to a strong AAA [Figs. 5(e) and 5(f)]. Fig. 4Comparison between regions where AAA is relatively stronger or weaker: (a–c) DOMAG results for (a) basal, (b) during MCAO, and (c) after reperfusion conditions, respectively. Strong AAA area is marked with a yellow dashed box and weak AAA area with a blue dashed box. (d–f) OMAG comparison between strong and weak AAA ROIs for (d) basal, (e) during MCAO, and (f) after reperfusion conditions, respectively. (g–i) Red, green, and yellow dots correspond to MCA, ACA, and AAA T-junction sourced arterioles, respectively. Blue dots correspond to the diving arterioles that are at not-detectable level compared to basal condition. Cartoon representations of the lumen diameters of pial and penetrating arterioles for (g) basal, (h) during MCAO, and (i) after reperfusion conditions, respectively. Scale bar is 0.3 mm. 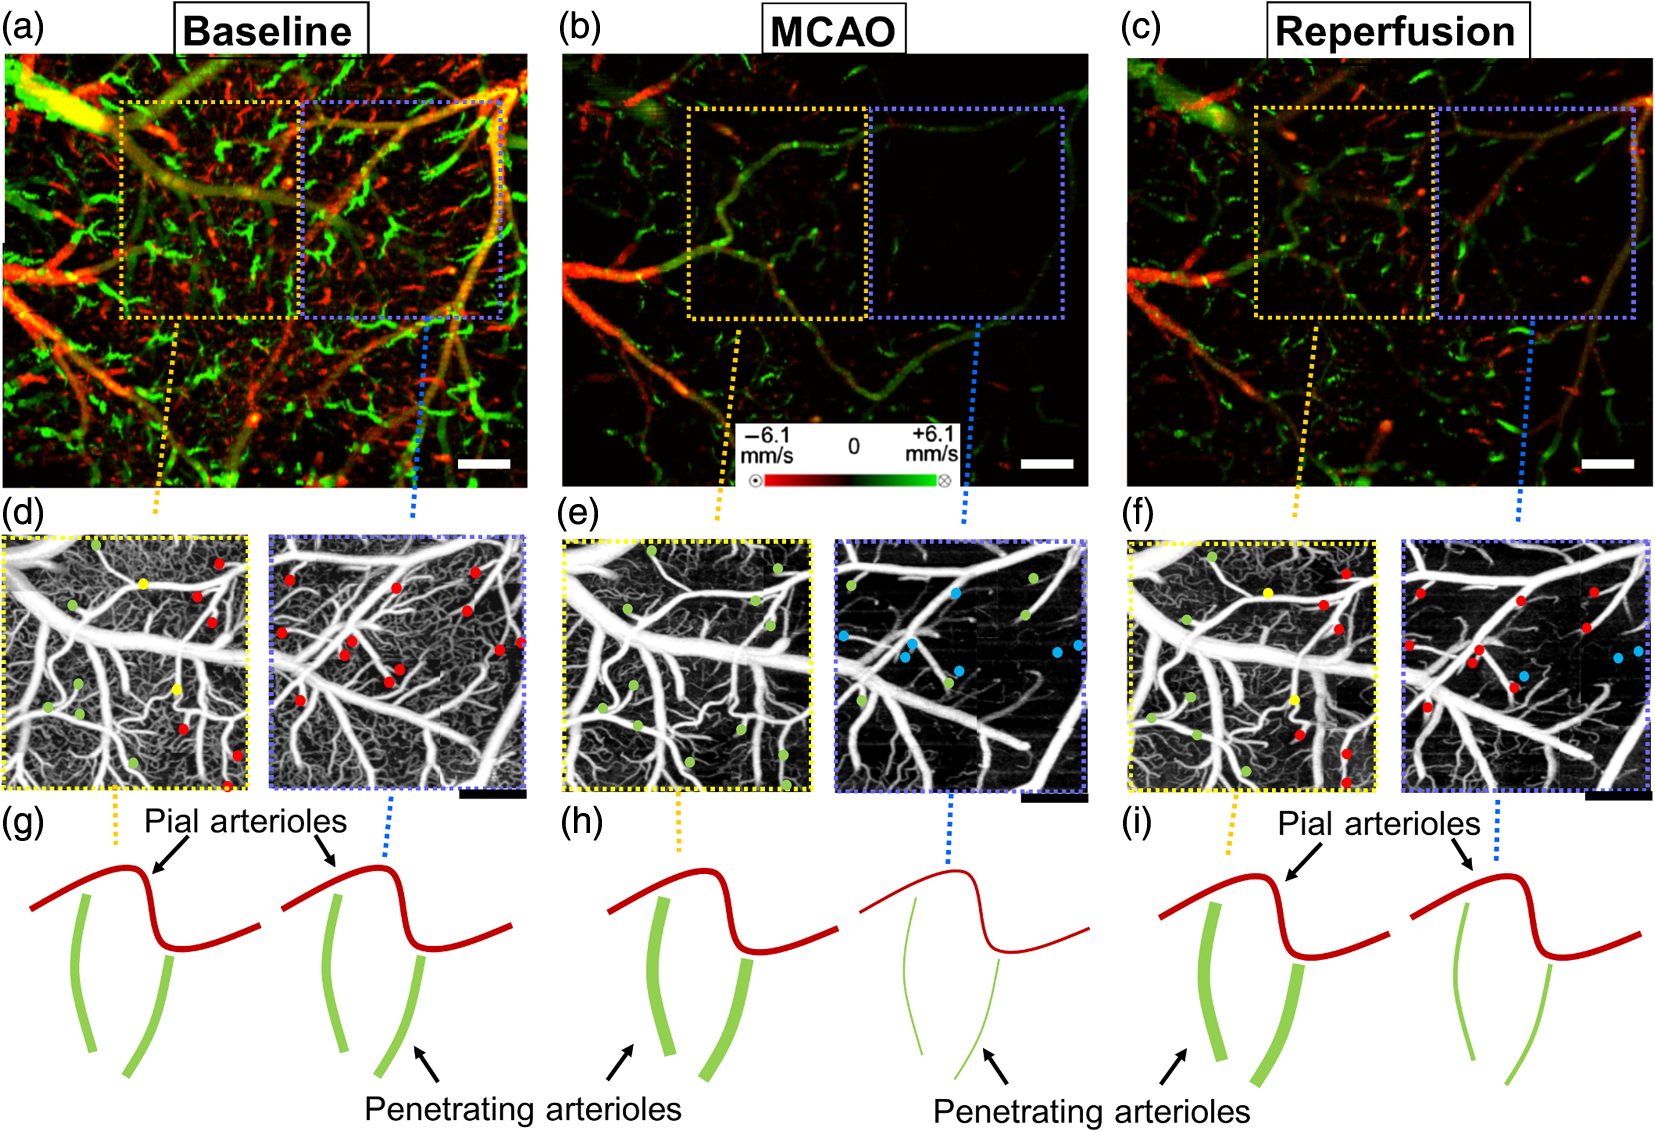 Fig. 5Lumen diameter, velocity, and flow comparison: (a) the mean lumen diameters of 143 pial and 127 penetrating arterioles for basal, occlusion, and reperfusion cases ( animals). (b, c) Comparison of mean lumen diameters of pial and penetrating arterioles, respectively, between strong and weak AAA areas. *** and ** significantly different data sets (paired test). (d) The mean total blood flow and RBC velocity changes compared to baseline among 127 penetrating arterioles during occlusion and reperfusion (). (d, e) Comparison of velocity and flow changes in penetrating arterioles between strong and weak AAA areas, respectively. *** and ** significantly different data sets from baseline (paired test). 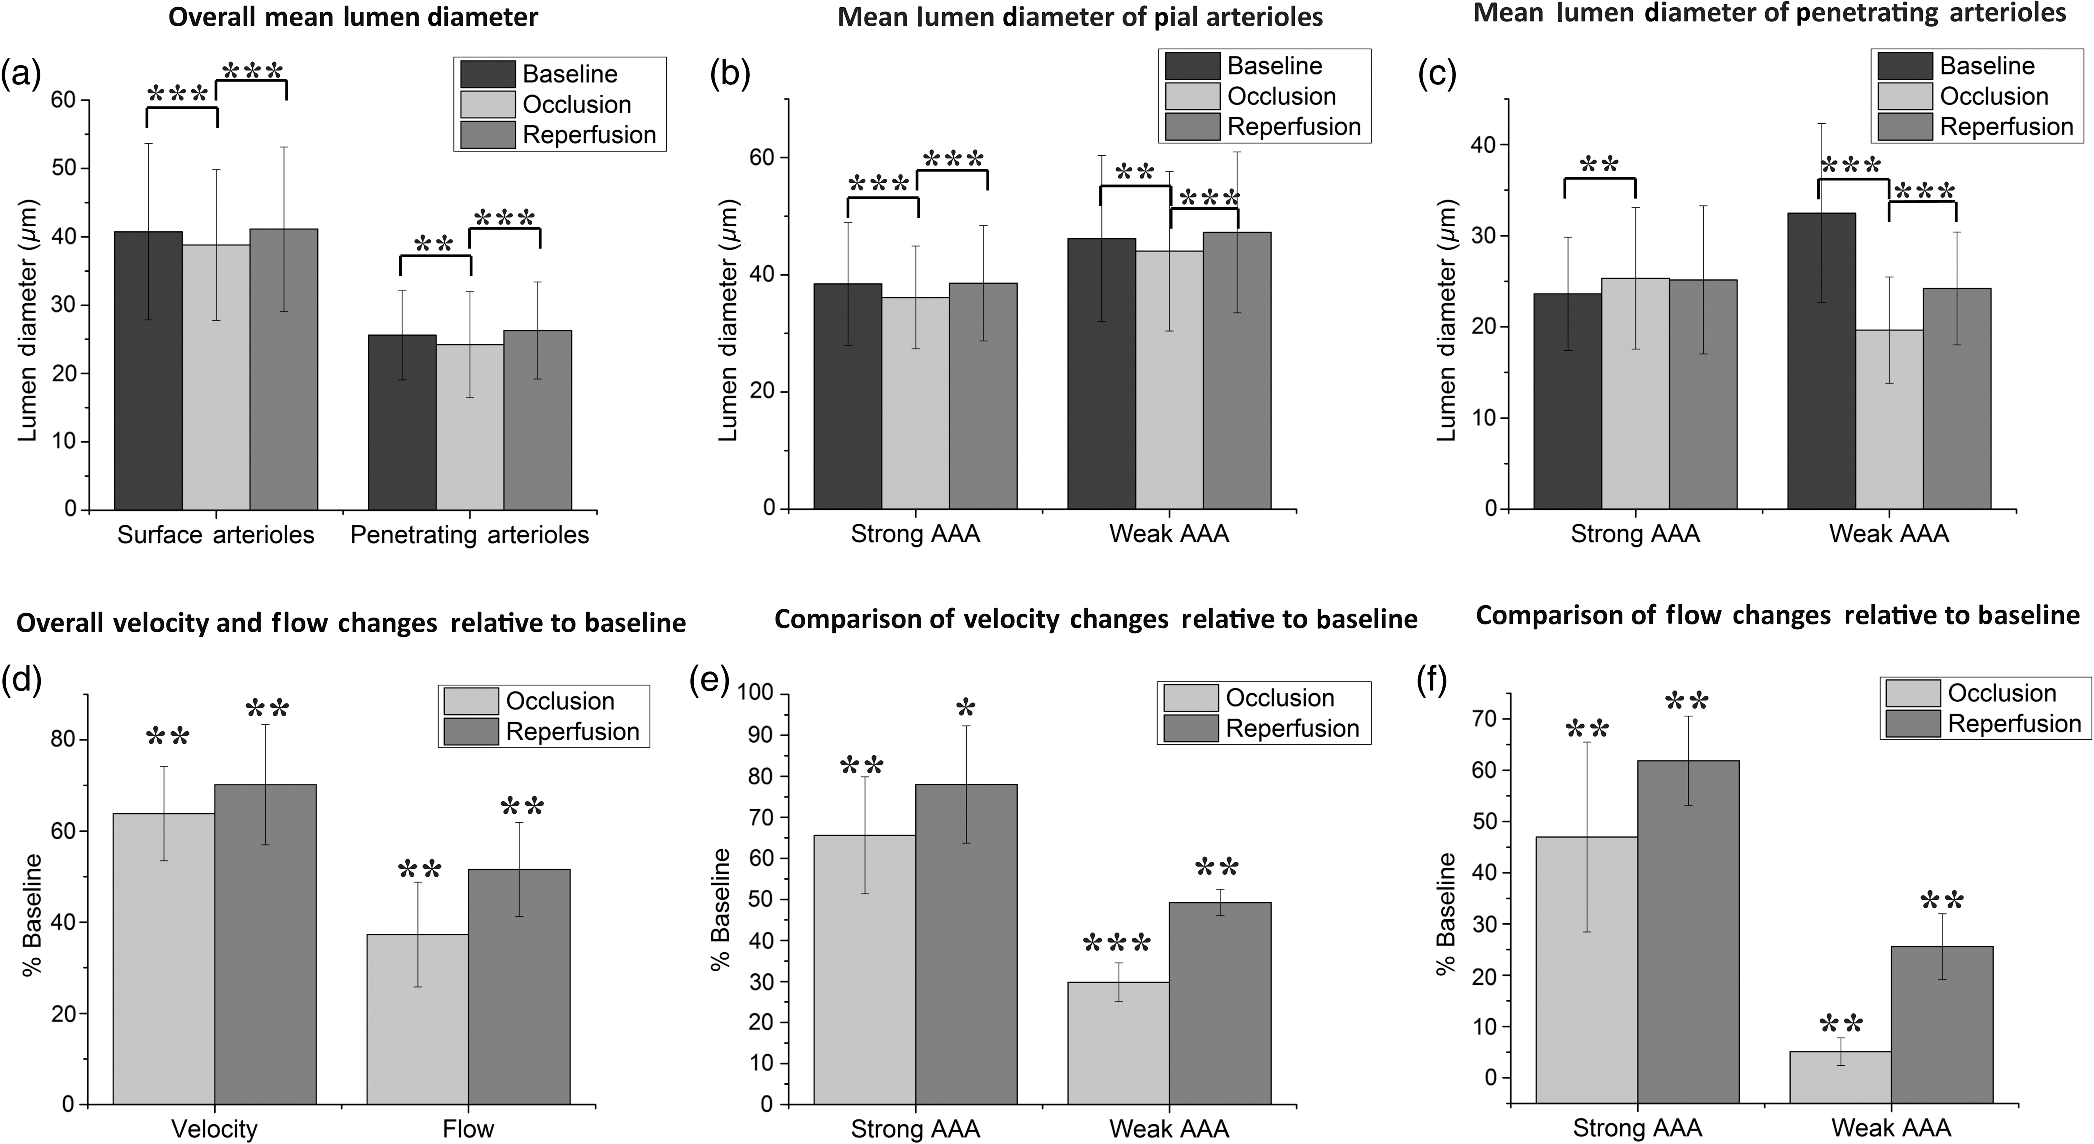 4.DiscussionTo reveal the role of cerebral pial arteriole network in the local hemodynamic homeostasis during ischemia, we evaluated diameter and flow fluctuations in a total of 143 pial and 127 penetrating arterioles overlaying the stroke penumbra from six animals during MCAO. Three main findings are highlighted: (1) The flow reversals occur in the pial arterioles through anastomosis and ACA takes over blood supply to the penetrating arterioles attaching to the MCA side. (2) The penetrating arterioles near a strong AAA territory dilate and sufficiently restore the flow to the ischemic region. (3) The flow compensation decreases with the increase of the distance away from the AAA territory, resulting in poorly recovered penetrating arterioles residing away from the AAA connections during reperfusion. Pial and penetrating arterioles respond differently to an occlusion, and they act together to compensate blood flow to an ischemic region. Reversible blood flow in the pial arterioles occurs according to a pressure gradient. When the brain is subjected to an ischemic event by MCAO, the flow balance in AAAs is immediately disrupted and the retrograde blood flow appears in MCA, as found in Refs. 6 and 10. However, no dilation events are observed among the pial arterioles in the experiment. In contrast, the penetrating arterioles can actively dilate to deliver blood to the ischemic region, but no reversal flow occurs in the penetrating arterioles, which is consistent with the previous finding in Ref. 4. In addition, an interesting fact found in our study is that the distribution of the arteriole dilations is not homogeneous across the ROI. The penetrating arterioles close to a strong AAA connection dilate despite the overall decrease in mean lumen diameter. In other words, the penetrating arterioles constrict significantly in the areas further away from AAAs. To summarize, in order to have active dilations of the penetrating arterioles during severe ischemia, the pial arterioles must be kept flowing due to the regulation of AAAs. Moreover, the lack of blood supply for the pial arterioles also affects the recovery of the penetrating arterioles during reperfusion. Our data report a higher restoration of RBC velocity in the penetrating arterioles near a strong AAA territory in comparison with a weak one, which is critical for the survival of the tissue during stroke recovery. Besides the CBF images, the en face AIP of 3-D OCT structural images from 60 min of occlusion and reperfusion [Figs. 2(a) and 2(d)] also lead to an interesting observation: regions in the areas far from the AAA territory appear darker compared to the uniform looking baseline. The increased light scattering due to the changes in cell morphology in the infract region27 is suspected to be responsible for the nonuniform intensity distribution in the cortex after stroke. This phenomenon was also observed by mapping light attenuation coefficients and was correlated with histology in a similar MCAO model.10 4.1.System LimitationsThe label-free OMAG technique offers a unique ability to quickly image a relatively large area in time-sensitive stroke experiments. However, it comes with some limitations. First, the lateral resolution of our system is with a depth of focus of 0.12 mm. This makes the diameter measurement inaccurate for the pial vessels, especially for those smaller than . Second, since only the axial velocity is measured, it is difficult, if not impossible, to detect the RBC velocities and flow in the pial vessels perpendicular to the optical axis, due to their very small axial velocities, hence a slightly tilted stage is needed to solve this problem. Moreover, the absolute flow information is hard to derive accurately due to the resolution and the light intensity deterioration with depth. Hence, this technique is best suited for comparison studies where errors in the measurements do not affect the differential conclusions. In this study, we tried our best to keep all the crucial parameters, such as the focus of the probe beam and positioning and orientation of the sample, the same among all the imaging sessions. To check if there is a systematic error in the determination of total blood flow in penetrating arterioles, the total blood flow conservation rule is applied. The average velocity and flow in the 127 pairs of penetrating arterioles and rising venules are similar within a %10 margin. In summary, our methods enable us to discover the AAAs’ role in the collateral blood perfusion dynamics in the mouse cerebral cortex after focal stroke. Thanks to the high sensitivity and the large field of views provided by OMAG, we compare regions in cerebral cortex, either closer to or further away from AAA territory during MCAO. The conclusions suggest that AAA plays a major role in active regulation of the pial and penetrating arterioles during stroke, providing blood flow to actively dilate the penetrating arterioles in order to rescue the tissue in the penumbra region. AcknowledgmentsThe work was supported in part by the National Institutes of Health Grants (R01HL093140 and R01EB009682). The authors declare that they have no conflict of interest. The authors would like to thank Dr. Siavash Yousefi for useful discussions. ReferencesF. McCaslin et al.,
“In vivo 3D morphology of astrocyte-vasculature interactions in the somatosensory cortex: implications for neurovascular coupling,”
J. Cereb. Blood Flow Metab., 31 795
–806
(2010). http://dx.doi.org/10.1038/jcbfm.2010.204 JCBMDN 0271-678X Google Scholar
B. Schaffer et al.,
“Two-photon imaging of cortical surface microvessels reveals a robust redistribution in blood flow after vascular occlusion,”
PLoS Biol., 4
(2), e22
(2006). http://dx.doi.org/10.1371/journal.pbio.0040022 1544-9173 Google Scholar
H. A. Kontos et al.,
“Responses of cerebral arteries and arterioles to acute hypotension and hypertension,”
Am. J. Physiol., 234
(4), 371
–383
(1978). AJPHAP 0002-9513 Google Scholar
A. Y. Shih et al.,
“Active dilation of penetrating arterioles restores red blood cell flux to penumbral neocortex after focal stroke,”
J. Cereb. Blood Flow Metab., 29
(4), 738
–751
(2009). http://dx.doi.org/10.1038/jcbfm.2008.166 JCBMDN 0271-678X Google Scholar
Y. Shih et al.,
“The smallest stroke: occlusion of one penetrating vessel leads to infarction and a cognitive deficit,”
Nat. Neurosci., 16
(1), 55
–63
(2012). http://dx.doi.org/10.1038/nn.3278 NANEFN 1097-6256 Google Scholar
H. Toriumi et al.,
“Dually supplied T-junctions in arteriolo-arteriolar anastomosis in mice: key to local hemodynamic homeostasis in normal and ischemic states?,”
Stroke, 40
(10), 3378
–3383
(2009). http://dx.doi.org/10.1161/STROKEAHA.109.558577 SJCCA7 0039-2499 Google Scholar
W. Denk et al.,
“Anatomical and functional imaging of neurons using 2-photon laser scanning microscopy,”
J. Neurosci. Methods, 54
(2), 151
–162
(1994). http://dx.doi.org/10.1016/0165-0270(94)90189-9 JNMEDT 0165-0270 Google Scholar
M. Isshiki and S. Okabe,
“Evaluation of cranial window types for in vivo two-photon imaging of brain microstructures,”
Microscopy, 63
(1), 53
–63
(2014). http://dx.doi.org/10.1093/jmicro/dft043 JMICAR 0022-2720 Google Scholar
Z. Chen et al.,
“Noninvasive imaging of in vivo blood flow velocity using optical Doppler tomography,”
Opt. Lett., 22
(14), 1119
–1121
(1997). http://dx.doi.org/10.1364/OL.22.001119 OPLEDP 0146-9592 Google Scholar
V. J. Srinivasan et al.,
“Multiparametric, longitudinal optical coherence tomography imaging reveals acute injury and chronic recovery in experimental ischemic stroke,”
PLoS One, 8
(8), e71478
(2013). http://dx.doi.org/10.1371/journal.pone.0071478 1932-6203 Google Scholar
R. K. Wang et al.,
“Three dimensional optical angiography,”
Opt. Express, 15
(7), 4083
–4097
(2007). http://dx.doi.org/10.1364/OE.15.004083 OPEXFF 1094-4087 Google Scholar
L. An, J. Qin and R. K. Wang,
“Ultrahigh sensitive optical microangiography for in vivo imaging of microcirculations within human skin tissue beds,”
Opt. Express, 18
(8), 8220
–8228
(2010). http://dx.doi.org/10.1364/OE.18.008220 OPEXFF 1094-4087 Google Scholar
R. K. Wang et al.,
“Depth-resolved imaging of capillary networks in retina and choroid using ultrahigh sensitive optical microangiography,”
Opt. Lett., 35
(9), 1467
–1469
(2010). http://dx.doi.org/10.1364/OL.35.001467 OPLEDP 0146-9592 Google Scholar
Y. Jia and R. K. Wang,
“Label-free in vivo optical imaging of functional microcirculations within meninges and cortex in mice,”
J. Neurosci. Methods, 194
(1), 108
–115
(2010). http://dx.doi.org/10.1016/j.jneumeth.2010.09.021 JNMEDT 0165-0270 Google Scholar
Y. Jia, P. Li and R. K. Wang,
“Optical microangiography provides an ability to monitor responses of cerebral microcirculation to hypoxia and hyperoxia in mice,”
J. Biomed. Opt., 16
(9), 096019
(2011). http://dx.doi.org/10.1117/1.3625238 JBOPFO 1083-3668 Google Scholar
H. Wang et al.,
“Does optical microangiography provide accurate imaging of capillary vessels?: validation using multiphoton microscopy,”
J. Biomed. Opt., 19
(10), 106011
(2014). http://dx.doi.org/10.1117/1.JBO.19.10.106011 JBOPFO 1083-3668 Google Scholar
R. K. Wang and L. An,
“Doppler optical micro-angiography for volumetric imaging of vascular perfusion in vivo,”
Opt. Express, 17
(11), 8926
–8940
(2009). http://dx.doi.org/10.1364/OE.17.008926 OPEXFF 1094-4087 Google Scholar
U. Baran, L. Shi and R. K. Wang,
“Capillary blood flow imaging within human finger cuticle using optical microangiography,”
J. Biophoton., 8 46
–51
(2015). http://dx.doi.org/10.1002/jbio.v8.1-2 JBOIBX 1864-063X Google Scholar
H. Wang, U. Baran and R. K. Wang,
“In vivo blood flow imaging of inflammatory human skin induced by tape stripping using optical microangiography,”
J. Biophoton., 8 265
–272
(2015). http://dx.doi.org/10.1002/jbio.201400012 JBOIBX 1864-063X Google Scholar
U. Baran et al.,
“High resolution imaging of acne lesion development and scarring in human facial skin using OCT-based microangiography,”
Lasers Surg. Med., 47
(3), 231
–238
(2015). http://dx.doi.org/10.1002/lsm.22339 LSMEDI 0196-8092 Google Scholar
Y. Li, U. Baran and R. K. Wang,
“Application of thinned-skull cranial window to mouse cerebral blood flow imaging using optical microangiography,”
PLoS One, 9
(11), e113658
(2014). http://dx.doi.org/10.1371/journal.pone.0113658 1932-6203 Google Scholar
A. Holtmaat et al.,
“Long-term, high-resolution imaging in the mouse neocortex through a chronic cranial window,”
Nat. Protocols, 4
(8), 1128
–1144
(2009). http://dx.doi.org/10.1038/nprot.2009.89 NPARDW 1754-2189 Google Scholar
E. Z. Longa et al.,
“Reversible middle cerebral artery occlusion without craniectomy in rats,”
Stroke, 20
(1), 84
–91
(1989). http://dx.doi.org/10.1161/01.STR.20.1.84 SJCCA7 0039-2499 Google Scholar
R. Reif, U. Baran and R. K. Wang,
“Motion artifact and background noise suppression on optical microangiography frames using a naïve Bayes mask,”
Appl. Opt., 53
(19), 4164
–4171
(2014). http://dx.doi.org/10.1364/AO.53.004164 APOPAI 0003-6935 Google Scholar
S. Yousefi, Z. Zhi and R. K. Wang,
“Eigendecomposition-based clutter filtering technique for optical microangiography,”
IEEE Trans. Biomed. Eng., 58
(8), 2316
–2323
(2011). http://dx.doi.org/10.1109/TBME.2011.2152839 IEBEAX 0018-9294 Google Scholar
L. Shi et al.,
“Wide velocity range Doppler optical microangiography using optimized step-scanning protocol with phase variance mask,”
J. Biomed. Opt., 18
(10), 106015
(2013). http://dx.doi.org/10.1117/1.JBO.18.10.106015 JBOPFO 1083-3668 Google Scholar
S. Kawauchi et al.,
“Lightscattering signal may indicate critical time zone to rescue brain tissue after hypoxia,”
J. Biomed. Opt., 16
(2), 027002
(2011). http://dx.doi.org/10.1117/1.3542046 JBOPFO 1083-3668 Google Scholar
BiographyUtku Baran received his BS and MS degrees in electrical engineering from Koç University, Istanbul, Turkey, in 2010 and 2012, respectively. Currently, he is a PhD student in the Department of Electrical Engineering at the University of Washington, Seattle, USA. He is the author/coauthor of more than 20 peer-reviewed research papers and the coinventor of two pending US patents. His interests include MEMS, biomedical optics, and neuroscience. He is a recipient of SPIE Newport Research Excellence Travel Award. |


