
|
|
1.IntroductionOptogenetics has been proven to be a powerful tool to manipulate neural activity in both rodents1–3 and nonhuman primates.4–10 In the previous period during its development in the nonhuman primate model, researchers found that they could apply this technique to modulate neural activity by light. Han et al. first successfully expressed channelrhodopsin (ChR2) in the macaque frontal cortex in 2009,4 followed by another inhibitory archaerhodopsin (ArchT) in 2011.11 The same year, in 2011, another team at Stanford further characterized the safety and efficacy of optogenetics in primates.5 However, regardless of neural modulation, none of these studies have reported any behavioral effect driven by optogenetic stimulation. Starting in 2012, researchers found evidence that optogenetic stimulation in different cortical areas could affect monkeys’ eye movement and influence decision making.6–10 Recently, it has been reported that monkeys can detect optogenetic stimulation at the somatosensory cortex.12 These studies demonstrated not only the power of optogenetics to investigate brain function, but also the possibility of future application in clinical settings. Because optogenetics offers advantages over traditional electrical microstimulation or pharmacological methods in both spatial and temporal precision as well as allowing bidirectional neural manipulation (excitation versus inhibition), many nonhuman primate labs are now attempting to incorporate this novel technique in their experiments. Despite some reported successes by a handful of groups,4–11,13 many researchers still find it difficult to reliably transduce cells in the monkey brain and subsequently read out neural responses to light stimulation. Here, we illustrate step-by-step methods that we have used in our previous studies10,12 to guide others in setting up their own optogenetic experiments. The methods described here are simple, highly replicable, and all devices and materials are easy to obtain. In the following text, we describe our general procedures, including the optimization of various parameters, as well as the means of detecting modulation and verifying expression. 2.Materials and Methods2.1.General ProceduresThe objective of optogenetics is to activate (or inhibit) certain types of neurons by light with cell-type specificity. To do this, neurons need to be transduced with genes to enable the expression of certain light-activated membrane proteins. The current state-of-the-art in primates is to embed such genes into a viral construct. Therefore, a single optogenetic experiment in primates includes, as elaborated next, these five steps: virus preparation, virus testing, virus injection, stimulation/recording, and histological verification. Many variations exist between the procedures applied by different groups in these steps, especially in injection and stimulation. The following is our protocol. 2.1.1.Virus preparationA vast variety of viruses for optogenetics are commercially available from vector core facilities (i.e., the UNC Vector Core14; or Penn Vector Core15). In general, there are three types of opsins: excitatory (i.e., ChR2, C1V1), inhibitory (i.e., NpHR, ArchT), and step-function opsins. Each opsin is sensitive to a different wavelength of light and with different response properties upon light illumination. For reviews that compare different opsins, please refer to Yizhar et al.,16 Fenno et al.,17 and Mattis et al.18 In most of our experiments with nonhuman primates, we have used the viral construct AAV5--C1V1 (E122T/E162T)-TS-EYFP. C1V1 is a red-shifted excitation variant of ChR2 that peaks at a wavelength of approximately 540 nm.19,20 This viral construct mainly targets excitatory neurons (determined by the promoter and AAV5 virus), with which reliable neural and behavioral modulation has been previously reported.10,12,21 However, the methods we detail next are applicable to all types of viruses used in optogenetics studies. The handling of the viruses from their arrival from the vector core to the beginning of injections should be performed in the following way. The virus typically arrives from the vector core in a vial, which we immediately aliquot into smaller amounts (10 or , depending on the amount we plan to use at one time plus some surplus). Aliquoting the original vial only once is critical, as multiple freeze–thaw cycles could potentially damage the virus and impair the efficacy of future injections. 2.1.2.Virus performance verificationIn our experience, there is a significant variation in the performance of each batch of virus obtained from a vector core facility. Some batches lead to no or weak efficacy in opsin expression. Therefore, it is important to verify the performance of a viral construct before injecting it into a primate. Our approach for verification is to inject the virus into at least two rats to confirm the efficacy of opsin expression with neuromodulation experiments and histology. We have found that if a virus shows good expression in rats, it has a high chance of success in primates. While this might not be true for every viral construct (note that we have only explored a few viral constructs in our studies), we believe that if a virus does not show good expression in rats, it will likely have problems in the monkeys. Therefore, we recommend checking the viruses in rats if possible. We note that the differences in performance between different batches of viruses are likely to be related to the titer of the virus, although we have not systematically tested this possibility. In our own experiments, we have successfully used titers of both and . 2.1.3.Virus injectionInjections can be performed either in the operating room (OR) while the monkey is anesthetized5,9 or in the primate chair while the monkey is seated under head restraint.4,10 The latter approach has obvious advantages. First, chair injections are more flexible than injections in the OR, where additional veterinary personnel are needed. Second, it is also better for the animal, especially when the procedure requires multiple days to complete, as injections can be performed in the same conditions as recording sessions, without requiring stereotaxic placement, anesthesia, or sedation. These “in-chair” injections are, of course, only feasible when there is a pre-existing chamber or accessible burr hole in the skull, providing access to the brain. However, the “in-chair” injections require rigid animal restraint and calming animals; movement needs to be kept to a minimum to avoid potential tissue damage (also see Discussion). Injection equipment used by different groups differs significantly. Typically, an injection needle and a micropump are used. Additionally, other equipment to position the injection needle at the precise target location is required. Both Han et al.4 and Diester et al.5 injected viruses through a needle which was connected to a syringe via an oil-filled polyimide-coated glass tube. We found that this method was not optimal for controlling the injection volume as the dead space between the syringe and the needle potentially results in a significant amount of virus wasted in the tube. Therefore, it is preferable to shorten the path and directly connect the needle with the syringe. Cavanaugh et al.8 performed the injection using a custom-built injectrode, which enabled them to inject immediately after identifying a target site. The main limitation of their injectrode is its size, which creates unavoidable tissue damage and makes it unsuitable for repeated use. As an improvement over the existing paradigms, we developed our injection system as illustrated in Fig. 1, which could easily be applied in-chair with reduced tissue damage. Using this system, we control the injection needle as we normally control a recording electrode, and perform the injection while the animal is head-fixed as in a recording session. We modified our primate chair to hold a stereotaxic rail on which injection equipment could be rigidly held. The same setup could be adapted for OR injections by mounting it on the surgery stereotax. The virus was withdrawn into a syringe cemented to a 32-gauge needle (Model 702 SN, Hamilton, Reno, Nevada). The syringe was mounted on a microsyringe pump (UltraMicroPumps III, World Precision Instruments, Sarasota, Florida), which was used to control the injection volume and speed by directly controlling the movements of the plunger of the syringe. A micropositioner (In vivo manipulator, single axis, Scientifica, East Sussex, United Kingdom) holding the pump via a custom built piece (silver block attached to the micropositioner in Fig. 1) was mounted on the stereotaxic apparatus [Kopf, three-dimensional (3-D) manipulator] to accurately locate the target depth (with micrometer resolution), and the 3-D manipulator was used to adjust the rough position and angle. While targeting a particular location in the brain is straightforward with our system, before injection it is important to verify that the target brain site for injections is relevant for the particular study. To verify this, we recommend performing electrophysiological recordings beforehand to map the region functionally. Fig. 1Injection equipment and organization. A cemented syringe and needle are mounted on a micropump. A micropositioner and a three-dimensional (3-D) manipulator are used to control the positioning of the needle. A standard Kopf rail is attached to the chair and serves as a rigid base. The inset on the bottom right shows the Kopf X-Y stage, which is used to locate the position in the chamber. 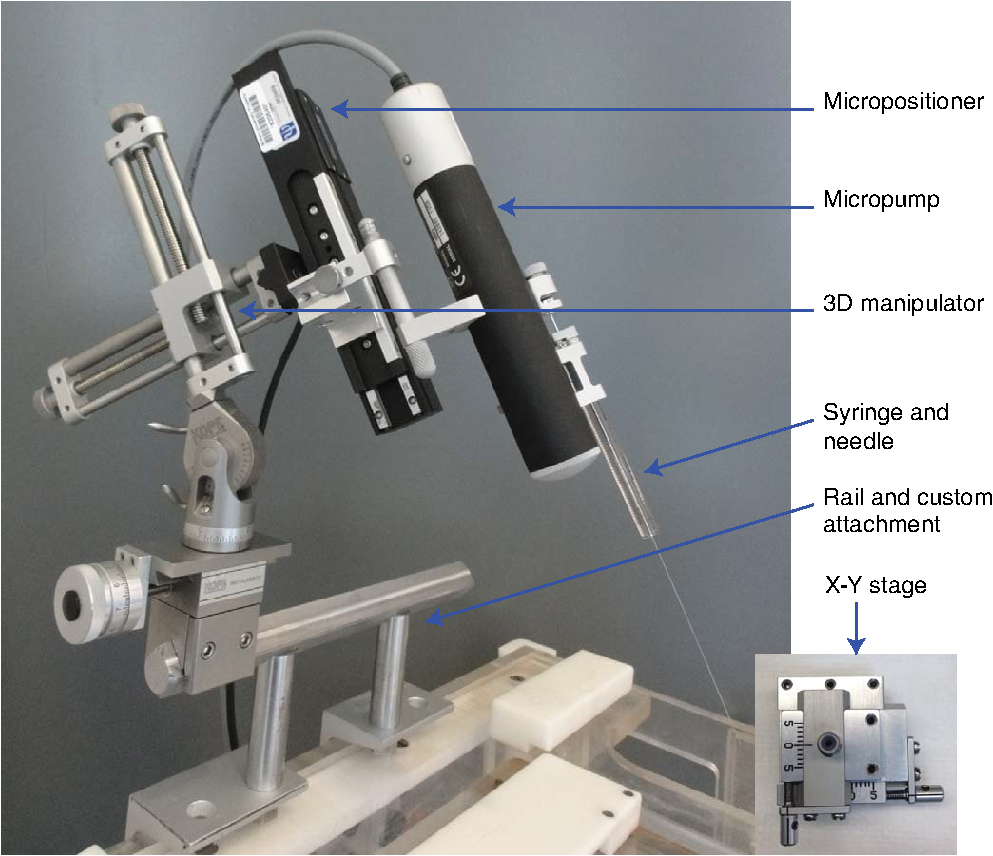 In many cases, the target region covers a significant volume in the brain. Based on histology, we have found our injections routinely lead to opsin expression in a cylindrical brain volume of a 1 to 2-mm diameter and height. Therefore, in cases where we would like to transduce neurons in a large volume, we inject the virus at different depths spaced 1 mm apart at each penetration site. The procedure for multidepth injections is as follows. Once the needle had been aligned with the guide tube (25 gauge), we lower the needle to the deepest target location (typically 8 to 9 mm in the lateral intraparietal area (LIP)). We start the injection from the deepest site, and then retract to a shallower site 1 mm above it. The reasons for starting with the deepest site are, first, not to interfere with sites that have already been injected. Passing the needle through these sites could indeed affect the diffusion of the viral solution and lead to adverse effects. Second, starting from the deepest site allows for deposition in the penetration track with subsequent diffusion and avoids potential reflux. Typically, one microliter (although larger volumes of have also been used by our group) of virus per depth location is injected at a speed of 100 to . A waiting time of 5 min after each injection seems to allow diffusion before retracting the needle. Usually, to obtain a larger transduced area, injections at multiple penetration sites (separated from each other on the cortical surface) and at multiple depths are recommended. 2.1.4.Optical stimulation and neural recordingA typical optical stimulation system includes a light source, delivery path and output, and control by an external TTL/analog signal. In all published optogenetic studies in primates, a laser coupled to an optical fiber has been utilized as the light source. This configuration can provide sufficient optical power [light-emitting diodes (LEDs) can be another option, but keep in mind that the LED wavelength spectrum is broader and coupling efficiency to an optical fiber is low). Lasers with fiber-optic couplers are commercially available (e.g., OptoEngine LLC, Coherent Inc., Omicron Laserage, and so on). An optical fiber connected to the coupler can deliver light into the monkey brain. To avoid excessive tissue damage, a small outer diameter is recommended for a fiber that needs to go into the brain. Previous studies mainly used fiber of 200 to diameter.4–6,8 The size of the fiber includes the core, the cladding, and the coating. The coating provides extra buffer layer to protect the fiber (i.e., the fiber mentioned previously has a coating diameter of about ), and usually it will be removed before use. Note that different fibers having the same core size may have different cladding size. Caution should be used when indicating fiber size in publications. In our previous papers,10,21 smaller fibers with cladding (10 or core) were used. Another important parameter of the optic fiber is the numerical aperture (NA), which is a dimensionless number representing the range of angles at which the fiber can accept or emit light. In general terms, a larger NA means a broader dispersion of light emitted from the fiber. One issue reported by previous studies is that fibers with blunt tips can cause tissue damage and subsequently make long-term recording difficult.6,22 To address this, we taper the fiber to a tip angle of approximately 10 deg [ in Fig. 2(b)] using a laser puller (P-2000, Sutter Instruments). This modification, together with using a smaller-diameter fiber, significantly reduces tissue damage and renders it possible to repeatedly penetrate the same area for months (more than 6 months; generally, more than 100 penetrations were done for each monkey). Another benefit of such modification is that a significant amount of light can exit the fiber along the edges of the taper before reaching the tip (Fig. 2), which increases the volume of tissue illuminated compared to a blunt tip, and thereby reduces the peak light intensity in the tissue for a given power. In general, special attention should be given to the amplitude of peak light intensity in the tissue since high light intensity could cause tissue damage or nonspecific heat-induced effects.21 Fig. 2Tapered fiber and optrode. (a) A pulled fiber after connecting to a ferrule and polishing of the ceramic end. The inset zooms in the tapered end, which also shows the fiber with and without coating. (b) The tip of the optrode under high-resolution microscope, which shows the relative position of the tapered fiber and the tungsten electrode. (c) Illumination of light scattering from the fiber tip. 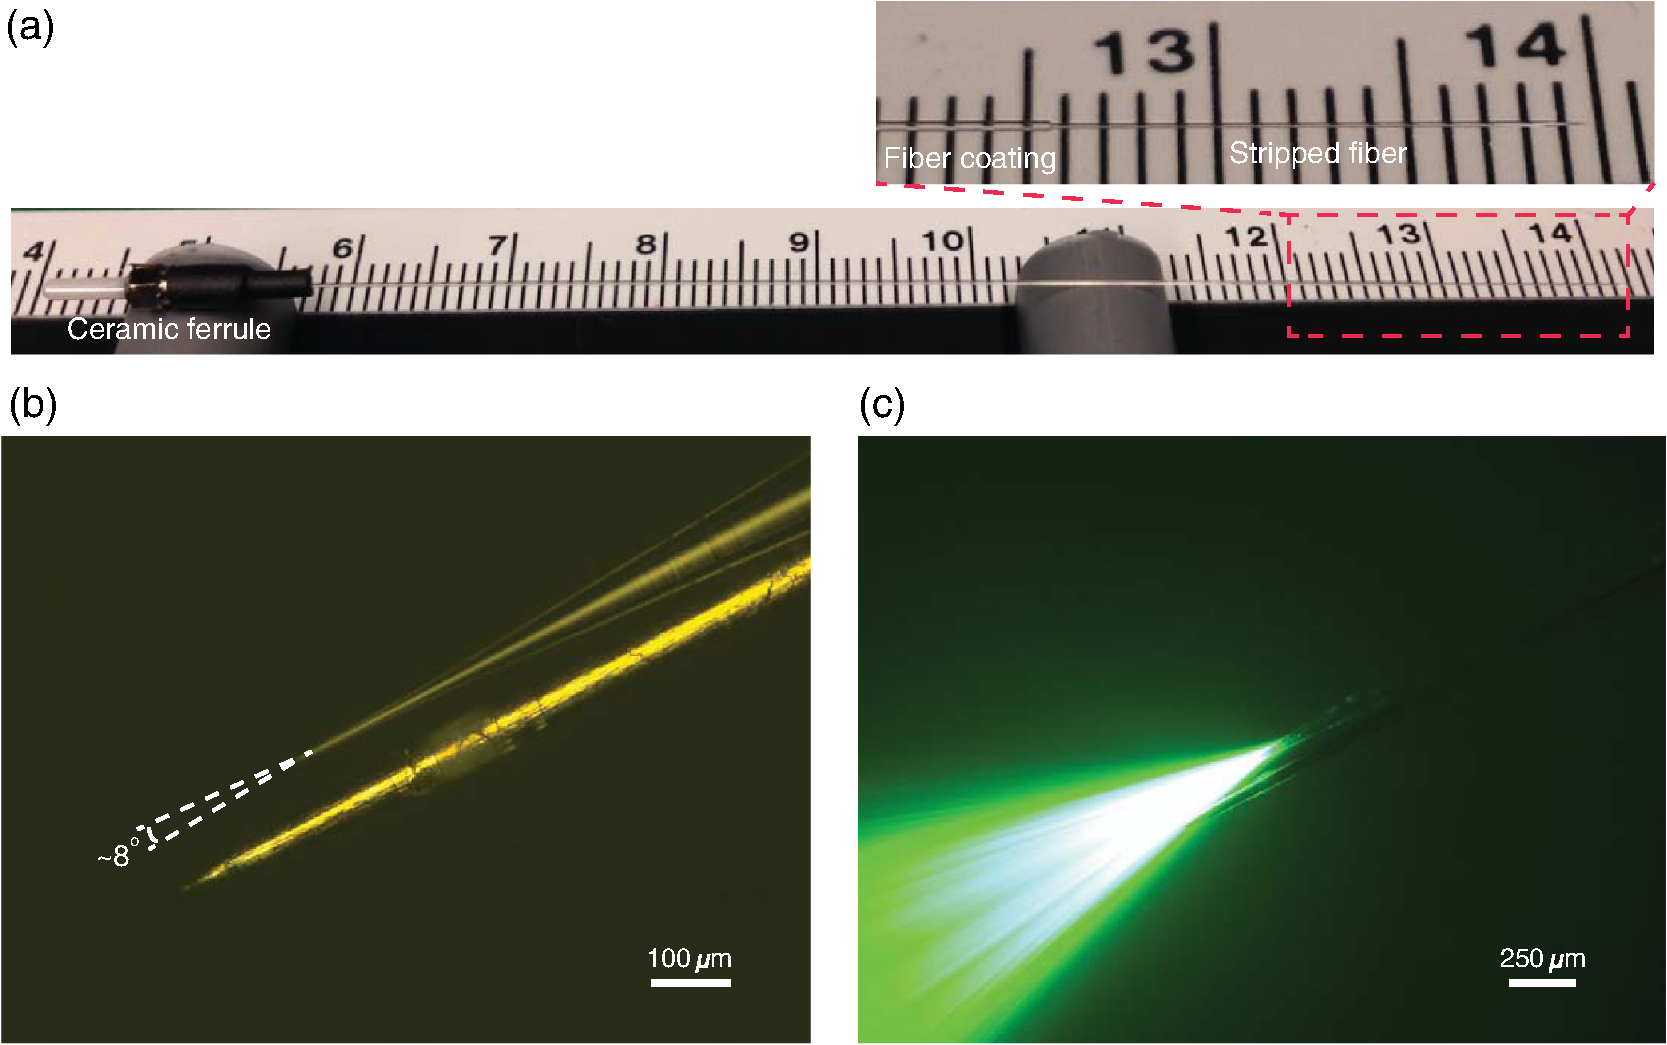 Different stimulation parameters, including power, frequency, and duration, were applied by previous studies. In these studies, either “power” or “intensity” was used to report the amount of illumination, but these are different physical quantities which use completely different units. Power is the energy emitted per unit time, in units of watt (W), milliwatt (mW), and so on, which can be directly measured using a power meter. Intensity is the power per unit area, in units of . One can easily measure the power of a laser by placing the output fiber into the sensor of a power meter, but further calculation is needed to determine intensity. For example, the light intensity at a blunt fiber end is the optical power divided by the area of the fiber core, but for a tapered fiber, the core is attenuated after pulling; therefore, the intensity will vary along the tip. In brain tissue, the light will scatter after exiting the fiber and the intensity will dramatically drop at increasing distances. To see a simulation of light intensity distribution in brain tissue, please refer to Ozden et al. for a blunt fiber21 and Dai et al. for a tapered fiber.10 In terms of optogenetic stimulation, it is of great interest which illumination parameters are optimal. Unfortunately, there is no clear-cut answer for this as these parameters depend on the fiber, opsin, brain area, and other factors. Before setting these parameters, one has to be careful about the heat accumulation around the fiber tip due to light absorption by the tissue, which potentially could damage the brain. To ensure safety, we have previously calculated that, given certain assumptions and with continuous light illumination, the power should not exceed 12 mW for a core fiber and 40 mW for a core fiber.21 Note that higher powers can be applied when pulsed (instead of continuous) stimulation is used, depending on the stimulation duty cycle. However, with our setup we have found that a few hundred microwatts is sufficient to activate neural activity when using the C1V1(T/T) opsin. One advantage of optogenetics is that it allows simultaneous recording during stimulation. Several special readout devices, namely optrodes, have been designed for this purpose.21,23,24 Lacking these more advanced and expensive tools, we have found an alternative solution is to build an optrode by gluing an electrode and a fiber together. Note that the optrode used in Diester et al.5 was a electrode glued with a fiber, so the overall size was at least , which is not ideal for an acute recording device. We refined this optrode by using a smaller fiber () and a smaller electrode (), rendering the optrode diameter significantly smaller, around in total.10 This smaller size is not dramatically larger than a standard recording electrode. Using this kind of device, we have been able to repeatedly obtain effective neural modulation from a transduced area approximately for months without having the problem of serious cortical damage reported by Gerits et al.6 More importantly, virtually no artifacts were observed at the single/multiunit level using our filter setting (300 to 6000 Hz). Given that others have observed light-induced artifacts during recordings with metal electrodes and that same type of electrode was used in a similar optrode configuration,4 we think using a smaller size electrode is essential as decreasing the area of light exposure is effective in eliminating photoelectric reaction ( here versus by Han et al.4). 2.1.5.Expression verificationTo verify that the injected virus does indeed transduce neurons in regions of interest, the most straightforward approach is to find optically induced neural modulation in those injected sites. At sites with sufficient opsin expression, neurons should be either activated (for excitatory opsins, Figs. 3 to 4) or suppressed (for inhibitory opsins) upon light stimulation. The question is how to find optical modulation after injection. For us, the general procedure is described as follows. We usually start by listening (using an audio monitor) to the change of background noise as we deliver light pulses through the optrode while being lowered in the brain. Typically, as the optrode gets closer to the transduced area, we begin to hear a weak hash, like the distant crash of waves, synchronized with light pulses. The sound gets stronger as the optrode gets deeper. There might be no visible spiking on the oscilloscope at this point, but by lowering the speed of progression, and listening patiently to the audio signal, eventually single/multiunit modulation can be detected in most cases after hearing this initial low-frequency noise. In our experience, the approach described previously is very efficient for identifying regions of opsin expression and finding spiking units responsive to light. As an alternative approach, one might first start looking for spiking units without checking the light responsiveness in the tissue, and then checking whether the isolated units are light-sensitive. In our hands, this approach was less efficient in finding light-responsive units, since the isolated units could be in a region of weak or no expression. Overall, the background noise during light pulses may reflect the network effect of multiunit response, thus it should be an effective source to identify optically modulated sites. Fig. 3Example of optogenetic modulation. Each column represents a different stimulation frequency. From top to bottom, we show: (a) a schematic of the pulse train delivered to the laser at each stimulation frequency, (b) the raw spike train from one randomly picked trial for each frequency, and (c) the raster and the spike density functions. 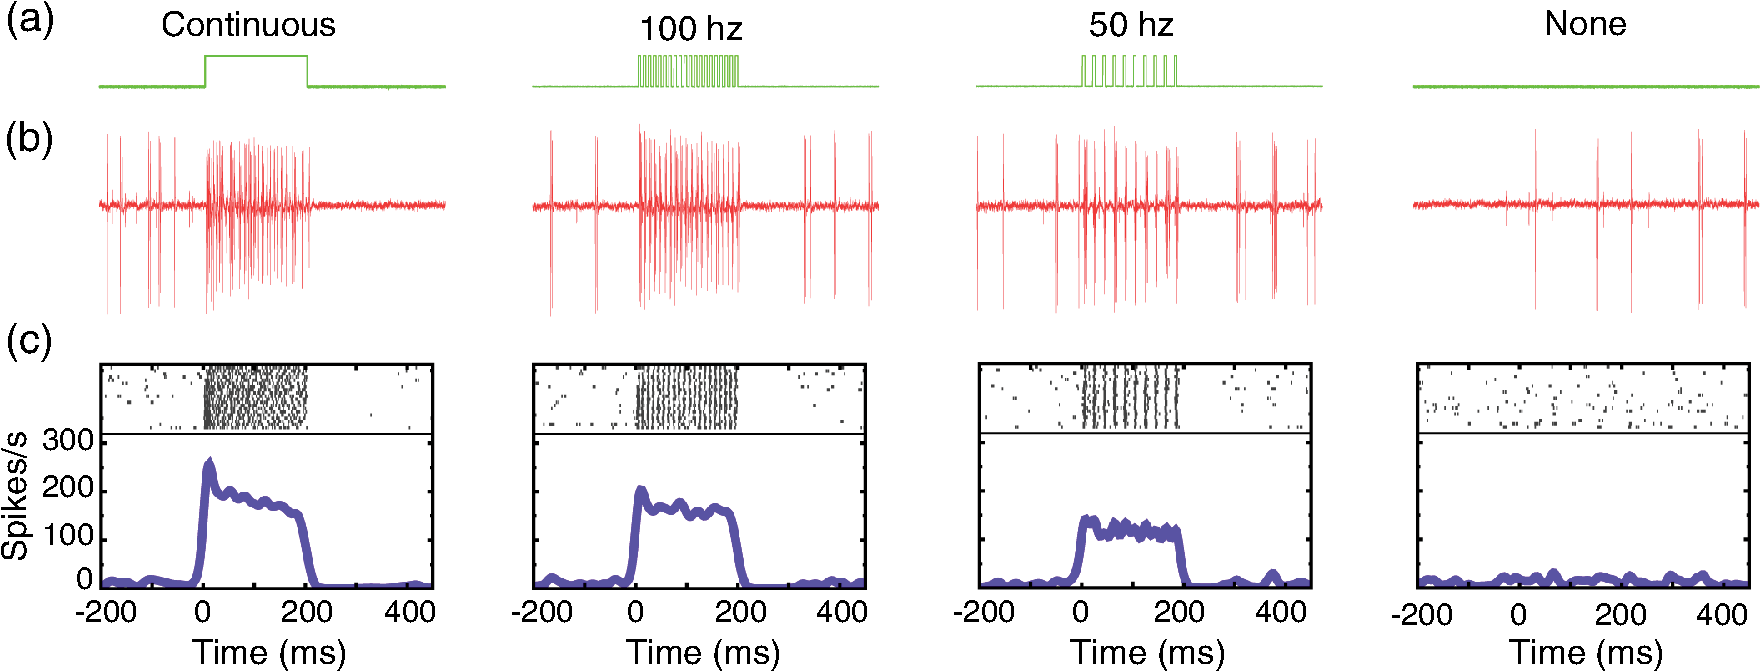 Fig. 4Comparison of different optical stimulation powers. Neural responses to a 200 ms continuous stimulation with measured stimulation power of (a) 0.25, (b) 0.5, (c) 1.0, and (d) 1.5 mW. 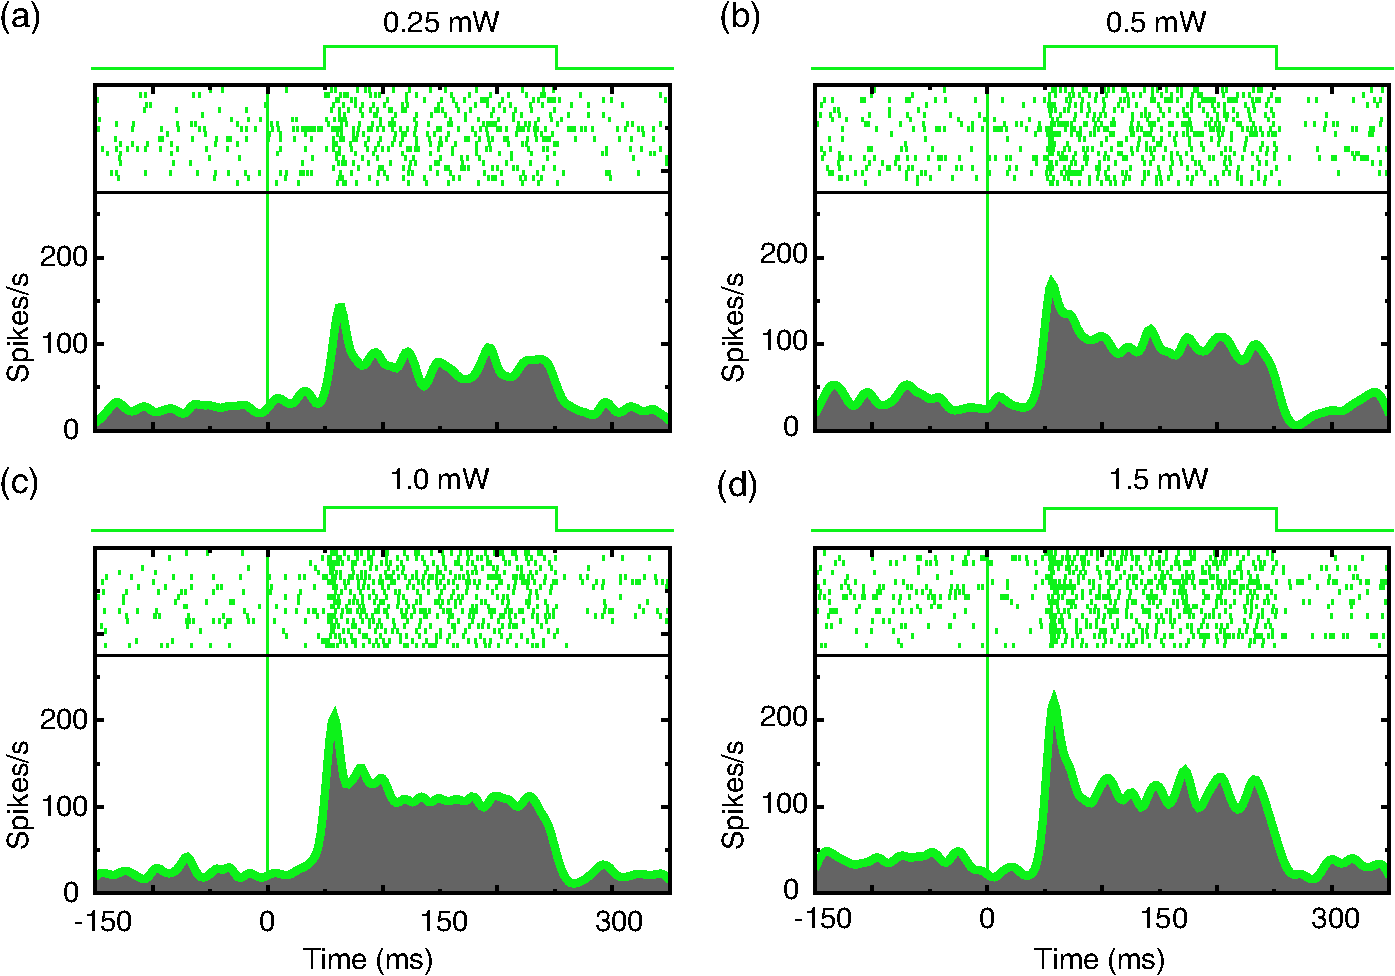 In addition to multiunit modulation, previous studies have also reported the modulation of local field potentials (LFPs).4,5,9 Typically, for sites expressing opsin C1V1(T/T), we have observed a negative deflection in LFPs upon green light illumination, followed by a rebound after stimulation [Fig. 5(a)]. However, as reported by Han et al., such a modulation pattern can also be observed in saline as artifacts, especially when a large-size fiber and electrode are used.4 Therefore, even in a region of opsin expression in the brain, it is not straightforward to distinguish opsin-induced LFPs from light-induced artifacts. Therefore, LFP-like signals in response to light pulses do not necessarily mean that the signal is neural or that the opsin is being properly expressed in nearby tissue. In fact, light-induced artifacts are more pronounced in the LFP bandwidth and depend on both the stimulation power and wavelength of light. Even in cases where the amplitude and shape of the artifact could be potentially different from optically induced LFPs [Fig. 5(b)], we still think LFPs cannot be reliably distinguished from artifacts and therefore are not a reliable way to identify regions of opsin expression. A more meaningful way may be to first characterize the artifacts at fresh sites that have not been injected and far away from injection sites. No artifacts observed at fresh sites could increase the reliability of LFPs observed in transduced sites [Fig. 5(c)]. However, given the variety of LFP patterns for different opsins,5,9 the mechanism underlying optical-induced LFP is still unclear. The question of using LFP as a verification measurement remains open. We do recommend testing LFP artifacts in saline and in the brain beforehand. Fig. 5Typical local field potential (LFP) versus artifact. (a) Typical LFP recorded in a site transduced with C1V1(T/T). Black, purple, and green represent stimulation of continuous, 100 and 50 Hz, respectively. Red is the base line when no stimulation was applied. Stimulation period is indicated by the green shadow. Same conventions are used for b–c. (b) LFP recorded in saline. (c) LFP recorded in a nontransduced site.  As an alternative approach, in vivo fluorescence detection systems were proposed which allowed monitoring expression in vivo after injection.5,21 Diester et al. reported that the fluorescence measurements correlated with neuron responses to light stimulation. Theoretically, this could be an ideal substitution for histology, especially for an ongoing experiment. However, our experience has shown that detecting an increase in fluorescence in a given location does not necessarily mean optically induced neuromodulation will be present. The ultimate verification consists of histology, which is reliable and useful to characterize the efficacy of expression. However, we do not recommend sacrificing every individual subject for this purpose. Instead, we suggest testing the expression efficacy in a rat as we have observed very similar result in both recording and histology. 2.1.6.Validation of the functionality of viral construct in ratsAs previously mentioned, performing virus injections in rats is suitable for validation of virus efficacy and can be used in lieu of primate histology. Our protocol is detailed next. The viral construct to be tested was injected into two cortical areas (usually motor, somatosensory, or posterior parietal cortical areas) from the same hemisphere in two rats. As a control, a viral construct already tested and of known efficiency was injected into the same cortical areas on the other hemisphere. The injections were performed as follows: rats were mounted on a stereotaxic frame (Model 1730, Kopf Instruments) under isoflurane (2%) anesthesia, and under aseptic conditions, a small skin incision () was made to expose the skull above the target areas for injections. Small burr holes () were made at each site to expose the brain with the dura intact. Through each burr holes, the virus was injected at two depths (0.5 and 1.5 mm) with the same micropump-syringe system described previously mounted to a stereotaxic micromanipulator. The injection amount and speed were similar to that used in primates, i.e., of virus per depth at a speed of and 5 min waiting time after injections. After injections were completed, the burr holes were covered with bone wax and the skin was sutured. After allowing at least 3 weeks for opsin expression, the rats were anesthetized with either isoflurane () or ketamine/xylazine () and the sites injected with the investigated virus were exposed with two craniotomies (). The location of viral expression was first determined by investigating the yellow fluorescent protein (YFP) fluorescence (YFP is coexpressed with the opsin) at the brain surface. For this purpose, we delivered 473-nm laser light over the craniotomy and observed the YFP fluorescence with a stereomicroscope carrying a YFP filter. Usually, YFP fluorescence signal was visible at the surface throughout the craniotomy. After verifying the expression and finding the site of peak expression by observing the fluorescence, we validated neuromodulation by inserting an optrode into the region of peak fluorescence intensity and delivering occasional light pulses (, 561 nm) of 1 to 2 s duration and observing single and multiunit spiking activity. Once the functional expression was validated, the rats were perfused with 2% paraformaldehyde to prepare thick histological slices. The slices were investigated for the extent of YFP expression under a fluorescence microscope. This time, the YFP fluorescence intensities and pattern of expressions due to injections of the tested and control viruses were compared. If they appeared to be similar, we concluded that the new viral construct was suitable for primate use. 2.2.Materials2.2.1.ReagentsVirus: AAV5--C1V1(E122T/E162T)-TS-EYFP (UNC vector core); Dilute bleach (10% dilute bleach); 95% ethanol (Fisher Science Education, cat. ID (catalog ID): A405F-1GAL); Cidex solution (Advanced Sterilization Products CIDEXPLUS 28 day solution, cat. ID: 2683/2785); Chlorhexidine solution (Vet Solution, cat. ID: 91010); Sterile saline. 2.2.2.EquipmentVirus aliquotPCR tube (TempAssure 0.5 mL, available at usascientific.com, cat. ID: 1405-8108); Filter tip (TipOne 0.5 to , available at usascientific.com, cat. ID: 1121-4810); Pipette (ErgoOne 2 to single channel, available at usascientific.com, cat. ID: 7100-0220). Virus injectionCemented syringe and needle (Hamilton, , 32 gauge, custom length, point type 4, cat. ID: 80408); Micropump (WPI, UltraMicroPump with SYS-Micro4 controller, cat. ID: UMP3-2); Micropositioner (Scientifica, in vivo manipulator, single axis, cat. ID: IVM 1000); Stereotaxic arm (Kopf, Model 1460 three-dimensional manipulator); Stereotaxic rail (Kopf, Model 1530 Frame); Custom rail attachment (custom piece that could attach the rail to the chair); PCR tube holder (custom piece that could hold the tube and make bottom of the tube visible); Guide tube (25 gauge, custom length); X-Y stage (Kopf, Model 608-B X/Y slide). Laser delivery561-nm laser (OptoEngine, 561-nm laser, MGL-FN-561/100 mW with TTL/analog modulation); Laser adapter (OptoEngine, fiber coupling adapter with SMA905 connector); Fiber patch cord (Thorlabs, Custom patch cord, fiber cat. ID: FG050LGA, End A: SMA905, End B: 1.25 mm LC ceramic ferrule, Jacket: FT030); Pulse generator (custom program that can send TTL/analog pulse of different frequency and duration). Optrode fabricationOptical fiber (Thorlabs, core, cladding, cat. ID: FG050LGA); Fiber connector (Precision Fiber Products, LC 1.25 mm OD multimode ceramic zirconia ferrule, cat. ID: MM-FER2007CF-1270); Sleeve (Precision Fiber Products, ceramic split sleeve, cat. ID: SM-CS125S); Fiber stripping tool (Thorlabs, cat. ID: T06S13, Cladding/Coating size: ); Laser puller (Sutter Instruments, Laser-based micropipette puller, cat. ID: P-2000/F); Epoxy (Thorlabs, Epoxy for fiber optic connectors, cat. ID: F123); Electrode (FHC, tungsten electrode, cat. ID: UEWLCESM7N4G); Hot plate (Amazon, Corning Digital Hot Plate, , 120 VAC); Heat shrinking tube (DigiKey, Heat Shrinking tubing kit, cat. ID: Q2Z1-KIT-ND); Polishing disk (Precision Fiber Products, aluminum fiber optic polishing disk for LC connectors, cat. ID: M1-80754); Polishing plate (Thorlabs, glass polishing plate, cat. ID: CTG913); Polishing sheet (Thorlabs, grit polishing sheet, cat. ID: LFG5P); Polishing sheet (Thorlabs, grit polishing sheet, cat. ID: LFG1P); Microscope (Zeiss, Model Axiostar); Super glue (Krazy, all-purpose glue pen); Silicone tube (A-M Systems, biomedical silicone tubing, cat. ID: 806400); Power meter (Thorlabs, compact power and energy meter console, cat. ID: PM100D); Power sensor (Thorlabs, Integrating sphere photodiode power sensor, cat. ID: S140C). 2.3.Experimental Procedures2.3.1.Aliquoting virusThe purpose here is to aliquot the virus into individual vials.
2.3.2.Injecting virusThe injection plan here is to inject 2 to 3 locations covering 5 to 6 mm depth each.
2.3.3.Making the optrodeThe purpose here is to make a tapered fiber of length and then glue with a tungsten electrode of approximately the same length. Readers are welcome to contact the authors to obtain further instruction.
2.3.4.Stimulating and recording
2.4.TimingSteps 1–5, aliquoting virus: 40 min; Steps 6–8, preparation for the injection: 3 h; Steps 9–23, performing the injection: 4 h; Steps 24–37, making optrode: ; Step 38, waiting for virus express: 4 weeks; Steps 39–41, preparation for the optical stimulation: ; Steps 42–45, probing the expression: 2–4 h. 2.5.TroubleshootingTroubleshooting advice can be found in Table 1. Table 1Troubleshooting table.
3.Results3.1.Cell Type Specific Neural ActivationThe virus we have primarily used (AAV5) with the promoter mainly targets excitatory cells. We have successfully expressed C1V1 in multiple areas (including LIP, IT, S1, and PMv) in multiple monkeys. Typically, cells expressing the C1V1(T/T) opsin will be activated upon green light illumination. Figures 3(a)–3(c) show the responses of one example neuron from LIP when stimulated with 200 ms light pulses (561 nm, 1.0 mW) at different frequencies (continuous, 100 and 50 Hz), compared to spontaneous responses. This neuron was strongly modulated and time-locked to the light pulse. Figure 3(b) shows the raw spike train from one randomly chosen trial, from which we did not observe any artifact caused by light onset or offset. We also noticed that the amplitude of the optogenetically evoked spikes was almost identical to spontaneous spikes, even if a slight reduction was observed upon continuous or high-frequency stimulation. It was also very common to observe poststimulation inhibition, i.e., the neuron remaining quiet for after the end of optical stimulation. This quiet period varied depending on the strength of stimulation. Generally speaking, higher power or higher frequency caused longer poststimulation inhibition. To demonstrate the influence of optical power on neuronal responses, we further characterized the neural response properties to different stimulation power settings. Figure 4 shows the response of one neuron to four power levels (0.25, 0.5, 1.0, and 1.5 mW). Interestingly, even at power levels as low as 0.25 mW, this neuron could be activated. The response amplitude also seemed to saturate at a certain level, as stimulation of 1.5 mW did not evoke a much stronger response than 1.0 mW (Fig. 4). Therefore, in this case, activating a transduced cell did not require a particularly high power (only a few hundred microwatts). 3.2.Optogenetic Local Field Potential versus ArtifactsWe have shown that the optrode we were using had no heat-induced artifact in the spiking activity. The effect on LFPs was also investigated. Typical LFPs upon optical stimulation at one transduced site are shown in Fig. 5(a), which normally shows a quick negative response after light onset, followed by a rebound after light offset. Time-locked phases can also be seen corresponding to stimulation frequency. The LFP amplitude here (upon stimulation) is about 100 to for the negative phase, but varies according to stimulation power. When we tested the LFP in saline using the same stimulation protocol, we found some artifacts upon stimulation, but the amplitude was much smaller than true optogenetically evoked LFPs [Fig. 5(b)]. Given that the scattering property in saline could be different from that in the cortex, we further tested the artifact in nontransduced sites of the brain and found no artifact at all [Fig. 5(c)]. We believe, then, that the LFPs we observed in Fig. 5(a) have a neurophysiological origin. However, we also noted that the artifact observed in saline depended on the type and size of electrode, the optical power, and the wavelength. Therefore, testing these properties of the optrode before using it for actual experiments is strongly recommended. 3.3.Histology Validation of Virus ExpressionWe performed histological validation of viral expression in two different contexts. The first one is for validation of the functionality of the viral construct in rats before injection into primates. The second one is for histological studies of the extent of opsin expression in the primate brain after all the experiments have been completed. In two cases, we performed histological studies of the opsin expression in nonhuman primates. The animals were perfused with 2% paraformaldehyde and their brains were extracted and sent to NeuroScience Associates (Knoxville, Tennessee) for histological slicing and anti-YFP immunostaining. In both monkeys, the expression was effective within a cylindrical cortical volume of in diameter. Example of histological sections from a rat and a monkey are shown in Fig. 6. Fig. 6Histology. (a) A histological section from a rat showing the extent of opsin expression. The green colors are the fluorescence due to YFP expression. (b) The same virus was successfully expressed also in a primate where the dark colors indicate the level of anti-YFP labeling due YFP expression. 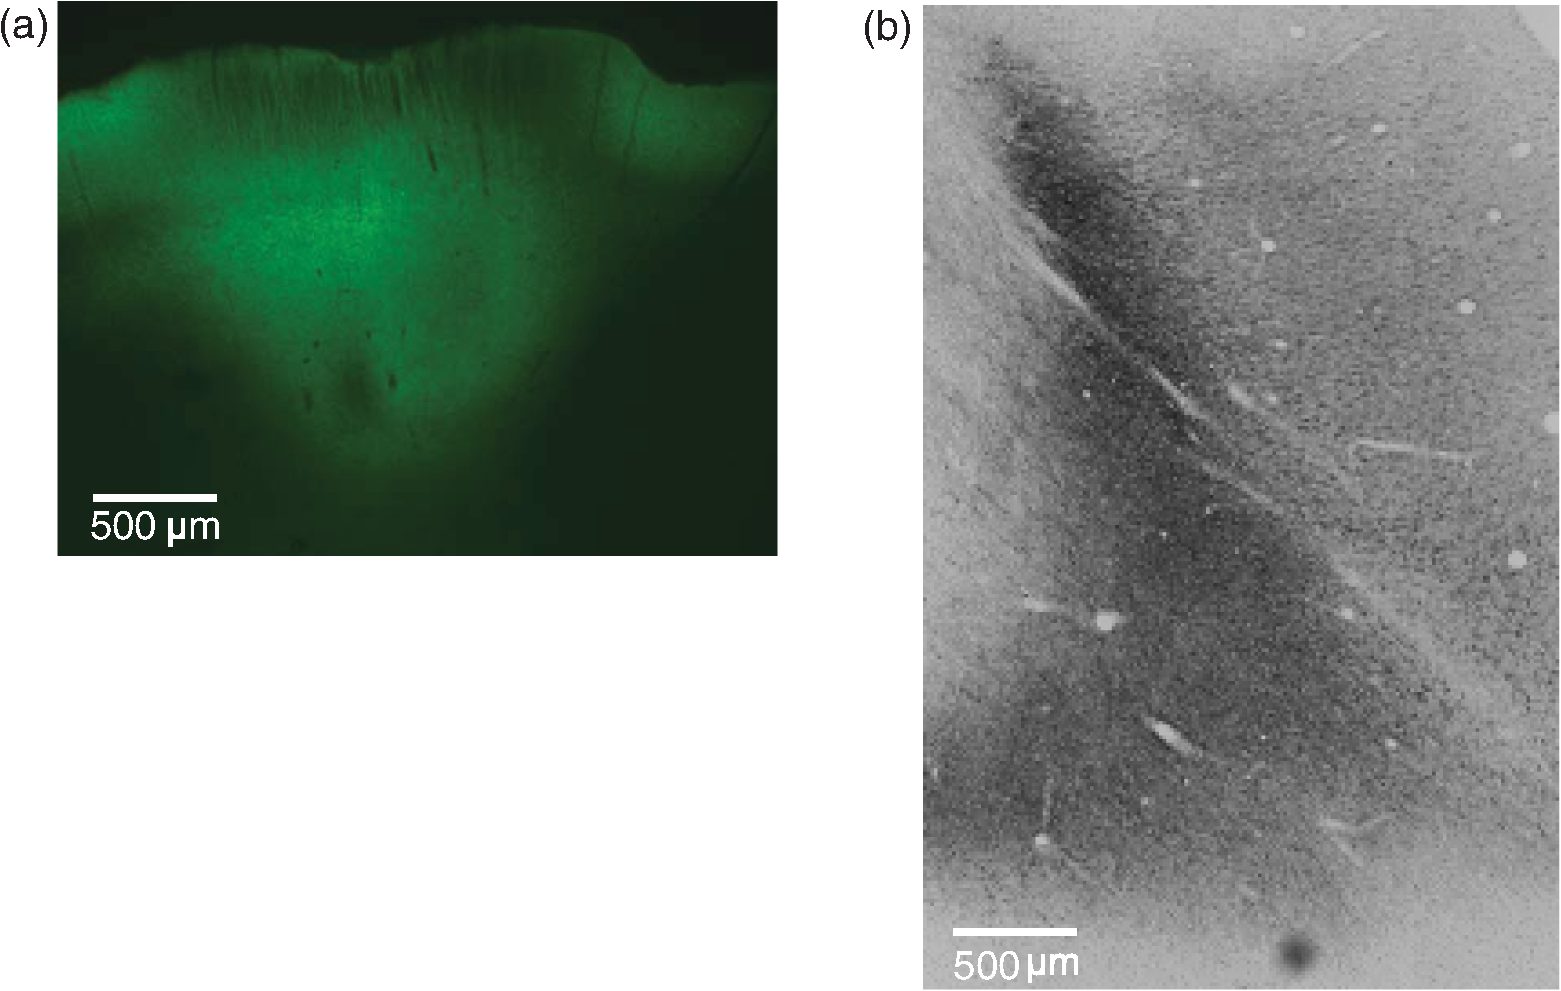 4.Discussion4.1.Protocol ImprovementHere, we have described our procedures in setting up basic optogenetic experiments in nonhuman primates, which have proven to be highly reliable and replicable. The improvement of these procedures mainly includes two key steps: the “in-chair” injection and the use of a tapered, thinner fiber. The “in-chair” injection highly improves the injection efficacy and flexibility. The basic requirement assumes that the monkey has been trained to sit in the chair with its head in restraint for a few hours and has a chamber ready for recording. Then, injection can be performed in a way similar to regular recording. On the other hand, given that the process could last for several hours with the potential to cause discomfort and result in agitation, minor movements of the injection needle were unavoidable even if we tried to secure the chair in a rigid way. Although we found this did not affect the efficacy of the injection, precautions similar to those used when conducting electrophysiological recordings should be taken to prevent the monkey from moving. The variety of chairs and restraints utilized by different labs must be considered when using our protocol, but we have found the following elements to be essential. When mounting the stereotaxic rail on the chair, be aware of the distance between the rail and the monkey head. The positioning of the rail should allow the injection needle to access the target area. Theoretically, the rail does not need to be mounted on the chair. Any rigid frame near the monkey head could serve as a base. When a chamber is not available, or chronic implantation (i.e., array) is needed, the injection system can be used in the OR setting without any modification except discarding the rail on the chair and using a standard stereotaxic apparatus. Compared to the “in-chair” injection, such injection in the OR with monkey sedated would avoid any possible issues associated with movement. As an acute readout device, the size of the optrode should be as small as possible for repeated penetrations into the brain. The optrode we described here was made from the smallest size (to the best of our knowledge) of commercially available optic fiber and electrode, rendering a diameter decrease to around . In addition, we pull the fiber to taper the tip rather than leaving it blunt, which we believe makes it less likely to cause cortical damage. Even so, such two-tip devices are not optimal in terms of reducing tissue damage. A device that can deliver light and record a neural signal at the same time but share a single tip is therefore more ideal. Thus, the coaxial optrode21 could be a better choice. Alternatively, chronically implanting an optic fiber with a readout device could be another direction to consider, since the extent of tissue damage will be minimized with a chronic optrode. We note that an example of a chronic device, in which a tapered fiber is integrated with a Utah array, has been successfully applied to rodents and nonhuman primates.25 Such an opto-array has advantages over a single optrode in that it allows simultaneous recording in larger spatial scale, which will be particularly useful in studies of spatiotemporal activity features of neural circuitry with single-site stimulation and setting up certain computational models. Ideally, an opto-electrode array with spatiotemporally controlled multisite light delivery capabilities would be ideal to explore the relationship between neural activity and behavior. 4.2.Experimental ConsiderationTo advance beyond the interest in primate optogenetics as merely a novel technique, one critical question is how much it can affect an animal’s behavior. These behavioral results are important for establishing that optogenetics might prove useful for designing clinical treatments. To address this, several recent studies have applied optogenetic stimulation in the nonhuman primate while measuring behavioral effects caused by stimulating certain areas.6–10,12 Under the general framework of “writing in” signals to program behavior, so far the majority of observed effects have been on oculomotor movements. Saccades could be evoked by optogenetically stimulating V1,7 and possibly in FEF,9 but not in LIP.10 Optogenetic inactivation of superior colliculus also caused deficits in the metrics of saccadic eye movements.8 However, other groups were unable to induce body movements (such as hand reaching) by stimulating cortical motor and premotor areas.5 We found that optogenetic stimulation in a higher cortical area like LIP did not affect simple visually guided saccades; however, when the animal was involved in a complex discrimination task that may rely on attention or salience detection, optogenetic stimulation was as effective as electrical microstimulation in biasing the animal’s choice.10 Another study in FEF6 also found that optogenetic stimulation affected saccade latency in a complex visual-guided saccade task. In addition, recently it has been demonstrated that optogenetic stimulation of the somatosensory cortex can be reliably detected in a sensory detection task.12 What we learn from these findings is that optogenetic stimulation may be more effective if such “write in” information can be combined with intrinsic signals and serve as a modulator to affect network activity. However, the stimulation itself—at least at a single site—is usually not powerful enough to serve as a signal source to execute an action, especially in higher cortical areas. As an alternative hypothesis, any simple behavior requires the integrated cooperation of several regions, and that simply changing a tiny part of it will not result in a direct behavioral change. Further study will be needed to decipher the brain’s programming strategy to render reprogramming possible. 4.3.SummaryThe protocol described here aids in helping people with either limited resources or experience in optogenetics to set up their own optogenetic experiments in the nonhuman primate. The basic goal is to successfully transduce regions in the primate brain and readout the optically induced neural modulation. Beyond this, researchers should set more specific goals in applying optogenetics and design more specific experiments to incorporate this technique. AcknowledgmentsWe thank John Ghenne for his expert assistance with animal care and training, the Deisseroth laboratory for graciously providing the viral constructs used in the experiments, and the Shenoy laboratory, especially Dan O’Shea and Werapong Goo, for graciously sharing their experiences. We also thank Jing Wang for her help in developing the protocol. This work was supported by DARPA REPAIR (N66001-10-C-2010). ReferencesA. M. Aravanis et al.,
“An optical neural interface: in vivo control of rodent motor cortex with integrated fiberoptic and optogenetic technology,”
J. Neural Eng., 4 S143
–S156
(2007). http://dx.doi.org/10.1088/1741-2560/4/3/S02 1741-2560 Google Scholar
A. R. Adamantidis et al.,
“Neural substrates of awakening probed with optogenetic control of hypocretin neurons,”
Nature, 450 420
–424
(2007). http://dx.doi.org/10.1038/nature06310 NATUAS 0028-0836 Google Scholar
M. E. Carter et al.,
“Tuning arousal with optogenetic modulation of locus coeruleus neurons,”
Nat. Neuroscience, 13 1526
–1533
(2010). http://dx.doi.org/10.1038/nn.2682 NANEFN 1097-6256 Google Scholar
X. Han et al.,
“Millisecond-timescale optical control of neural dynamics in the nonhuman primate brain,”
Neuron, 62 191
–198
(2009). http://dx.doi.org/10.1016/j.neuron.2009.03.011 NERNET 0896-6273 Google Scholar
I. Diester et al.,
“An optogenetic toolbox designed for primates,”
Nat. Neuroscience, 14 387
–397
(2011). http://dx.doi.org/10.1038/nn.2749 NANEFN 1097-6256 Google Scholar
A. Gerits et al.,
“Optogenetically induced behavioral and functional network changes in primates,”
Curr. Biol., 22 1722
–1726
(2012). http://dx.doi.org/10.1016/j.cub.2012.07.023 CUBLE2 0960-9822 Google Scholar
M. Jazayeri, Z. Lindbloom-Brown and G. D. Horwitz,
“Saccadic eye movements evoked by optogenetic activation of primate V1,”
Nat. Neuroscience, 15 1368
–1370
(2012). http://dx.doi.org/10.1038/nn.3210 NANEFN 1097-6256 Google Scholar
J. Cavanaugh et al.,
“Optogenetic inactivation modifies monkey visuomotor behavior,”
Neuron, 76 901
–907
(2012). http://dx.doi.org/10.1016/j.neuron.2012.10.016 NERNET 0896-6273 Google Scholar
S. Ohayon et al.,
“Saccade modulation by optical and electrical stimulation in the macaque frontal eye field,”
J. Neurosci., 33 16684
–16697
(2013). http://dx.doi.org/10.1523/JNEUROSCI.2675-13.2013 JNRSDS 0270-6474 Google Scholar
J. Dai, D. I. Brooks and D. L. Sheinberg,
“Optogenetic and electrical microstimulation systematically bias visuospatial choice in primates,”
Curr. Biol., 24 63
–69
(2014). http://dx.doi.org/10.1016/j.cub.2013.11.011 CUBLE2 0960-9822 Google Scholar
X. Han et al.,
“A high-light sensitivity optical neural silencer: development and application to optogenetic control of non-human primate cortex,”
Front Syst. Neurosci., 5 18
(2011). http://dx.doi.org/10.3389/fnsys.2011.00018 FSNRAR 1662-5137 Google Scholar
T. May et al.,
“Detection of optogenetic stimulation in somatosensory cortex by non-human primates–towards artificial tactile sensation,”
PLoS One, 9 e114529
(2014). http://dx.doi.org/10.1371/journal.pone.0114529 1932-6203 Google Scholar
A. Galvan et al.,
“In vivo optogenetic control of striatal and thalamic neurons in non-human primates,”
PLoS One, 7 e50808
(2012). http://dx.doi.org/10.1371/journal.pone.0050808 1932-6203 Google Scholar
O. Yizhar et al.,
“Optogenetics in neural systems,”
Neuron, 71 9
–34
(2011). http://dx.doi.org/10.1016/j.neuron.2011.06.004 NERNET 0896-6273 Google Scholar
L. Fenno, O. Yizhar and K. Deisseroth,
“The development and application of optogenetics,”
Annu. Rev. Neurosci., 34 389
–412
(2011). http://dx.doi.org/10.1146/annurev-neuro-061010-113817 ARNSD5 0147-006X Google Scholar
J. Mattis et al.,
“Principles for applying optogenetic tools derived from direct comparative analysis of microbial opsins,”
Nat. Methods, 9 159
–172
(2011). http://dx.doi.org/10.1038/nmeth.1808 1548-7091 Google Scholar
O. Yizhar et al.,
“Neocortical excitation/inhibition balance in information processing and social dysfunction,”
Nature, 477 171
–178
(2011). http://dx.doi.org/10.1038/nature10360 NATUAS 0028-0836 Google Scholar
K. M. Tye and K. Deisseroth,
“Optogenetic investigation of neural circuits underlying brain disease in animal models,”
Nat. Rev. Neurosci., 13 251
–266
(2012). http://dx.doi.org/10.1038/nrn3171 NRNAAN 1471-0048 Google Scholar
I. Ozden et al.,
“A coaxial optrode as multifunction write-read probe for optogenetic studies in non-human primates,”
J. Neurosci. Methods, 219 142
–154
(2013). http://dx.doi.org/10.1016/j.jneumeth.2013.06.011 JNMEDT 0165-0270 Google Scholar
X. Han,
“Optogenetics in the nonhuman primate,”
Prog. Brain Res., 196 215
–233
(2012). http://dx.doi.org/10.1016/B978-0-444-59426-6.00011-2 PBRRA4 0079-6123 Google Scholar
F. Wu et al.,
“An implantable neural probe with monolithically integrated dielectric waveguide and recording electrodes for optogenetics applications,”
J. Neural Eng., 10 056012
(2013). http://dx.doi.org/10.1088/1741-2560/10/5/056012 1741-2560 Google Scholar
T. I. Kim et al.,
“Injectable, cellular-scale optoelectronics with applications for wireless optogenetics,”
Science, 340 211
–216
(2013). http://dx.doi.org/10.1126/science.1232437 SCIEAS 0036-8075 Google Scholar
J. Wang et al.,
“Approaches to optical neuromodulation from rodents to non-human primates by integrated optoelectronic devices,”
in Proc. 2011 Int. Conf. on IEEE Engineering Medicine and Biology Society,
7525
–7528
(2011). https://doi.org/10.1109/IEMBS.2011.6091855 Google Scholar
BiographyJi Dai obtained his PhD degree from Institute of Biophysics, Chinese Academy of Sciences, and then worked as a postdoctoral fellow in the Laboratory of David Sheinberg at Brown University. He is now an associate investigator at the Institute of Psychology, Chinese Academy of Sciences. Ilker Ozden obtained his PhD degree in physics from Brown University. He worked as a postdoctoral fellow in the laboratory of Samuel S.-H. Wang at Princeton University. He is now an assistant professor of engineering (research) at Brown University. Daniel I. Brooks is a postdoctoral fellow and lecturer at Tufts University, where he studies comparative cognition and avian vision. He previously worked as a postdoctoral fellow with David Sheinberg at Brown University. Fabien Wagner obtained his BS degree in mathematics/physics/engineering from the Ecole Polytechnique in France (2009) and his PhD degree in neuroscience/neuroengineering from Brown University in the United States (2014). He is now a postdoctoral research scientist at the Ecole Polytechnique Fédérale de Lausanne in Switzerland. Travis May is a PhD candidate in the Center for Biomedical Engineering at Brown University working in the neuroengineering laboratory of Dr. Arto Nurmikko. Benjamin Brush is an MD candidate at Harvard Medical School. He previously worked as a research assistant under Arto Nurmikko at Brown University. David Borton received his BS degree in biomedical engineering from Washington University in St. Louis in 2006. He then joined Brown University, where he worked towards his PhD degree developing implantable, wireless, and broadband neural interfaces for both basic neuroscience and clinical applications, and received his PhD degree in 2012. He then continued his neuroengineering research at the Swiss National Institute of Technology as a postdoctoral fellow. He returned to Brown as an assistant professor in 2014. Arto V. Nurmikko is a L. Herbert Ballou University professor of engineering and physics at Brown. He received his degrees from the University of California, Berkeley, with postdoctoral stays at MIT and Hebrew University. He is a fellow of the American Physical Society, fellow of the Institute of Electrical and Electronics Engineers, fellow of the Optical Society of America, and a member of the American Academy of Arts and Sciences. David L. Sheinberg is a professor of Neuroscience at Brown University. He received his BA degree from Yale and his PhD degree from Brown. Following postdoctoral fellowships at Baylor and the Max Planck Institute, he returned to Brown University as a faculty member in the Department of Neuroscience in 2000. He is the director of the Neuroscience Graduate Program. |


