
|
|
|
The function of the brain relies on the propagation of activity from one neuron to another; therefore, a thorough understanding of the organ in health and dysfunction will require an understanding of the structural and functional connections between neurons. The term “connectome” was coined recently to describe efforts to compile such knowledge of the human nervous system.1 Important insight into the brain’s function will also require interventive experiments in animal models, hence, there has been recent enthusiasm for similar connectome projects involving rodents.2–5 It is widely appreciated that different procedures for characterizing connections between neurons can yield different apparent results.2,3,5–7 It, therefore, seems desirable to standardize procedures in order to systematically construct the connectome, and yet adherence to a single method risks systematically overlooking patterns of connectivity that would have been apparent using other methods. In the present paper, we highlight some of the problematic methodological issues involved in constructing rodent connectomes. We present data from our own research on long-range, horizontal projections in rat cortex, and we use this projection pattern as an example of a type of connectivity that is not readily apparent in current versions of the rodent connectomes due to choices made during collection, collation, analysis, and display of the connectivity data. 1.Connectome—Collating Preexisting DataResearch on neural connections began shortly after it was determined that the brain was composed of discrete neurons (reviewed in Ref. 7), so that more than a century’s worth of published anatomical data could potentially contribute to the connectome. One branch of progress toward the connectome has involved the collation of these existing data into electronic databases or atlases that can be mined using a computer to better appreciate the neural connections. Examples of this approach to rodent connectomes include the Brain Architecture Management System (BAMS)3,8 and neuro Visualization, Imagemapping, Information System for Analysis and Simulation (neuroVIISAS).4 These electronic databases are associated with software allowing users to access the multiple publications from which the connectivity data were derived and to compare the results of these different studies. Neuroinformatics tools are then provided to promote an understanding of the network structure by way of interactive visualization methods as well as quantitative and semiquantitative analyses (e.g., correlation matrices and graph theory analyses) and to model activity propagating through the networks.4,8 1.1.Problems Related to Variability in Tract-Tracing Methods and Data AnalysisThe tract-tracing techniques used for connectivity studies have improved considerably over time, from early work involving stains for degenerating axons following targeted lesions and transport of radioactive amino acids to more modern research using injected plant lectins, synthetic chemicals, and viral vectors.2,7 When collating results from prior studies to establish the electronic databases, the curators of these databases must select which techniques and studies they consider most reliable,3 as different neuronal tracers differ with respect to sensitivity, resolution, the degree to which they are preferentially transported either anterogradely or retrogradely, and the possibility of labeling fibers of passage. Different curators might make different judgments in this regard, a problem common to all meta-analyses. Even among the studies that are selected for inclusion in a connectivity database, the results often differ considerably with respect to the presence or strength of a connection between the same two structures, which may reflect differences both in the tracer employed and in the way it was detected. In addition to differences in microscopes and detection systems (e.g., direct fluorescence versus immunostaining with or without secondary antibodies and other amplification steps), the apparent presence or strength of a connection can be influenced by subtleties in the location of the injection, the volume of the injection, the mechanism of delivery (pressure injection or iontophoresis), diffusion of the tracer molecule, the concentration of tracer, possible selectivity of uptake of the tracer by subclasses of neurons,9 and the duration of survival in relation to both rate of transport and turnover of the tracer. Discrepancies in reports of labeling intensity also may be exacerbated by the semiquantitative scales that are common in anatomical studies, which often score labeling on a four-point scale (absent, +, ++, and +++). The standards for assigning such scores may not be the same between studies. For example, the vital difference between “no labeling” and “labeling exists” is a function of the sensitivity of the labeling method, which can be strongly influenced by minor particulars of the staining procedures, the sensitivity and resolution of the microscope and camera system, the thoroughness of the sampling strategy within each target region, and the false detection rate, which is the tendency to report labeling in control tissue (e.g., tissue from noninjected animals). It is also unclear whether different researchers implement these semiquantitative scales linearly or nonlinearly, and, if nonlinearly, what curve fit is applied. Despite these sources of variability, a single semiquantitative measure of staining intensity tends to be used for the data analysis associated with the electronic databases.8 1.2.Problem of Brain ParcellationBrain function reflects communication between individual neurons. A connectome detailing the neuron-to-neuron connectivity across the entire simple nervous system of the nematode C. elegans has been completed through serial reconstruction of axons across adjacent electron micrographs.10 Although neuron-to-neuron connectomes of portions of the Drosophila nervous system also have been completed,11–13 a comparable neuron-to-neuron connectome is not currently envisioned for the rodent or human brain, given that there are orders of magnitude more synapses involved and considerable variation between individuals.1,2 Instead, these connectomes are being constructed on the basis of connections between brain “areas,” a simplification that can be partially justified by observations that neighboring neurons tend to have similar properties. However, using brain regions as a basis for the connectome introduces several problems. The problem with building a connectome using brain areas as units is that there is no a priori consensus about what these units should be.14 The brain can be parcellated using different schemes that can be based on differences in (1) the packing density of cell bodies, known as cytoarchitectonics, (2) the myelination density and patterns in gray matter, known as myeloarchitectonics, (3) the distribution of different proteins, mRNA, or neurotransmitters, (4) the activity of metabolic enzymes, such as cytochrome oxidase and succinate dehydrogenase, (5) brain activity under various conditions of peripheral stimulation and consciousness, recorded using various methods, and (6) patterns of connectivity to other brain regions (we will revisit this last potential criterion below). Although there can be some correspondence between the boundaries imposed on brain anatomy using these different criteria, mismatches also are common. In the mouse somatosensory cortex, for example, there is a correspondence between cytoarchitectonically defined whisker barrels that are detected through Nissl staining and patches of elevated cytochrome oxidase activity, whereas in rats, whisker barrels are harder to distinguish using cell body stains, but are evident in cytochrome oxidase staining patterns.15 Furthermore, even when considering the same cytoarchitectonic basis for parcellation of cerebral cortex, different researchers have chosen different boundaries.2,16–18 The BAMS and neuroVIISAS databases provide tools to compare several of the parcellation schemes with one another, and curators of the sites attempt to resolve ambiguities introduced by the fact that the original studies may have reported results in reference to different parcellation schemes, so that all results can at least be presented in the same format.3,4,8 Despite this type of standardization, none of the parcellation schemes have been independently validated with respect to the suitability of the brain regions as foundations for a connectome.2 1.3.Examples of Important Forms of Cortico-Cortical Connectivity that Can Be Obscured in Post Hoc, Parcellation-Based ConnectomesParcellation schemes typically divide the brain into regions that differ in size, and within the cortex, some of the areas considered as units in the schemes used in the electronic databases are both quite large and can be subdivided into smaller regions using other parcellation schemes. Projections from one large cortical region to another may involve neurons that are located in a small subdivision of the first region and that send axons to a small subdivision of the other region. For example, neurons in different whisker barrels of primary somatosensory cortex project topographically to different subdomains of primary motor cortex19 and secondary somatosensory cortex.20 Knowledge of this organization is lost in some electronic databases, because the entire barrel field of somatosensory cortex is considered as a single unit, as is the entire primary motor cortex and the entire secondary somatosensory cortex. It has been argued that topographic maps provide an efficient neural solution to many problems in sensory processing,21 therefore, it seems important that these relationships be evident in the connectome. Projections that involve only a part of a predefined brain region also raise an important problem for quantification. It is unclear how (or whether) intense staining within a small portion of a brain area would be distinguished quantitatively from moderate staining distributed throughout the entire area when establishing quantitative descriptions of network relationships. Particular brain regions also can contain intermingled neurons with very distinct projection patterns. For example, in somatosensory cortex, the whisker barrel field contains distinct barrel column neurons in layer 4 whose projections are almost entirely local, as well as septal neurons that send diffuse collaterals that extend horizontally for great distances in all directions.22 Combining different projection patterns in an area-to-area model of connectivity could cause confusion. In general, digitizing patterns of connectivity into discrete brain regions for display in correlation matrices and network graphs strips the neural connectivity data of its inherent spatial structure, obscuring strong rules such as the greater connectivity between neighboring regions that have been noted in descriptions of the human connectome.23 As will be described in greater detail below, the distribution of labeling following injections of a tracer can result in a gradient of decreasing intensity that crosses continuously across a boundary between supposedly distinct cytoarchitectonic regions,24,25 another potentially important spatial feature that is lost after binning the data into discrete regions. In the section below, we will discuss in detail the diffuse, radiating and tapering horizontal projection that is the subject of our own research and that is effectively obscured in the post hoc connectome databases. (Here and throughout the remainder of this paper, we use the term “diffuse” to mean simply “spread out over a large space, not concentrated in one area” and do not imply any particular function of the connectivity.) We then will consider to what extent knowledge of this horizontal connectivity is preserved in the more recent connectome projects. 2.Cortical Activity SpreadsWhen a single whisker on an anesthetized rat’s snout is moved, activity can be recorded in the corresponding whisker barrel in primary somatosensory cortex (reviewed in Ref. 15). In addition to the peak of activity over that barrel, we have found that subthreshold cortical activity spreads horizontally in all directions for several () millimeters across the cortex (Fig. 1).24,26,27 Depending on the whisker stimulated, the activity can extend past the barrel field of somatosensory cortex and can cross cytoarchitectonic borders into visual cortex (VCx), auditory cortex, or the trunk representation in somatosensory cortex (Fig. 1).24,26 Fig. 1Long horizontal axons penetrate deeply into visual and auditory cortex following injection of biotinylated dextran amine (BDA) into the whisker barrel field of primary somatosensory cortex.24 Axons in three consecutive slices of flattened cortex from layer 2/3 were traced and overlaid on outlines of borders of visual cortex (VCx) and auditory cortex (ACx) that were determined by staining layer 4 slices from the same brain for cytochrome oxidase activity.28,29 Note that horizontally oriented axons penetrate into both VCx and ACx. Medial (m) and caudal (c) directions are shown, as are the locations of posterior parietal cortex (ParP) and secondary somatosensory cortex (SII). The outer arc represents the extrapolated furthest distance of a recording electrode (3.5 mm), where a change in local field potential was evoked by whisker stimulation in all rats tested. The second-largest arc indicates the position of the farthest electrode showing evoked single unit activity (spiking). The third-largest arc indicates the position of the electrode at which half the rats showed evoked single unit activity, and the smallest arc indicates the electrode at which all rats showed evoked single unit activity. The scale bar represents . The inset shows the spread of evoked activity as measured by intrinsic signal optical imaging (ISOI), averaged across multiple animals; units on the color scale are fractional changes in reflectance, and the scale bar represents 2 mm.27 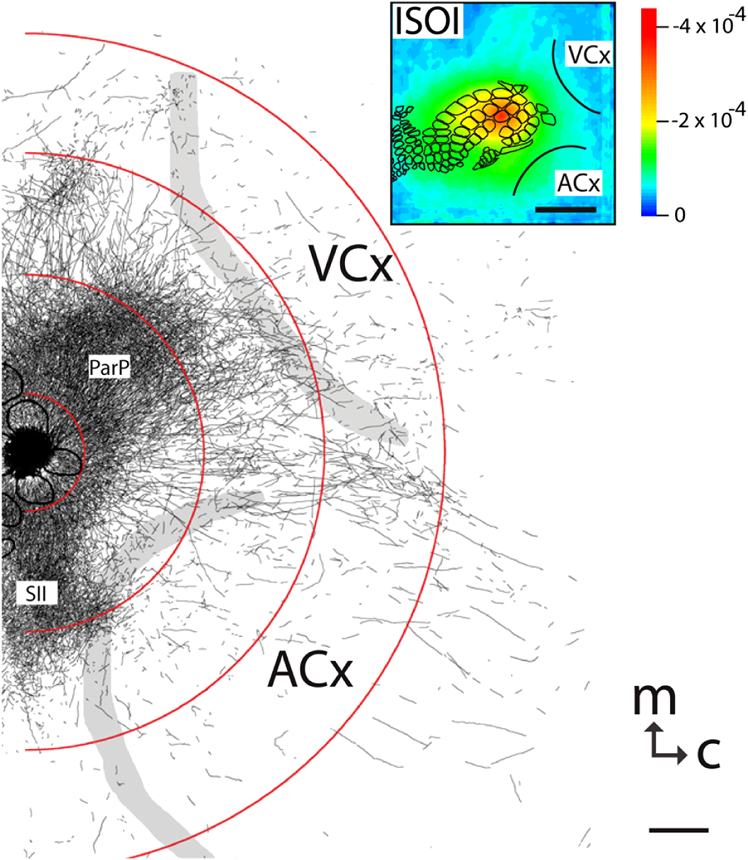 We have detected the horizontal spread of activity electrophysiologically as a change in local field potential as well as by intrinsic signal optical imaging.24,27 Evidence for similar long-range horizontal spreads of activity evoked by single whisker stimulation can be gleaned from numerous other studies involving both rats and mice and employing a wide variety of recording techniques, although many of these other studies emphasize different aspects of the activity pattern (see Ref. 30 for a review; also see Refs. 3132.33.34.35.36.37.–38). Horizontal activity spreads may be important for integrating responses within and across sensory systems as well as for providing a substrate for associative learning and various other forms of adult plasticity.30 3.Diffuse Horizontal Axon ProjectionsThe horizontal propagation of the change in local field potential that is evoked by whisker stimulation can be blocked by a shallow transection of cortex involving only gray matter, suggesting that the activity spread involves shallow horizontal axons rather than axons coursing through deeper white matter.24 In an attempt to visualize these axons directly, the anterograde tracer biotinylated dextran amine (BDA) was injected into supragranular layers (L2/3) of the barrel field.24,25 After perfusion, the cortex was physically flattened and sectioned in a plane parallel to the cortical surface, a procedure that has long been used to assess cortical anatomy.28 In slices of flattened cortex, horizontal axons running within the same cortical layer can remain intact for long distances within the thickness of the slice independent of their direction of travel. Alternatively, classical planes of section (coronal, horizontal, or parasagittal) slice most horizontal axons obliquely, leaving short segments that are easy to overlook and difficult to reconstruct in order to verify that they remain in gray matter throughout their course. As shown in Fig. 1, labeled axons were found first to extend out from the barrel field and then to cross dysgranular secondary sensory cortices and penetrate deeply into both VCx and auditory cortices.24 The axons reached beyond the 3.5-mm distance at which all tested rats exhibited an evoked local field potential, which also was the farthest electrode tested (outer red circle in Fig. 1, where the average evoked field potential remained at 11% of its peak value). Consistent with a gray matter course, the axons remained intact across several hundreds of micrometers within individual 30-micron supragranular microtome sections. Numerous additional rats received injections of BDA into the whisker barrel field, revealing long, border-crossing, horizontally oriented axonal projections that extended in all directions outward from the injection sites.25 In addition to the horizontal axons radiating in all directions from the barrel field, higher concentrations of axons were observed in known specific projection sites, such as secondary somatosensory cortex, posterior parietal cortex, perirhinal (insular) cortex, and primary motor cortex.25 To determine whether radiating, diffuse and apparently nonspecific horizontal projections were a general feature of sensory cortices, BDA also was injected into supragranular layers of VCx and auditory cortex.25 In all cases, horizontally oriented axons were found several millimeters in all directions from the injection sites.25 Horizontal axons from VCx injections penetrated into auditory and somatosensory cortices, while horizontal axons from auditory cortex injections penetrated into visual and somatosensory cortices. Clustered concentrations of axons corresponding to specific projection targets were observed in every injected animal, and the locations of these clustered projections varied as a function of the location of the injections within either the VCx or the auditory cortex.25 The retrograde tracer cholera toxin B subunit also was injected into the auditory cortex, after which label was detected in both somatosensory and visual cortex,25 which supports the presence of direct projections between these sensory cortices in rodents.39–41 Given that border-crossing horizontal axons of this length are not frequently reported in the literature, it was important to verify their existence using other tracers. For these experiments, we have used recombinant adeno-associated viral (rAAV) vectors directing the expression of green fluorescent protein (GFP) as anterograde tracers, followed by immunohistochemical detection. Figure 2 shows results for five equally spaced slices through the same brain of a rat that received a supragranular injection of an rAAV(2/1) vector employing a permissive cytomegalovirus (CMV) promoter that leads to high levels of expression in all infected cell types. As judged by the cytochrome oxidase staining of sections around layer 4,28,29 this injection was centered over the posterior medial barrel subfield, although some neurons in the dysgranular cortex between the barrel field and VCx were also probably infected by the virus (Fig. 2). A broad horizontal projection pattern was found to be present at all depths investigated, from shallow layer [160 to , Fig. 2(a), left panel] through layer 5A [800 to , Fig. 2(a), right panel]. Fig. 2Long horizontal axonal radiations and specific clustered projections coexist at multiple cortical depths in a rat injected with a recombinant adeno-associated viral (AAV) vector. (a) Immunostained axons in five equally spaced slices of flattened cortex were traced using a quantitative approach wherein evaluators were blind to the injection state or location of each photomicrograph. Decoded micrographs then were stitched together to recreate the slices. Tracings are shown together with outlines of sensory cortices and individual barrels of somatosensory cortex. These cortical regions were detected in an intervening section (at a depth of 600 to ) by staining for cytochrome oxidase activity. Cytochrome oxidase stained barrels indicate the approximate depth of layer 4 (L4), and the depths of the other sections are inferred from that information. Arrowheads indicate locations of particularly long segments of horizontally oriented axons. The light/yellow patch at the center of the axonal radiations is the area of saturated immunostaining in a section near layer 4; it approximates the locations of the majority of the neurons infected by the virus (i.e., the size of the injection). (b) The tracings of the five sections shown in (a) were combined. Arrowheads indicate the locations of the longer segments of axons that were noted in (a). (c) The tracings in (b) were decreased to a tenth of their thickness to better appreciate the relative density of the projections to major, specific targets that have been identified previously for neurons in the barrel field (arrows). (d) Locations of major cortical areas are shown in the context of the cytochrome oxidase staining for this brain (MCx, motor cortex; trunk, trunk representation in primary somatosensory cortex; VCx, visual cortex; ParP, posterior parietal cortex; PMBSF, posterior medial barrel subfield; SII, secondary somatosensory cortex; ACx, auditory cortex; ICx, insular cortex). 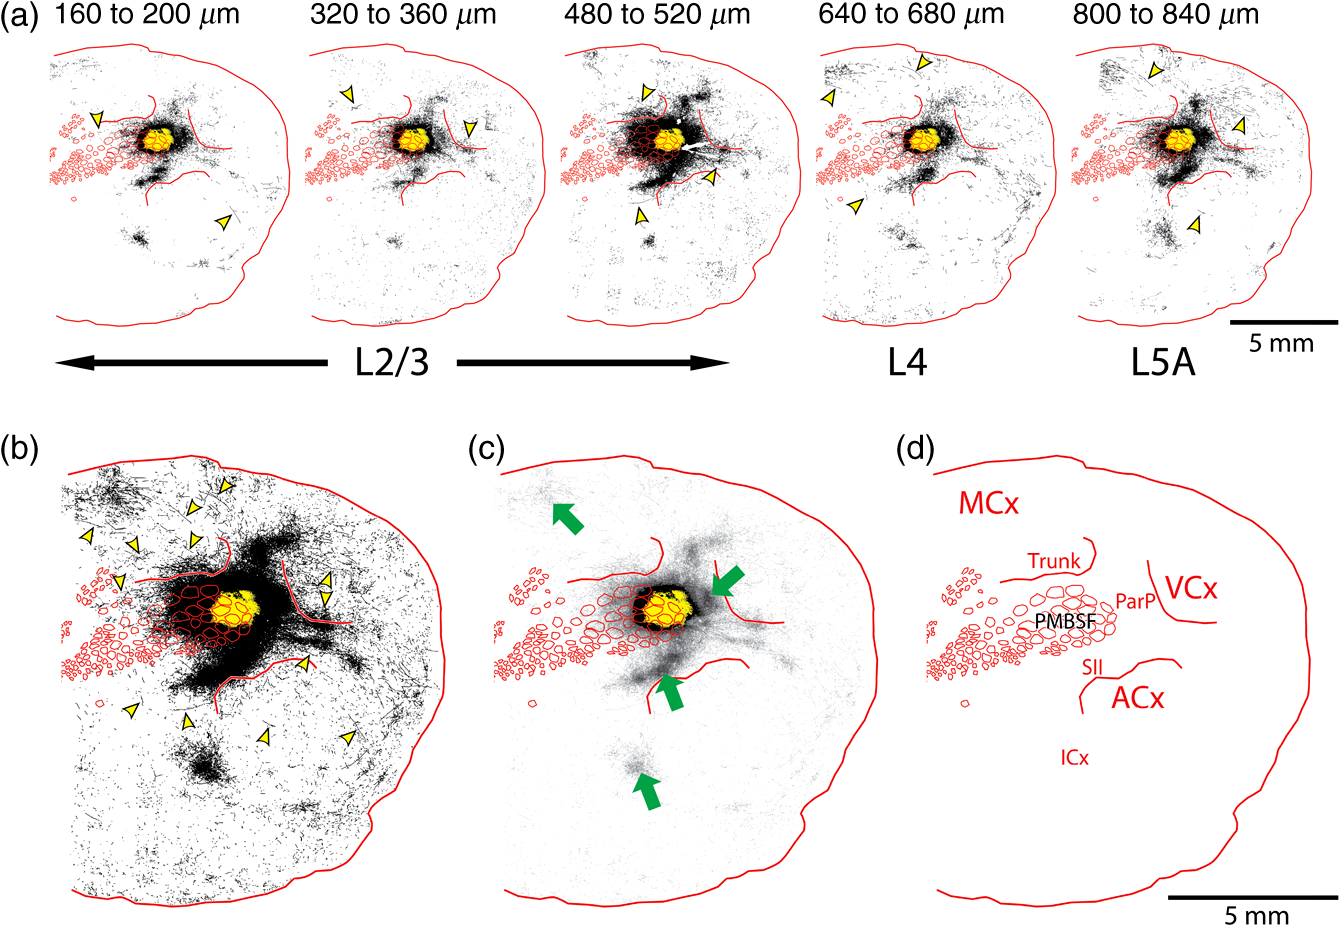 Figure 2(b) shows the tracings across the five sections in Fig. 2(a) collapsed together. As was the case for the BDA experiments, many of the axons were found outside of the barrel field—in VCx, auditory cortex, the trunk region of primary somatosensory cortex, and motor cortex (Fig. 2, arrowheads). Figure 2(c) shows the same tracings as in Fig. 2(b), but using tracings that are one tenth the width of those used in Fig. 2(b), which results in a qualitatively different impression of the projection pattern. In Fig. 2(c), clustered axons in known specific projection targets, such as secondary somatosensory cortex, insular cortex, posterior parietal cortex, and motor cortex, are more obvious (arrows), whereas the diffusely distributed, nonspecific projection pattern comprised by horizontally oriented axon segments [arrowheads in Fig. 2(b)] virtually disappears. Thus, the axons involved in the long, horizontal axon radiation are less dense than those involved in the specific projection pattern, which may explain in part the lack of emphasis placed on the horizontal radiation in the results of the connectome project, as will be discussed further below. Nevertheless, the overall volume of cortex receiving the horizontal projection is considerable, and the distribution of these axons resembles the physiological spread of activity following whisker stimulation.24 Our second strategy for characterizing the horizontal axon radiations in cortex involves detailed reconstructions of individual axons as they move between adjacent sections of flattened cortex, which verifies that the axons remain in gray matter throughout their trajectory. Figure 3 illustrates one such reconstructed axon from a rat that received an injection of the rAAV(2/1)-CMV-GFP vector into the posterior medial barrel subfield. In this brain, three candidate axons were chosen for reconstruction from a stack of six consecutive supragranular slices; these axons are rendered using thicker lines in Fig. 3(a). The shading used to render the axons indicate the slices in which the axonal fragments were detected. The final photomontage for the longest of these three axons is shown in Fig. 3(c). This axon penetrated deeply into visual cortex, its distal end extending 4.1 mm from the center of the injection site ( from the edge of the dense staining that typifies the region immediately surrounding the injection). The axon possessed multiple varicosities and also gave rise to multiple branches that were not followed to their termini [arrowheads in Fig. 3(c)], indicating that even a single horizontal axon might influence the activity of numerous postsynaptic neurons distributed widely throughout neighboring cortical regions. The combined activity of multiple such axons might then explain the spread of subthreshold activity that we have observed.24,27 Using this strategy, we have reconstructed dozens of axons extending horizontally for long distances from various rAAV injection sites distributed across the neocortex. Numerous long, border-crossing horizontal axons also have been reconstructed from brains injected with an rAAV vector employing a calcium-calmodulin dependent protein kinase II alpha () promoter.42 Because this promoter should restrict expression to excitatory cortical pyramidal neurons, the horizontal projection system likely includes axon collaterals from these cells. Fig. 3Reconstruction of long, horizontal, border-crossing axons following injection with a recombinant AAV vector. (a) Long axon segments were traced in six consecutive immunostained L2/3 slices of flattened cortex from a rat that was injected in the whisker barrel field of somatosensory cortex. The tracings were aligned, and candidate long, horizontal axons were identified as moving up and down between slices. Three of these (thick lines) were reconstructed. The different shading applied to segments of the reconstructed axons indicates the original slices that contained the fragments (magenta, 80 to ; green, 120 to ; light blue, 160 to ; dark blue, 200 to ). (b) One of the reconstructed axons from (a) is enlarged. Roman numerals indicate the segments shown in photomontages in (c). Arrows in (c) indicate the axon that was reconstructed, and arrowheads indicate branch points along this axon. 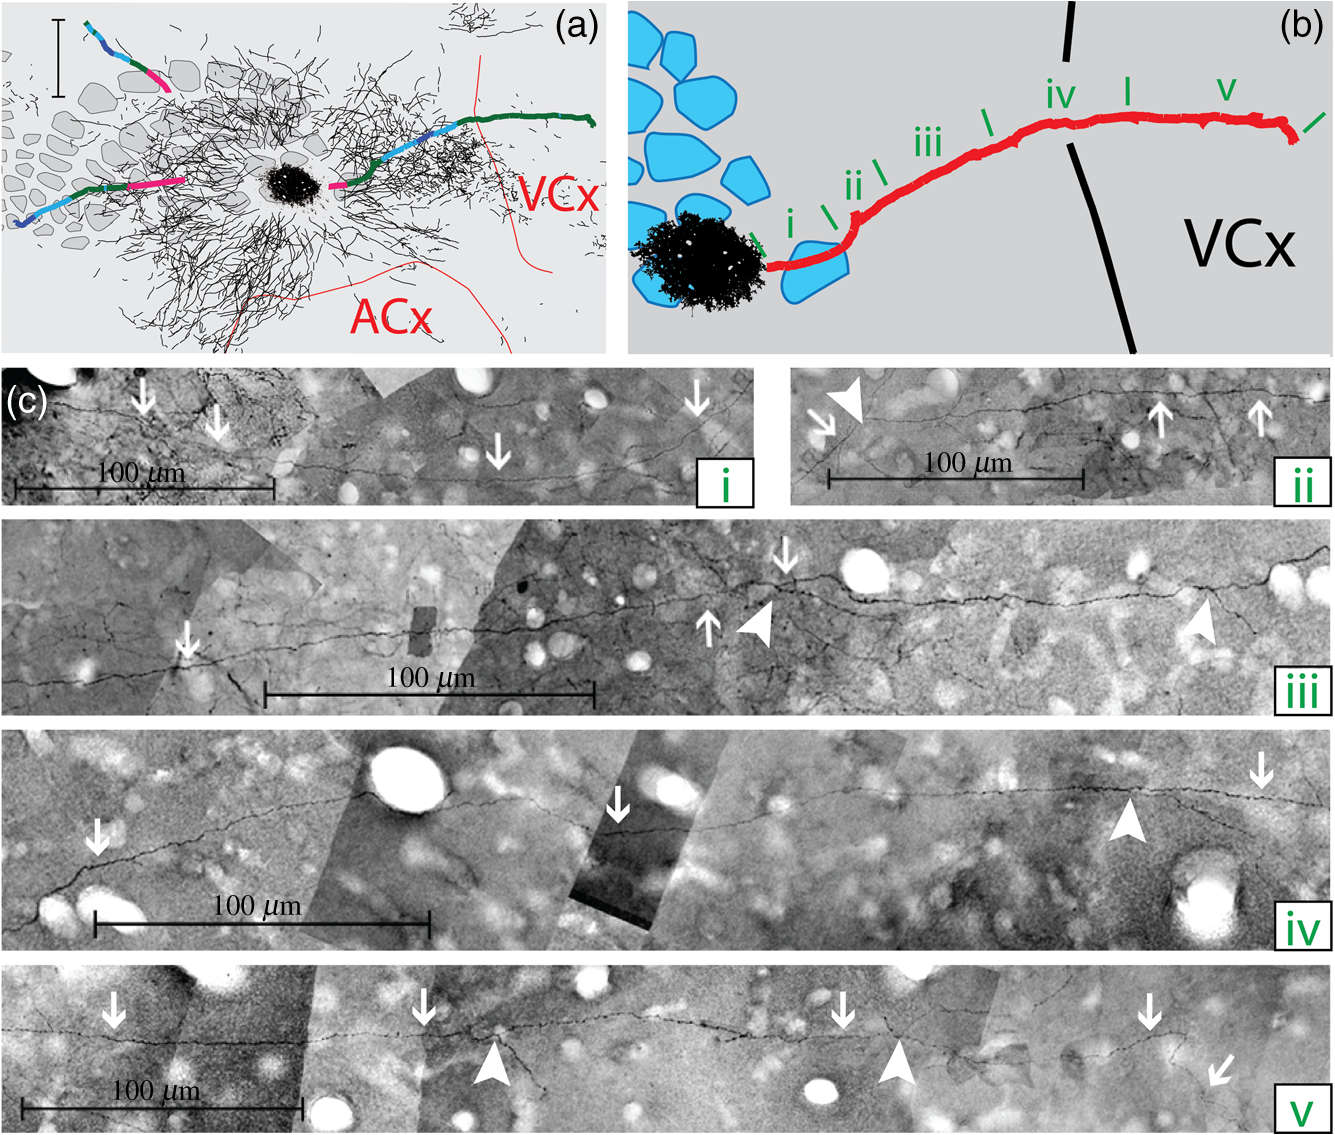 Having established the existence of the horizontal projection system in slices of flattened cortices after injections of three different anterograde tracers (BDA and rAAV vectors using both CMV and promoters), we will now discuss the extent to which this system is evident in current versions of the mouse connectome. 4.Building Connectomes De NovoRecently, three groups (the Allen Institute for Brain Science in Seattle, the Mouse Brain Architecture Project at Cold Spring Harbor, and the Mouse Connectome Project in Los Angeles) have independently published the initial results of very large experimental programs directed toward building a comprehensive connectome of the mouse brain. By using modern technologies not only to consistently perform hundreds of new tracer injections, but also to image and quantify the results, these programs have avoided many of the aforementioned pitfalls of building a connectome from variable preexisting data. These programs have generated electronic databases that are easily accessible online, storing and sharing primary data in the form of histological sections and providing quantitative and semiquantitative tools to appreciate the network connections. Despite the species difference (mice versus rats), the sensitive tracers and detection systems and the systematic data acquisition employed in the large connectome projects bode well for detecting the sparsely distributed axons that comprise the horizontal connectivity relevant to our research. The direct accessibility of histological sections also holds greater promise for evaluating the spatial distribution of labeling than would the prose descriptions and annotated caricatures in much of the earlier tract-tracing literature. We will discuss the three mouse connectome projects separately, describing briefly their systematic approaches and how the diffuse horizontal axon radiation appears to be evident in their data. Despite the evidence for the horizontal fiber radiation, the choices made in these projects for analyzing and displaying network relationships for the most part continue to obscure this type of diffuse connectivity. 4.1.Mouse Connectome ProjectFor the Mouse Connectome Project, two iontophoretic injections were made into different cortical locations of each brain, each injection containing a different pair of one anterograde (Phaseolus vulgaris leucoagglutinin or fluoro-ruby) and one retrograde (fluorescently tagged cholera toxin b subunit or Fluorogold) tract tracer.6 After one week of survival for transport of the tracers, the brains were sectioned coronally at a thickness of , and every fourth slice was counterstained with a fluorescent Nissl stain and immunostained using a fluorescent secondary antibody to label the leucoagglutinin tracer. The coronal plane of section allows evaluation of projections to and from subcortical brain regions in the same slices. All five fluorescent labels were imaged in separate channels of a high-throughput microscope. Because only every fourth slice is analyzed, of data along the anterior-posterior axis is missing between each analyzed slice, which prevents true tractography and the reconstruction of most horizontal axons. Also, in coronal slices, most horizontal axons are cut obliquely, leaving small fragments that may be overlooked in the manual annotation of the staining employed by this group. Nevertheless, some of the images of sections available online in the Mouse Connectome Project iConnectome6 show evidence of lightly stained small fragments in surrounding cortical regions after injections of anterograde tracers in the barrel field [Fig. 4(a)]. These fragments seem to be distributed in a pattern consistent with the long-range, diffuse horizontal axonal radiation that we have detected in rat cortex. Fig. 4Possible evidence for long-range horizontal axons in the Mouse Connectome Project. (a) Images of BDA staining in a coronal slice taken through the core of an injection site in mouse barrel cortex (left panels) and in a slice 1.4 mm posterior, where long-range horizontal axons in cortex might be expected based on our findings. The right panel shows a higher magnification of light staining that may represent labeled horizontal axons sectioned obliquely in the coronal slice. Images are courtesy of Ref. 43 and come from brain SW120819-02A (slices 17/43 and 24/43). (b) Images of the distribution of labeling following injections of anterograde tracers into the mouse barrel field in the Mouse Connectome Project Map Viewer. Areas deemed to show significant labeling have been shaded, with the cores of the injection sites labeled using darker circles (top panels for each brain). For each brain, a coronal slice 0.7 to 0.8 mm posterior to the injection site is also shown (bottom panels – positions relative to Bregma are indicated). Although there is some sense of a horizontal spread of axon density toward these posterior slices, the axons do not extend as far as would be expected from our data, especially within the coronal slices. 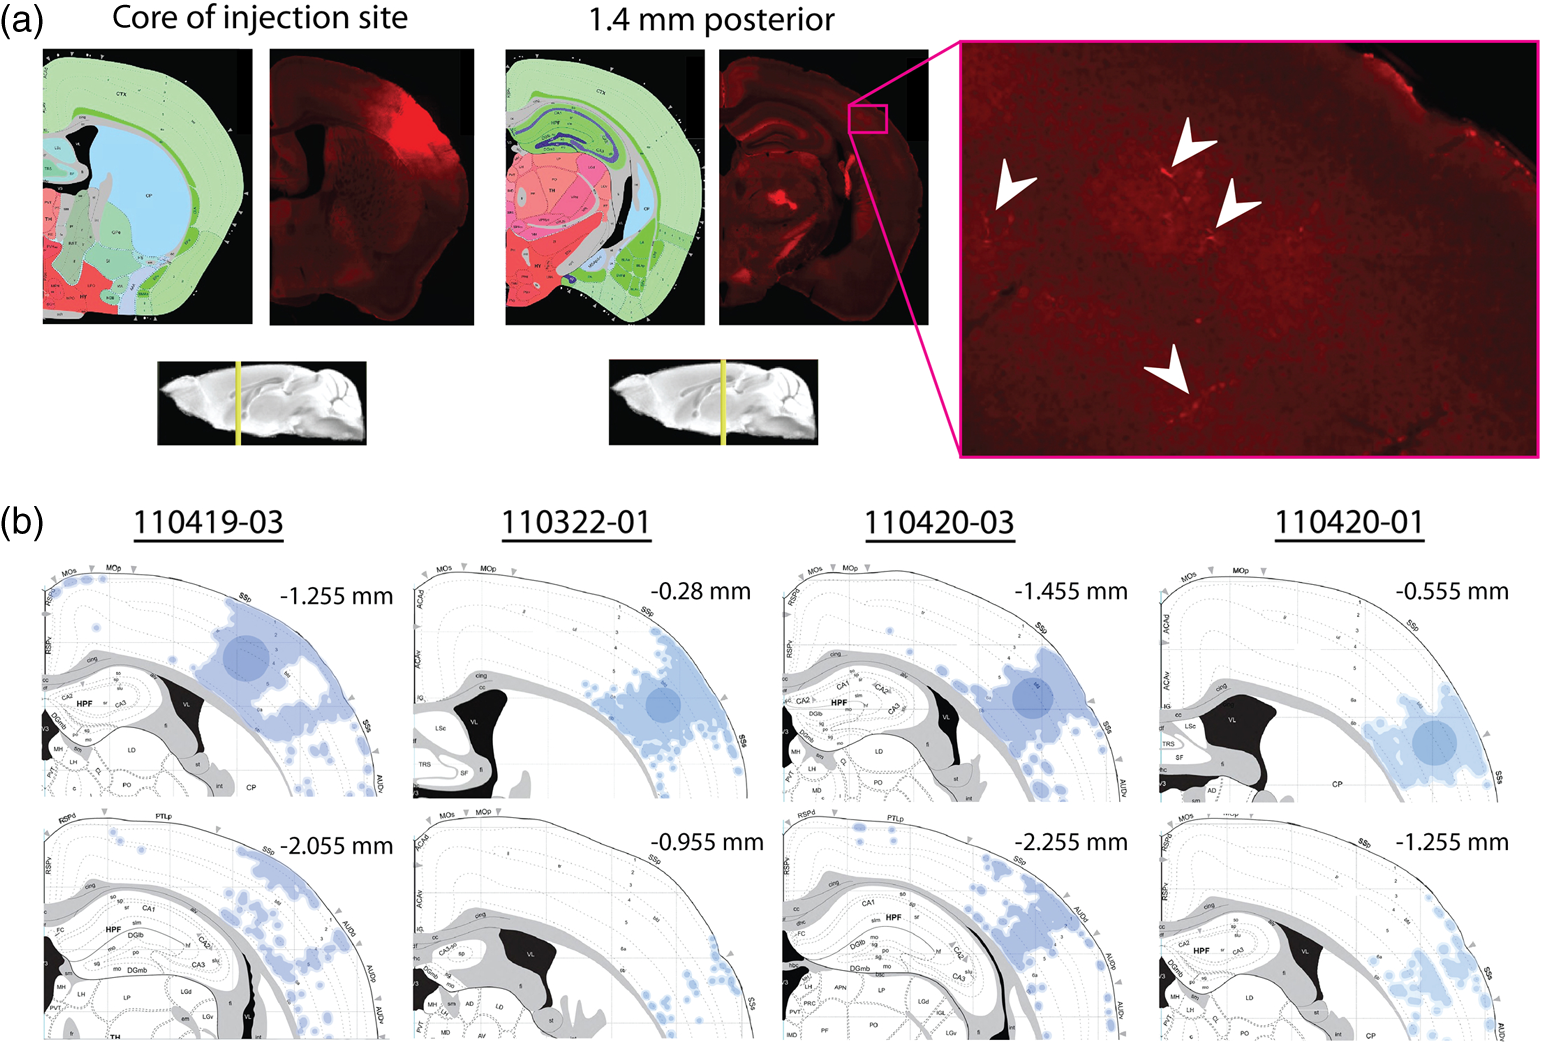 For the Mouse Connectome Project, the density of projections were annotated manually in reference to brain regions determined from an a priori parcellation scheme using a four-step semiquantitative scale (0, 1, 2, or 3), with more than one evaluator scoring each case.6 The criterion for receiving a score of 1 (sparse) included verification of each anterograde projection by retrograde labeling (at least a few labeled neurons). This confirmation is potentially important, given that most tract tracers label neurons both anterogradely and retrogradely to some extent, including rAAV.44–47 However, with this stringent criterion, it is difficult to determine whether the infrequently encountered short fragments of obliquely cut horizontal axons (which likely correspond to our horizontal radiation) would receive a score of 0 or 1 in this annotation. The use of a priori parcellation schemes also could obscure the horizontal projection, as was discussed above in the section on connectomes constructed from prior data. In addition to scoring brain areas using a four-point scale, the Mouse Connectome Project also includes manually shaded areas receiving projections on a standard reference atlas. From the four examples of this shading currently available on the website for barrel field injections [Fig. 4(b)], there is some sense of a horizontal spread of fibers out from the injection site along the anterior-posterior axis, but the axons do not extend as far as the horizontal projection in our own studies, and the threshold criteria for shading are not clear. 4.2.Mouse Brain Architecture ProjectIn a parallel effort, the Mouse Brain Architecture Project,48 provides a database of images of coronal brain slices following tracer injections placed throughout the mouse brain. Tracers include BDA (anterograde) and cholera toxin B (retrograde), as well as viral vectors. The viral vectors include rAAV vectors with permissive CMV early enhancer/chicken β-actin (CAG) promoters to drive high levels of expression of green or red fluorescent proteins for anterograde tracing, as well as two different modified rabies virus vectors, one for retrograde and one for anterograde tracing. For cortical rAAV injections, both green and red fluorescent protein vectors are used at each site to infect neurons at different depths; otherwise, one tracer is used at each injection site. The brains are sliced at a thickness of , and alternate sections are used for tracer localization and Nissl staining. The missing tissue disrupts tractography, but the slices are closer together than those in the Mouse Connectome Project. Very similar to the case for the Mouse Connectome Project, images from brains injected with anterograde tracers into the somatosensory cortex show evidence of labeled axon fragments throughout the surrounding cortical regions, including other primary sensory cortices and associational regions (see for example, visual cortical regions in section 146 from brain 1612F and section 153 from brain 1088F), which is fully consistent with the horizontal fiber radiation we have described for rat brains. For both the Mouse Connectome Project and the Mouse Brain Architecture project, slices were processed by standard procedures on microscope slides. As a result, there are occasional section irregularities (e.g., fluorescence associated with small tears in the tissue) that might interfere with the accurate detection of sparse fragments from obliquely cut axons. The use of two-photon tomography by the Allen Institute that is described below may eliminate the noise contributed by such section irregularities and, thus, allow more sensitive detection of the sparse fragments. 4.3.Allen Mouse Brain Connectivity AtlasThe Allen Institute for Brain Science has employed small iontophoretic injections of rAAV(2/1) expressing GFP under a synaptophysin promoter, which combines with the tropism of the serotype 1 capsids to further restrict expression of GFP to neurons.5 After three weeks of expression and transport, the mouse brains are sectioned coronally at 100-micron intervals, and after each slice is removed, the surface of the tissue block is interrogated with scanning two-photon fluorescence tomography to collect a single focal plane of fluorescence data indicating the distribution of endogenous GFP fluorescence at a high level of sensitivity.5 The technique of tomography ensures that data in different sections can be aligned precisely without distortion. The method can be automated and generates of image data from a single brain in . Coronal sections are ideal for the overall goal of creating the Allen Mouse Brain Connectivity Atlas, which involves tracer injections and connectivity mapping of subcortical brain regions as well as cortical ones, because the coronal plane is most commonly used in other atlases, and its familiarity allows a more intuitive appreciation of the brain regions involved. The large image files in the Allen Mouse Brain Connectivity Atlas reflect the high spatial resolution of the coronal images, but despite the resolution in this plane, of depth information along the anterior-posterior dimension is missing between the collected coronal planes. The missing data prevent true tractography and the reconstruction of most of the horizontally oriented axons that are the subject of our research. Nevertheless, the individual histological sections available online show clear evidence of obliquely cut, small axonal fragments in the cortical regions surrounding injection sites in the barrel field of mouse cortex, and the distribution of these axonal fragments seems to be consistent with the horizontal axonal radiation that is more directly evident in our sections of flattened rat cortices [Fig. 5(a)]. In addition, the Allen group interpolates the data between coronal sections to create a three-dimensional (3-D) model of the overall projection patterns. The horizontal axonal radiation may be preserved in this rendering [Fig. 5(b)], although it is difficult to see this diffuse projection pattern when looking down on the modeled cortical surface due to underlying and overlying projections. Fig. 5Possible evidence for long-range horizontal axons in the Allen Mouse Brain Connectivity Atlas. (a) Images of green fluorescent protein fluorescence in three coronal slices following injection of a recombinant AAV vector into mouse barrel cortex. Details from the two-photon tomography images show fluorescent structures consistent with long-range horizontal cortical axons sliced obliquely at substantial distances posterior from the injection site (arrowheads). Images of this brain (378-1488, Experiment 127866392-SSp-bfd) were downloaded from Ref. 49. (b) Summaries of the projection densities from Experiment 127866392-SSp-bfd downloaded from Ref. 50 (top row) and from Brain Explorer 2 software (downloaded from Ref. 51) (bottom row). The radiation of long-range horizontal axons through all cortical layers probably contributes to the axonal density surrounding the injection site in these images; however, it is more difficult to parse the horizontal projection from specific projections in these images than it is in our slices of flattened cortices. 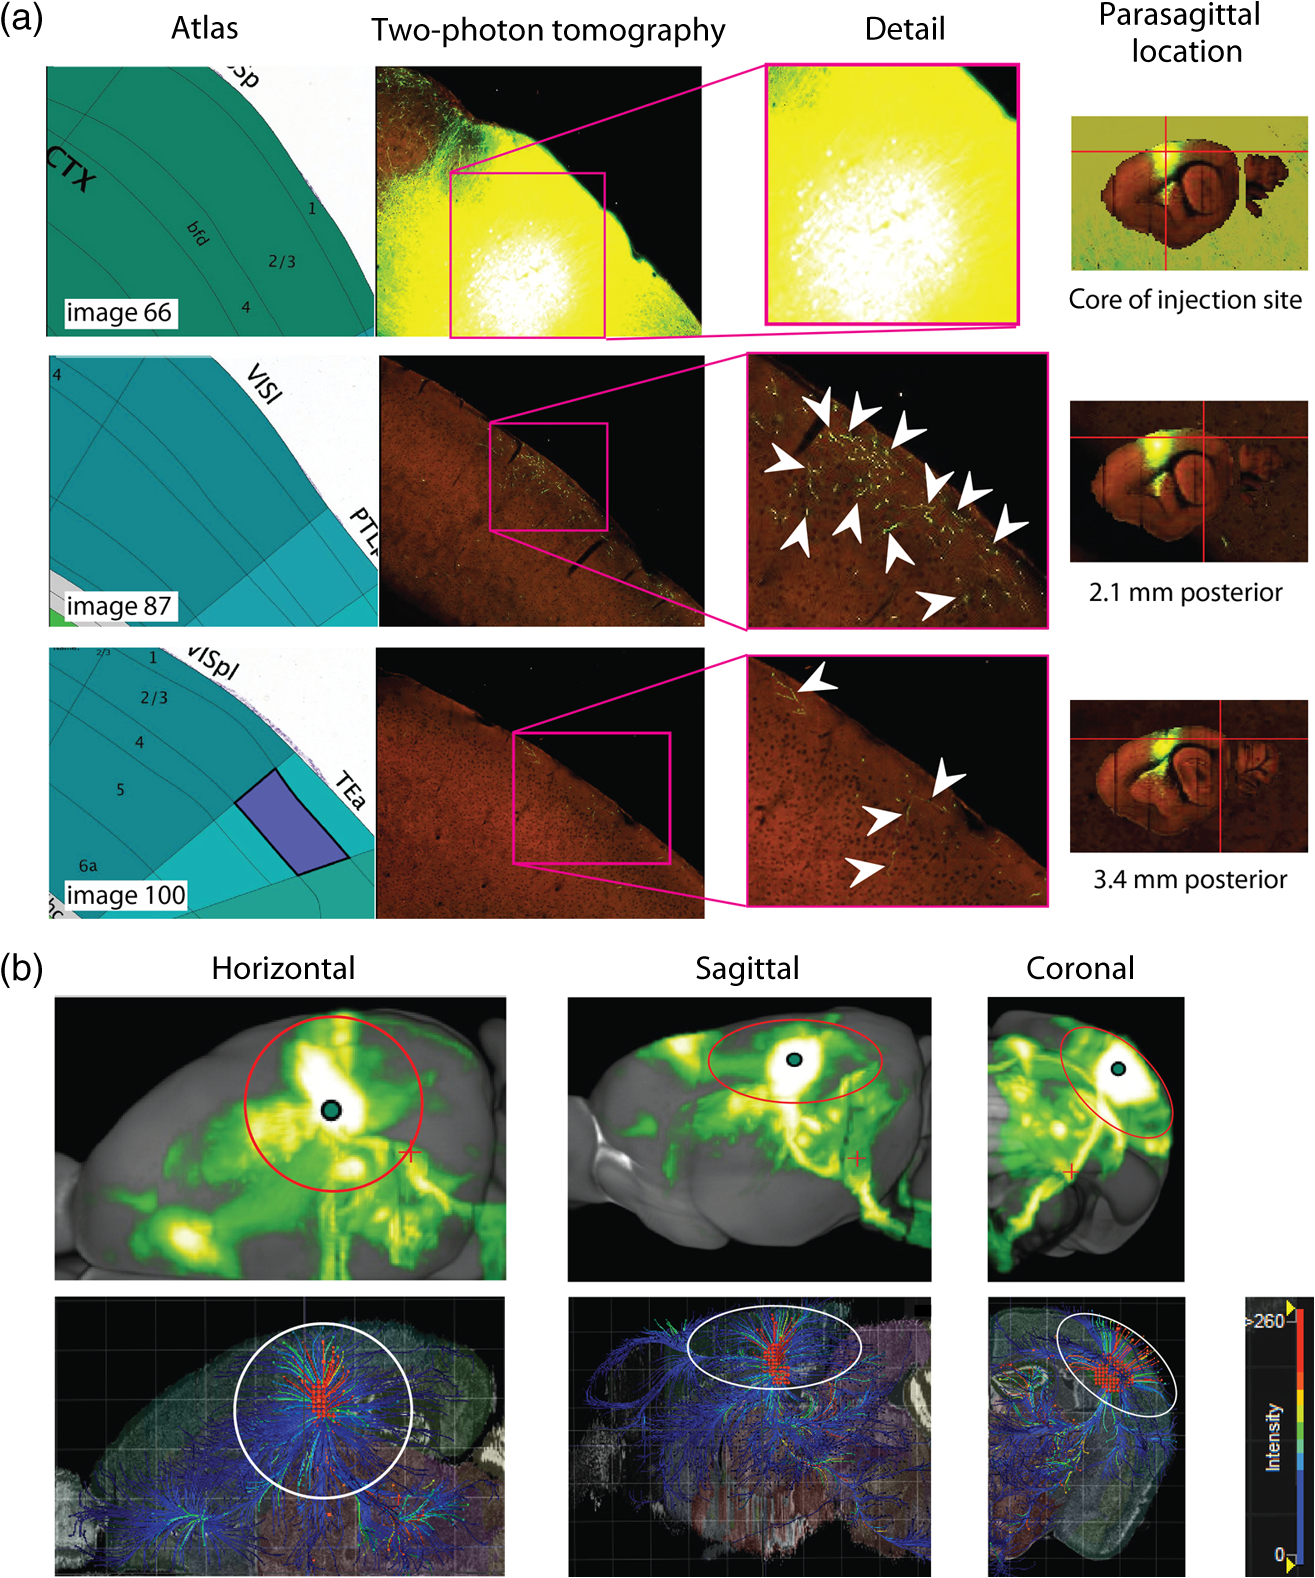 As part of the analysis of their connectivity data, the Allen group counts pixels of segmented GFP labeling within areas of their coronal sections to generate a quantitative measure of the projection density, which we think offers important advantages to semiquantitative scales. These areas are extended along the A-P axis to create voxels that are then fit to a standard 3-D reference atlas. However, most of the network analysis using correlation matrices and graph theory does not involve these equally sized volumes, but rather involves parcellated brain regions similar to what was described above for connectomes constructed from preexisting, published data.5 The use of a priori parcellation schemes in these analyses, therefore, may obscure certain details of connectivity that are available in the original data, including topographical projections and diffuse, long-range horizontal projections that decline gradually in density. The Allen group provides software that can summarize projection patterns and strengths within 3-D models of the mouse brain, which reestablishes some of the spatial relationships that are not evident from network graphs and correlation matrices. 5.Conclusions and ProspectusWe have elucidated a diffusely radiating, horizontal connection pattern in rat cortex that likely contributes to horizontal spreads of activity such as those that are evoked by whisker stimulation. The axons involved in this pattern are distributed more and more sparsely with increasing distance from their source and, therefore, are present at a lower density than clustered projections involving specific targets. A number of methodological choices may enhance their detection: the use of sections of flattened cortex made in the same plane as the trajectory of these axons, amplification of the signal by the use of secondary antibodies and avidin-biotin complexes, and thorough sampling strategies. In contrast, the big science projects to generate mouse and rat connectomes have involved methodological choices that optimize detection of clustered, specific projections. Furthermore, connectome projects tend to both use a priori notions of brain parcellation and emphasize brain area-to-brain area networks by way of graph theory and correlation matrices. These analyses may further obscure spatial relationships, such as the gradual decay in projection density associated with the horizontal axonal radiations that we have been studying. Given that the diffuse horizontal axon radiations are likely responsible for the subthreshold activity that dominates the signal obtained using popular imaging methods, such as voltage-sensitive dyes, intrinsic signal optical imaging, and fMRI,24,52–54 it seems especially important to ensure that the connectome include these patterns of connectivity so that accurate and thorough comparisons between connectivity and activity can be made. The large connectome projects have generated an immense body of systematically collected and/or collated data that will increase our understanding of brain structure and function in health and disease. Our understanding might be enhanced further by including alternative analyses that will incorporate more distributed connectivity and will be sensitive to connectivity between areas that have not been identified previously in parcellation schemes built on other foundations.2,5 For example, the voxel data in the Allen Mouse Brain Connectivity Atlas could be reconstructed virtually as flattened cortical maps at various cortical depths to reveal relationships such as we observe directly in our stained sections of physically flattened cortex. Additionally, instead of using binned data representing a priori cortical parcellation schemes, individual voxels could be used in graph theoretical analyses and correlation matrices to reveal greater details of connectivity, potentially generating a new parcellation scheme based on the connectivity itself.2,5 Inevitable continued technological advances in tissue clarification and microscopy methods,55 as well as in data processing and storage could provide tools for a second-generation connectome allowing high-resolution tractography to follow the trajectories of individual axons, including those involved in the horizontal cortical projection pattern we have characterized. However, even with efforts to further enhance our understanding of the data systematically generated by the large connectome projects, it seems likely that detailed and focused studies of connectivity using greater numbers of well-constrained tracer injections56 will continue to be needed to explore specific functional phenomena while accounting for individual differences between animals and individual tracer injections.2 Also, while the choice of standard methods for the mouse connectome projects reduces variability to facilitate comparisons between different locations of injections and projections, this restriction may systematically favor certain projections over others due to a tendency to label only certain classes of neurons.9 Therefore, studies using alternative procedures may still be required to insure a thorough sampling of the connections that exist. If the hazards of a priori parcellation schemes can be avoided, collation efforts, such as BAMS and neuroVIISAS, may provide the platform by which small science accomplishments addressing these specific issues can be integrated into the connectome. AcknowledgmentsWe thank Roblen Guevarra, Pejman Majd, Jason Louie, Joel Ramirez, Keli Tahara, and Daisy Chen for contributing to the new imaging, tracing, and axon reconstructions shown in this paper and Daniel D. Johnson for writing custom MATLAB® software to facilitate image analysis. This work was supported by the United States National Institute for Neurological Disorders and Stroke (PHS grants NS-055832 and NS-066001). All work involving animals was approved by the UC Irvine Animal Care and Use Committee (IACUC). ReferencesO. Sporns, G. Tononi and R. Kötter,
“The human connectome: a structural description of the human brain,”
PLoS Comput. Biol., 1
(4), e42
(2005). http://dx.doi.org/10.1371/journal.pcbi.0010042 PCBLBG 1553-734X Google Scholar
J. W. Bohland et al.,
“A proposal for a coordinated effort for the determination of brainwide neuroanatomical connectivity in model organisms at a mesoscopic scale,”
PLoS Comput. Biol., 5
(3), e1000334
(2009). http://dx.doi.org/10.1371/journal.pcbi.1000334 PCBLBG 1553-734X Google Scholar
M. Bota, H. W. Dong and L. W. Swanson,
“Combining collation and annotation efforts toward completion of the rat and mouse connectomes in BAMS,”
Front. Neuroinform., 6 2
(2012). http://dx.doi.org/10.3389/fninf.2012.00002 1662-5196 Google Scholar
O. Schmitt and P. Eipert,
“neuroVIISAS: approaching multiscale simulation of the rat connectome,”
Neuroinformatics, 10
(3), 243
–267
(2012). http://dx.doi.org/10.1007/s12021-012-9141-6 1539-2791 Google Scholar
S. W. Oh et al.,
“A mesoscale connectome of the mouse brain,”
Nature, 508
(7495), 207
–214
(2014). http://dx.doi.org/10.1038/nature13186 NATUAS 0028-0836 Google Scholar
B. Zingg et al.,
“Neural networks of the mouse neocortex,”
Cell, 156
(5), 1096
–1111
(2014). http://dx.doi.org/10.1016/j.cell.2014.02.023 CELLB5 0092-8674 Google Scholar
R. J. Morecraft et al.,
“Classic and contemporary neural tract-tracing techniques,”
Diffusion MRI (Second Edition) From Quantitative Measurement to In vivo Neuroanatomy, 359
–399 Elsevier, Amsterdam
(2014). Google Scholar
M. Bota et al.,
“BAMS2 workspace: a comprehensive and versatile neuroinformatic platform for collating and processing neuroanatomical connections,”
J. Comp. Neurol., 522
(14), 3160
–3176
(2014). http://dx.doi.org/10.1002/cne.23592 JCNEAM 0021-9967 Google Scholar
J. L. Nathanson et al.,
“Preferential labeling of inhibitory and excitatory cortical neurons by endogenous tropism of adeno-associated virus and lentivirus vectors,”
Neuroscience, 161
(2), 441
–450
(2009). http://dx.doi.org/10.1016/j.neuroscience.2009.03.032 NRSCDN 0306-4522 Google Scholar
J. G. White et al.,
“The structure of the nervous system of the nematode Caenorhabditis elegans,”
Philos. Trans. R. Soc. Lond. B Biol. Sci., 314
(1165), 1
–340
(1986). http://dx.doi.org/10.1098/rstb.1986.0056 0080-4622 Google Scholar
I. A. Meinertzhagen and S. D. O’Neil,
“Synaptic organization of columnar elements in the lamina of the wild type in Drosophila melanogaster,”
J. Comp. Neurol., 305
(2), 232
–263
(1991). http://dx.doi.org/10.1002/(ISSN)1096-9861 JCNEAM 0021-9967 Google Scholar
A.-S. Chiang et al.,
“Three-dimensional reconstruction of brain-wide wiring networks in Drosophila at single-cell resolution,”
Curr. Biol., 21
(1), 1
–11
(2011). http://dx.doi.org/10.1016/j.cub.2010.11.056 CUBLE2 0960-9822 Google Scholar
S. Y. Takemura et al.,
“A visual motion detection circuit suggested by Drosophila connectomics,”
Nature, 500
(7461), 175
–181
(2013). http://dx.doi.org/10.1038/nature12450 NATUAS 0028-0836 Google Scholar
O. Sporns,
“The human connectome: origins and challenges,”
Neuroimage, 80 53
–61
(2013). http://dx.doi.org/10.1016/j.neuroimage.2013.03.023 NEIMEF 1053-8119 Google Scholar
K. Fox, Barrel Cortex, Cambridge University Press, New York, NY
(2008). Google Scholar
D. Öngür and J. L. Price,
“The organization of networks within the orbital and medial prefrontal cortex of rats, monkeys and humans,”
Cereb. Cortex, 10
(3), 206
–219
(2000). http://dx.doi.org/10.1093/cercor/10.3.206 53OPAV 1047-3211 Google Scholar
H. J. J. M. Van De Werd and H. B. M. Uylings,
“Comparison of (stereotactic) parcellations in mouse prefrontal cortex,”
Brain Struct. Funct., 219
(2), 433
–459
(2014). http://dx.doi.org/10.1007/s00429-013-0630-7 BSFRCD 1863-2653 Google Scholar
N. Palomero-Gallagher and K. Zilles,
“Isocortex,”
The Rat Nervous System (Fourth Edition), 601
–625 Elsevier, Amsterdam
(2015). Google Scholar
T. Mao et al.,
“Long-range neuronal circuits underlying the interaction between sensory and motor cortex,”
Neuron, 72
(1), 111
–123
(2011). http://dx.doi.org/10.1016/j.neuron.2011.07.029 NERNET 0896-6273 Google Scholar
A. K. Wright, L. Norrie and G. W. Arbuthnott,
“Corticofugal axons from adjacent ‘barrel’ columns of rat somatosensory cortex: cortical and thalamic terminal patterns,”
J. Anat., 196
(3), 379
–390
(2000). http://dx.doi.org/10.1046/j.1469-7580.2000.19630379.x JOANAY 0021-8782 Google Scholar
J. H. Kaas,
“Topographic maps are fundamental to sensory processing,”
Brain Res. Bull., 44
(2), 107
–112
(1997). http://dx.doi.org/10.1016/S0361-9230(97)00094-4 BRBUDU 0361-9230 Google Scholar
U. Kim and F. F. Ebner,
“Barrels and septa: separate circuits in rat barrel field cortex,”
J. Comp. Neurol., 408
(4), 489
–505
(1999). http://dx.doi.org/10.1002/(ISSN)1096-9861 JCNEAM 0021-9967 Google Scholar
E. Bullmore and O. Sporns,
“Complex brain networks: graph theoretical analysis of structural and functional systems,”
Nat. Rev. Neurosci., 10
(3), 186
–198
(2009). http://dx.doi.org/10.1038/nrn2575 NRNAAN 1471-0048 Google Scholar
R. D. Frostig et al.,
“Large-scale organization of rat sensorimotor cortex based on a motif of large activation spreads,”
J. Neurosci., 28
(49), 13274
–13284
(2008). http://dx.doi.org/10.1523/JNEUROSCI.4074-08.2008 JNRSDS 0270-6474 Google Scholar
J. Stehberg, P. T. Dang and R. D. Frostig,
“Unimodal primary sensory cortices are directly connected by long-range horizontal projections in the rat sensory cortex,”
Front. Neuroanat., 8 93
(2014). http://dx.doi.org/10.3389/fnana.2014.00093 FNREB8 1662-5129 Google Scholar
B. Brett-Green, C. H. Chen-Bee and R. D. Frostig,
“Comparing the functional representations of central and border whiskers in rat primary somatosensory cortex,”
J. Neurosci., 21
(24), 9944
–9954
(2001). JNRSDS 0270-6474 Google Scholar
C. H. Chen-Bee et al.,
“Whisker array functional representation in the rat barrel cortex: transcendence of one-to-one topography and its underlying mechanism,”
Front. Neural Circuits, 6 93
(2012). http://dx.doi.org/10.3389/fncir.2012.00093 FNCRA5 1662-5110 Google Scholar
M. N. Wallace,
“Histochemical demonstration of sensory maps in the rat and mouse cerebral cortex,”
Brain Res., 418
(1), 178
–182
(1987). http://dx.doi.org/10.1016/0006-8993(87)90977-2 BRREAP 1385-299X Google Scholar
M. T. Wong-Riley and C. Welt,
“Histochemical changes in cytochrome oxidase of cortical barrels after vibrissal removal in neonatal and adult mice,”
Proc. Natl. Acad. Sci. USA, 77
(4), 2333
–2337
(1980). http://dx.doi.org/10.1073/pnas.77.4.2333 1091-6490 Google Scholar
R. D. Frostig,
“Functional organization and plasticity in the adult rat barrel cortex: moving out-of-the-box,”
Curr. Opin. Neurobiol., 16
(4), 445
–450
(2006). http://dx.doi.org/10.1016/j.conb.2006.06.001 COPUEN 0959-4388 Google Scholar
I. Ferezou et al.,
“Spatiotemporal dynamics of cortical sensorimotor integration in behaving mice,”
Neuron, 56
(5), 907
–923
(2007). http://dx.doi.org/10.1016/j.neuron.2007.10.007 NERNET 0896-6273 Google Scholar
T. Berger et al.,
“Combined voltage and calcium epifluorescence imaging in vitro and in vivo reveals subthreshold and suprathreshold dynamics of mouse barrel cortex,”
J. Neurophysiol., 97
(5), 3751
–3762
(2007). http://dx.doi.org/10.1152/jn.01178.2006 JONEA4 0022-3077 Google Scholar
W. Akemann et al.,
“Imaging brain electric signals with genetically targeted voltage-sensitive fluorescent proteins,”
Nat. Methods, 7
(8), 643
–651
(2010). http://dx.doi.org/10.1038/nmeth.1479 1548-7091 Google Scholar
D. J. Davis, R. Sachdev and V. A. Pieribone,
“Effect of high velocity, large amplitude stimuli on the spread of depolarization in S1 ‘barrel’ cortex,”
Somatosens. Mot. Res., 28
(3–4), 73
–85
(2011). http://dx.doi.org/10.3109/08990220.2011.613177 SMOREZ 1369-1651 Google Scholar
M. Minderer et al.,
“Chronic imaging of cortical sensory map dynamics using a genetically encoded calcium indicator,”
J. Physiol., 590
(1), 99
–107
(2012). http://dx.doi.org/10.1113/tjp.2012.590.issue-1 JPHYA7 0022-3751 Google Scholar
B. R. Lustig et al.,
“Voltage-sensitive dye imaging reveals shifting spatiotemporal spread of whisker-induced activity in rat barrel cortex,”
J. Neurophysiol., 109
(9), 2382
–2392
(2013). http://dx.doi.org/10.1152/jn.00430.2012 JONEA4 0022-3077 Google Scholar
G. Dimitriadis, A. M. M. Fransen and E. Maris,
“Sensory and cognitive neurophysiology in rats. Part 2: validation and demonstration,”
J. Neurosci. Methods, 232 47
–57
(2014). http://dx.doi.org/10.1016/j.jneumeth.2014.05.002 JNMEDT 0165-0270 Google Scholar
M. P. Vanni and T. H. Murphy,
“Mesoscale transcranial spontaneous activity mapping in GCaMP3 transgenic mice reveals extensive reciprocal connections between areas of somatomotor cortex,”
J. Neurosci., 34
(48), 15931
–15946
(2014). http://dx.doi.org/10.1523/JNEUROSCI.1818-14.2014 JNRSDS 0270-6474 Google Scholar
E. Budinger et al.,
“Multisensory processing via early cortical stages: connections of the primary auditory cortical field with other sensory systems,”
Neuroscience, 143
(4), 1065
–1083
(2006). http://dx.doi.org/10.1016/j.neuroscience.2006.08.035 NRSCDN 0306-4522 Google Scholar
V. Charbonneau et al.,
“Cortical and subcortical projections to primary visual cortex in anophthalmic, enucleated and sighted mice,”
Eur. J. Neurosci., 36
(7), 2949
–2963
(2012). http://dx.doi.org/10.1111/j.1460-9568.2012.08215.x EJONEI 0953-816X Google Scholar
J. U. Henschke et al.,
“Possible anatomical pathways for short-latency multisensory integration processes in primary sensory cortices,”
Brain Struct. Funct., 220
(2), 955
–977
(2015). http://dx.doi.org/10.1007/s00429-013-0694-4 BSFRCD 1863-2653 Google Scholar
B. A. Johnson and R. D. Frostig,
“Long, horizontal axons radiating from rat barrel cortex have spatial distributions similar to horizontal spreads of activity evoked by whisker stimulation,”
(2015). Google Scholar
C. Burger et al.,
“Recombinant AAV viral vectors pseudotyped with viral capsids from serotypes 1, 2, and 5 display differential efficiency and cell tropism after delivery to different regions of the central nervous system,”
Mol. Ther., 10
(2), 302
–317
(2004). http://dx.doi.org/10.1016/j.ymthe.2004.05.024 MTOHCK 1525-0016 Google Scholar
J.-M. Taymans et al.,
“Comparative analysis of adeno-associated viral vector serotypes 1, 2, 5, 7, and 8 in mouse brain,”
Human Gene Ther., 18
(3), 195
–206
(2007). http://dx.doi.org/10.1089/hum.2006.178 HGTHE3 1043-0342 Google Scholar
C. N. Cearley and J. H. Wolfe,
“A single injection of an adeno-associated virus vector into nuclei with divergent connections results in widespread vector distribution in the brain and global correction of a neurogenetic disease,”
J. Neurosci., 27
(37), 9928
–9940
(2007). http://dx.doi.org/10.1523/JNEUROSCI.2185-07.2007 JNRSDS 0270-6474 Google Scholar
M. J. Castle et al.,
“AAV serotypes 1, 8, and 9 share conserved mechanisms for anterograde and retrograde axonal transport,”
Hum. Gene Ther., 25
(8), 705
–720
(2014). http://dx.doi.org/10.1089/hum.2013.189 HGTHE3 1043-0342 Google Scholar
Mouse Home | Brain Architecture Project,
(2015) http://www.brainarchitecture.org/mouse-home March ). 2015). Google Scholar
Projection High Resolution Image Viewer, “Allen Brain Atlas: Mouse Connectivity,”
(2015) http://connectivity.brain-map.org/projection/experiment/siv/127866392?imageId=127866602&imageType=TWO_PHOTON,SEGMENTATION&initImage=TWO_PHOTON&x=25137&y=7204&z=3 January ). 2015). Google Scholar
Projection, “Allen Brain Atlas: Mouse Connectivity,”
(2015) http://connectivity.brain-map.org/ January ). 2015). Google Scholar
Brain Explorer, “Allen Brain Atlas: Mouse Connectivity,”
(2015) http://connectivity.brain-map.org/static/brainexplorer January ). 2015). Google Scholar
A. Grinvald and R. Hildesheim,
“VSDI: a new era in functional imaging of cortical dynamics,”
Nat. Rev. Neurosci., 5
(11), 874
–885
(2004). http://dx.doi.org/10.1038/nrn1536 NRNAAN 1471-0048 Google Scholar
J. Niessing et al.,
“Hemodynamic signals correlate tightly with synchronized gamma oscillations,”
Science, 309
(5736), 948
–951
(2005). http://dx.doi.org/10.1126/science.1110948 SCIEAS 0036-8075 Google Scholar
N. K. Logothetis,
“What we can do and what we cannot do with fMRI,”
Nature, 453
(7197), 869
–878
(2008). http://dx.doi.org/10.1038/nature06976 NATUAS 0028-0836 Google Scholar
K. Chung and K. Deisseroth,
“CLARITY for mapping the nervous system,”
Nat. Methods, 10
(6), 508
–513
(2013). http://dx.doi.org/10.1038/nmeth.2481 1548-7091 Google Scholar
I.M. Zakiewicz et al.,
“Brain-wide map of efferent projections from rat barrel cortex,”
Front. Neuroinform., 8 5
(2014). http://dx.doi.org/10.3389/fninf.2014.00005 1662-5196 Google Scholar
|


