
|
|
1.IntroductionNear-infrared spectroscopy (NIRS) is a neuroimaging modality that uses the transmission of near-infrared light through biological tissue to determine the relative concentration of hemoglobin in different states of oxygenation. It is used to examine cortical cerebral hemodynamics. Many studies using this modality have focused on task-based approaches to examine cerebral hemodynamic responses evoked in response to stimuli or during cognitive activities. Given its low operational cost, ease of use, portability, and the ability for patients to be relatively more mobile during studies, NIRS lends itself well to the long-term examination of hemodynamic changes. Long-term monitoring is critical in order to better understand alterations in brain activity that may occur over extended periods of time as well as those that may occur during unexpected or unanticipated events. As a result, such an approach has been taken to examine cerebral hemodynamic changes occurring in patients with epilepsy.1–9 As data are recorded for longer durations in these instances, this raises additional challenges to be addressed during and after data collection such as an increased prevalence of movement, which can induce artifacts in NIRS data. Recently, more attention has been given to the reduction of motion artifacts in NIRS data. The way that motion artifacts manifest in a dataset varies depending on the nature of the artifact and movement. Motion artifacts resulting from a shift in the contact between the optode and the skin may appear as sharp spikes or shifts in the data.10 Several methods have been proposed to reduce such motion artifacts and they vary widely in their methodology. While some techniques, such as those using an accelerometer, require additional equipment present during data collection to provide a direct measurement of motion or the effects of motion,10 other techniques with no such additional requirements have also been explored.11,12 HOMER2 (hemodynamic evoked response13), a NIRS software package in MATLAB® (Mathworks, Natick, Massachusetts) has recently made available many motion correction techniques including principal component analysis (PCA),14 targeted PCA (tPCA),15 correlation-based signal improvement (CBSI) method,11 Kalman filtering,16 the wavelet method,17 and the motion artifact reduction algorithm (MARA),12 which they term spline interpolation. Studies have compared the efficacy of several methods at reducing artifacts in NIRS data. One study compared the effect of PCA,14 MARA,12 the wavelet method,17 and discrete Kalman filtering16 on data comprised of simulated hemodynamic response functions added to acquired NIRS data.18 Based on the performance of these techniques, the authors recommend the use of the MARA12 and wavelet methods.17,18 Another study compared the same four motion correction techniques along with the CBSI method11 and trials where no correction was performed or where entire trails containing an artifact were rejected.19 This study focused on the reduction of low-amplitude and low-frequency artifacts; results indicated that the wavelet method outperformed the other methods at reducing this type of artifact.19 Another experiment examined a new technique, tPCA15 and compared it to the MARA and wavelet methods as well as NIRS data collected from probes affixed to the scalp using collodion, which has been shown to prospectively reduce motion artifacts in the data.20 This was tested on simulated hemodynamic response functions added to real NIRS data. tPCA was found to perform the best of the three artifact correction techniques.15 Work in our group is focused on better understanding cerebral hemodynamic alterations occurring in patients with epilepsy. Given the unpredictable nature of seizures, sometimes many hours of data must be collected over multiple days in order to capture an event (e.g., seizure) or period of interest. The requirement for extended duration data collection means we are certain to have motion artifacts at some point in the data series. In order for NIRS to be clinically useful, a method was needed to remove or minimize motion artifacts. Data from this paper were acquired during a study focused on examining alterations in cerebral hemodynamics occurring during the preictal period (before a seizure). We are interested in studying hemodynamic changes before, during, and after seizures as this can help us to elucidate factors contributing to epilepsy and help us to better understand changes in tissue oxygenation and blood volume that may occur during different epileptic states. Our group is particularly interested in hemodynamic changes that occur prior to seizures, as these may be potentially predictive of oncoming seizures. In this study, we examined cerebral hemodynamics from the frontal lobes of patients with epilepsy during both the interictal and preictal period. The frontal lobes were selected as the site of data collection in order to avoid placing the probes over hair which may absorb emitted light and distort the data collected. Not all patients recruited for this study had frontal lobe epilepsy. As a result we did not obtain NIRS measurements directly from the epileptic lobe for all participants. Studies, however, have demonstrated ictal alterations in frontal perfusion in patients with temporal lobe epilepsy.21 Previous work from our group and others has also demonstrated alterations in frontal oxygenation in patients with temporal lobe epilepsy minutes prior to seizure onset using NIRS.5,6 We selected the MARA technique to apply to our data based on its strength in reducing baseline shift artifacts and its performance.18 To our knowledge, MARA has been used without significant modifications in 25 human studies since its creation (Table 1). The majority of these studies were task-based studies () and involved the study of healthy participants () in which NIRS data was recorded for less than 1 h at any given session (). In the majority of these studies, subjects were relatively motionless and in many cases were comfortably seated. Table 1Previous work using MARA to reduce motion artifacts. Abbreviation: UMTS-EMF = Universal Mobile Telecommunications System electromagnetic fields.
Our application of this semiautomatic technique to our data involving the long-term video- electroencephalography (EEG) monitoring of patients with epilepsy is unique. First, many of the studies previously using these techniques were task-based and of short duration. Our data were acquired over many hours and on multiple days for some patients. Long-term monitoring results in an increase in movement and thus motion-related artifacts. This study extends the use of MARA from short studies on the healthy population into a long-term monitoring context wherein several hours of data are collected, sometimes over multiple days, from an adult patient population in a hospital setting. Three previous studies have been conducted that use MARA on long-term monitoring data. One of these studies was conducted using a healthy population during sleep.10 The remaining two studies investigated different patient populations: newborn infants with neonatal encephalopathy22 and patients receiving balloon occlusion of their cerebral arteries.41 In the former study, analyzes were focused on events seconds to minutes in length22 and, in the latter study, the authors noted that only the few minutes of data around the occlusion were analyzed to avoid motion artifacts.41 Studying adults in an inpatient setting being monitored for their seizures poses challenges in data collection and analysis that are unique to this patient population and would not be observed in the other studies published. These challenges include the wide range and prevalence of movements and behaviors exhibited by patients being monitored in the hospital over days, the artifacts that result from these movements and behaviors, and the placement of NIRS sensors among EEG electrodes. This paper examines the challenges unique to the long-term monitoring of patients with epilepsy and how these challenges are associated with artifacts in the data. We demonstrate how a semiautomated method, widely available, can be applied to reduce motion artifacts in long time-course NIRS datasets. This ecologically valid work is aimed at improving the applicability of NIRS for applications in clinically relevant data. 2.Methods2.1.ParticipantsEight patients with frequent focal seizures were recruited from the seizure monitoring unit (SMU) at the Foothills Medical Centre, where they were undergoing continuous EEG and video monitoring as part of their presurgical investigations for refractory focal epilepsy. Written consent was obtained from all patients and this project was approved by the Conjoint Health Research Ethics Board at the University of Calgary. Information regarding these patients can be found in Table 2. Five of these participants were included in a behavioral analysis (P1 to P5), and four of them were included in an analysis where MARA was applied to their data to reduce artifacts (P5 to P8). Table 2Patient demographics for those included in the behavioral analysis (P1 to P5) and those whose data underwent artifact reduction (P5 to P8). Abbreviations: Bi = Bilateral; F = Female; Lt = Left; M = Male; Rt = Right; Sz = Seizure; and WM = white matter.
2.2.Data Collection ProcedureA source/detector probe from Hamamatsu Photonics (Hamamatsu City, Japan) was placed on the left and right forehead of participants using a double-sided adhesive. Efforts were made to avoid placing the optodes over the frontal sinuses and, in some cases, the position of the optodes was shifted to accommodate the frontal EEG electrodes. A headband or tensor bandage was placed around the head, covering both optodes, to minimize motion and to reduce artifacts from incident light. Patients were allowed to fall asleep or stay awake and were sitting or lying down during the study. Their mobility was limited by the length of the optode cord (2.5 m). Data were collected until a seizure occurred or they withdrew from the study. Typically, this resulted in several hours of data collection, which, for some participants, included multiple days of data collection. 2.3.Data Collection ParametersNIRS data were obtained using the NIRO-200 system (Hamamatsu Photonics, Hamamatsu City, Japan). This machine uses three wavelengths of light (775, 810, and 850 nm) and records continuous changes in oxygenated hemoglobin (), deoxygenated hemoglobin (HHb), tissue oxygenation index [TOI; oxygen saturation measured as the ratio of to total hemoglobin (HbT)], and normalized tissue hemoglobin index (nTHI; the amount of HbT normalized relative to the first value of HbT measured). The sampling rate was 2 Hz. Data were exported to a PC laptop via USB connection and saved as text files using the NIRO-100/200OL program (Hamamatsu Photonics, Hamamatsu City, Japan). The relative concentrations of and HHb were calculated by the NIRO-200 machine using the modified Beer–Lambert law and curve fitting. These values were obtained in units of . A recently derived equation was used to estimate the differential path length factor for each participant based on his or her age as well as the middle of the wavelength of light (810 nm).48 This value was multiplied by the emitter-detector separation of 4 cm and this was used to convert and HHb measurements into final units of . Measurements of TOI and nTHI were calculated by the NIRO-200 machine using spatially resolved spectroscopy.49 For the purposes of visualization, NIRS measurements were normalized by subtracting all subsequent data from the first data point shown in each figure. As a result, data shown in graphs represent a change in each measure from the first value graphed. 2.4.Behavior and Motion ExaminationFive participants (P1 to P5) were chosen to undergo behavioral analysis as they had interictal video available for extended periods of time. One interictal segment, 1 h in length, was chosen for each participant. These segments were chosen such that the entire segment was distanced from any seizures occurring before or after the segment. With the exception of one participant, where there were 24 min between the end of the segment and the following seizure, all segments were taken at least 1 h before and after a seizure. The exact timing varied depending on the amount of available data and the occurrence of a seizure. A video of the patient obtained simultaneously with the EEG and NIRS data collection in the SMU was examined during this segment and marked for behaviors commonly observed in patients as well as changes in body position. Behaviors commonly exhibited by patients included eating and/or drinking, resting (eyes closed, still), watching a screen (either on a personal laptop or the TV in the SMU), reading, talking (either on the phone or in person), typing (either on a personal laptop or phone), listening to music, yawning, and pulling at the optodes and/or tensor bandage. Movement was also marked and included standing up, sitting down, lying down, sitting up, rolling over, and other movements (including adjusting position). NIRS data were then visually examined for fluctuations with reference to the recorded behaviors and movements. 2.5.Selection of Artifact Reduction TechniquesThree artifact reduction techniques that do not require the presence of additional equipment at the time of data collection have been shown to be effective at reducing motion artifacts and to outperform other methods in doing so. They include the MARA,12 wavelet,17 and tPCA methods.15 All the three techniques are available through the HOMER2 software package and are easy to implement. As a result, we were interested in the use of these techniques for our long-term monitoring data. The most problematic motion artifacts we observed in our dataset were baseline shift artifacts. The wavelet method does not reduce these types of artifacts,15 and as a result was not applied to our data. tPCA is a novel technique which, to date, has only been applied to optical density data. In our study, data is exported in , HHb, TOI, and nTHI measures. When tPCA is applied to all of these measures at once, artifacts are not all consistently reduced and in some cases, they can be enhanced. Additional iterations of this technique can improve its results with some of the artifacts.15 It is possible that the performance of this technique may be impacted by the different scales, amplitudes, presentation of artifacts, and/or variance of these measurements. These differences may explain some artifacts persisting after the application of this technique. Applying tPCA separately for each NIRS measurement could be a beneficial approach as it would include only similar data in the analyses. It is important to note that the number of components generated by PCA is directly related to the number of probes used. Two NIRS probes were used for the majority of those participating in our study, limiting the analyses done on each measure to the removal of one of the two components in order to maintain variance in the signal. Additionally, there were instances in our study where measurements were only acquired ipsilateral to the seizure focus. In such cases, the tPCA technique applied separately for each measurement would remove either all or none of the variance in segments identified as containing an artifact, resulting in either no change to the signal or to a flat signal present for all segments identified as containing artifacts. For this reason, MARA was more compatible with our data as this method can be implemented simultaneously with all four measures. Given the small number of channels used in this study, a strength of the MARA is that its efficacy is not impacted by the number of probes. As a result, we chose to focus on studying the efficacy of MARA with our data. 2.6.Application of Motion Artifact Reduction Algorithm to NIRS DataThe first step in reducing artifacts using MARA is the identification of artifacts. This was originally done using the application of a sliding standard deviation to the NIRS signal of interest.12 A user-set threshold was applied to this sliding standard deviation in order to identify segments of data containing a potential artifact. Other groups have identified artifacts in the data using the hmrMotionArtifactByChannel script available through the HOMER2 software program, which identifies artifacts on a channel-by-channel basis. This script allows users to set the window size where changes in signal amplitude and standard deviation are calculated, as well as to set a threshold on the standard deviation and amplitude changes within this window. While some studies use the same parameters for the identification of motion artifacts in NIRS data for all participants,15,19,23,41 others alter these parameters, tailoring them to the participant/data. For example, the original paper describing MARA used different standard deviation thresholds for and HHb data.12 Another study altered the standard deviation threshold on a subject-by-subject basis using visual inspection to optimize the accurate identification of artifacts.18 Indeed, it has been our experience that thresholds set on a subject-by-subject basis improve the identification of artifacts. In this study, a sliding standard deviation of the data was performed with a window size of 61 datapoints (30.5 s). The median of the standard deviation over the hour prior to seizure onset (or all preictal data if less than 1 h was available) was calculated. A percentage of this median value was used to threshold the sliding standard deviation. This approach accounted for different baseline levels of variance that may exist across measures. As not all artifacts in the data were observed in both channels, the threshold applied to the sliding standard deviation was chosen separately for each optode and channel. The artifacts appeared to varying degrees in the four NIRS measurements and sometimes were undetectable in one or more measures; however, it was observed that these artifacts often appeared most distinctly in the , HHb, and nTHI measures. As a result, the timing of identified artifacts using HHb and nTHI was combined. Visual inspection was used to confirm that the standard deviation thresholds accurately identified artifacts. This visual check prevented the use of a threshold that was too high or missing large artifacts, and prevented a threshold that was too low from being selected, which could flag artifact-free segments improperly and distort the data. Typical scalars multiplied by the median standard deviation ranged from 3.2 to 5.5. This translated to standard deviation thresholds between 0.5 and 0.6 for HHb () and between 0.023 and 0.047 for nTHI (%). Identified artifacts typically involved rapid increases or decreases in signal of over a couple of seconds with slopes of around for HHb and for nTHI. Next, motion artifacts were reduced using MARA, involving a number of steps. The data were split into segments identified as containing an artifact and those without. A spline was fit to each segment containing an artifact. This spline was subtracted from the data. Windows of data of variable lengths were used to obtain mean values at the beginning and end of each data segment, which were then used to determine the vertical shift between segments of data. Each artifact segment and artifact-free segment was then adjusted by adding these vertical shifts to ensure the data were continuous before and after the segments with the corrected artifacts.12 For more detailed information regarding this technique, refer to Ref. 12. MARA was applied to these data using the hmrMotionCorrectSpline script from the HOMER2 package (version 0.8.3) to create and subtract the splines as well as to add the vertical shift to realign the data. An adjustment was made to the hmrMotionCorrectSpline script to accommodate the sampling rate used in this study. Default values to determine the windows of data before and after segments of data were originally empirically determined and set to one-third the sampling rate and two times the sampling rate.12 Given the sampling rate of 2 Hz used in this study, these default values were not feasible. As a result, in order to apply MARA to these data, the default values were changed to 50 s and 1000 s. Artifacts were observed during the hour prior to seizure onset for four patients (P5 to P8) and commonly occurred in the 15 min prior to seizure onset. As this time period prior to seizures is of particular interest due to previous work observing preictal alterations occurring during this time frame,5,6,50–52 it was chosen as a focus for further examination. To quantify how the signal was altered by the application of MARA, the percent change in standard deviation was calculated over this 15-min period. Additionally, to determine the reduction in NIRS artifacts, an average obtained over a window of 20 data points or 10 s prior to the segment identified as containing an artifact was subtracted from an average over a 10 s window after the artifact. This was done for all artifacts in the 15 min prior to seizure onset that were at least 10 s apart from other artifacts and the time of seizure onset. The absolute value of this subtraction conducted pre- and post-MARA were compared using the Wilcoxon Signed Rank test. This statistical test was selected as not all data followed a normal distribution. These analyses were conducted separately for each NIRS measurement. 3.Results3.1.Behavior AnalysisFluctuations in the NIRS data frequently co-occurred with changes in behavior, movement, or both. An example of an analysis from patient P5 is shown in Fig. 1. In this figure, a rapid change in all four NIRS measurements was observed occurring at approximately 7.5 min. When compared to the behavioral and movement markings for this patient, this rapid change occurred during a period when the patient was resting with no notable movement. Fig. 1Changes in behavior and posture observed over 30 min for patient P5. The main behavior engaged in at each time point is represented by a black line in the top graph. The black square represents movement or posture changes scored upon first review of the video. The black triangle indicates a movement that was added after a second review of the video when striking fluctuations in the near-infrared spectroscopy (NIRS) measurements were observed for this patient with no corresponding change in behavior or motion. 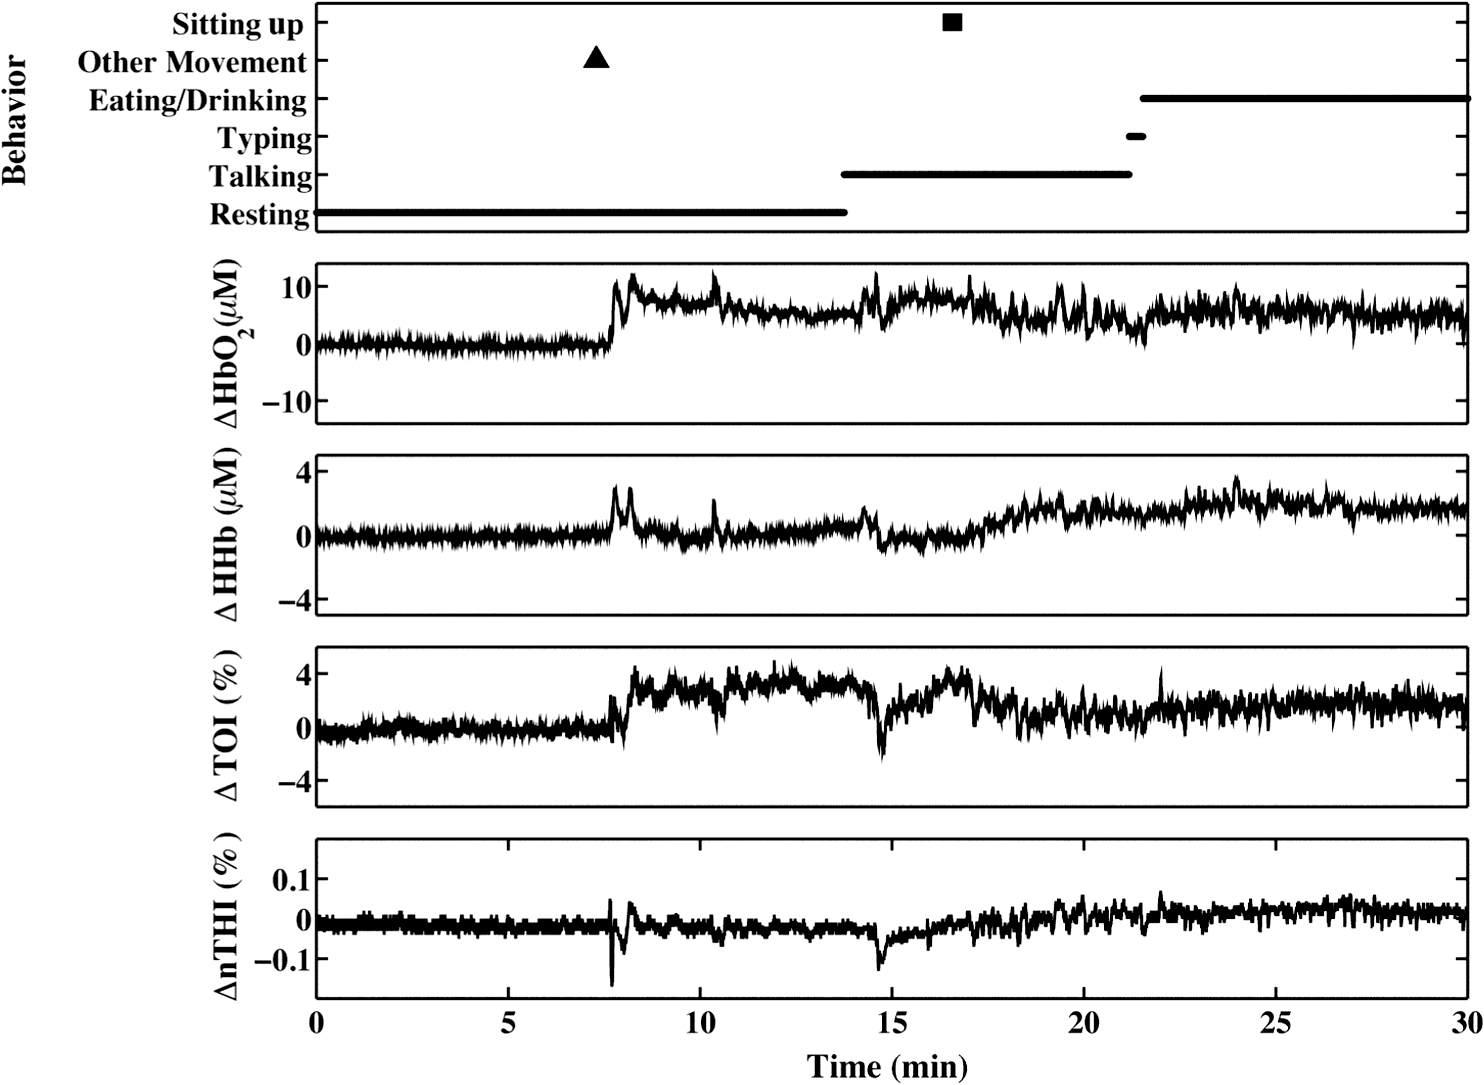 A second review of the video was conducted over this time period to identify the cause of this marked change in the NIRS data. It was found that this rapid fluctuation corresponded to the patient repositioning his head while lying down. This likely caused a shift in contact between the optode and the scalp, resulting in a motion artifact in the data. This movement was marked upon this second review and appears as a black triangle on the top graph. Other fluctuations in NIRS measurements were observed during this 1-h period and they frequently coincided with a noted change in behavior or movement. 3.2.Application of Motion Artifact Reduction Algorithm to ArtifactsData in the hour prior to seizures were examined for artifacts appearing as sharp shifts in the data. In four cases, sharp shifts were common in the 15 min prior to a seizure and these segments were examined further. As can be seen in data from P6 (Fig. 2), these artifacts can appear in both NIRS channels and across all four NIRS measurements. Application of MARA reduced the sharp baseline shifts present in the data. It also reduced the standard deviation over the 15-min time period bilaterally (Table 3). The percent reduction was greatest for the measures where the artifacts appeared as large baseline shifts such as the bilateral nTHI, contralateral and contralateral HHb measurements, than when the artifacts appeared as spikes. Fig. 2NIRS data from patient P6 obtained: (a) ipsilateral and (b) contralateral to the site of seizure onset before and after the application of MARA. The vertical lines and black arrows indicate the segments containing artifacts that were identified using MARA. Time zero represents seizure onset. 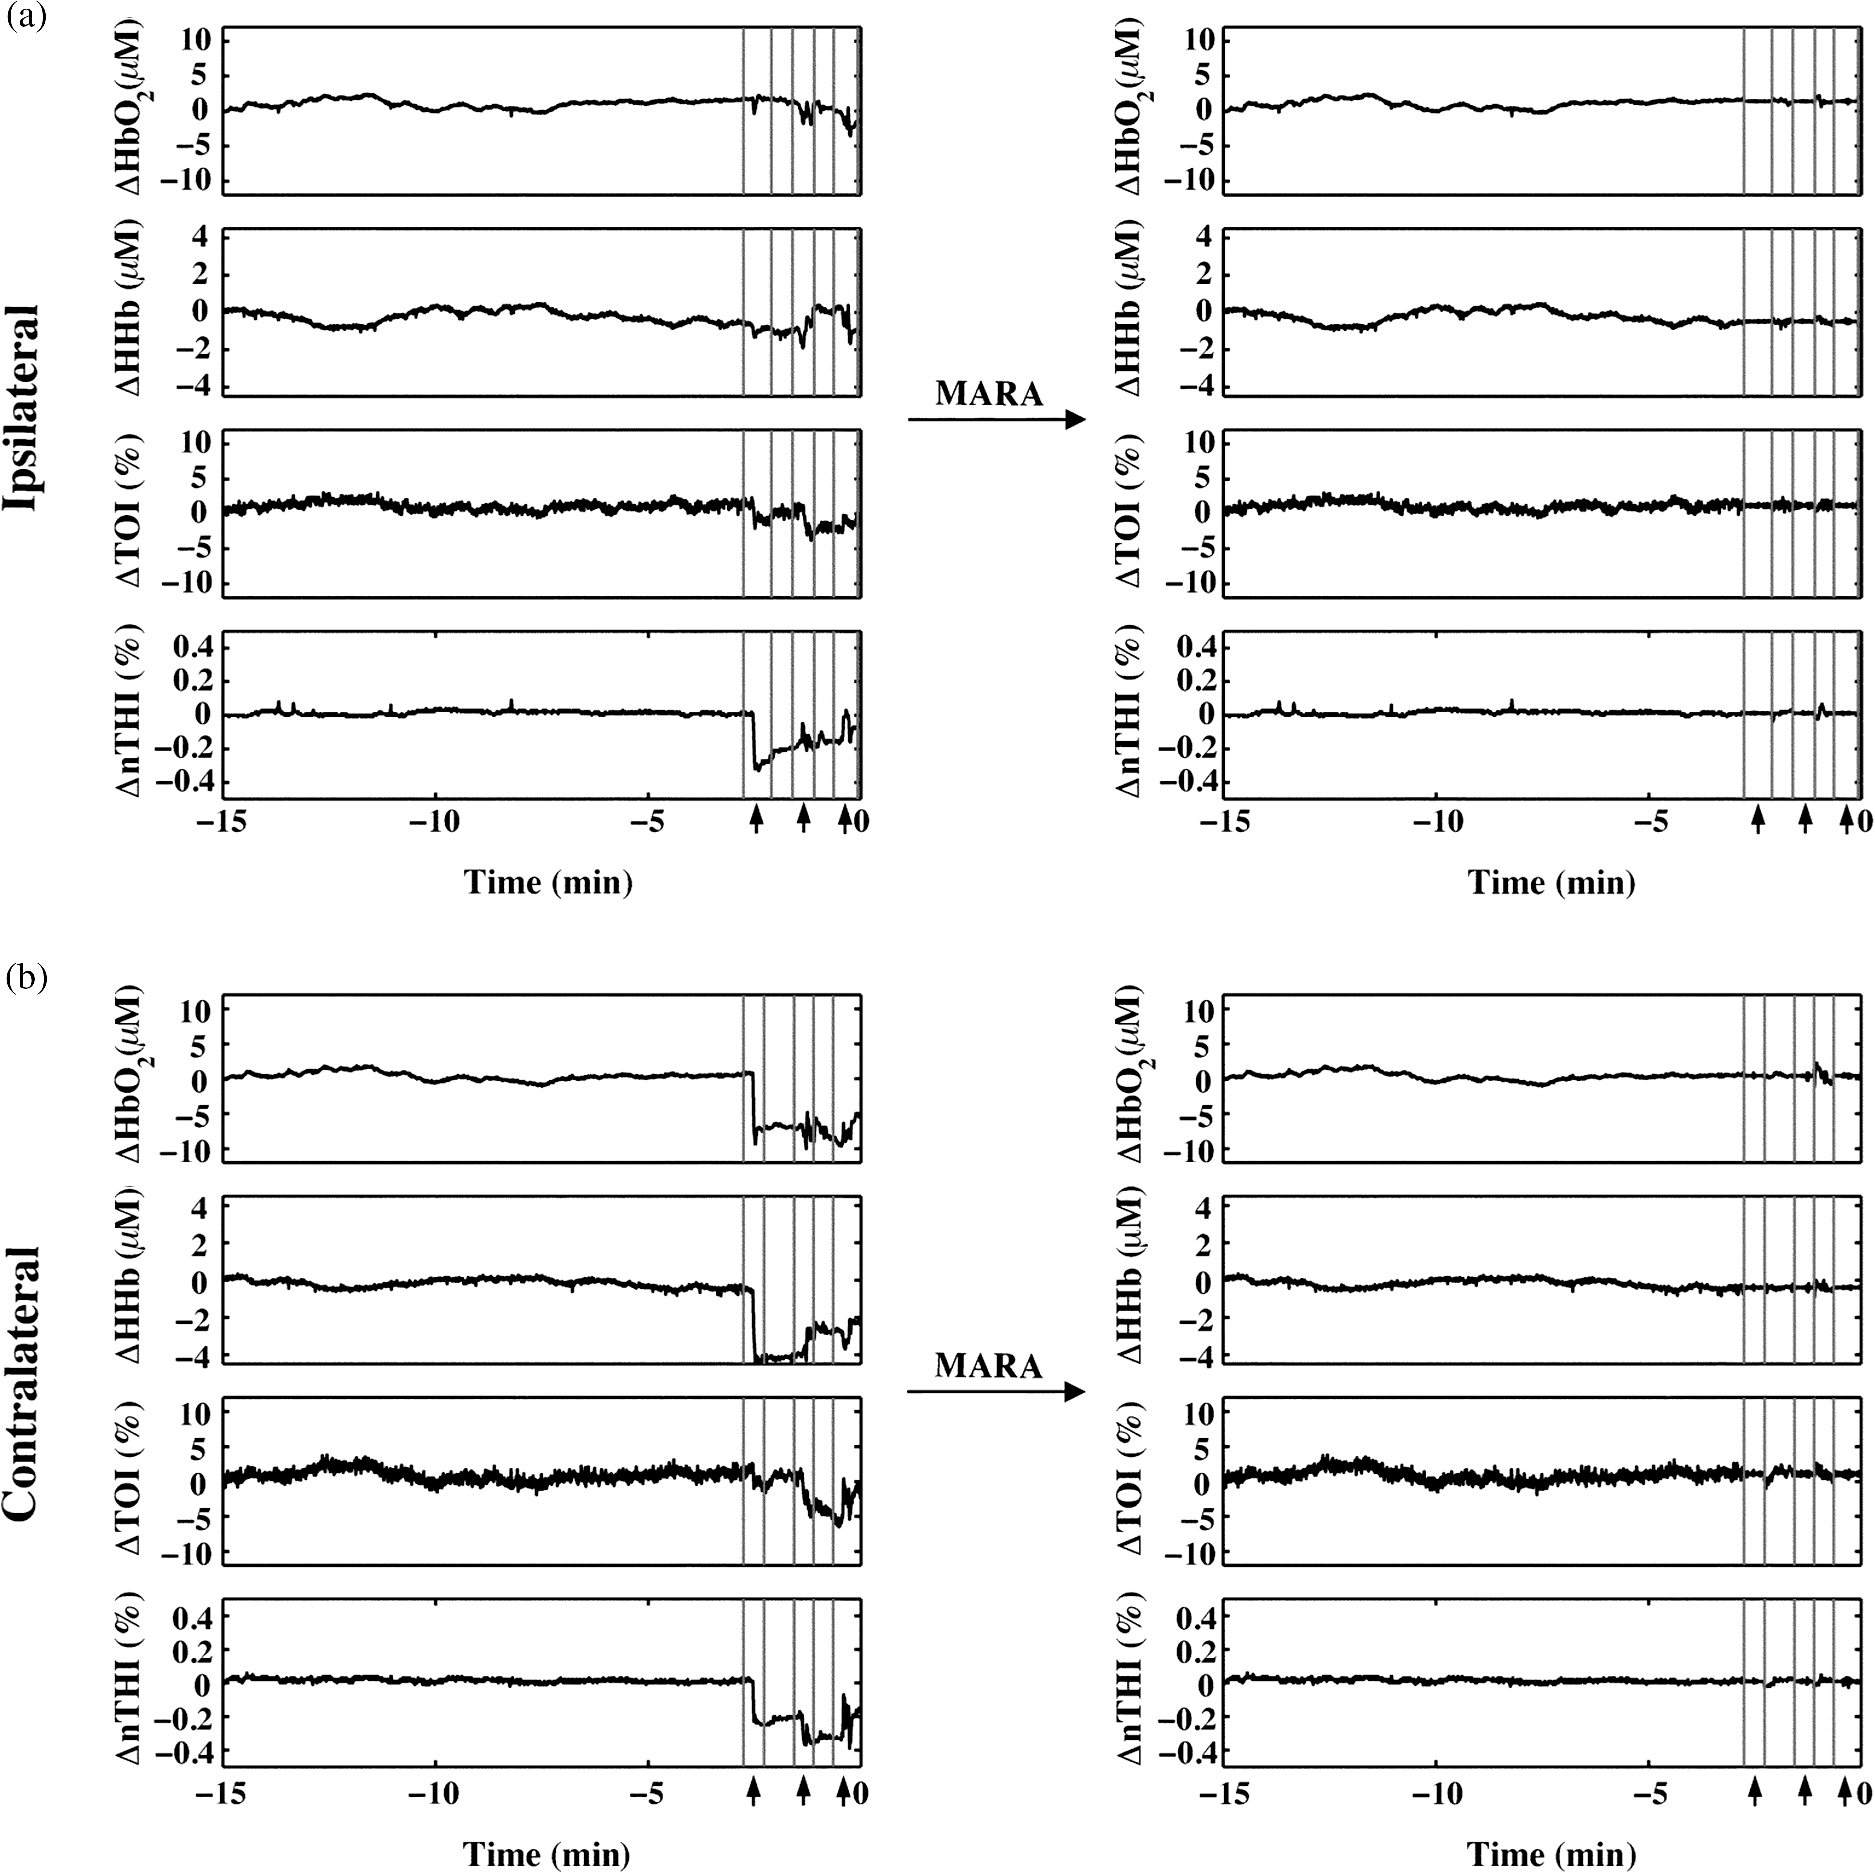 Table 3Percent change in standard deviation of NIRS measurements after the application of MARA. All values represent percent change, with positive values representing percent increase, and negative values representing a percent decrease.
The beneficial impact of MARA with these sharp artifacts was also observed in data from patient P7 (Fig. 3). The last four rapid shifts in the data were significantly reduced using MARA. However, the first segment identified as an artifact was not improved using this technique. This was likely due to the dynamic nature of the data prior to when the artifact was identified. Because the NIRS data prior to the first identified artifact segment was not stable, the average of the data obtained over a window before the artifact was not representative of the preartifact signal. Because of this, the shift could not be adequately reduced. Even so, the remaining sharp shifts in the signal were improved post-MARA, resulting in a reduction of the standard deviation over this time period across all four measures that was greatest for the and HHb measurements. Fig. 3NIRS data from patient P7 before and after the application of MARA. The vertical lines and black arrows indicate the artifacts identified using MARA. Time zero represents seizure onset. 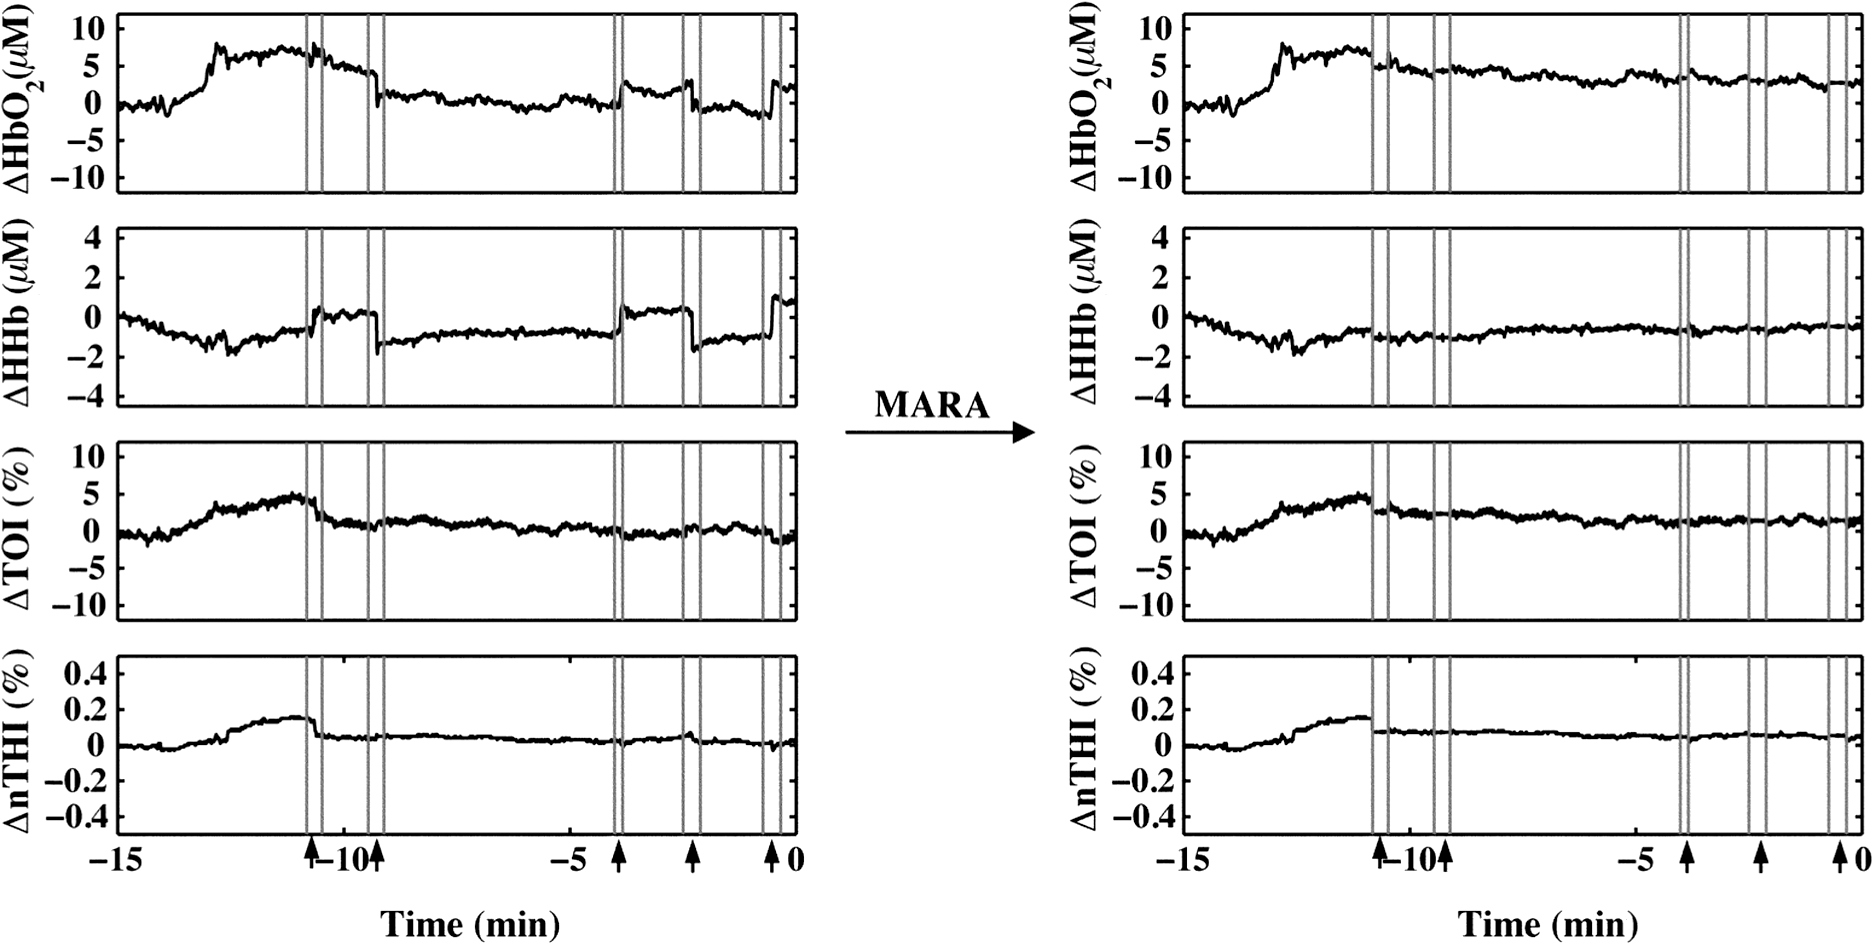 In data from patient P8, rapid shifts in the data were followed by a gradual return to baseline (Fig. 4, white arrows). Applying MARA reduced these rapid shifts; however, it resulted in a greater downward slope in the data. This is reflected by a greater standard deviation in the , HHb, and nTHI measurements that was largest for the and HHb measurements where the rapid changes were prominent. Fig. 4NIRS data from patient P8 before and after the application of MARA. The vertical lines and black arrows indicate the artifacts identified using MARA. Time zero represents seizure onset. White arrows indicate a gradual return to baseline following a sharp shift in the data. 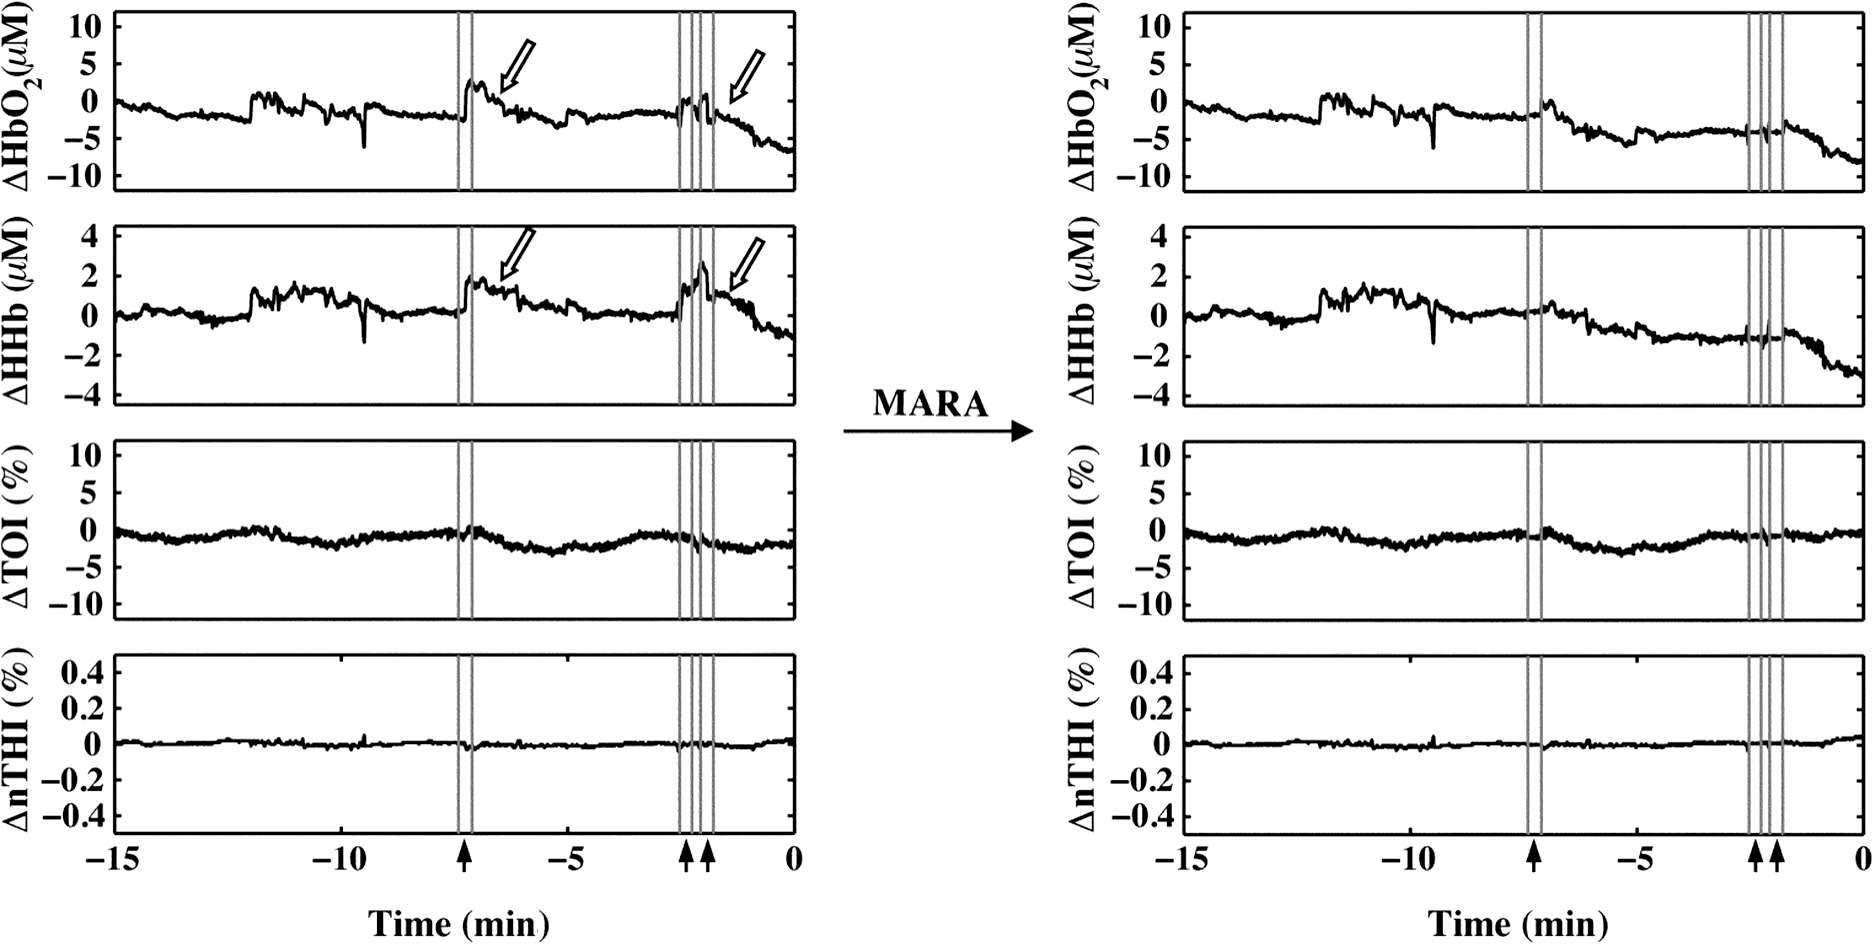 The application of MARA using information from both the HHb and nTHI measurements gave satisfactory results for all participants in the study with the exception of patient P5. Data acquired from this participant showed baseline shift artifacts in the and HHb measures. The artifacts were most easily distinguishable in the measurements. As a result, the combination of and nTHI was used to identify motion artifacts. This yielded an improved reduction of the artifacts using MARA, as shown in Fig. 5. The resulting data had a reduced standard deviation that was largest in the data where the artifacts were the most striking (Table 3). Fig. 5NIRS data from patient P5 before and after the application of MARA. The vertical lines and black arrows indicate the artifacts identified using MARA. Time zero represents seizure onset. 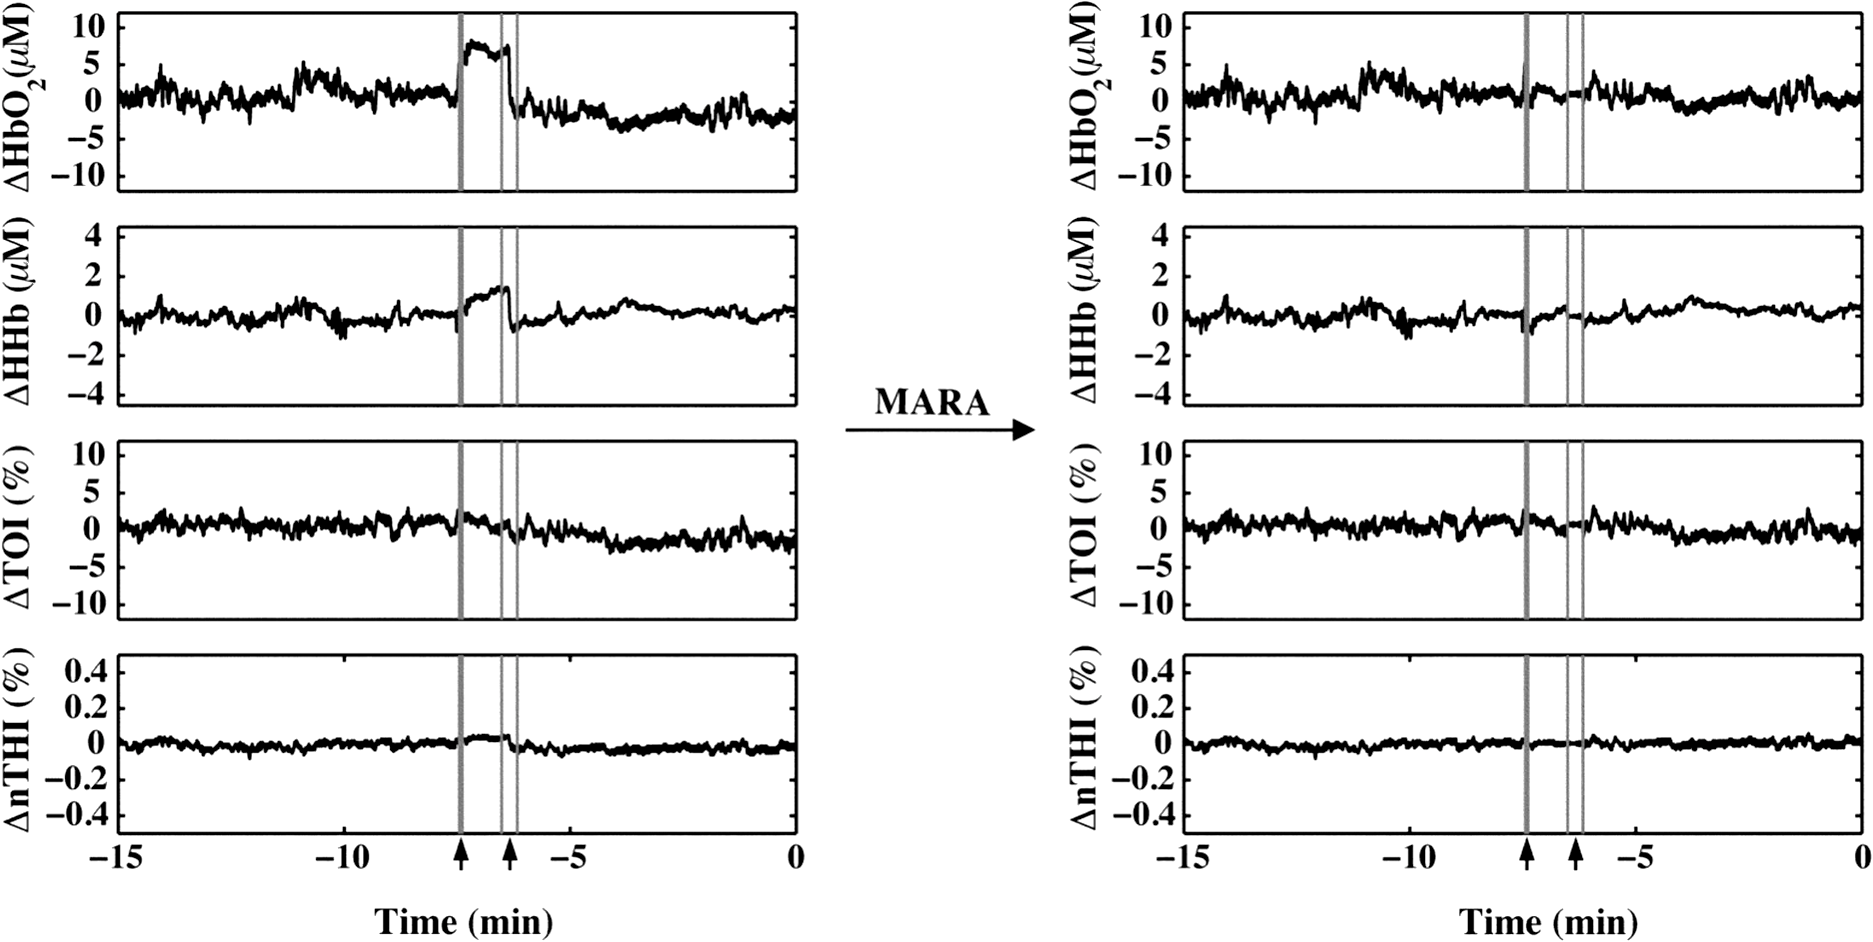 When the data prior to and after the application of MARA were compared, there was found to be a significant reduction in the difference between a 10-s average of the signal taken before and after identified artifacts post MARA (Fig. 6). This reduction was statistically significant for all four measurements (: , ; HHb: , ; TOI: , ; nTHI: , ) and demonstrates that the application of MARA significantly reduces any discrepancy between the pre- and postartifact signals such as in the case of baseline shifts. Fig. 6Difference between 10-s windows of data obtained before and after identified artifacts compared before and after the application of MARA (-axis). Values represent the absolute value of the difference between the amplitude of the data directly before and after an artifact. Error bars represent standard error of the mean.  4.DiscussionLong-term monitoring with continuous wave NIRS systems includes data that may include significant baseline shifts or other artifacts. Reduction or elimination of these artifacts with minimal operator input is needed to recover these data such that accurate monitoring of changes in chromophores can be obtained. While the nature of NIRS fluctuations is not always clear, there are instances where sharp baseline shifts occur and correspond to artifacts that can be caused by motion. To this end, we have shown that when MARA is applied to long-term monitoring data that periodically includes sustained baseline shift artifacts (e.g., P5 to P7), the standard deviation of the data was reduced by 44% on average. An example of the importance of identifying and reducing artifacts, particularly baseline shifts, can be demonstrated by the data obtained from P6 (Fig. 2), specifically data obtained contralateral to the seizure focus. If the original data were analyzed, one may incorrectly interpret the results as showing a drastic decline in , HHb, nTHI, and thus blood volume occurring approximately 2.5 min prior to seizure onset. This, however, would not be accurate as it is reflective of an artifactual baseline shift. Such large shifts may mask more subtle and real alterations in cerebral hemodynamics. It is important to note that not all artifacts are reduced in the data. For example, small shifts remain in the data of P8. This is due to a trade-off in setting the standard deviation threshold; an appropriate threshold may fail to identify small artifacts. However, it prevents the false identification of artifacts which can distort the data. In cases where contact between the probe and skin may be altered during the recording, resulting in noisier data, the creation of a method that would allow for a dynamic threshold of the standard deviation could presumably be a valuable approach to improving artifact identification. Additionally, it should be noted that MARA increased the standard deviation of the and HHb measurements for P8, resulting in a sustained downward slope in the data. Although this pattern was not commonly observed in the data, it raised the question of whether these shifts should be corrected using this technique. It is possible in this case that the artifacts that appear as rapid increases in the data are masking what should be a preictal decline in and HHb prior to seizure onset. In this case, MARA would have been successful at restoring this original trend. Alternatively, it is also possible that both the rapid shift and then the slow return to baseline are artifacts, perhaps representing the probes returning to their original position after being slightly shifted. In such a case, this technique may be creating an artifactual drift in the data. We hypothesized that the preictal state would involve slow increases or decreases in frontal tissue oxygenation or blood volume based on our previous work indicating alterations during this time.6,51 As a result, this technique of applying a sliding standard deviation to the data to identify artifacts was appropriate. Reducing large baseline shifts would allow for a more accurate characterization of more slowly varying hemodynamic changes that may precede seizures. The application of this technique may not work as well when applied to ictal data where hemodynamic alterations can be rapid and high in amplitude;2 this may result in hemodynamic changes being identified as artifacts. Moreover, increased movement associated with some seizure types may further complication artifact reduction and the recovery of ictal hemodynamics. We observed that the MARA method is useful for reducing sustained baseline shifts which are more problematic than brief spikes in the data. An example of both types of artifacts came from patient P5 where a clear motion artifact occurred at approximately 7.5 min (Fig. 1). This resulted in a high-amplitude, high-frequency artifact in the NIRS measurements. This was likely caused by a change in the contact between the optode and the participant’s forehead. This artifact affected all NIRS measurements, although not in the same way. Shortly after the data spike, a sustained baseline shift in both the and TOI measurements was observed. The artifact appeared as sharp spikes in the HHb and nTHI measurements. While transient spikes in the data are less problematic, sustained baseline shifts may impact result interpretation if they occur during a period of interest, such as prior to seizures in the case of our study. It is, therefore, necessary to be aware of these artifacts and to implement a technique to identify and reduce the artifacts prior to analysis. It has been previously shown that with continued development of NIRS equipment, such as the use of smaller optodes affixed to the scalp using collodion, improved contact between the scalp and optodes can be achieved.20 This reduces motion artifacts during data collection and improves the signal to noise ratio of the NIRS measurements.20 While this is encouraging for future NIRS systems, its utility for existing systems is limited. Optodes were affixed carefully to the skin during our study with adhesive and further kept in place by a headband; however, artifacts were occasionally observed. In such cases, the application of certain techniques after data collection is important for reducing artifacts and improving NIRS data. The application of such techniques is especially important in the case of long-term monitoring. In studies that include many short trials with many participants from populations of interest that are relatively easy to recruit, it may be easier for participants to stay still during these trials, resulting in fewer artifacts. When artifacts do occur, as there are a number of participants and several trials, the exclusion of these data does not have a large impact on the amount of data included in the analyses. In the case of certain populations and events of interest, however, such as ictal alterations in cerebral hemodynamics in patients with epilepsy, these data are difficult to acquire. Moreover, as many hours of data are collected in order to collect data during a seizure, it is more likely that patients will move during the study. Given the extra challenges associated with this data acquisition, the sample sizes are typically smaller for these studies and it is, therefore, essential to implement techniques to improve the data when artifacts are present. Our artifact reduction approach has some limitations. First, due to differences in variation of the data across participants and artifact presentation across channels, the same threshold was not appropriate for all NIRS data. Thus, the threshold applied to the sliding standard deviation was selected on a case-by-case basis. This approach avoids large artifacts being missed and too many segments of the data being erroneously identified as artifacts, which can distort the NIRS signal. This type of subjective input in motion artifact reduction for NIRS data is not limited to the MARA as it is also present in the PCA and tPCA methods where components to be removed are selected by the user,14,15 and the wavelet method, where a user-defined probability threshold is also used.17 Second, our approach to overcome the challenge of artifacts appearing to varying degrees across the four measurements and two channels by using both HHb and nTHI measures to identify artifacts within the data for each channel separately did not yield satisfactory results for one patient (P5). For these data, the replacement of the HHb measurement by the measurement to identify artifacts led to a better outcome. It is unclear why the artifacts for this participant appeared more prominently in the measurement than the HHb measurement. Additionally, we observed that when the signal before or after an identified artifact is variable, artifacts may not be properly reduced. The length of the windows used to reduce baseline shifts were altered to accommodate the sampling rate in this study and it is possible that further adjustments to these window lengths could improve this technique, although it may be challenging to find window sizes that function well across all types of data. Overall, the application of MARA to our long-term monitoring data improved the quality of the time-course data. The selection of this method was supported by previous comparisons of the PCA, MARA, wavelet, and Kalman filtering methods which were supported using MARA and wavelet approaches to reduce artifacts.18 This work provides a practical example of how the semiautomated artifact reduction method, MARA, can be applied to long-term recordings of NIRS data. Removing baseline shift artifacts from long-term recordings of NIRS data is required as they can be large in amplitude and impact data interpretation. This method is readily available and can be easily implemented including with data acquired from studies where few channels are used. We have shown that the application of this technique reduces variation within NIRS data by decreasing artifacts such as sustained baseline shifts. This technique improves data quality of NIRS by reducing artifacts and thus has the ability to greatly improve the accuracy of conclusions drawn in studies such as ours—examining cerebral hemodynamics in the epileptic preictal state. AcknowledgmentsWe would like to thank Harinder Dhaliwal and Erica Westwood for their assistance with data collection. We would also like to acknowledge the members of the Calgary Epilepsy Program at the Foothills Medical Centre for their assistance with this project. This research was funded by the Canadian Institutes of Health Research (MOP 230809) and S. V. was funded by a Savoy Foundation Studentship Award. ReferencesP. D. Adelson et al.,
“Noninvasive continuous monitoring of cerebral oxygenation periictally using near-infrared spectroscopy: a preliminary report,”
Epilepsia, 40
(11), 1484
–1489
(1999). http://dx.doi.org/10.1111/epi.1999.40.issue-11 EPILAK 0013-9580 Google Scholar
D. K. Nguyen et al.,
“Non-invasive continuous EEG-fNIRS recording of temporal lobe seizures,”
Epilepsy Res., 99
(1–2), 112
–126
(2012). http://dx.doi.org/10.1016/j.eplepsyres.2011.10.035 EPIRE8 0920-1211 Google Scholar
D. K. Nguyen et al.,
“Noninvasive continuous functional near-infrared spectroscopy combined with electroencephalography recording of frontal lobe seizures,”
Epilepsia, 54
(2), 331
–340
(2013). http://dx.doi.org/10.1111/epi.2013.54.issue-2 EPILAK 0013-9580 Google Scholar
N. Roche-Labarbe et al.,
“NIRS-measured oxy- and deoxyhemoglobin changes associated with EEG spike-and-wave discharges in children,”
Epilepsia, 49
(11), 1871
–1880
(2008). http://dx.doi.org/10.1111/epi.2008.49.issue-11 EPILAK 0013-9580 Google Scholar
M. Seyal,
“Frontal hemodynamic changes precede EEG onset of temporal lobe seizures,”
Clin. Neurophysiol., 125
(3), 442
–448
(2014). http://dx.doi.org/10.1016/j.clinph.2013.09.003 CNEUFU 1388-2457 Google Scholar
E. Slone et al.,
“Near-infrared spectroscopy shows preictal haemodynamic changes in temporal lobe epilepsy,”
Epileptic Disord., 14
(4), 371
–378
(2012). http://dx.doi.org/10.1684/epd.2012.0535 1294-9361 Google Scholar
D. K. Sokol et al.,
“Near infrared spectroscopy (NIRS) distinguishes seizure types,”
Seizure, 9
(5), 323
–327
(2000). http://dx.doi.org/10.1053/seiz.2000.0406 SEIZE7 1059-1311 Google Scholar
B. J. Steinhoff, G. Herrendorf and C. Kurth,
“Ictal near infrared spectroscopy in temporal lobe epilepsy: a pilot study,”
Seizure, 5
(2), 97
–101
(1996). http://dx.doi.org/10.1016/S1059-1311(96)80101-4 SEIZE7 1059-1311 Google Scholar
E. Watanabe, Y. Nagahori and Y. Mayanagi,
“Focus diagnosis of epilepsy using near-infrared spectroscopy,”
Epilepsia, 43
(s9), 50
–55
(2002). http://dx.doi.org/10.1046/j.1528-1157.43.s.9.12.x EPILAK 0013-9580 Google Scholar
J. Virtanen et al.,
“Accelerometer-based method for correcting signal baseline changes caused by motion artifacts in medical near-infrared spectroscopy,”
J. Biomed. Opt., 16
(8), 087005
(2011). http://dx.doi.org/10.1117/1.3606576 JBOPFO 1083-3668 Google Scholar
X. Cui, S. Bray and A. L. Reiss,
“Functional near infrared spectroscopy (NIRS) signal improvement based on negative correlation between oxygenated and deoxygenated hemoglobin dynamics,”
NeuroImage, 49
(4), 3039
–3046
(2010). http://dx.doi.org/10.1016/j.neuroimage.2009.11.050 NEIMEF 1053-8119 Google Scholar
F. Scholkmann et al.,
“How to detect and reduce movement artifacts in near-infrared imaging using moving standard deviation and spline interpolation,”
Physiol. Meas., 31
(5), 649
–662
(2010). http://dx.doi.org/10.1088/0967-3334/31/5/004 PMEAE3 0967-3334 Google Scholar
T. J. Huppert et al.,
“HomER: a review of time-series analysis methods for near-infrared spectroscopy of the brain,”
Appl. Opt., 48 D280
–D298
(2009). http://dx.doi.org/10.1364/AO.48.00D280 APOPAI 1559-128X Google Scholar
Y. Zhang et al.,
“Eigenvector-based spatial filtering for reduction of physiological interference in diffuse optical imaging,”
J. Biomed. Opt., 10
(1), 011014
(2005). http://dx.doi.org/10.1117/1.1852552 JBOPFO 1083-3668 Google Scholar
M. A. Yücel et al.,
“Targeted principle component analysis: a new motion artifact correction approach for near-infrared spectroscopy,”
J. Innov. Opt Health Sci., 7
(2), 1350066
(2014). http://dx.doi.org/10.1142/S1793545813500661 JIOHAA 1793-7205 Google Scholar
M. Izzetoglu et al.,
“Motion artifact cancellation in NIR spectroscopy using discrete Kalman filtering,”
Biomed. Eng. Online, 9
(1), 16
–31
(2010). http://dx.doi.org/10.1186/1475-925X-9-16 1475-925X Google Scholar
B. Molavi and G. A. Dumont,
“Wavelet-based motion artifact removal for functional near-infrared spectroscopy,”
Physiol. Meas., 33
(2), 259
–270
(2012). http://dx.doi.org/10.1088/0967-3334/33/2/259 PMEAE3 0967-3334 Google Scholar
R. J. Cooper et al.,
“A systematic comparison of motion artifact correction techniques for functional near-infrared spectroscopy,”
Front. Neurosci., 6 1
–10
(2012). http://dx.doi.org/10.3389/fnins.2012.00147 FCNEEG 0887-3658 Google Scholar
S. Brigadoi et al.,
“Motion artifacts in functional near-infrared spectroscopy: a comparison of motion correction techniques applied to real cognitive data,”
NeuroImage, 85 181
–191
(2014). http://dx.doi.org/10.1016/j.neuroimage.2013.04.082 NEIMEF 1053-8119 Google Scholar
M. A. Yücel et al.,
“Reducing motion artifacts for long-term clinical NIRS monitoring using collodion-fixed prism-based optical fibers,”
NeuroImage, 85 192
–201
(2014). http://dx.doi.org/10.1016/j.neuroimage.2013.06.054 NEIMEF 1053-8119 Google Scholar
W. Van Paesschen et al.,
“SPECT perfusion changes during complex partial seizures in patients with hippocampal sclerosis,”
Brain, 126
(5), 1103
–1111
(2003). http://dx.doi.org/10.1093/brain/awg108 BRAIAK 0006-8950 Google Scholar
G. Bale et al.,
“A new broadband near-infrared spectroscopy system for in-vivo measurements of cerebral cytochrome-c-oxidase changes in neonatal brain injury,”
Biomed. Opt. Express, 5
(10), 3450
–3466
(2014). http://dx.doi.org/10.1364/BOE.5.003450 BOEICL 2156-7085 Google Scholar
J. W. Barker, A. Aarabi and T. J. Huppert,
“Autoregressive model based algorithm for correcting motion and serially correlated errors in fNIRS,”
Biomed. Opt. Express, 4
(8), 1366
–1379
(2013). http://dx.doi.org/10.1364/BOE.4.001366 BOEICL 2156-7085 Google Scholar
N. Hemmati Berivanlou, S. K. Setarehdan and H. Ahmadi Noubari,
“Evoked hemodynamic response estimation using ensemble empirical mode decomposition based adaptive algorithm applied to dual channel functional near infrared spectroscopy (fNIRS),”
J. Neurosci. Methods, 224 13
–25
(2014). http://dx.doi.org/10.1016/j.jneumeth.2013.12.007 JNMEDT 0165-0270 Google Scholar
R. Beurskens et al.,
“Age-related changes in prefrontal activity during walking in dual-task situations: a fNIRS study,”
Int. J. Psychophysiol., 92
(3), 122
–128
(2014). http://dx.doi.org/10.1016/j.ijpsycho.2014.03.005 IJPSEE 0167-8760 Google Scholar
M. Biallas et al.,
“How to conduct studies with neonates combining near-infrared imaging and electroencephalography,”
Adv. Exp. Med. Biol., 737 111
–117
(2012). http://dx.doi.org/10.1007/978-1-4614-1566-4 AEMBAP 0065-2598 Google Scholar
G. Derosière et al.,
“Towards a near infrared spectroscopy-based estimation of operator attentional state,”
PLoS One, 9
(3), e92045
(2014). http://dx.doi.org/10.1371/journal.pone.0092045 1932-6203 Google Scholar
L. Dommer et al.,
“Between-brain coherence during joint n-back task performance: a two-person functional near-infrared spectroscopy study,”
Behav. Brain Res., 234
(2), 212
–222
(2012). http://dx.doi.org/10.1016/j.bbr.2012.06.024 BBREDI 0166-4328 Google Scholar
W. K. Kirchner,
“Age differences in short-term retention of rapidly changing information,”
J. Exp. Psych., 55
(4), 352
–358
(1958). http://dx.doi.org/10.1037/h0043688 JEPSAK 0022-1031 Google Scholar
S. M. Jaeggi et al.,
“Improving fluid intelligence with training on working memory,”
Proc. Natl. Acad. Sci. U. S. A., 105
(19), 6829
–6833
(2008). http://dx.doi.org/10.1073/pnas.0801268105 PNASA6 0027-8424 Google Scholar
S. M. Jaeggi et al.,
“Does excessive memory load attenuate activation in the prefrontal cortex? Load-dependent processing in single and dual tasks: functional magnetic resonance imaging study,”
NeuroImage, 19
(2), 210
–225
(2003). http://dx.doi.org/10.1016/S1053-8119(03)00098-3 NEIMEF 1053-8119 Google Scholar
Q. Han et al.,
“Wavelet coherence analysis of prefrontal tissue oxyhaemoglobin signals as measured using near-infrared spectroscopy in elderly subjects with cerebral infarction,”
Microvasc. Res., 95 108
–115
(2014). http://dx.doi.org/10.1016/j.mvr.2014.08.001 MIVRA6 0026-2862 Google Scholar
L. Holper et al.,
“Trial-to-trial variability differentiates motor imagery during observation between low versus high responders: a functional near-infrared spectroscopy study,”
Behav. Brain Res., 229
(1), 29
–40
(2012). http://dx.doi.org/10.1016/j.bbr.2011.12.038 BBREDI 0166-4328 Google Scholar
N. Kobashi et al.,
“Enhancement of motor imagery-related cortical activation during first-person observation measured by functional near-infrared spectroscopy,”
Eur. J. Neurosci., 35
(9), 1513
–1521
(2012). http://dx.doi.org/10.1111/ejn.2012.35.issue-9 EJONEI 0953-816X Google Scholar
L. Holper et al.,
“Extension of mental preparation positively affects motor imagery as compared to motor execution: a functional near-infrared spectroscopy study,”
Cortex, 48
(5), 593
–603
(2012). http://dx.doi.org/10.1016/j.cortex.2011.02.001 0010-9452 Google Scholar
L. Holper, F. Scholkmann and M. Wolf,
“Between-brain connectivity during imitation measured by fNIRS,”
NeuroImage, 63
(1), 212
–222
(2012). http://dx.doi.org/10.1016/j.neuroimage.2012.06.028 NEIMEF 1053-8119 Google Scholar
L. Holper, F. Scholkmann and M. Wolf,
“The relationship between sympathetic nervous activity and cerebral hemodynamics and oxygenation: a study using skin conductance measurement and functional near-infrared spectroscopy,”
Behav. Brain Res., 270 95
–107
(2014). http://dx.doi.org/10.1016/j.bbr.2014.04.056 BBREDI 0166-4328 Google Scholar
S. Sternberg,
“Memory-scanning: mental processes revealed by reaction-time experiments,”
Am. Sci., 57
(4), 421
–457
(1969). AMSCAC 0003-0996 Google Scholar
C. W. Lejuez et al.,
“Evaluation of a behavioral measure of risk taking: the balloon analogue risk task (BART),”
J. Exp. Psych. Appl., 8
(2), 75
–84
(2002). http://dx.doi.org/10.1037/1076-898X.8.2.75 1076-898X Google Scholar
L. Holper et al.,
“Physiological effects of mechanical pain stimulation at the lower back measured by functional near-infrared spectroscopy and capnography,”
J. Integr. Neurosci., 13
(1), 121
–142
(2014). http://dx.doi.org/10.1142/S0219635214500071 0219-6352 Google Scholar
C. Rummel et al.,
“Monitoring cerebral oxygenation during balloon occlusion with multichannel NIRS,”
J. Cereb. Blood Flow Metab., 34
(2), 347
–356
(2014). http://dx.doi.org/10.1038/jcbfm.2013.207 JCBMDN 0271-678X Google Scholar
F. Scholkmann et al.,
“End-tidal : an important parameter for a correct interpretation in functional brain studies using speech tasks,”
NeuroImage, 66 71
–79
(2013). http://dx.doi.org/10.1016/j.neuroimage.2012.10.025 NEIMEF 1053-8119 Google Scholar
F. Scholkmann, M. Wolf and U. Wolf,
“The effect of inner speech on arterial and cerebral hemodynamics and oxygenation: a functional NIRS study,”
Adv. Exp. Med. Biol., 789 81
–87
(2013). http://dx.doi.org/10.1007/978-1-4614-7411-1 AEMBAP 0065-2598 Google Scholar
F. Scholkmann et al.,
“Cerebral hemodynamic and oxygenation changes induced by inner and heard speech: a study combining functional near-infrared spectroscopy and capnography,”
J. Biomed. Opt., 19
(1), 017002
(2014). http://dx.doi.org/10.1117/1.JBO.19.1.017002 JBOPFO 1083-3668 Google Scholar
S. Spichtig et al.,
“Assessment of intermittent UMTS electromagnetic field effects on blood circulation in the human auditory region using a near-infrared system,”
Bioelectromagnetics, 33
(1), 40
–54
(2012). http://dx.doi.org/10.1002/bem.v33.1 BLCTDO 0197-8462 Google Scholar
S. Spichtig et al.,
“Assessment of potential short-term effects of intermittent UMTS electromagnetic fields on blood circulation in an exploratory study, using near-infrared imaging,”
Adv. Exp. Med. Biol., 737 83
–88
(2012). http://dx.doi.org/10.1007/978-1-4614-1566-4 AEMBAP 0065-2598 Google Scholar
U. Wolf et al.,
“Changes in hemodynamics and tissue oxygenation saturation in the brain and skeletal muscle induced by speech therapy–a near-infrared spectroscopy study,”
Sci. World J., 11 1206
–1215
(2011). http://dx.doi.org/10.1100/tsw.2011.116 1597-6343 Google Scholar
F. Scholkmann and M. Wolf,
“General equation for the differential pathlength factor of the frontal human head depending on wavelength and age,”
J. Biomed. Opt., 18
(10), 105004
(2013). http://dx.doi.org/10.1117/1.JBO.18.10.105004 JBOPFO 1083-3668 Google Scholar
S. Suzuki et al.,
“A tissue oxygenation monitor using NIR spatially resolved spectroscopy,”
Proc. SPIE, 3597 582
(1999). http://dx.doi.org/10.1117/12.356862 PSISDG 0277-786X Google Scholar
C. Baumgartner et al.,
“Preictal SPECT in temporal lobe epilepsy: regional cerebral blood flow is increased prior to electroencephalography-seizure onset,”
J. Nucl. Med., 39
(6), 978
–982
(1998). JNMEAQ 0161-5505 Google Scholar
P. Federico et al.,
“Functional MRI of the pre-ictal state,”
Brain, 128
(8), 1811
–1817
(2005). http://dx.doi.org/10.1093/brain/awh533 BRAIAK 0006-8950 Google Scholar
M. E. Weinand et al.,
“Cerebral blood flow and temporal lobe epileptogenicity,”
J. Neurosurg., 86
(2), 226
–232
(1997). http://dx.doi.org/10.3171/jns.1997.86.2.0226 JONSAC 0022-3085 Google Scholar
BiographySarah A. Vinette is a research assistant at the University of Calgary. She received her MSc degree in neuroscience from the University of Calgary in 2014 and a combined Honours BSc degree in neuroscience and mathematics at Dalhousie University in 2011. Jeff F. Dunn is a specialist MRI and near-infrared spectroscopy biomedical applications. Much of the work is in brain, regulation of oxygenation and the impact of hypoxia on brain health. He is the director of the Experimental Imaging Centre at the University of Calgary, which houses a 9.4T MRI and undertakes a range of preclinical and patient-oriented medical studies. To date he has 140 publications. Edward Slone is a doctoral candidate in the Department of Psychology at the University of Calgary. His research interests include the neural mechanisms of spatial orientation and navigation, and the impact of the built environment on cognition, behavior, and the brain. Some of the data sets in the current study were collected as part of his master’s research. Paolo Federico is a neurologist and epileptologist whose research program focuses on imaging and advanced EEG methods in epilepsy. He has received funding from Canadian Institutes of Health Research, Alberta Heritage Foundation for Medical Research, American Epilepsy Foundation, Savoy Foundation for Epilepsy, and Epilepsy Canada. |


