|
|
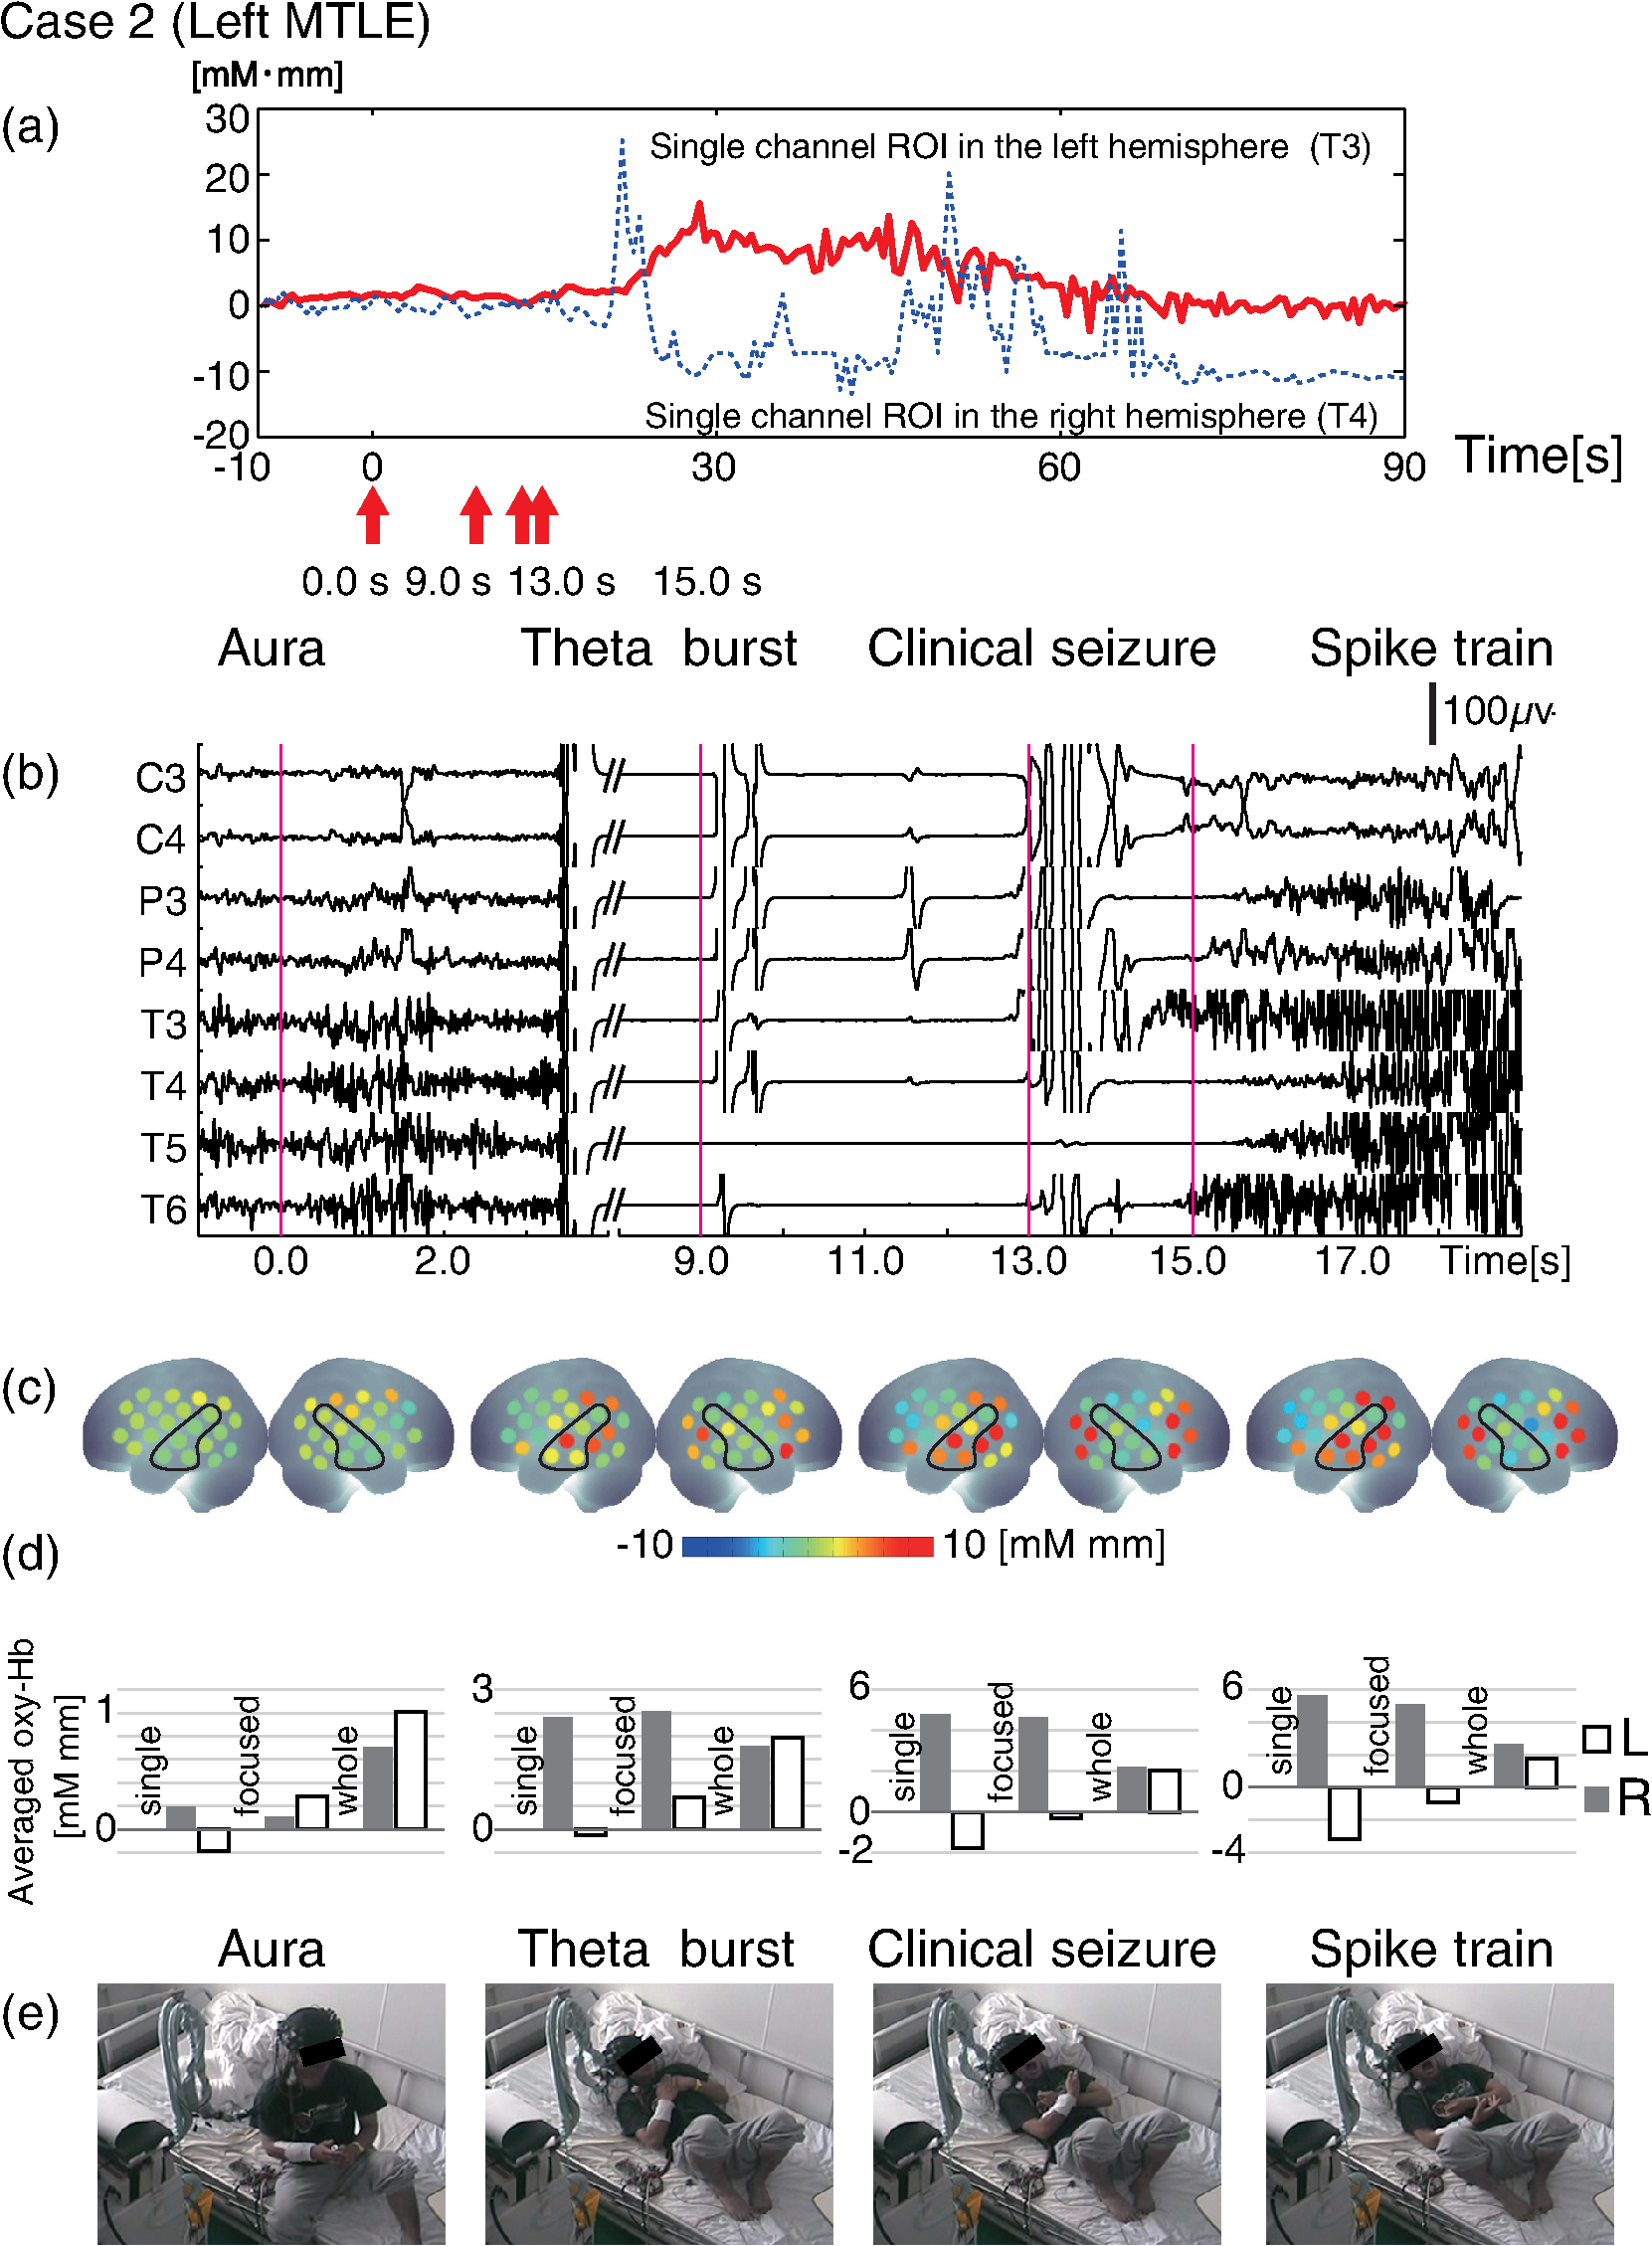
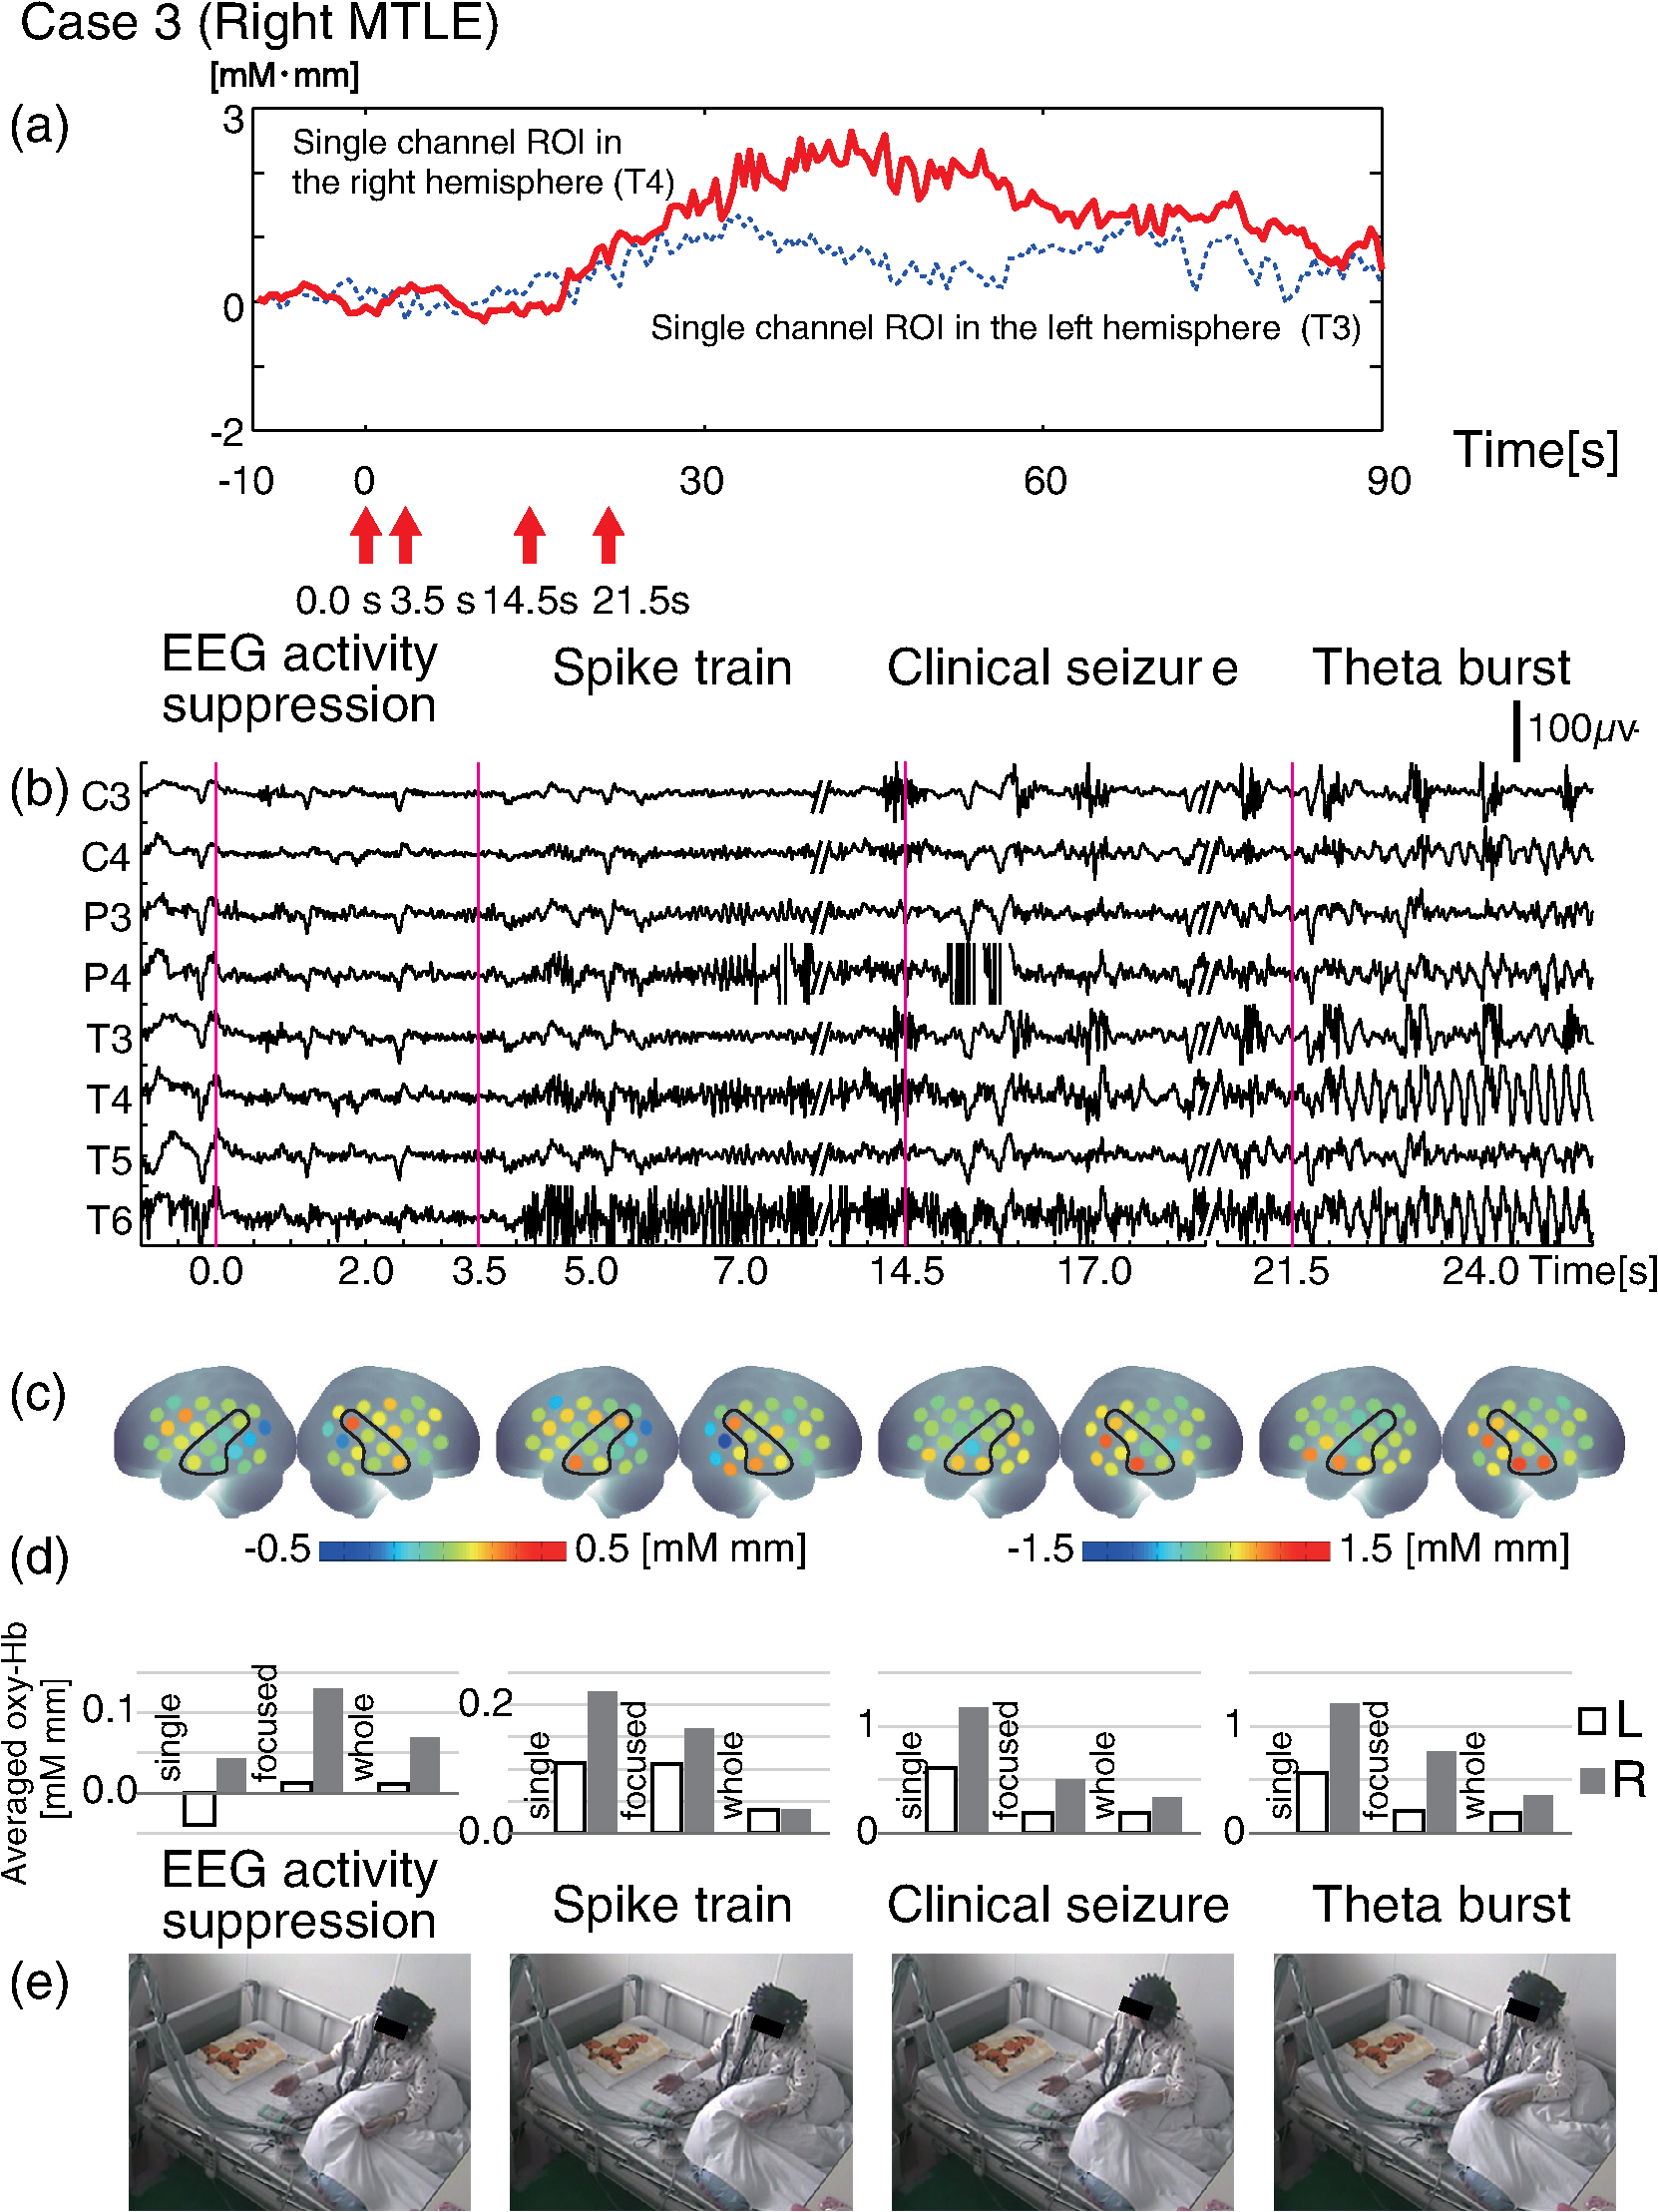
1.IntroductionThe localization and delineation of the epileptogenic zone is a fundamental step in the presurgical evaluation of patients with pharmacoresistant focal epilepsy.1 Presurgical evaluation is meant to localize the epileptogenic zone with a minimum risk of adverse effects, preferably with noninvasive methods.2 Thus far, presurgical evaluation using electroencephalogram (EEG), single-photon emission computed tomography (SPECT), or functional magnetic resonance imaging (fMRI) has been clinically applied with moderate success.3–5 In particular, a scalp EEG, which measures the voltage differences of electrophysiological activities of the brain, is a completely noninvasive method that is essential and critical for the clinical diagnosis of epilepsy.6 The cortical area that generates interictal spikes with scalp EEG monitoring is known as the irritative zone. EEG-recorded interictal spikes are often spatially diffused and do not coincide with the seizure onset area, the resection of which could lead to the elimination of the patient’s seizures. Meanwhile, the seizure onset zone refers to the area of the cortex from which clinical seizures are actually generated. Thus, this is the very cortical zone that we need to confirm clearly in a presurgical evaluation of epilepsy. There are several imaging modalities that can be used to observe ictal hemodynamic changes involved in epileptic seizures. Currently, the most commonly used imaging modality for functional seizure localization is ictal SPECT.7–11 However, since SPECT only allows detection of accumulated hemodynamic changes over a relatively long period of measurement, it may not always provide sufficient temporal resolution to distinguish ipsilateral hemodynamic changes reflecting epileptic seizure onset and contralateral changes representing patterns of seizure propagation.12–15 Ictal positron emission tomography (PET) measurement is also used for functional seizure localization, but it entails the same problem as ictal SPECT, and quantitative PET measurements of ictal regional cerebral blood flow (rCBF) associated with a seizure are not less difficult to achieve.7 Focal ictal EEG/fMRI studies are sometimes performed.16,17 Due to movement constraints and the unpredictability of ictal events during fMRI measurement of up to 2 h, EEG/fMRI studies generally focus on the detection of interictal spikes.18 However, seizures are generally short in duration and difficult to predict, making it impractical to keep patients in an fMRI scanner for a sufficient period of time. In addition, the risk of seizure evolution and generalization within the scanner environment should be taken into consideration.9 Moreover, seizures may entail a substantial degree of head and body motion, which can make the interpretation of fMRI data extremely difficult.9 Consequently, fMRI examination is technically limited to patients with very frequent seizures who retain consciousness and whose motor symptoms are not severe.3,19 Because of such constraints, clinical applications of fMRI in the diagnosis of epileptic seizures remain relatively unexplored. An additional promising method is the use of functional near-infrared spectroscopy (fNIRS). fNIRS has several merits with regard to epileptic focus diagnosis: it is safe, compact, and cost effective.2 Its relative insensitivity to body movements allows continuous bedside monitoring of epileptic patients in a manner less restrictive than that of other modalities. In addition, fNIRS uses combinations of illuminating and detecting probes sparsely set over the scalp, allowing room to place EEG electrodes for simultaneous monitoring.20,21 Simultaneous fNIRS/EEG monitoring can offer complementary functional information on the cortical state, or a combination of cerebral hemodynamics and electrophysiological activity, which would reflect different aspects of the cortical process associated with epileptic activity. In epilepsy, it is assumed that neuronal activity increases during epileptic seizures. This leads to increased metabolism and rCBF.20,22,23 The cortical and subcortical rCBF changes during seizures would first be observed as hyperperfusion in the epileptic zone, which rapidly extends to other regions as the seizure spreads and is generalized.12 Such hemodynamic processes can be observed using fNIRS.2 The first attempt to apply fNIRS to epileptic monitoring utilized a combination of a single-channel fNIRS and a 32-channel scalp EEG. This was applied for the presurgical evaluation of two patients with mesial temporal lobe epilepsy.2 Subsequently, fNIRS diagnosis was extended to different types of epilepsy including status epilepticus24 and photosensitive temporal epilepsy,25 as well as to peri-ictal monitoring.26 Most of these early studies employed a limited number of channels,2,26–28 but this limitation may lead to a failure to localize the epileptogenic zone because an insufficient channel arrangement cannot distinguish epileptic activity in the epileptogenic zone from that in spread and generalized regions.29 This problem may be circumvented by the use of multichannel fNIRS, which can cover relatively wide regions of the lateral cortical surface. Multichannel fNIRS was first applied to determine the focus of epilepsy in intractable partial epileptic patients in whom seizures were stimulated by bemegride injection. Concordant with epileptogenic focus, this experiment revealed a regional increase of oxy-Hb signal in most of the subjects.22 In addition, a small study using multichannel fNIRS in children reported an increase of hemodynamic signal in the frontal cortex associated with convulsive seizures, and a decrease with the absence of seizures.27 In recent years, the progress of fNIRS/EEG monitoring of epilepsy has accelerated. An elaborate replication study on temporal lobe epilepsy monitoring has been reported by a Canadian group.23 They have further explored multichannel fNIRS/EEG monitoring for frontal-lobe epilepsy monitoring30 and interictal eplieptiform discharge assessment using a general linear model.20 Moreover, they assessed the nonlinearity of hemodynamic response associated with refractory focal epilepsy using fNIRS-EEG and fMRI-EEG.31 Although these pioneering studies suggested the potential of fNIRS/EEG measurements for epileptic focus diagnosis, several issues need to be clarified before it can be routinely applied in a clinical setting for the presurgical determination of the epileptic focus side of mesial temporal lobe epilepsy (MTLE) before an amygdalo-hippocampectomy. MTLE is described as a condition characterized by recurrent and unprovoked seizures that originate in the limbic areas of the mesial temporal lobe, particularly in the hippocampus and amygdala. It is frequently resistant to anti-epileptic drug treatment, and hippocampal sclerosis is considered its pathophysiological substrate.32 Early surgical treatment, or hippocampal resection, for pharmacoresistant epilepsy has proven to be helpful in achieving seizure control and is superior to pharmacotherapy for MTLE with respect to seizure outcome.33 For identifying the epileptogenic zone in patients during presurgical evaluation, a variety of drugs, including bemegride,22 have been used to induce its activation. However, use of seizure-inducing drugs may result in nonspecific responses that could prevent detection of the epileptogenic zone or lead to false localization.34 When traditional noninvasive methods including MRI fail to detect a lesion or dysplasia, one must employ invasive intracranial electrode examinations that may entail the risk of infection and hemorrhage.35 To avoid mislocalization, Nguyen et al.23 attempted fNIRS/EEG measurement for up to 2 h to detect spontaneous seizures in nine MTLE patients, and succeeded in recording complex partial seizures in three patients. Among these, lateralization determination failed in one patient. Conversely, in the more frequent frontal-lobe epilepsy, data acquisition during spontaneous seizure was successful for 9 out of 11 patients.23 These results suggest the difficulty of data acquisition and successful detection of lateralization in MTLE presurgical diagnosis. Given all of the above, it is still necessary to accrue experimental evidence in order to establish an objective, noninvasive means of detecting the seizure onset zone. In the case of MLTE, we have a reasonable expectation that a noninvasive modality would be useful in determining the epileptic focus side. Thus, we applied a long-term, bedside fNIRS/EEG monitoring system with video recording for 8–16 h per day for 4 days. Such long-term monitoring is virtually impossible in the restrictive environment of an fMRI, and can best be realized using fNIRS. We measured the signal changes of oxygenated hemoglobin (oxy-Hb) after time points corresponding to specific seizure characteristics determined by electrophysiological activities or clinical symptoms. By comparing the signal strength in both hemispheres, we sought to determine the laterality of seizure focus with fNIRS measurements. We subsequently compared the estimated laterality to the true laterality, which was ultimately determined by the relief of seizures with an amygdalo-hippocampectomy. Our results revealed that the fNIRS measurements could serve as a reasonable adjunct to the presurgical diagnosis of epileptic focus side in MTLE patients. 2.Methods2.1.SubjectsThis study included six MTLE patients (2 males and 4 females; mean age 30; range, 20–55 years; all right handed) who were candidates for epilepsy surgery and who underwent long-term (8–16 h) fNIRS/EEG monitoring with video recording as part of their presurgical evaluation in the Neurosurgery Department of Jichi Medical University Hospital, Japan. Written consent was obtained from all patients and the study was approved by the Jichi Medical University ethics committee. We successfully recorded seizures in four patients (1 male and 3 females, mean age 32, range 21–55 years old). 2.2.Simultaneous fNIRS/EEG MonitoringAntiepileptic drugs were cautiously tapered to increase the possibility of seizures. Simultaneous fNIRS/EEG monitoring with video recording was done in each patient’s quiet room for 8–16 h per day for up to 4 days or until seizures occurred. During recording, patients did not perform any tasks beyond lying or sitting on the bed. All recorded seizures were spontaneous [Fig. 1(a)]. Fig. 1Experimental setup and placement of fNIRS probes with EEG electrodes. (a) Experimental set up. Long-term simultaneous fNIRS/EEG recording was performed in the patient’s room. Patients did not perform any tasks while sitting or lying on the bed. All patient activity was monitored by video. (b) Eighteen EEG electrodes were placed based on 10–20 international systems. The channels covering the focused area are indicated in the figure. Additionally, in this study we used a multichannel probe holder ( probes) so each hemisphere had 22 fNIRS channels. (c) Regions of interest (ROI). The single-channel ROI is indicated with a dark gray circle, the focused area (STG and MTG) is indicated with dark and light gray circles, and the whole-hemisphere area is indicated with white, light gray, and dark gray circles. Black circles indicate samples of EEG channels. 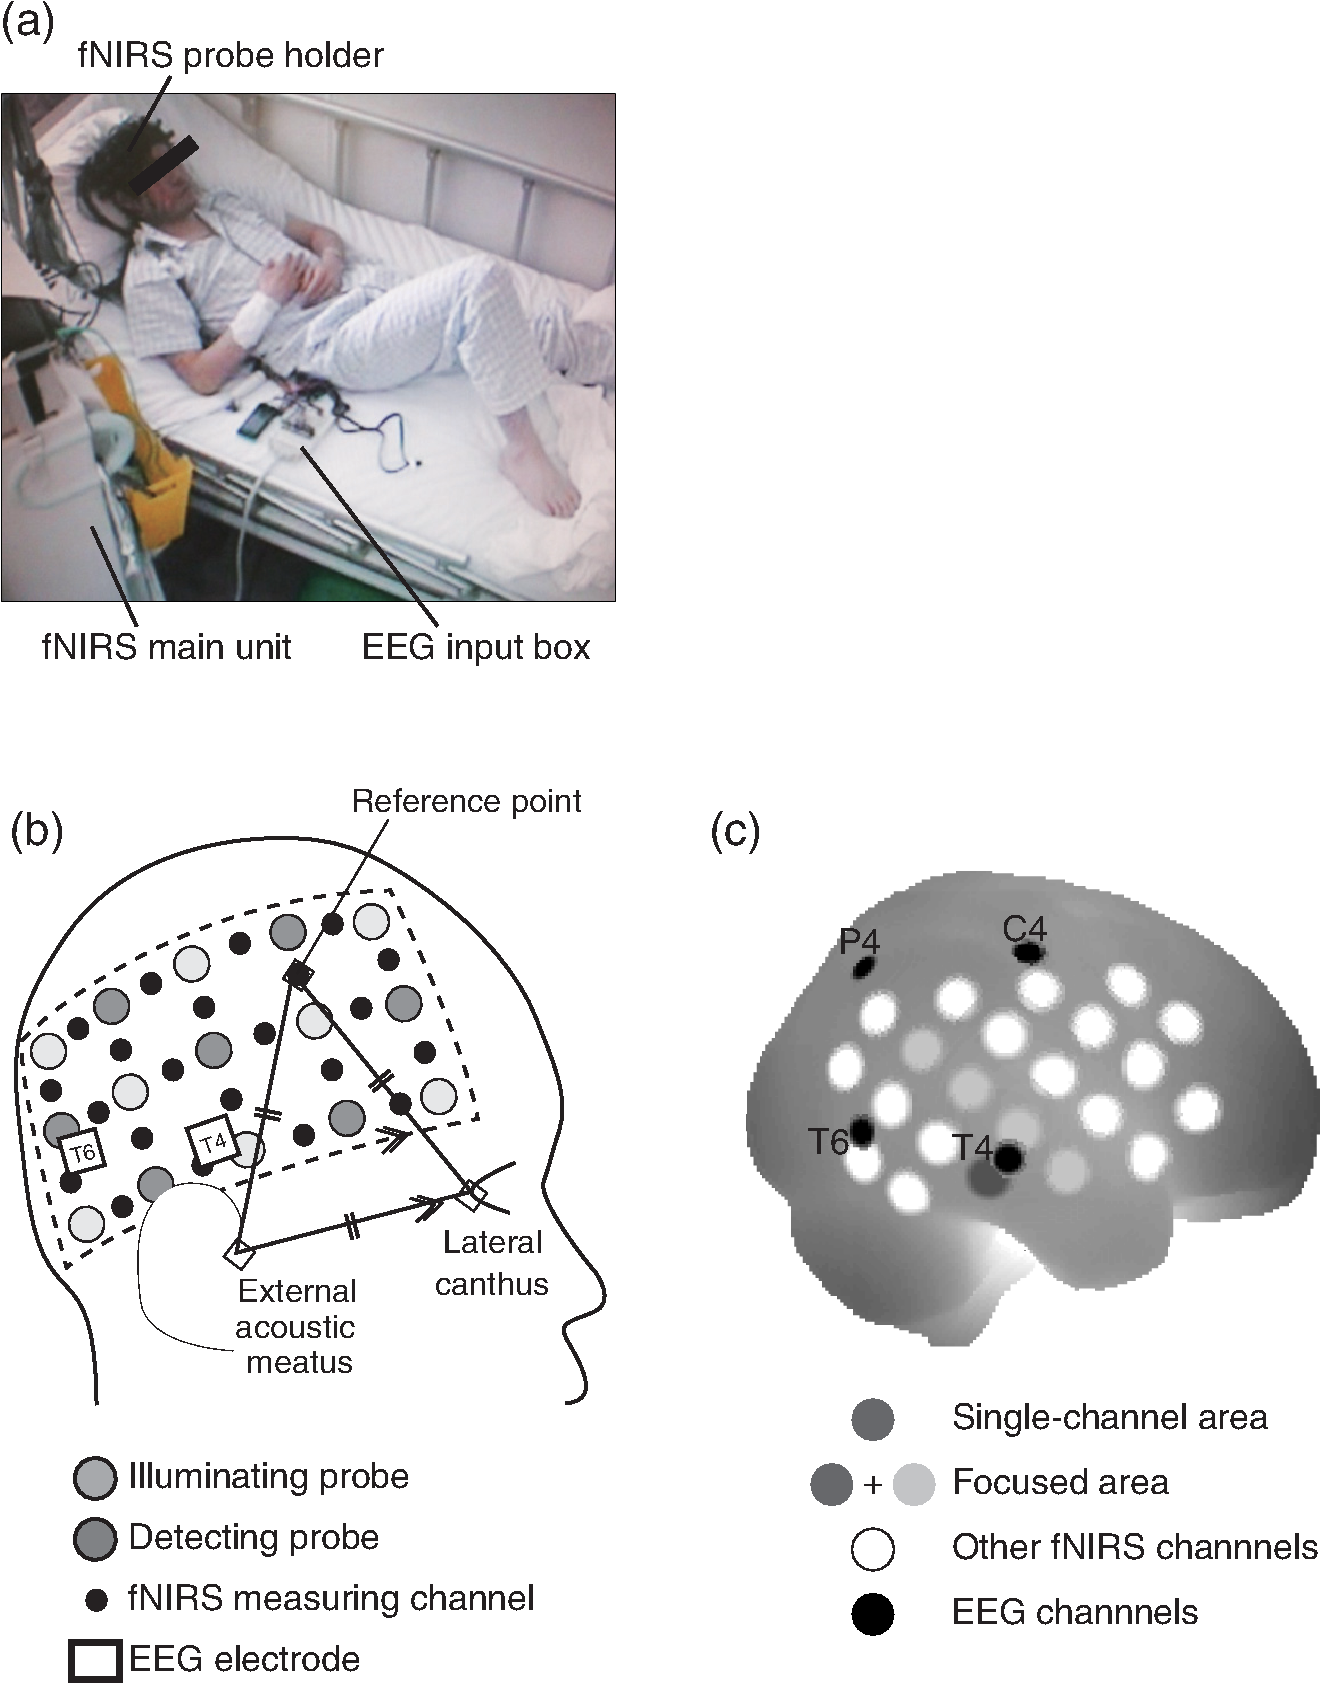 The EEG data were recorded with an EEG1000 system (Nihon Koden, Japan) with 18 electrodes in accord with the international 10–20 systems, but excluding O1 and O2 (500 or 1000-Hz sampling rate; 60-Hz high-cut filter; 0.1-s time constant). To prevent any movement of the EEG electrodes that might be caused by the attachment of a NIRS probe holder, we used surgical staples, which are used to suture wounds, rather than common EEG electrodes. Before recording, an anesthetic (lidocaine; brand name: Xylocaine Jelly) was applied and surgical staples were attached to the scalp. Movement artifacts (head or body) and the behavior of patients were monitored using video recordings. Clinical seizure onset was identified by the epileptologists in reference to EEG and video data. In addition, we used the multichannel fNIRS system ETG-4000 (Hitachi Medical Corporation, Kashiwa, Japan), with two wavelengths of near-infrared light (695 and 830 nm). The sampling rate was set at 2 Hz. Eight illuminating and seven detecting probes were arranged alternately on one multichannel probe holder ( probes) made of silicon rubber for each hemisphere. This arrangement produced a total of 44 measurement channels (22 channels for each hemisphere). To place the fNIRS probe on the patient’s head, we first determined the reference point. The line between the preauricular point and the lateral canthus was used as the baseline of an equilateral triangle. The top point of the triangle was taken as the reference point for the placement of fNIRS probes. The reference point was located between the detecting probes (second line from anterior part on the upper side) and illuminating probes (second line from anterior part on the middle side). The fNIRS probe holder was placed parallel to the baseline of the equilateral triangle to cover the temporal region (T4 and T6 for the right hemisphere and T3 with T5 for the left hemisphere). Simultaneous fNIRS/EEG measurement was accomplished using a head shell that can be comfortably secured to the head of the subject and that keeps the source and detector optical fibers in contact with the skin. We fastened the probe holder tightly with a belt so as to minimize artifacts. Placement of fNIRS probes, which took approximately 10 min, is depicted in Fig. 1(b). Spatial correspondence between fNIRS probes, channels, and international 10–20 positions were assessed according to a virtual registration method36 for registration to Montreal Neurological Institute (MNI) space36–42 with reference to the macroanatomical brain atlas LBPA40.43 2.3.Analyses of EEG Data and Clinical SymptomsThe EEG data were reviewed offline and manually marked by four epileptologists. Clinical characteristic events were selected from EEG and video recordings.44 For EEG data, special attention was given to the attenuation of background activity45 mainly consisting of alpha and beta waves for detecting EEG activity suppression, which is believed to be a result of desynchronization. EEG activity suppression was expected to be followed by epileptic spike trains and/or theta bursts (regular 4–7 Hz rhythmic activities) rather than unequivocal ictal EEG rhythms, as compared to baseline.46 These events were recognized as the temporal markers of seizure onset. EEG events were also taken into consideration for presurgical determination of the epileptic focus side along with SPECT- and MRI-based diagnoses as specifically described for each MTLE patient in the case descriptions in the Results section. In video recordings, clinical seizure onset was identified when epileptologists observed characteristic epilepsy behaviors and/or when a patient declared an aura by pushing their call button. 2.4.fNIRS Data AnalysesWe analyzed the optical fNIRS data based on the modified Beer–Lambert law25 as previously described.47 This method allowed us to calculate signals reflecting the oxygenated hemoglobin (oxy-Hb) and deoxygenated hemoglobin (deoxy-Hb) concentration changes, calculated in units of millimolar millimeter (mM·mm).47 Oxy-Hb signal was used for further analysis because it has a higher signal amplitude than does deoxy-Hb.48 We calculated period-average oxy-Hb values after the clinical characteristic events (EEG activity suppression, spike train, theta burst, clinical seizure onset, or aura) that were identified in EEG or video recordings. To determine the optimal timeframe for period averaging, we calculated average values for 5, 10, 15, 20, 25, and 30 s after the clinical characteristic events. As a baseline, period-average oxy-Hb values for 5 s before each event were used. For the evaluation of the focus side using fNIRS data, we set three regions of interest (ROI) with different channel coverages. We calculated area-average (generally speaking, the area average of period averages) values for a single channel, for a focused area (STG and MTG), and for the whole hemisphere. For the single-channel ROI, one channel corresponding to T3 or T4 of the international 10–20 systems was selected. For the focused-area ROI, channels on the temporal lobe with a probability of 50% or greater of being located at the STG or MTG were selected as per the virtual registration method.36–42 For the whole-hemisphere ROI, data from all channels were averaged for each hemisphere. We compared area-average values for each side for each channel group to identify epileptic laterality. 3.Results3.1.Overview of Seizure DetectionFour seizures were successfully recorded during fNIRS/EEG monitoring in four out of six patients with intractable MTLE. The other two patients had no seizures during simultaneous fNIRS/EEG sessions (monitoring time: 24 and 32 h, respectively). To determine the parameters for laterality evaluation, the averaging periods for oxy-Hb after the characteristic event were varied and the optimum value was selected (Fig. 2). This evaluation revealed that laterality based on average oxy-Hb values remained constant at around 20 s for EEG activity suppression, spike train, and clinical seizure. When the averaging period was short, the average oxy-Hb value exhibited a contradictory relationship with the true epileptic focus laterality. Therefore, we determined the optimal averaging period to be 20 s. Fig. 2The period-average values of oxy-Hb for different averaging periods in the focused ROI: The periods began at the onset of each event. The horizontal axes indicate averaging periods and the vertical axes indicate averaged oxy-Hb as exemplified in the top left corner. 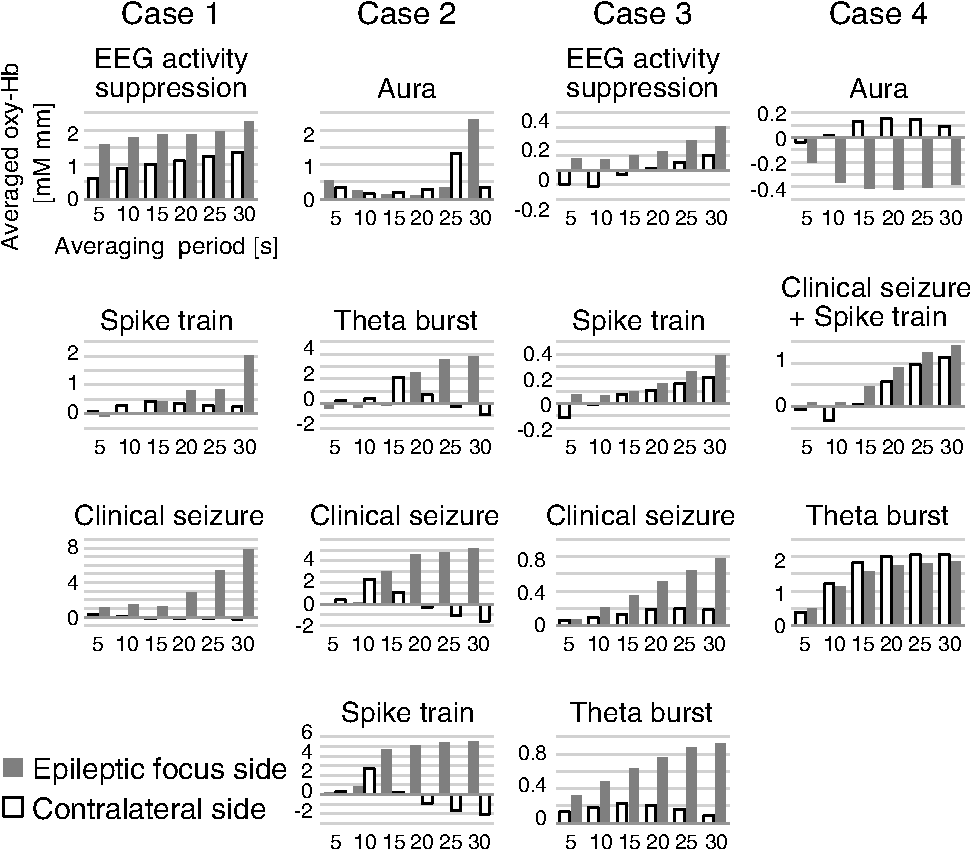 The measured data are shown in Figs. 3Fig. 4Fig. 5–6. Each figure gives data for one patient. fNIRS and EEG original waveforms are labeled in the figures as (a) and (b), respectively. (a) shows fNIRS data for the two channels that were closest to the point of epilepsy focus and contralateral points T3 and T4. The clinical characteristic events are indicated with red arrows below the graph. The EEG data are shown in (b). The clinical characteristic events are indicated with vertical red lines. (c) presents the fNIRS activation map based on period-average oxy-Hb values 20 s after each event. The area-average oxy-Hb values for each ROI are shown in (d). Video-capture images of the clinical characteristic events are shown in (e). Fig. 3EEG and fNIRS data during the seizure of case 1. (a) Oxy-Hb signals at the two single-channel ROIs around the EEG channels of T3 and T4. Epileptic focus side is indicated with the solid red line and the contralateral side is indicated with the dotted blue line. The characteristic events are indicated with red arrows. (b) EEG data for channels covering the focused area as determined by fNIRS channels. The characteristic events are indicated with vertical red lines. (c) Colored brain maps of fNIRS activations at the times of characteristic events. The focused area is enclosed with a black line. (d) The period-average values of oxy-Hb 20s after the characteristic events. The channel groups, from left to right, are the single-channel area, the focused area, and the whole-hemisphere area. Focus side values are indicated with gray bars and contralateral side values are indicated with white bars. (e) Still captures taken from the video, which was simultaneously recorded. 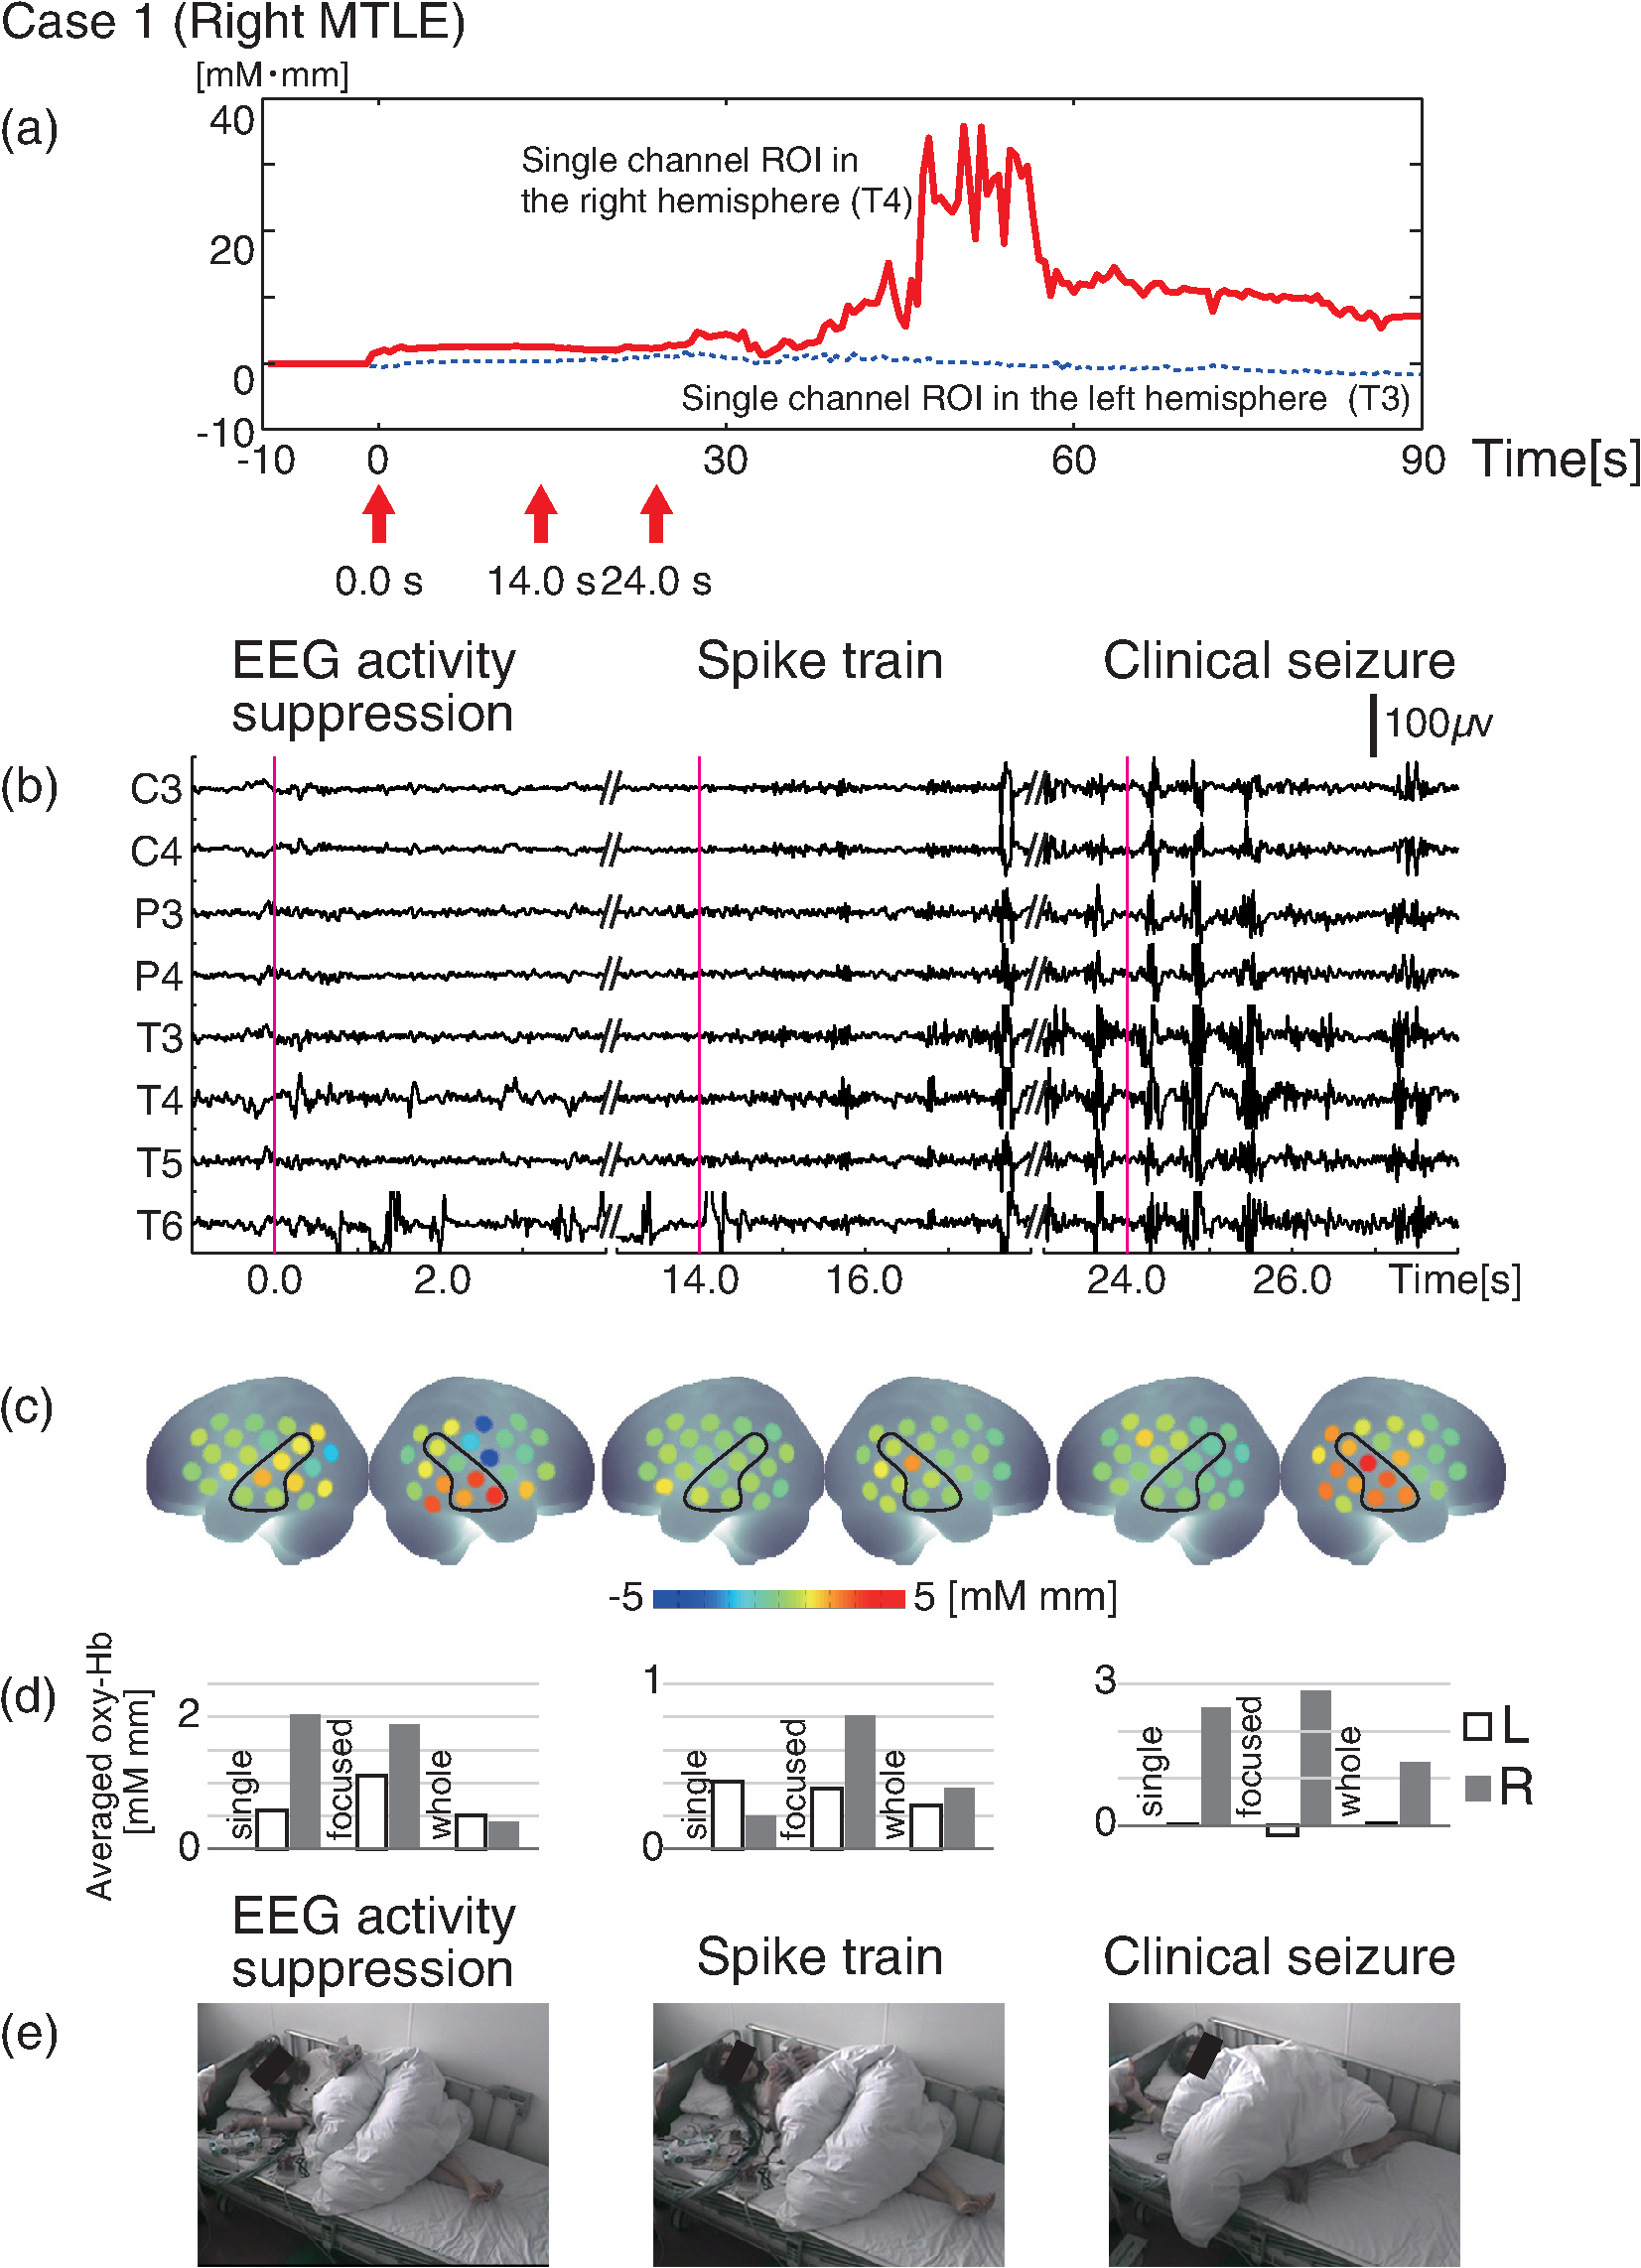 3.2.Case 1This 24-year-old female had suffered from weekly seizures since the age of 7 years. Her attacks usually began with a tingling sensation and flapping of her right arm followed by altered consciousness. No generalized tonic–clonic seizures were observed. Because treatment with antiepileptic drugs was ineffective, she was referred to Jichi Medical University Hospital as a surgical candidate for epilepsy surgery. MRI studies yielded a high fluid-attenuated inversion recovery signal in the right hippocampus. Administration of iomazenil (IMZ) SPECT revealed low uptake in the right hippocampus, which indicates a low benzodiazepine receptor density in the area. During simultaneous fNIRS/EEG video monitoring, one complex partial seizure was captured. The EEG seizure onset was defined by EEG activity suppression followed by theta wave bursts in the right temporal region. Epileptic discharges persisted dominantly in the right temporal region throughout the seizure. Right-hand automatism was observed 20 s after EEG activity suppression. The EEG timeline data are shown in Fig. 3(b). The time points of characteristic events are indicated with vertical red lines. Clinical seizure onset was preceded by EEG seizure onset by 24 s. The selected waveforms of fNIRS data are shown in Fig. 3(a). The characteristic events are indicated with red arrows. On the epileptic focus side (T4), the oxy-Hb values increased 30 s after EEG activity suppression and stayed at high levels for another 30 s. The period-average oxy-Hb values for 20 s after the onset of clinical characteristic events for each channel are indicated in the colored brain maps [Fig. 3(c)]. Oxy-Hb values were higher overall in the right temporal lobe for all events. In the left hemisphere, the oxy-Hb values were higher at the temporal lobe, but these values were smaller than those of the right hemisphere. Activated areas were greater at the time of the clinical seizure than at the time of earlier events. The area-average oxy-Hb values in the three ROIs are shown in Fig. 3(d). In all cases except the whole-hemisphere ROI at EEG activity suppression, the oxy-Hb values for the right side were greater than those for the left side. Finally, the seizure focus was confirmed in the right medial temporal lobe during a right selective amygdalo-hippocampectomy, which relieved the patient of seizures. 3.3.Case 2This 29-year-old right-handed male had suffered from refractory partial epilepsy since the age of 24 years. His seizures were characterized by an aura which usually began with a sensation of fear followed by tonic–clonic seizures with loss of consciousness and a duration of about 2 min. His condition progressively worsened over time with multiple daily seizures, and epilepsy surgery was considered after multiple antiepileptic drugs failed to control them. The left hippocampal sclerosis was identified by MRI. IMZ-SPECT revealed no focal signal decrease. One seizure was captured during simultaneous fNIRS/EEG video monitoring. The seizure was associated with a sensation of fear 15 s prior to the first obvious seizure onset identified by a high-frequency spike train appearing in the EEG data predominantly in the left temporal region [Fig. 4(b)]. The patient declared his seizure aura by pushing the call button [Fig. 4(e)]. The selected fNIRS waveforms are shown in Fig. 4(a). On the epileptic focus side (T3), the value of oxy-Hb increased 20 s after the aura and remained high until 60 s after the aura. On the contralateral side (T4), the oxy-Hb values started to decrease at 15 s after the aura. The period-average oxy-Hb values for 20 s after the clinical characteristic events for each channel are indicated in the colored brain maps [Fig. 4(c)]. For all events except for aura, the oxy-Hb values were higher in the left temporal lobe (the epileptic focus side). In the contralateral hemisphere, the oxy-Hb values were higher in the temporal lobe than in other areas, but these values were smaller than the values for the left hemisphere. The area-average oxy-Hb values for the three ROIs are shown in Fig. 4(d). In almost all cases, the oxy-Hb values of the ipsilateral left side were greater than those of the right side. At the aura, oxy-Hb values were greater in the contralateral side than in the focused side. At the onset of the theta burst, the oxy-Hb values for the single-channel ROI and the whole-hemisphere ROI were greater on the contralateral right side, while the oxy-Hb values for the temporal-lobe (focused) ROI were high on the ipsilateral left side. The patient was finally diagnosed as having left medial-temporal-lobe epilepsy with successive video/depth-EEG monitoring. A left selective amygdalo-hippocampectomy relieved the patient of seizures. 3.4.Case 3This 55-year-old female suffered from intractable epilepsy associated with right mesial temporal cavernous angioma. She started having seizures at the age of 53 years. Since then, she had periodically experienced seizures characterized by oroalimentary automatisms, lip smacking, and hand rubbing, with loss of consciousness. Occasionally she would suddenly stand up and walk to a place that she could not recognize. Cavernous angioma on the right uncus was identified by MRI. With simultaneous fNIRS/EEG video monitoring, one seizure was successfully captured. EEG showed EEG activity suppression 21.5 s prior to a theta burst, which appeared dominantly in the right hemisphere. During the seizure, lip smacking and right hand automatisms were captured 14.5 s after EEG activity suppression and throughout the seizure [Fig. 5(b)]. The selected fNIRS waveforms are shown in Fig. 5(a). On the epileptic focus side (T4), the value of oxy-Hb increased 20 s after EEG activity suppression and remained high until 60 s after synchronization. The oxy-Hb value for the contralateral side also increased 20 s after EEG activity suppression, but the amplitude was smaller than in the ipsilateral side. The period-average oxy-Hb values for 20 s after the clinically characteristic events for each channel are indicated in the colored brain maps in Fig. 5(c). For all events, the oxy-Hb values were higher in the right temporal lobe. In the left hemisphere, the oxy-Hb values increased in the temporal lobe, but to smaller degrees than in the right hemisphere. Activated areas were greater at the time of the clinical seizure than at the time of earlier events. The area-average oxy-Hb values for the three ROIs are shown in Fig. 5(d). In all cases except the single-channel ROI at the spike train, the oxy-Hb values for the ipsilateral right side were larger than those of contralateral left side. The patient underwent a right selective amygdalo-hippocampectomy, and has since remained seizure free. 3.5.Case 4This 21-year-old female had suffered from seizures since the age of 12 years. After her first episode, she had periodic seizures characterized by an aura of a foul odor and a sensation of fear, followed by a generalized convulsive seizure lasting less than 2 min with or without altered consciousness. In addition, she would sometimes pinch her nose continuously during seizures, which suggested olfactory uncinate fits. She underwent a comprehensive presurgical evaluation after multiple anti-epileptic drugs failed to control her seizures. Left hippocampal atrophy was identified by MRI. IMZ-SPECT revealed no focal signal decrease. One complex partial seizure was successfully captured during simultaneous fNIRS/EEG video monitoring. First, the patient declared her seizure aura by pushing the call button [Fig. 6(e)]. Extracranial ictal EEG examination first revealed obvious EEG activity suppression followed by theta wave bursts in the right temporal region. In the homologous contralateral temporal region, the EEG revealed similar wave patterns with lower amplitudes throughout the seizure. Pinching of her nose was observed [Fig. 6(e)] in this seizure at almost same time as the electrical changes occurring on the EEG [Fig. 6(b)]. The selected fNIRS waveforms are shown in Fig. 6(a). Oxy-Hb values for both hemispheres increased 30 s after the aura and thereafter remained high. The period-average oxy-Hb values for 20 s after the clinical characteristic events for each channel are depicted in the colored brain maps in Fig. 6(c). For all events, the oxy-Hb values were higher in the right temporal lobe. The activated areas increased as time progressed. The area-average oxy-Hb values for the three ROIs are shown in Fig. 6(d). For all cases except the single-channel ROI at the spike train, the values for the ipsilateral right side were greater than those for the contralateral left side. The patient underwent a right-selective amygdalo-hippocampectomy, and has since been seizure free. 4.Discussion4.1.Simultaneous Long-Term fNIRS/EEG Monitoring for MTLEIn the present study, simultaneous long-term ictal fNIRS/EEG monitoring with video recording for 8–16 h per day led to the successful detection of spontaneous seizures in four out of six MTLE cases. The earliest detection of spontaneous seizure was at 2 h from the beginning of ictal fNIRS/EEG video monitoring, which would have been difficult to detect using conventional simultaneous fMRI/EEG monitoring that allows continuous use for only up to 2 h.23 Technical prerequisites for long-term monitoring are a short set-up time for the measurement system, especially for probe setting, comfortableness during measurement, relative insensitivity to movements involved in minimal everyday life operations that are inevitable with bedside monitoring, and the storage and processing of large-scale data. The ictal fNIRS/EEG simultaneous measurement system in the current experiment addressed these technical issues and enabled successful simultaneous monitoring of epileptic patients from morning until night for up to 4 days, while keeping the mental and physical burdens of patients to a minimum, thus maintaining their quality of life. Moreover, the current system enables the simultaneous acquisition of electrophysiological and hemodynamic signals to provide a wider perspective of the symptoms associated with spontaneous seizure. The present simultaneous ictal fNIRS/EEG monitoring system revealed the relationship between electrophysiological and hemodynamic responses associated with epileptic seizures, which could contribute to our ability to estimate the epileptic focus side. In time frames adjacent to EEG epileptic onset, we observed substantial oxy-Hb signal increases, which were believed to be evoked by increased neuronal activity at the epileptic focus. 4.2.Scalp EEG for Clinical Diagnosis of EpilepsyUsing scalp EEG monitoring for epileptic patients reveals the electrical activity of the cerebral cortex with broad coverage of the brain surface. Although scalp EEG has stood as the gold standard for presurgical evaluation to determine epileptic focus side, it has some limitations.6 First, determination of the epileptic focus side is not efficient with scalp EEG, which fails to detect laterality in up to one-third of patients with temporal lobe epilepsy.49 About two thirds of the seizures studied have been reported to exhibit bilateral changes on the scalp at seizure onset.50 Even when there is an asymmetric bilateral change, it remains difficult to detect the epileptic focus side.50 Second, interpretation of the signal source is further complicated by its distance from extracranial electrodes. This adds to the variability produced by neuronal propagation. Consequently, there is still uncertainty in the role of ictal scalp recordings for presurgical assessment: laterality determination has been estimated to be 22% to 90% successful with scalp EEG recordings.50 Despite the commonality and importance of continuous scalp-EEG and video monitoring for diagnosing patients with seizures, this method has several limitations, as aforementioned, and cannot be considered as a single established method for lateralizing the epileptic focus in MTLE patients. However, such limitations can be mitigated by the use of fNIRS for detecting signals associated with hemodynamic changes on the cerebral cortex during spontaneous seizures. 4.3.fNIRS for Clinical Diagnosis of EpilepsyEpileptic seizures result in an increase of oxy-Hb signals both on the ipsi- and contralateral sides. Oxy-Hb increase is observed 2–8 s after the onset of a seizure and lasts for 20–50 s, returning to the resting level later.22 Similarly, a recent study also reported that seizures in MTLE patients were associated with significant increases in oxy-Hb signal of up to 13% compared to baseline periods.23 These increases are several times greater than expected for experimental paradigms under usual physiological conditions.51 Such a large oxy-Hb increase is relevant to hemodynamic changes that were observed in a previous fMRI study on epileptic seizures with a BOLD signal change of 6%, which is larger than that for interictal spikes and cognitive tasks (0.5%–1.0%).18 The onset of hemodynamic changes reflecting epileptic seizures occurred at nearly the same time as seizure detection using EEG. However, hemodynamic changes were also detected in the contralateral temporal lobe in a temporally similar manner as for the ipsilateral temporal lobe, but with a lower amplitude. In order to determine the epileptic focus side, fNIRS must detect hemodynamic changes in the seizure onset zone and allow their differentiation from the propagated signals. Assuming that the epileptic focus of MTLE is in the hippocampus, we can logically expect scalp EEG and fNIRS signals in the lateral temporal lobe around T3/4 to have the following characteristics. First, the EEG signal is expected to reflect direct hippocampal neural activity as well as that propagated to neighboring regions in the lateral temporal lobes including T3/4. Second, albeit unlikely that fNIRS would detect the hemodynamic changes that are evoked by neural activity in the hippocampus, we expect that fNIRS can detect hemodynamic responses that reflect the early propagation of neural activity in the ipsilateral temporal lobe. In addition, fNIRS is also expected to detect hemodynamic responses that are evoked by neural activity propagated to the contralateral temporal lobes. In this case, laterality determination is only possible when neural activation is temporally or spatially dominant in the ipsilateral temporal lobe. However, such expectations may not always be met for scalp EEG measurements. In cases of MTLE with severe hippocampal sclerosis, signs of seizure onset may not always be propagated to the ipsilateral scalp, rather they may be propagated to the contralateral scalp a few seconds later, resulting in false lateralization in up to 10% of cases.52 Thus, it would be preferable to assume that spatially and temporally propagated signals over the scalp are inevitable and we should extract meaningful parameters from such signals. Although hemodynamic signals may not reach their maximum during this time range, there is a higher likelihood that the early phase hemodynamic signal changes are more closely related to neural activation in the seizure onset zone. On the other hand, hemodynamic signal at the seizure’s peak (usually occurs at approximately 1 min from onset) is likely to be contaminated due to seizure propagation. Considering these aspects, we will discuss two points for fNIRS data evaluation of epileptic focus point diagnosis: appropriate ROI selection and characteristic clinical events, which is to say the selection of fNIRS data that correspond with other spatial and temporal factors. 4.4.Effects of ROI on Focus Side Diagnosis in MTLEOne issue that needs to be discussed is how large the ROI should be in order to evaluate the focus side when using fNIRS data. In the present study, when the ROI consisted of one channel in each hemisphere, the period-averaged oxy-Hb values were influenced by the period and timing used for averaging and noise. However, when broader ROIs (i.e., all channels in each hemisphere) were used, laterality was not clear, especially when the contralateral activities increased in later events. These problems were avoided by adopting a moderate ROI size. When channels located at the temporal lobes were selected, the values of oxy-Hb exhibited clear laterality after the characteristic events. Thus, we expect that robust focus side determination could be achieved by using multiple channels located over the temporal lobes. However, since the current observation is based on only four cases, a large-scale study is necessary for further generalization. 4.5.Use of Characteristic EEG and Clinical Events for fNIRS Data EvaluationIn the current study, we utilized five characteristic events defined with EEG data and clinical symptoms: EEG activity suppression, spike train, theta burst, clinical seizure, and aura. By focusing on early oxy-Hb signal changes after the onset of each event, we observed robust hemodynamic changes that likely reflected neural activations at the epileptic focus. For most of the five characteristic events represented in the three ROIs, we observed an overall tendency for oxy-Hb values to be higher in the ipsilateral side; aura and theta burst, which will be discussed later, were exceptions to this observation [Figs. 3–6, (c) and (d)]. When the ROI was limited to the temporal lobe, this tendency was enhanced. In particular, for EEG activity suppression, spike train, and clinical seizure, the laterality determined with higher oxy-Hb values at the temporal lobe (focused) ROI matched the true laterality. Thus, we expect that EEG activity suppression, spike train, and clinical seizure will serve as effective temporal markers for fNIRS-based evaluation. Sometimes suppression of EEG activity and a spike train were found earlier than the “clinical seizure.” Therefore, rather than relying on one specific event, examining multiple temporal markers will lead to a robust evaluation. On the other hand, aura and theta burst were not effective temporal markers for fNIRS. No EEG waveform characteristics were observed nor did the values of oxy-Hb clearly increase with an aura. Also, the onset of a theta burst was hard to detect because plausible motion artifacts contaminated EEG signals. In this study, the onset of a theta burst was defined as the time at which the theta burst waves were clearly detected. However, this timing may have been later than the actual onset of the seizure, thus any activations detected might have propagated to wider regions of the brain. Therefore, we cannot expect that aura and theta burst events are suitable as characteristic temporal triggers for fNIRS-based evaluation. 4.6.LimitationsOne limitation of the current study is the small sample size. There were too few patients to make a statistical inference. To address this limitation, the current collective case study should be expanded into large-scale group analysis to explore the statistical validity of the long-term fNIRS/EEG-based diagnosis of epileptic focus in MTLE patients. It should also be noted that inferences of the current study are limited to within the realm of spontaneous seizures of MTLE patients. The large hemodynamic changes observed during seizures in these cases may not be generalizable across epilepsy subtypes and conditions. Indeed, animal model studies have reported both increases53,54 and decreases55,56 in cerebral blood flow levels during seizures. Such apparent differences may be attributed to differences in experimental conditions such as the kind of anesthesia employed and acute pharmacological induction. It is considered that animal models using artificially evoked seizures do not always truly represent the circumstances surrounding spontaneous seizures.57 Reflecting this, in a human study, Nehlig et al.58 demonstrated a decrease in cerebral blood flow levels during the absence of seizures and their increase during drug-induced seizures. Thus, long-term simultaneous fNIRS/EEG monitoring studies should be expanded to include various types of epilepsy for further generalization and specification. In addition, fNIRS-based diagnosis can be affected by physiological signals and noise other than cortical hemodynamic responses such as noncortical hemodynamic responses including skin blood flow changes59,60 and systemic effects including spontaneous oscillation.61–63 However, hemodynamic changes evoked by epileptic seizures are not expected to be influenced by these noncortical signals. First, observed hemodynamic responses associated with epileptic seizures were greater by at least one order than those associated with, for instance, cognitive (e.g., in color word Stroop tasks64), linguistic (e.g., in verbal fluency tasks65), sensory (e.g., in median nerve stimulation66), and motor (e.g., in finger tapping tasks67) activations. A previous fNIRS epilepsy study also observed that the cerebral hemodynamic variations are 3 to 8 times greater than that seen during a language task.23 In fMRI research, it was also reported that the increase in BOLD signal was largely compared to what is seen during interictal spikes or cognitive tasks.18 Accordingly, the hemodynamic responses associated with epileptic seizures are expected to result in a larger signal-to-noise ratio. Second, regional propagation of the observed activation along a time course cannot be well explained by noncortical components.59–63 However, further investigation, such as that combining short-distance probes,68–71 is necessary in order to rule out the possible effects of noncortical components. 5.ConclusionIn conclusion, long-term simultaneous recording of scalp EEG and fNIRS data could successfully be used to noninvasively evaluate neuronal activities and hemodynamic changes in spontaneous epileptic discharges of MTLE. Effective focus side evaluation by fNIRS was achieved when oxy-Hb signals corresponded with EEG events or clinical symptoms including EEG activity suppression, spike train, and clinical seizure. Long-term simultaneous fNIRS/EEG measurement provides a useful tool for investigating spontaneously occurring neuronal activity and hemodynamic changes in order to provide a wider perspective on the evaluation of symptoms related to epileptic seizures, and thus for enhancing our understanding of the neurobiology of MTLE. Moreover, hemodynamic measurements using fNIRS would provide supplementary data for authentic EEG-based noninvasive methods for determining the epileptic focus side, enhancing the reliability of presurgical diagnosis of laterality. Compared to EEG/fMRI, the fNIRS/EEG system provides a far easier experimental setting allowing better comfort and less restriction of body motion, thus is regarded as a more realistic option for actual clinical situations. Further investigation of the neurobiological basis of neurophysiological and hemodynamic responses associated with epileptic seizures and an accumulation of studies of MTLE patients would accelerate the application of long-term fNIRS/EEG monitoring in actual clinical situations for the presurgical evaluation of MTLE patients. AcknowledgmentsWe appreciate ELCS—English Language Consultation Services for proofreading the manuscript. We appreciate Dr. Mizutani and Mr. Sano for data preprocessing. This work was supported in part by the Grant-in-Aid for Scientific Research from the Japan Society for Promotion of Science (25282243 to I. D. and 23390354 to E. W.). ReferencesA. T. Berg et al.,
“The multicenter study of epilepsy surgery: recruitment and selection for surgery,”
Epilepsia, 44
(11), 1425
–1433
(2003). http://dx.doi.org/10.1046/j.1528-1157.2003.24203.x EPILAK 0013-9580 Google Scholar
B. J. Steinhoff, G. Herrendorf and C. Kurth,
“Ictal near infrared spectroscopy in temporal lobe epilepsy: a pilot study,”
Seizure, 5
(2), 97
–101
(1996). http://dx.doi.org/10.1016/S1059-1311(96)80101-4 SEIZE7 1059-1311 Google Scholar
F. Rosenow and H. Luders,
“Presurgical evaluation of epilepsy,”
Brain, 124
(9), 1683
–1700
(2001). http://dx.doi.org/10.1093/brain/124.9.1683 BRAIAK 0006-8950 Google Scholar
K. Goffin et al.,
“Neuronuclear assessment of patients with epilepsy,”
Semin. Nucl. Med., 38
(4), 227
–239
(2008). http://dx.doi.org/10.1053/j.semnuclmed.2008.02.004 SMNMAB 0001-2998 Google Scholar
J. Gotman,
“Epileptic networks studied with EEG-fMRI,”
Epilepsia, 49
(Suppl 3), 42
–51
(2008). http://dx.doi.org/10.1111/epi.2008.49.issue-s3 EPILAK 0013-9580 Google Scholar
S. J. Smith,
“EEG in the diagnosis, classification, and management of patients with epilepsy,”
J. Neurol. Neurosurg. Psychi., 76
(Suppl 2), 2
–7
(2005). http://dx.doi.org/10.1136/jnnp.2005.069245 JNNPAU 0022-3050 Google Scholar
J. S. Duncan,
“Imaging and epilepsy,”
Brain, 120
(2), 339
–377
(1997). http://dx.doi.org/10.1093/brain/120.2.339 BRAIAK 0006-8950 Google Scholar
G. D. Cascino,
“Advances in neuroimaging: surgical localization,”
Epilepsia, 42
(1), 3
–12
(2001). http://dx.doi.org/10.1046/j.1528-1157.2001.081421.x EPILAK 0013-9580 Google Scholar
A. Salek-Haddadi et al.,
“Simultaneous EEG-Correlated Ictal fMRI,”
Neuroimage, 16
(1), 32
–40
(2002). http://dx.doi.org/10.1006/nimg.2002.1073 NEIMEF 1053-8119 Google Scholar
N. Verma et al.,
“Shorter time between seizure onset and radiotracer injection improves ictal SPECT localization in pediatric patients with pharmacologically intractable epilepsy,”
J. Nucl. Med., 54
(Suppl 2), 536
(2013). JNMEAQ 0161-5505 Google Scholar
W. Van Paesschen,
“Ictal SPECT,”
Epilepsia, 45
(Suppl 4), 35
–40
(2004). http://dx.doi.org/10.1111/j.0013-9580.2004.04008.x EPILAK 0013-9580 Google Scholar
C. la Fougere et al.,
“PET and SPECT in epilepsy: a critical review,”
Epilepsy Behav., 15
(1), 50
–55
(2009). http://dx.doi.org/10.1016/j.yebeh.2009.02.025 1525-5050 Google Scholar
K. Kaiboriboon et al.,
“Quantitative analysis of cerebral blood flow patterns in mesial temporal lobe epilepsy using composite SISCOM,”
J. Nucl. Med., 46
(1), 38
–43
(2005). JNMEAQ 0161-5505 Google Scholar
G. Huberfeld et al.,
“Ictal brain hyperperfusion contralateral to seizure onset: the SPECT mirror image,”
Epilepsia, 47
(1), 123
–133
(2006). http://dx.doi.org/10.1111/epi.2006.47.issue-1 EPILAK 0013-9580 Google Scholar
M. R. Newton et al.,
“Postictal switch in blood flow distribution and temporal lobe seizures,”
J. Neurol. Neurosurg. Psychi., 55
(10), 891
–894
(1992). http://dx.doi.org/10.1136/jnnp.55.10.891 JNNPAU 0022-3050 Google Scholar
L. Lemieux et al.,
“Event-related fMRI with simultaneous and continuous EEG: description of the method and initial case report,”
Neuroimage, 14
(3), 780
–787
(2001). http://dx.doi.org/10.1006/nimg.2001.0853 NEIMEF 1053-8119 Google Scholar
Y. Aghakhani et al.,
“fMRI activation during spike and wave discharges in idiopathic generalized epilepsy,”
Brain, 127
(5), 1127
–1144
(2004). http://dx.doi.org/10.1093/brain/awh136 BRAIAK 0006-8950 Google Scholar
E. Kobayashi et al.,
“Widespread and intense BOLD changes during brief focal electrographic seizures,”
Neurology, 66
(7), 1049
–1055
(2006). http://dx.doi.org/10.1212/01.wnl.0000204232.37720.a4 NEURAI 0028-3878 Google Scholar
P. LeVan et al.,
“Independent component analysis reveals dynamic ictal BOLD responses in EEG-fMRI data from focal epilepsy patients,”
Neuroimage, 49
(1), 366
–378
(2010). http://dx.doi.org/10.1016/j.neuroimage.2009.07.064 NEIMEF 1053-8119 Google Scholar
A. Machado et al.,
“Detection of hemodynamic responses to epileptic activity using simultaneous electro-encephaloGraphy (EEG)/near infra red spectroscopy (NIRS) acquisitions,”
Neuroimage, 56
(1), 114
–125
(2011). http://dx.doi.org/10.1016/j.neuroimage.2010.12.026 NEIMEF 1053-8119 Google Scholar
F. Wallois et al.,
“EEG-NIRS in epilepsy in children and neonates,”
Neurophysiol. Clin., 40
(5–6), 281
–292
(2010). http://dx.doi.org/10.1016/j.neucli.2010.08.004 NCLIE4 0987-7053 Google Scholar
E. Watanabe, Y. Nagahori and Y. Mayanagi,
“Focus diagnosis of epilepsy using near-infrared spectroscopy,”
Epilepsia, 43
(Suppl 9), 50
–55
(2002). http://dx.doi.org/10.1046/j.1528-1157.43.s.9.12.x EPILAK 0013-9580 Google Scholar
D. K. Nguyen et al.,
“Non-invasive continuous EEG-fNIRS recording of temporal lobe seizures,”
Epilepsy Res., 99
(1–2), 112
–126
(2012). http://dx.doi.org/10.1016/j.eplepsyres.2011.10.035 EPIRE8 0920-1211 Google Scholar
G. Arca Diaz et al.,
“Near infrared spectroscopy in the management of status epilepticus in a young infant,”
Eur. J. Paediatr. Neurol., 10
(1), 19
–21
(2006). http://dx.doi.org/10.1016/j.ejpn.2005.11.001 1090-3798 Google Scholar
J. Furusho et al.,
“Simultaneous study of interictal EEG and near-infrared spectroscopy in a boy with epilepsy,”
Int. Congr., 1232
(2002). http://dx.doi.org/10.1016/S0531-5131(01)00698-7 EXMDA4 0531-5131 Google Scholar
P. D. Adelson et al.,
“Noninvasive continuous monitoring of cerebral oxygenation periictally using near-infrared spectroscopy: a preliminary report,”
Epilepsia, 40
(11), 1484
–1489
(1999). http://dx.doi.org/10.1111/epi.1999.40.issue-11 EPILAK 0013-9580 Google Scholar
K. Haginoya et al.,
“Ictal cerebral hemodynamics of childhood epilepsy measured with near-infrared spectrophotometry,”
Brain, 125
(9), 1960
–1971
(2002). http://dx.doi.org/10.1093/brain/awf213 BRAIAK 0006-8950 Google Scholar
D. K. Sokol et al.,
“Near infrared spectroscopy (NIRS) distinguishes seizure types,”
Seizure, 9
(5), 323
–327
(2000). http://dx.doi.org/10.1053/seiz.2000.0406 SEIZE7 1059-1311 Google Scholar
N. Roche-Labarbe et al.,
“NIRS-measured oxy- and deoxyhemoglobin changes associated with EEG spike-and-wave discharges in a genetic model of absence epilepsy: the GAERS,”
Epilepsia, 51
(8), 1374
–1384
(2010). http://dx.doi.org/10.1111/j.1528-1167.2010.02574.x EPILAK 0013-9580 Google Scholar
D. K. Nguyen et al.,
“Noninvasive continuous functional near-infrared spectroscopy combined with electroencephalography recording of frontal lobe seizures,”
Epilepsia, 54
(2), 331
–340
(2013). http://dx.doi.org/10.1111/epi.2013.54.issue-2 EPILAK 0013-9580 Google Scholar
P. Pouliot et al.,
“Nonlinear hemodynamic responses in human epilepsy: a multimodal analysis with fNIRS-EEG and fMRI-EEG,”
J. Neurosci. Methods, 204
(2), 326
–340
(2012). http://dx.doi.org/10.1016/j.jneumeth.2011.11.016 JNMEDT 0165-0270 Google Scholar
J. EngelJr.,
“Mesial temporal lobe epilepsy: what have we learned?,”
Neuroscientist, 7
(4), 340
–352
(2001). http://dx.doi.org/10.1177/107385840100700410 NROSFJ 1073-8584 Google Scholar
S. S. Spencer,
“When should temporal-lobe epilepsy be treated surgically?,”
Lancet Neurol., 1
(6), 375
–382
(2002). http://dx.doi.org/10.1016/S1474-4422(02)00163-1 LNAEAM 1474-4422 Google Scholar
A. Fujimoto et al.,
“False lateralization of mesial temporal lobe epilepsy by noninvasive neurophysiological examinations,”
Neurol. Med. Chir. (Tokyo), 46
(10), 518
–521
(2006). http://dx.doi.org/10.2176/nmc.46.518 0470-8105 Google Scholar
A. Gallagher et al.,
“Non-invasive pre-surgical investigation of a 10 year-old epileptic boy using simultaneous EEG-NIRS,”
Seizure, 17
(6), 576
–582
(2008). http://dx.doi.org/10.1016/j.seizure.2008.01.009 SEIZE7 1059-1311 Google Scholar
D. Tsuzuki and I. Dan,
“Spatial registration for functional near-infrared spectroscopy: from channel position on the scalp to cortical location in individual and group analyses,”
Neuroimage, 85
(Pt 1), 92
–103
(2014). http://dx.doi.org/10.1016/j.neuroimage.2013.07.025 NEIMEF 1053-8119 Google Scholar
V. Jurcak, D. Tsuzuki and I. Dan,
“10/20, 10/10, and 10/5 systems revisited: their validity as relative head-surface-based positioning systems,”
Neuroimage, 34
(4), 1600
–1611
(2007). http://dx.doi.org/10.1016/j.neuroimage.2006.09.024 NEIMEF 1053-8119 Google Scholar
M. Okamoto et al.,
“Three-dimensional probabilistic anatomical cranio-cerebral correlation via the international 10–20 system oriented for transcranial functional brain mapping,”
Neuroimage, 21
(1), 99
–111
(2004). http://dx.doi.org/10.1016/j.neuroimage.2003.08.026 NEIMEF 1053-8119 Google Scholar
M. Okamoto and I. Dan,
“Automated cortical projection of head-surface locations for transcranial functional brain mapping,”
Neuroimage, 26
(1), 18
–28
(2005). http://dx.doi.org/10.1016/j.neuroimage.2005.01.018 NEIMEF 1053-8119 Google Scholar
A. K. Singh et al.,
“Spatial registration of multichannel multi-subject fNIRS data to MNI space without MRI,”
Neuroimage, 27
(4), 842
–851
(2005). http://dx.doi.org/10.1016/j.neuroimage.2005.05.019 NEIMEF 1053-8119 Google Scholar
D. Tsuzuki et al.,
“Virtual spatial registration of stand-alone fNIRS data to MNI space,”
Neuroimage, 34
(4), 1506
–1518
(2007). http://dx.doi.org/10.1016/j.neuroimage.2006.10.043 NEIMEF 1053-8119 Google Scholar
D. Tsuzuki et al.,
“Stable and convenient spatial registration of stand-alone NIRS data through anchor-based probabilistic registration,”
Neurosci. Res., 72
(2), 163
–171
(2012). http://dx.doi.org/10.1016/j.neures.2011.10.008 JNREDK 0360-4012 Google Scholar
D. W. Shattuck et al.,
“Construction of a 3D probabilistic atlas of human cortical structures,”
Neuroimage, 39
(3), 1064
–1080
(2008). http://dx.doi.org/10.1016/j.neuroimage.2007.09.031 NEIMEF 1053-8119 Google Scholar
P. D. Williamson et al.,
“Characteristics of medial temporal lobe epilepsy: II. Interictal and ictal scalp electroencephalography, neuropsychological testing, neuroimaging, surgical results, and pathology,”
Ann. Neurol., 34
(6), 781
–787
(1993). http://dx.doi.org/10.1002/(ISSN)1531-8249 ANNED3 0364-5134 Google Scholar
Y. Sakai et al.,
“Localization of epileptogenic zone in temporal lobe epilepsy by ictal scalp EEG,”
Seizure, 11
(3), 163
–168
(2002). http://dx.doi.org/10.1053/seiz.2001.0603 SEIZE7 1059-1311 Google Scholar
M. W. Risinger et al.,
“Ictal localization of temporal lobe seizures with scalp/sphenoidal recordings,”
Neurology, 39
(10), 1288
–1293
(1989). http://dx.doi.org/10.1212/WNL.39.10.1288 NEURAI 0028-3878 Google Scholar
A. Maki et al.,
“Spatial and temporal analysis of human motor activity using noninvasive NIR topography,”
Med. Phys., 22
(12), 1997
–2005
(1995). http://dx.doi.org/10.1118/1.597496 MPHYA6 0094-2405 Google Scholar
G. Strangman, D. A. Boas and J. P. Sutton,
“Non-invasive neuroimaging using near-infrared light,”
Biol. Psychi., 52
(7), 679
–693
(2002). http://dx.doi.org/10.1016/S0006-3223(02)01550-0 BIPCBF 0006-3223 Google Scholar
S. S. Spencer et al.,
“Reliability and accuracy of localization by scalp ictal EEG,”
Neurology, 35
(11), 1567
–1575
(1985). http://dx.doi.org/10.1212/WNL.35.11.1567 NEURAI 0028-3878 Google Scholar
G. Alarcon et al.,
“Lateralizing and localizing values of ictal onset recorded on the scalp: evidence from simultaneous recordings with intracranial foramen ovale electrodes,”
Epilepsia, 42
(11), 1426
–1437
(2001). http://dx.doi.org/10.1046/j.1528-1157.2001.46500.x EPILAK 0013-9580 Google Scholar
A. Gallagher et al.,
“Near-infrared spectroscopy as an alternative to the Wada test for language mapping in children, adults and special populations,”
Epileptic Disord., 9
(3), 241
–255
(2007). 1294-9361 Google Scholar
M. Y. Chung et al.,
“Temporal lobectomy and independent bitemporal interictal activity: what degree of lateralization is sufficient?,”
Epilepsia, 32
(2), 195
–201
(1991). http://dx.doi.org/10.1111/epi.1991.32.issue-2 EPILAK 0013-9580 Google Scholar
V. Osharina et al.,
“Local hemodynamic changes preceding interictal spikes: a simultaneous electrocorticography (ECoG) and near-infrared spectroscopy (NIRS) analysis in rats,”
Neuroimage, 50
(2), 600
–607
(2010). http://dx.doi.org/10.1016/j.neuroimage.2010.01.009 NEIMEF 1053-8119 Google Scholar
S. Harris et al.,
“Contralateral dissociation between neural activity and cerebral blood volume during recurrent acute focal neocortical seizures,”
Epilepsia, 55
(9), 1423
–1430
(2014). http://dx.doi.org/10.1111/epi.2014.55.issue-9 EPILAK 0013-9580 Google Scholar
N. R. Kreisman et al.,
“Oxidative metabolic responses with recurrent seizures in rat cerebral cortex: role of systemic factors,”
Brain Res., 218
(1–2), 175
–188
(1981). http://dx.doi.org/10.1016/0006-8993(81)91299-3 BRREAP 1385-299X Google Scholar
N. R. Kreisman, T. J. Sick and M. Rosenthal,
“Concepts of brain oxygen sufficiency during seizures,”
Adv. Exp. Med. Biol., 180 381
–392
(1984). http://dx.doi.org/10.1007/978-1-4684-4895-5 AEMBAP 0065-2598 Google Scholar
M. Zhao et al.,
“Focal increases in perfusion and decreases in hemoglobin oxygenation precede seizure onset in spontaneous human epilepsy,”
Epilepsia, 48
(11), 2059
–2067
(2007). http://dx.doi.org/10.1111/epi.2007.48.issue-11 EPILAK 0013-9580 Google Scholar
A. Nehlig et al.,
“Absence seizures induce a decrease in cerebral blood flow: human and animal data,”
J. Cereb. Blood Flow Metab., 16
(1), 147
–155
(1996). http://dx.doi.org/10.1097/00004647-199601000-00017 JCBMDN 0271-678X Google Scholar
T. J. Germon et al.,
“Sensitivity of near infrared spectroscopy to cerebral and extra-cerebral oxygenation changes is determined by emitter-detector separation,”
J. Clin. Monit. Comput., 14
(5), 353
–360
(1998). http://dx.doi.org/10.1023/A:1009957032554 IJMCEJ 0167-9945 Google Scholar
S. Kohri et al.,
“Quantitative evaluation of the relative contribution ratio of cerebral tissue to near-infrared signals in the adult human head: a preliminary study,”
Physiol. Meas., 23
(2), 301
–312
(2002). http://dx.doi.org/10.1088/0967-3334/23/2/306 PMEAE3 0967-3334 Google Scholar
H. Obrig et al.,
“Spontaneous low frequency oscillations of cerebral hemodynamics and metabolism in human adults,”
Neuroimage, 12
(6), 623
–639
(2000). http://dx.doi.org/10.1006/nimg.2000.0657 NEIMEF 1053-8119 Google Scholar
V. Toronov et al.,
“Near-infrared study of fluctuations in cerebral hemodynamics during rest and motor stimulation: temporal analysis and spatial mapping,”
Med. Phys., 27
(4), 801
–815
(2000). http://dx.doi.org/10.1118/1.598943 MPHYA6 0094-2405 Google Scholar
Y. Tong and B. D. Frederick,
“Time lag dependent multimodal processing of concurrent fMRI and near-infrared spectroscopy (NIRS) data suggests a global circulatory origin for low-frequency oscillation signals in human brain,”
Neuroimage, 53
(2), 553
–564
(2010). http://dx.doi.org/10.1016/j.neuroimage.2010.06.049 NEIMEF 1053-8119 Google Scholar
H. Yanagisawa et al.,
“Acute moderate exercise elicits increased dorsolateral prefrontal activation and improves cognitive performance with Stroop test,”
Neuroimage, 50
(4), 1702
–1710
(2010). http://dx.doi.org/10.1016/j.neuroimage.2009.12.023 NEIMEF 1053-8119 Google Scholar
H. Dan et al.,
“Language-specific cortical activation patterns for verbal fluency tasks in Japanese as assessed by multichannel functional near-infrared spectroscopy,”
Brain Lang., 126
(2), 208
–216
(2013). http://dx.doi.org/10.1016/j.bandl.2013.05.007 0093-934X Google Scholar
M. Takeuchi et al.,
“Brain cortical mapping by simultaneous recording of functional near infrared spectroscopy and electroencephalograms from the whole brain during right median nerve stimulation,”
Brain Topogr., 22
(3), 197
–214
(2009). http://dx.doi.org/10.1007/s10548-009-0109-2 BRTOEZ 0896-0267 Google Scholar
T. Yamada, S. Umeyama and K. Matsuda,
“Separation of fNIRS signals into functional and systemic components based on differences in hemodynamic modalities,”
PLoS One, 7
(11), e50271
(2012). http://dx.doi.org/10.1371/journal.pone.0050271 1932-6203 Google Scholar
L. Gagnon et al.,
“Short separation channel location impacts the performance of short channel regression in NIRS,”
Neuroimage, 59
(3), 2518
–2528
(2012). http://dx.doi.org/10.1016/j.neuroimage.2011.08.095 NEIMEF 1053-8119 Google Scholar
S. Umeyama and T. Yamada,
“New method of estimating wavelength-dependent optical path length ratios for oxy- and deoxyhemoglobin measurement using near-infrared spectroscopy,”
J. Biomed. Opt., 14
(5), 054038
(2009). http://dx.doi.org/10.1117/1.3253350 JBOPFO 1083-3668 Google Scholar
T. Yamada, S. Umeyama and K. Matsuda,
“Multidistance probe arrangement to eliminate artifacts in functional near-infrared spectroscopy,”
J. Biomed. Opt., 14
(6), 064034
(2009). http://dx.doi.org/10.1117/1.3275469 JBOPFO 1083-3668 Google Scholar
T. Funane et al.,
“Quantitative evaluation of deep and shallow tissue layers’ contribution to fNIRS signal using multi-distance optodes and independent component analysis,”
Neuroimage, 85
(Pt 1), 150
–165
(2014). http://dx.doi.org/10.1016/j.neuroimage.2013.02.026 NEIMEF 1053-8119 Google Scholar
BiographyEdmi Edison Rizki received his medical degree from Andalas University, Indonesia, in 2010. Currently, he is a PhD student in the Department of Neurosurgery, Jichi Medical University in Tochigi, Japan. His research focuses on neuroimaging studies for presurgical evaluation of epilepsy. Minako Uga received her BSc and MSc degrees in engineering from Sophia University in 1992 and 1994, and received her MS and PhD degrees in medical sciences from the University of Tsukuba in 2005 and 2010, respectively. She is a postdoctoral fellow at Jichi Medical University, Japan. Her current research interests include development of functional near-infrared spectroscopy (fNIRS) methodology and adaptation to the brain science research of miniature pigs as laboratory animals. Ippeita Dan graduated from International Christian University (1993) and received his PhD from the University of Tokyo (2002). He was a senior research fellow at the National Food Research Institute and an associate professor at Jichi Medical University. He was appointed as a professor at Chuo University. He has authored 80 peer-reviewed articles, attracting 3000 citations. His main research missions lie in clinical application and methodological development of fNIRS and application of psychometrics for marketing in food-related business. Haruka Dan received her MA degree from International Christian University in 2001 and her PhD from Tohoku University in 2005. She was a postdoctoral fellow at the National Food Research Institute and Jichi Medical University. She is now a visiting assistant professor of Research and Development Initiatives at Chuo University, Japan. She has authored 32 peer-reviewed scientific articles, including 20 top-authored contributions over various topics, such as plant physiology, behavioral food science, and cognitive neuroscience. Daisuke Tsuzuki received his BA and MA degrees from Nihon University in 2000 and 2002, and his PhD from the University of Tsukuba, Japan, in 2012. He was a research resident (2011 to 2012) and postdoctoral fellow (2012 to 2013) at Jichi Medical University. Currently, he is an assistant professor in the Research and Development Initiatives, Chuo University. His research interests include studies on computer science, information visualization, and spatial analysis of brain function. Hidenori Yokota received his MD from Asahikawa Medical College in 1988 and his PhD from Jichi Medical College, Japan, in 2000. His major career achievements include being assistant professor in the Department of Neurosurgery at Jichi Medical University and research fellow at Albert Einstein Medical College, New York. Currently, he is an assistant professor in the Department of Neurosurgery at Jichi Medical University, Japan. He is known for his work as an epilepsy surgeon. Keiji Oguro received his MD from Asahikawa Medical University in 1984 and his PhD from Jichi Medical University in 1992. His major career achievements include being a visiting assistant professor in the Department of Neuroscience, Albert Einstein College of Medicine. Currently, he is an associate professor in the Department of Neurosurgery at Jichi Medical University. He is known for his work as an epilepsy surgeon and as a researcher in the field of basic mechanisms of epilepsy. Eiju Watanabe received his MD in 1976 and his PhD in 1984 from the University of Tokyo. Formerly he was the research fellow at the University of Erlangen and chairman of the Department of Neurosurgery at Tokyo Metropolitan Police Hospital. He is currently a professor and the chairman of the Department of Neurosurgery at Jichi Medical University, Japan. He is known for his work as an inventor of a neuronavigation system and an initiator of fNIRS imaging known as optical topography. |