
|
|
1.IntroductionMonitoring changes of free intracellular calcium ion concentration in living neurons offers a valuable window on calcium-dependent processes within the cell. It can also provide a surrogate readout of electrical activity, as membrane depolarization by action potentials or sufficiently large graded potentials opens voltage-gated calcium channels, resulting in calcium influx. During synaptic transmission, calcium ions can enter the postsynaptic cell through calcium-permeable receptors such as -methyl-d-aspartate and alpha7 nicotinic receptors. In addition, calcium-induced calcium release from intracellular stores can substantially amplify calcium transients.1 Since the proportional change of free cytosolic concentration during electrical activation is commonly larger for calcium than for other ions, calcium sensors are particularly attractive for imaging neuronal activity. Importantly, to monitor neuronal calcium signaling in a network of cells or in subcellular compartments, GECIs have great advantages compared with synthetic, extrinsic indicators. In particular, with GECIs, investigators can target specific populations of neurons or subcellular organelles when sensors are expressed under the control of cell type-specific promoters2 or as appropriate fusion proteins,3 respectively, and can control the specific timing of expression while also eliminating the need for loading cells with extrinsic indicators. Since the development of the first GECIs, various strategies have been used to generate more useful tools for optical imaging of neuronal activity. GECIs described to date include aequorin-based reporters,4,5 ratiometric fluorescence (Förster) resonance energy transfer-based indicators6 and single fluorescent protein (FP)-based calcium sensors.7 Single-wavelength GECIs typically consist of a calcium-binding element (e.g., calmodulin or its fragments) inserted into an FP such as green fluorescent protein (GFP) or its variants. Currently, the growing G-CaMP family of GECIs is the most widely used of the genetically encoded calcium probes (e.g., Refs. 3, 89.10.11.–12). Over the past decade, successive generations of these high affinity calcium indicators have yielded progressively better signal-to-noise ratio, dynamic range, and kinetics than their predecessors.13,14 The first G-CaMP, developed by Nakai et al.,15 was based on circularly permuted enhanced GFP and displayed a fivefold increase in fluorescence intensity upon calcium binding. This sensor, however, was pH sensitive, required temperatures below 37°C for best folding and was suboptimal for measurements in the micromolar calcium concentration range.15 It was followed by the development of successive variants: G-CaMP2,16 GCaMP3,17 “hyper-sensitive” GCaMP-HS,10 G-CaMP4,18 GCaMP5,19 two variants numbered “6” (GCaMP6 from Janelia Farm,20 and G-CaMP6 from Saitama University21), G-CaMP8, and G-CaMP7.11,21 G-CaMPs have been successfully expressed and used to detect calcium transients in a wide variety of cells and tissues, including HEK cells and mouse myotubes,15 chemosensory neurons of worms, antennal lobe neurons of flies, mouse somatosensory cortex neurons17 and place cells,9 and zebrafish spinal motor neurons.10 Directed evolution of the GCaMP3 sensor has yielded improved green, blue, and red intensiometric and ratiometric indicators referred to as genetically encoded calcium indicators for optical imaging (GECOs22). The enhanced green probe (G-GECO) was reported to display approximately twice the calcium-dependent fluorescence change of GCaMP3.22 The availability of G-GECO, blue-GECO (B-GECO), and red-GECO (R-GECO) has enabled simultaneous multicolor calcium imaging in three subcellular compartments of HeLa cells.22 While the catalog of available GECIs is steadily growing (e.g., Ref. 23), many newly developed sensors that appear promising in vitro or in model cells have performed less well in vertebrate neurons in organized brain tissue using two-photon excitation for improved depth penetration. We, therefore, set out to test and compare the two-photon performance of GECIs from both G-CaMP and GECO families in rat organotypic hippocampal slices. Action potentials were evoked in CA1 pyramidal neurons by direct current injection. Two-photon excitation wavelengths were selected for each probe to obtain maximum fractional changes in intensity in response to action potentials. Subsequently, we monitored calcium transients in proximal apical dendrites in response to increasing numbers of action potentials via line-scans. Responses were recorded and compared from neurons expressing either GCaMP3, GCaMP6f, G-CaMP7, G-GECO1.0, 1.1, 1.2, B-GECO, R-GECO, Rex-GECO0.9, Rex-GECO1, CAR-GECO, O-GECO, or yellow-GECO1s (Y-GECO1s). 2.Materials and Methods2.1.PreparationTransverse organotypic hippocampal slices () were made from brains of Wistar rat pups aged 6 to 8 postnatal days and cultured on Millicell CM membranes for 5 to 6 days prior to transfection as described previously.1,24 GECIs constructs were verified by DNA sequencing and introduced into target cells by biolistic (“gene-gun”) transfection.25 Briefly, complementary DNAs encoding all GECIs were placed under cytomegalovirus (CMV) promoter, except for Rex-GECO0.9, Rex-GECO1, and Y-GECO, which used the human synapsin I promoter, as a CMV promoter yielded inadequate expression with these sensors (Table 1). Mammalian expression plasmids for all GECIs were constructed using pcDNA32 (Life Technologies). Most GECIs were too dim at resting conditions for reliable identification of expressing cells. To facilitate identification of transfected cells, GCaMPs and GECOs with dim basal fluorescence (all except GCaMP3 and GCaMP6f) were cotransfected with spectrally distinct cytoplasm-filling markers, i.e., blue fluorescent protein (BFP) or GFP, as indicated in Table 2. GECI plasmid DNA (), mixed with an equal amount of cytoplasmic FP vector DNA (total of DNA) as required, was coated on gold particles.25,26 GECI plasmid DNAs were delivered to organotypic hippocampal slices after five to six days in vitro by biolistics using a pressure of 120 psi with a customized barrel at a distance of 4 cm above the slice through a Millipore filter membrane ( pore size) directly above the target. Imaging was carried out 1 to 4 days post-transfection. Table 1Measured fluorescence on- and reported off-kinetics, reported Kd for Ca2+, promoters used for each GECI, and references.
Table 2Optimal two-photon excitation wavelengths, specifications and references for each genetically encoded calcium indicator (GECI).
Prior to imaging, slice preparations were transferred to the recording chamber for at least 30 min, where they were superfused with oxygenated ( gas mixture) artificial cerebrospinal fluid (ACSF) at 30 to 32°C. The ACSF contained, in mM: 120 NaCl, 3 KCl, 2 , 4 , 1.2 , 23 , 11 glucose. 2.2.Imaging and ElectrophysiologySlices were viewed on an upright focusing-nosepiece epifluorescence microscope (Olympus, BX51WI) using a NA 1.0 IR water immersion objective (Olympus) and an MRC1024MP laser scanner (Bio-Rad Microscience, Hemel Hempstead, United Kingdom) with nondescanned photomultiplier tube detectors. Available two-photon excitation wavelengths ranged between 710 to 970 nm (coherent MIRA or Spectra-Physics MaiTai titanium:sapphire laser). Average energy levels measured at the specimen plane were 17 mW at 710 nm, 33 mW at 800 nm, and 10.5 mW at 970 nm. Specific excitation wavelengths used for each sensor are listed in Table 2. Pyramidal cells expressing GECIs in the CA1 region were identified by single-photon widefield epifluorescence and impaled under visual control with sharp microelectrodes (60 to ) filled with 3 M KCl in 20 mM 2-[4-(2-hydroxyethyl)piperazin-1-yl]ethanesulfonic acid. Electrophysiological data were acquired and analyzed using AxoGraph software (AxoGraph Scientific, Sydney, Australia), and images were collected and analyzed using LaserSharp (Bio-rad Microscience) and ImageJ29 software. In brief, one or more action potentials were evoked by 8 ms, 600 to 1200 pA current injections at 100 Hz via the intracellular electrode. Ten line scan images (each extending over 400 to 500 ms) were collected for each stimulus condition (one to eight action potentials) from two to five cells. Calcium transients were measured by collecting line scans across the proximal apical dendrite and expressed as a percent fractional change in fluorescence: , where is the mean fluorescence intensity of the imaged cell over a 70 ms period prior to stimulation, and was measured over 330 ms for one to four action potentials and 430 ms for eight action potentials (Fig. 1). Fig. 1Simultaneous calcium imaging and electrophysiological recordings. (a) G-CaMP7 expressing CA1 pyramidal neuron; location of line scan is indicated by the white line across the proximal apical dendrite. Increasing fluorescence intensity in this and the following line scan images is represented by colors from black through red and yellow to green, blue and purple. (b) Representative line scans during one action potential and (c) eight action potentials with GECO1.2. The vertical white lines in (b) and (c) and corresponding deflections in (d) and (e) are time stamps, the first indicating the start of current injection, and the second, 50 ms later, serving as an internal time marker. Traces above the line scans show the simultaneously recorded action potentials on the same time scale; these are visible in more detail in panels (f) and (g). (d) and (e) Quantifications of line scans: (d) one action potential and (e) eight action potentials. axis shows time, axis shows values. Traces are representations of single line scans. (f) and (g) Simultaneously recorded membrane potentials showing one or eight action potentials. 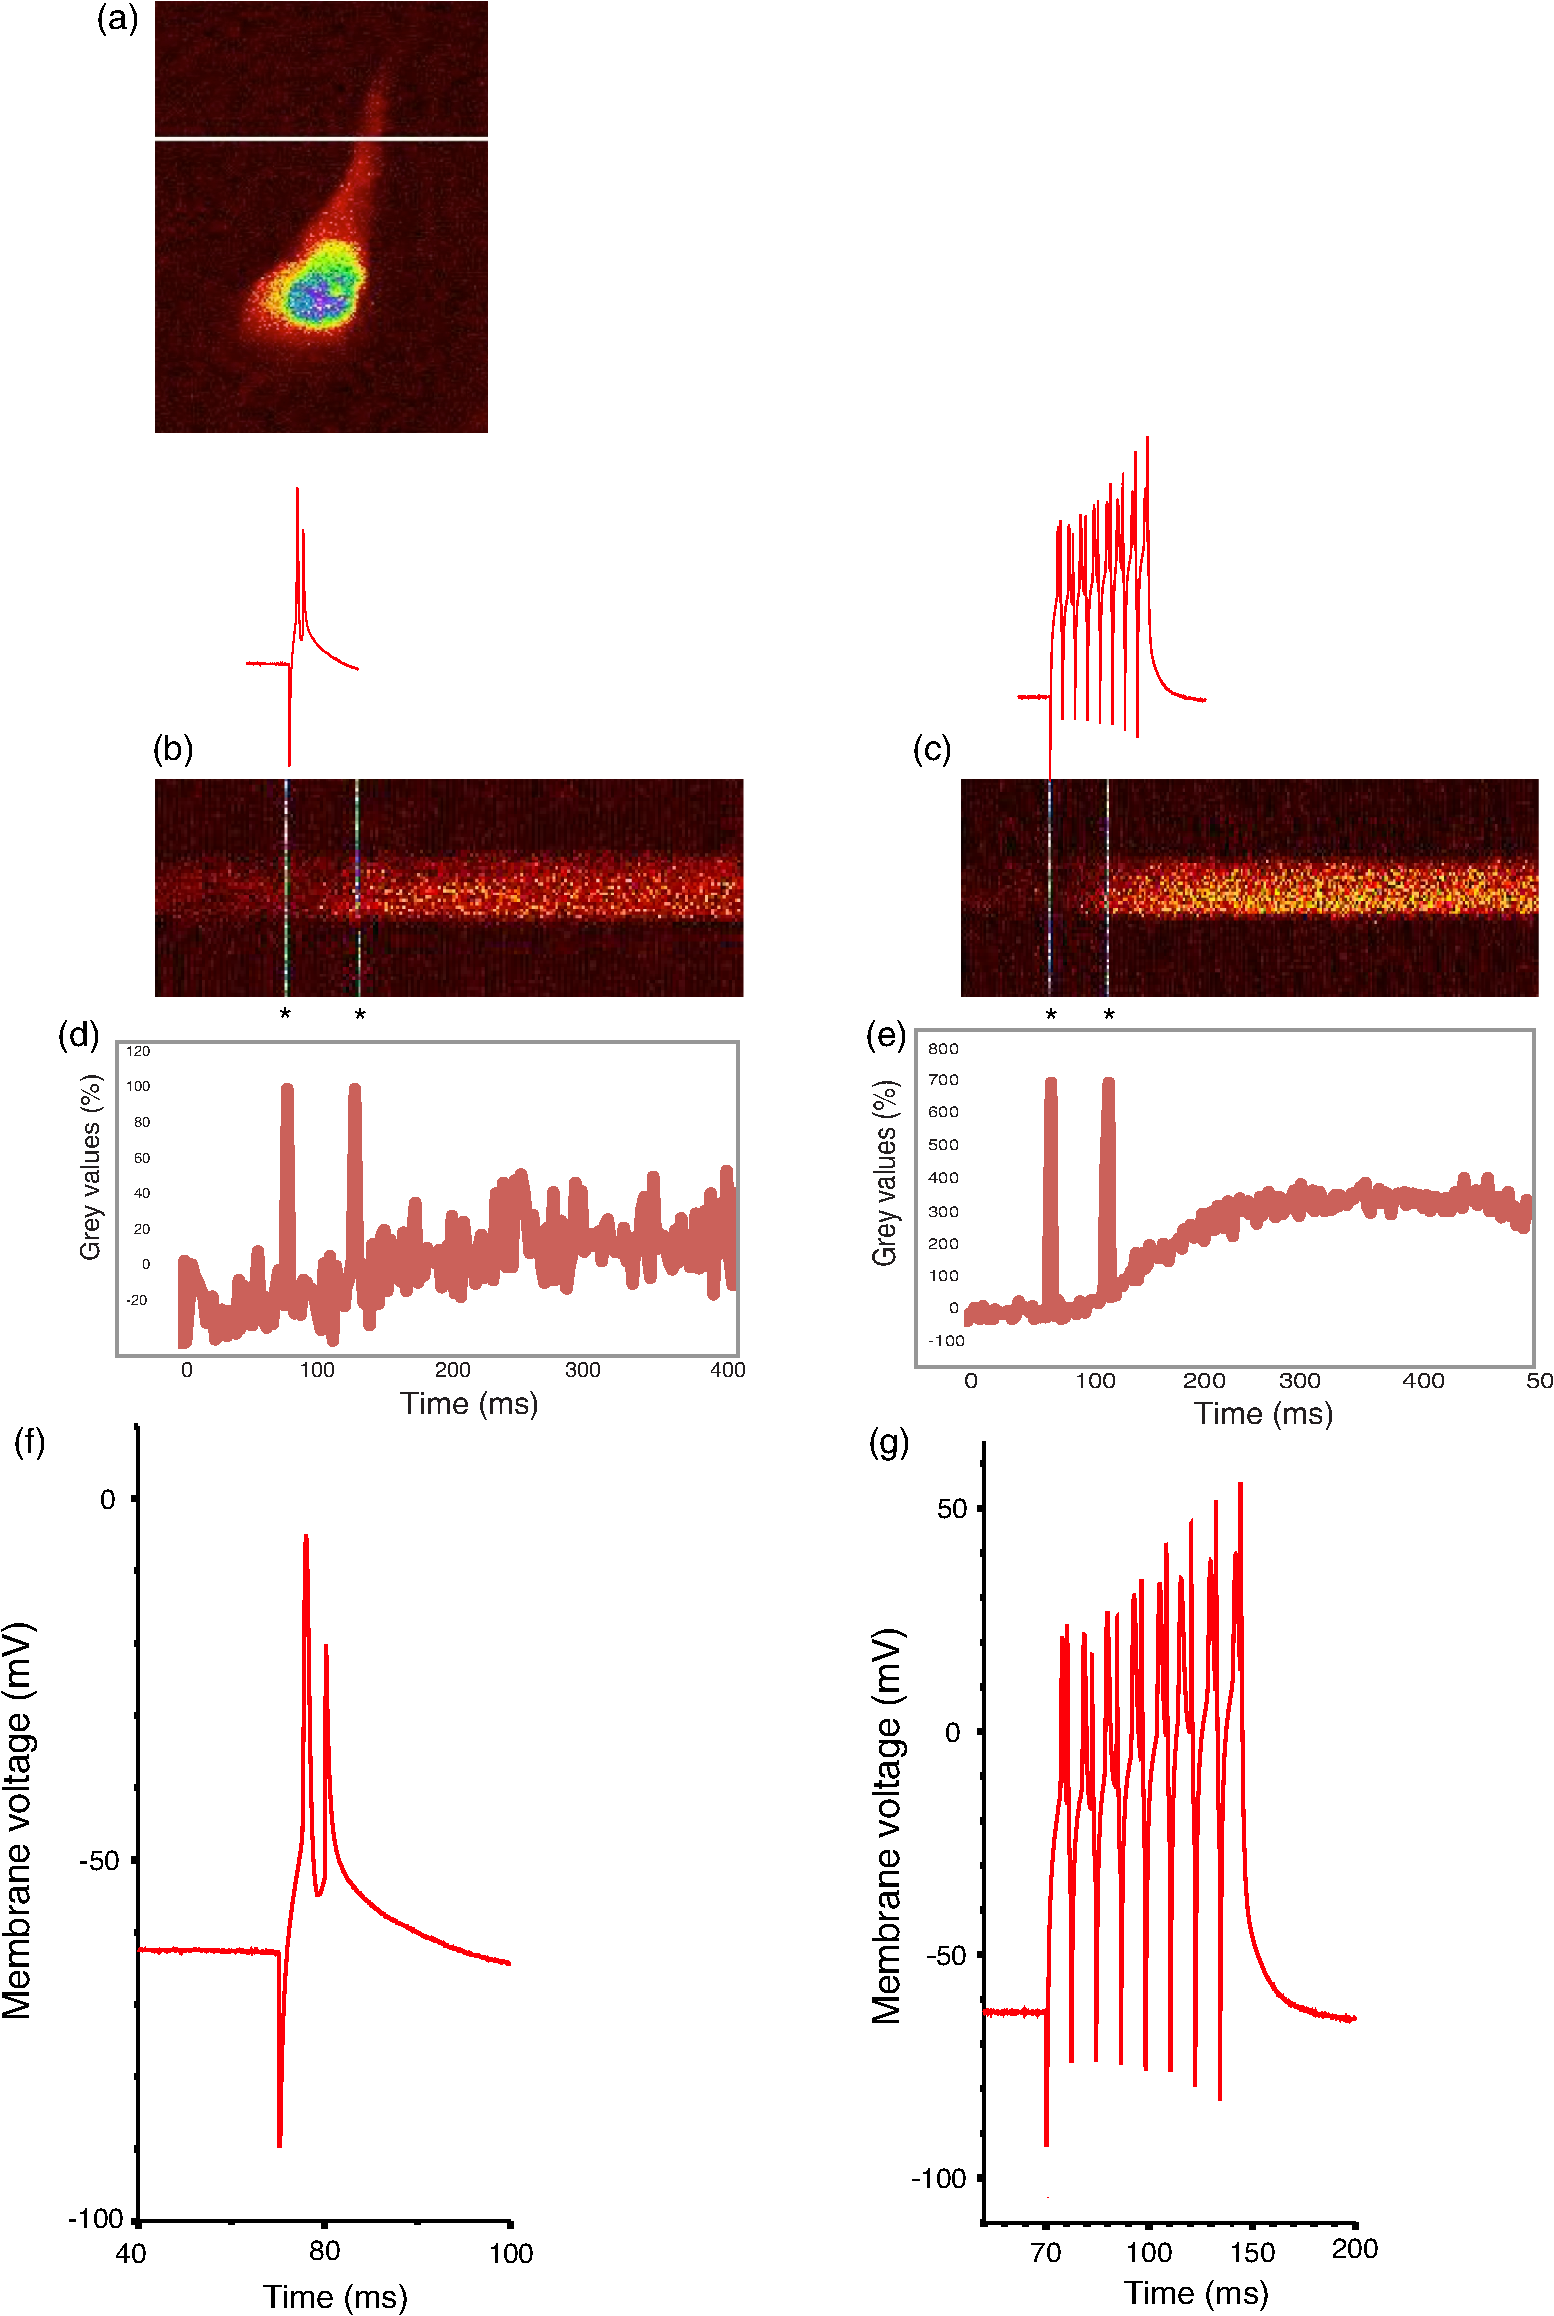 3.Results3.1.Expression and Basal Fluorescence of GECIsOf the sensors tested here, GCaMP3 had the brightest fluorescence at resting calcium levels, which allowed for reliable detection of expressing cells. GCaMP6f also displayed adequate basal fluorescence for identification of transfected cells. Cotransfection with bright spectrally distinct cytoplasmic markers, such as BFP and GFP, was required for all other sensors tested (Table 2) in order to identify transfected cells. Expressing R-GECO in CA1 pyramidal cells often resulted in bright punctate, rather than diffuse, fluorescence throughout the cell; although unique to R-GECO among the sensors tested here, this pattern is a common phenomenon with red FPs.30,31 Our reported comparison for each indicator is based on the values of fractional change in fluorescence and is, therefore, independent of the different excitation energies available at different optimized wavelengths. We found that the optimal wavelengths (over the range available with our laser) for maximal fractional change in intensity in response to action potentials for various GECIs were as follows: 910 nm for GCaMP3, G-CaMP7, and G-GECO 1.0, 1.1 and 1.2; 930 nm for GCaMP6f; 800 nm for B-GECO; 888 nm for R-GECO, Rex-GECO0.9, and Rex-GECO1; 970 nm for CAR-GECO and O-GECO; and 810 nm for Y-GECO1s (Table 2). (When imaging Y-GECO1s with 520 nm single-photon excitation or with 990 nm two-photon excitation, the fluorescence of resting cells is bright but decreases as ambient calcium ion concentration increases.28 Conversely, with 410 nm single-photon excitation or with two-photon excitation below 850 nm, the resting fluorescence is dimmer but increases in proportion to the calcium ion concentration.28) 3.2.Comparison of the two-photon performances of selected G-CaMPs and GECOs as demonstrated by their ability to report apical dendritic calcium transients associated with action potentialsAfter optimizing the excitation wavelength for each GECI, fluorescence responses to one, two, three, four, and eight action potentials were determined. In general, G-CaMPs detected low numbers of action potentials (one to four) more reliably than GECOs. Of the sensors tested here, G-CaMP7, GCaMP6f, and G-GECO1.2 were able to detect single action potentials with high reliability (Fig. 2). Fig. 2(a) Summary of changes in fluorescence intensity corresponding to one to eight action potentials at 100 Hz for all GCaMPs and GECOs tested. (b) Summary of changes in fluorescence intensity corresponding to one to eight action potentials at 100 Hz for all genetically encoded calcium indicators tested, excluding GCaMP6f and G-CaMP7. (c) Summary of changes in fluorescence intensity corresponding to one to eight action potentials at 100 Hz for blue-, orange-, carmine-, red-, and yellow-GECOs. Each data point corresponds to measurements from multiple neurons. Error bars represent standard error of the mean. 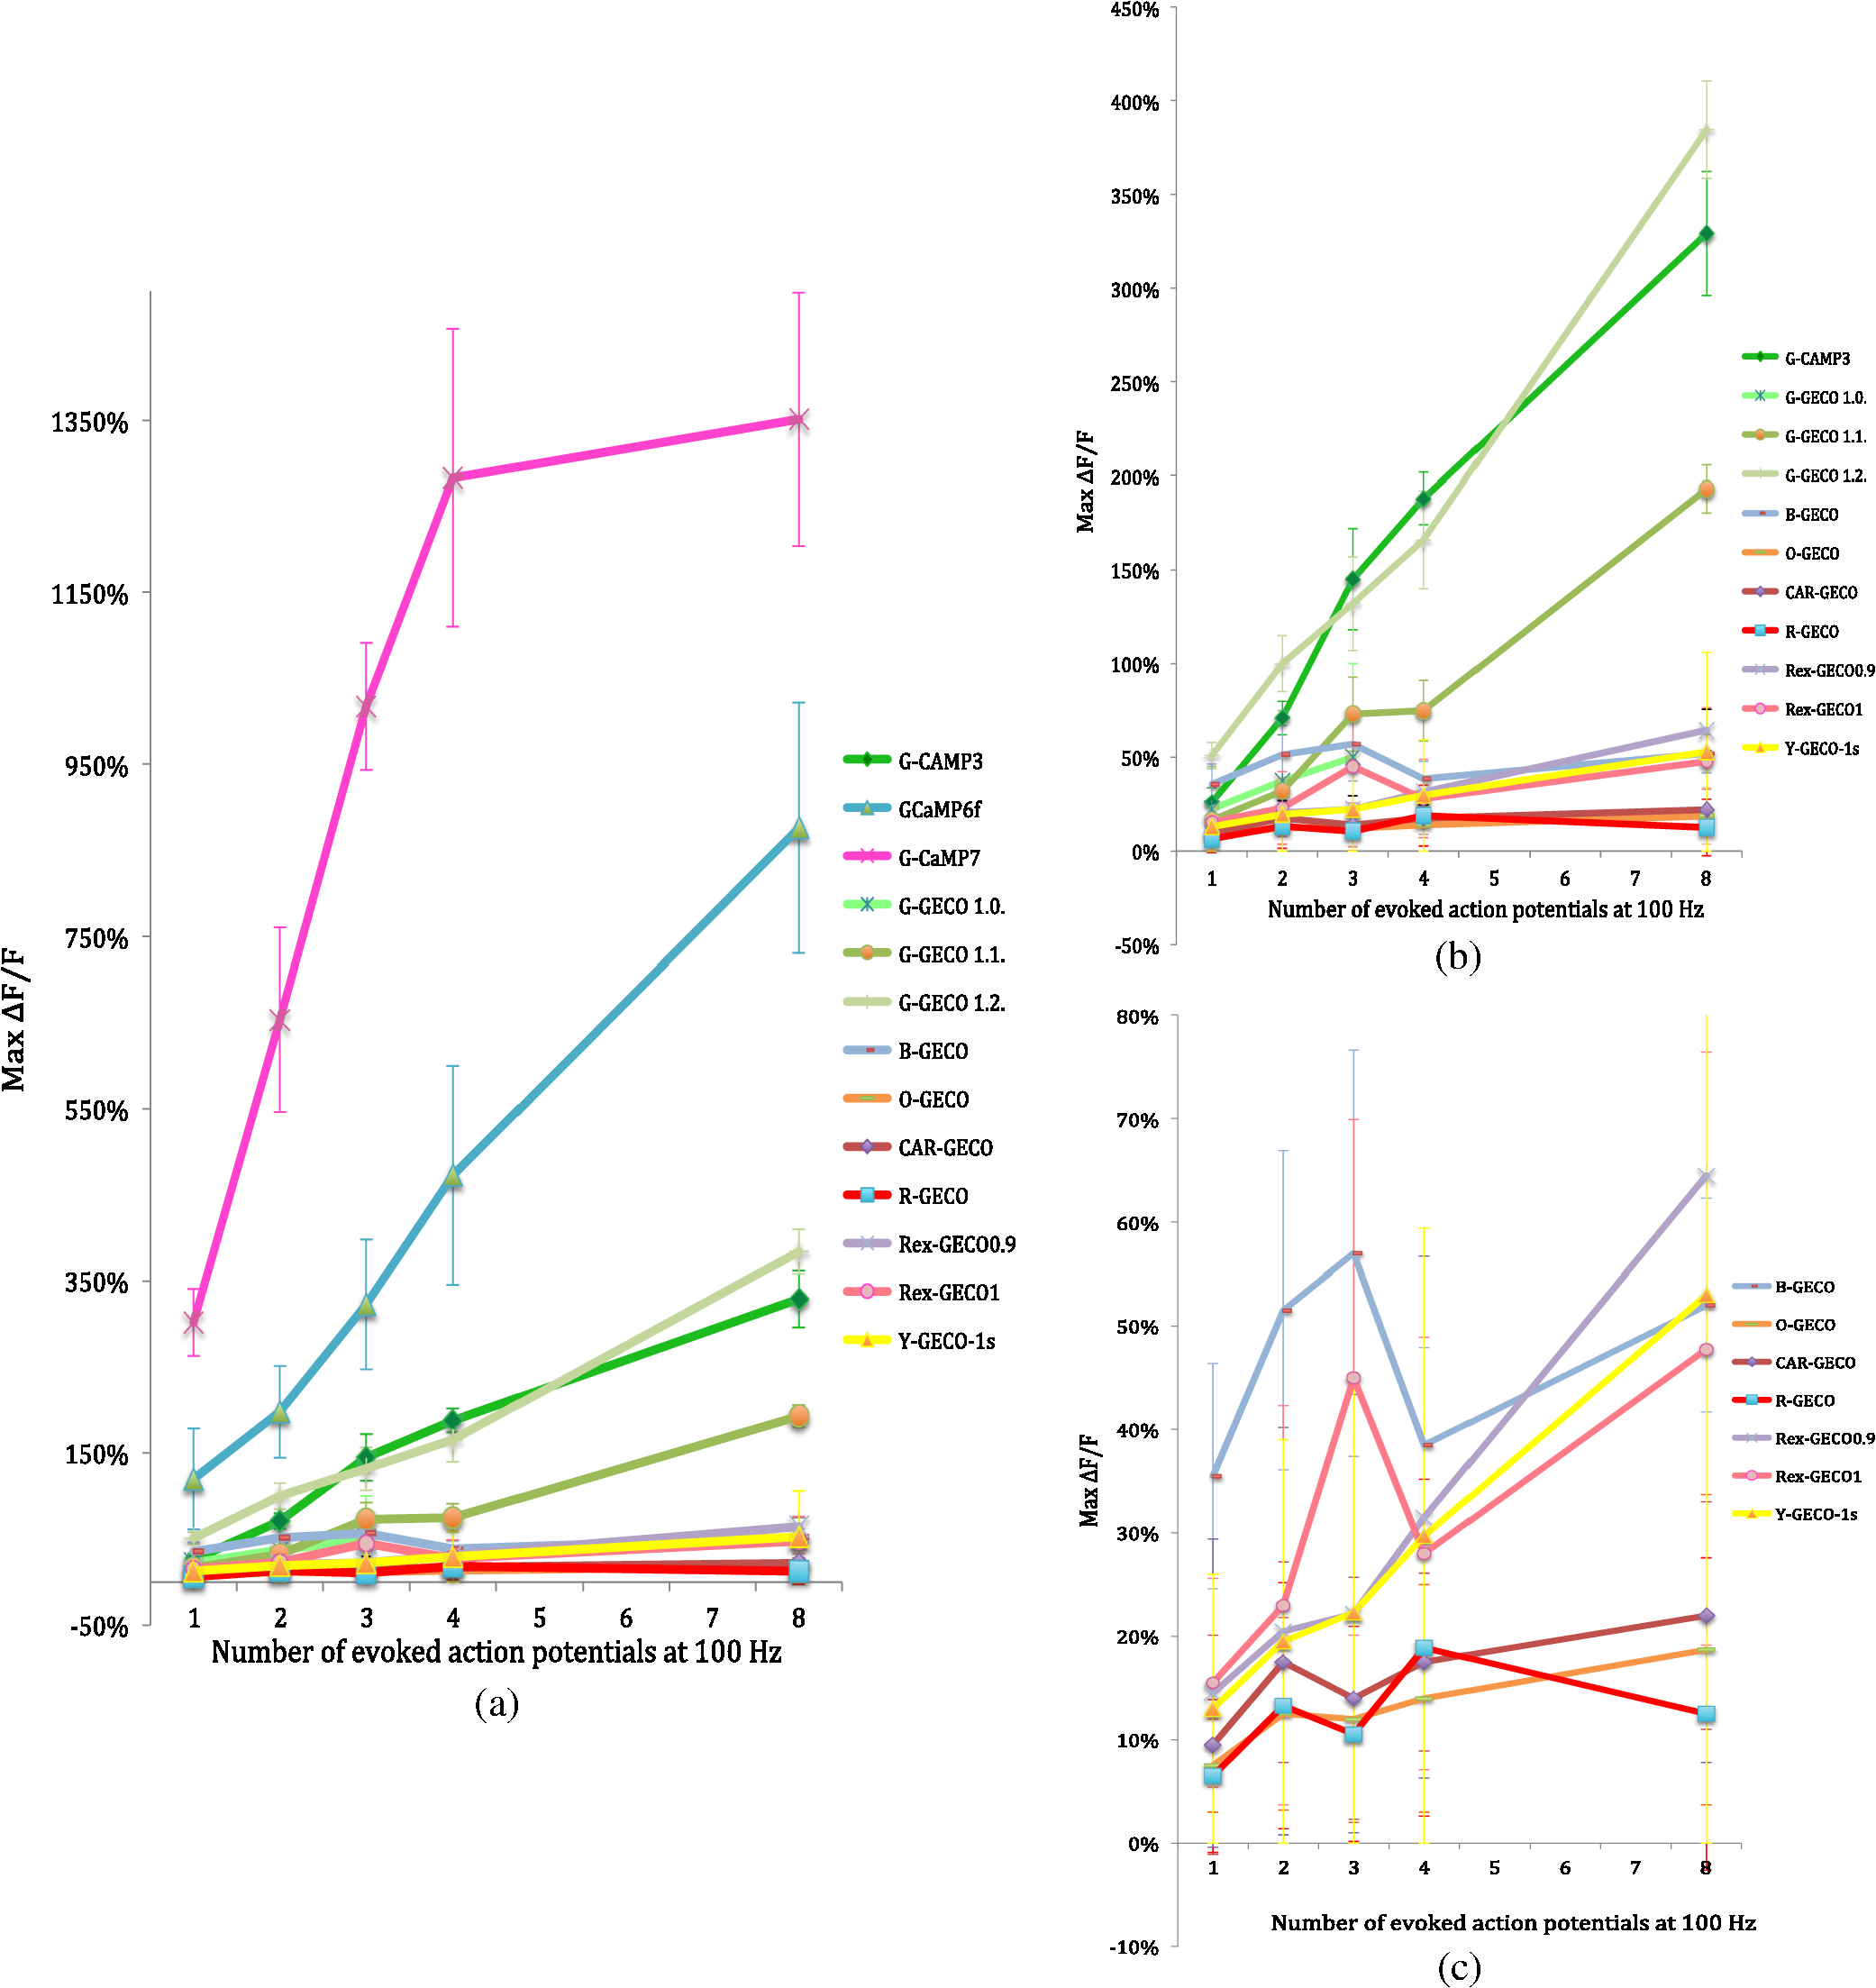 Fluorescence changes from G-CaMPs in response to a single action potential were (all values standard error of the mean) with GCaMP3, with GCaMP6f, and with G-CaMP7 [Fig. 2(a)]. Among the GECOs, G-GECO1.2 performed best in reporting low numbers of action potentials. The performance of G-GECO1.2 was superior to that of GCaMP3 both in the values and in the linearity of responses to increasing numbers of action potentials [Figs. 2(a) and 2(b)]. G-GECO 1.2 showed a for a single action potential, and for eight action potentials, whereas these values were and for GCaMP3 [Fig. 2(b)]. G-GECO 1.0 and 1.1 displayed smaller fluorescence transients ( and , respectively) than G-GECO 1.2 in response to single action potentials [Fig. 2(b)]. B-GECO demonstrated a fluorescent change upon a single action potential, but the signals saturated beyond three action potentials and the maximal values only reached with eight action potentials [Fig. 2(c)]. Performance of the longer-wavelength GECOs was modest. O-GECO and CAR-GECO performed similarly, with CAR-GECO displaying slightly higher values. The fluorescence transients ranged from to for CAR-GECO in response to one to eight evoked action potentials, respectively, versus from to for O-GECO [Fig. 2(c)]. R-GECO responded with a slight increase in fluorescence of and to a single or eight action potentials, respectively [Fig. 2(c)]. Two other red indicators, Rex-GECO0.9 and Rex-GECO1, displayed greater fluorescence changes than R-GECO. The maximum values in response to eight action potentials were with Rex-GECO0.9 and with Rex-GECO1. Moreover, Rex-GECO0.9 showed a linear increase in values over one to eight action potentials at 100 Hz. On the other hand, Rex-GECO1 fluorescence shows a larger fluorescence increase in response to one to three action potentials. The performance of the yellow sensor, Y-GECO1s, was comparable to that of Rex-GECO0.9 when imaged at 810 nm. Both indicators have similar values as well as linear responses over the range of one to eight action potentials, though Rex-GECO0.9 offers a slightly higher fluorescent response than Y-GECO1s to eight action potentials but is considerably more variable ( versus , respectively). The most robust calcium transients by far were obtained with G-CaMP7, which showed an immense in response to individual action potentials [Fig 2(a)], sufficient to render spontaneous electrical activity clearly visible by eye. Beyond four action potentials at 100 Hz, however, this sensor began to deviate from linearity, and it displayed a change with eight action potentials [Fig. 2(a)]. The G-CaMP7 was significantly larger than those of GCaMP6f over the entire one to eight action potential range (, analysis of variance), but GCaMP6f provided a more linear response over this range with in response to single action potentials and in response to eight action potentials. On- and off-kinetics of all these sensors were too slow to follow individual action potentials reliably at frequencies above approximately 20 Hz, as the fluorescence in general rose with a time constant around 100 ms and decayed with a time constant around 400 to 700 ms, with the exception of Rex-GECO0.9 with and O-GECO with tau-off values (Table 1). Our data acquisition epoch was too short for reliable determination of tau-off values, but our observation that G-CaMP7 fluorescence transients evoked by single action potentials decayed at a rate intermediate between that of GCaMP3 and Rex-GECO0.9 allowed us to estimate that its decay time constant was . Our data did permit determination of tau-on values for all sensors, and these are reported in Table 1. 4.DiscussionG-CaMP7 stands out among the GECIs evaluated here. Using G-CaMP7, Muto et al.11 recently identified direction-selective neurons in the optic tectum of zebrafish, correlating visually evoked neuronal activity with behavior in real time. In the present study, G-CaMP7 was distinctly superior to the other tested indicators in terms of its ability to report action potential-evoked calcium transients [Fig. 2(a)]. The second-most sensitive indicator we tested, GCaMP6f, displayed values only a third as great as G-CaMP7 over the one to four action potential range [Fig. 2(a)]. At eight action potentials, G-CaMP7 values were not quite twice the GCaMP6f values, as G-CaMP7 begins to be saturated in response to more than four action potentials at 100 Hz [Fig. 2(a)]. Of note, the measured and estimated time constants for G-CaMP7 (tau-on, 79 ms; tau-off, , respectively) are only slightly longer than those of GCaMP6f (tau-on, 74 ms; tau-off, 400 ms), which has been considered the fastest GECI for cytoplasmic free calcium in neurons.20 G-CaMP7 would also appear to be superior to the slower GCaMP6 variants GCaMP6s and GCaMP6m, which display values not more than twice as great as GCaMP6f in response to single action potentials.20 Thus, G-CaMP7 may be the GECI of choice at this time for monitoring signals, at least for low rates of action potentials in mammalian neurons. Because signal amplitudes with some GECIs—particularly GCaMP6f, GECO1.2, Rex-GECO0.9, and Y-GECO1s—were more linearly related to the number of spikes at 100 Hz over the tested range [Fig. 2(b)], those sensors may be advantageous for analysis of bursts of firing. An earlier study31 found that neither the G-GECOs nor R-GECO are significantly superior to GCaMP3. We have confirmed this while extending the comparison to blue, orange, carmine, yellow, and two new red GECOs. We find that cells expressing GECOs are, in general, dimmer than cells expressing G-CaMPs under the same promoter, in both the calcium-free and calcium-bound states. It should be noted that the useful wavelength range of the lasers used in this work extended only to 970 nm. It is possible that a laser source with useful output power at higher wavelength may improve the performance of Y-GECO1s, Rex-GECO1, and their derivatives. Nevertheless, these multicolor GECOs can facilitate simultaneous calcium imaging in multiple cellular or subcellular compartments.22 Recent years have witnessed extraordinary advances in genetically encoded fluorescent calcium sensors. Notwithstanding this progress, further improvements are desirable. First, the changes in GECI fluorescence are substantially slower than the actual changes in calcium concentration, which are, in turn, much slower than membrane potential changes during action potentials. This deficiency compromises the ability of these GECIs to resolve individual action potentials at high frequencies. Second, GECIs are not capable of reporting inhibitory synaptic activity or other events that are not associated with a calcium transient. Third, GECIs act as calcium buffers and thus may affect cell functions by interfering with intracellular calcium signaling, particularly after prolonged expression which was accompanied by bright nuclear fluorescence.17 We note, however, that during the course of our experiments, we detected no nuclear accumulation of GECIs. Finally, as most indicators are tested in vitro in model cells or in a variety of model organisms, there is a need for a uniform, standardized basis for comparison among the increasing variety of sensors to help investigators choose the most suitable GECI for their specific requirements. The present study represents a step in that direction. AcknowledgmentsWe thank Yongxin Zhao, Jiahui Wu, and Robert Campbell for the GECO constructs and Alexander Goroshkov for technical assistance. This work was supported by grants from the Canadian Institutes of Health Research, Alzheimer Society of Canada, and Natural Sciences and Engineering Research Council of Canada. ReferencesN. Emptage, T. V. P. Bliss and A. Fine,
“Single synaptic events evoke NMDA receptor—mediated release of calcium from internal stores in hippocampal dendritic spines,”
Neuron, 22
(1), 115
–124
(1999). http://dx.doi.org/10.1016/S0896-6273(00)80683-2 NERNET 0896-6273 Google Scholar
T. Bozza et al.,
“In vivo imaging of neuronal activity by targeted expression of a genetically encoded probe in the mouse,”
Neuron, 42
(1), 9
–21
(2004). http://dx.doi.org/10.1016/S0896-6273(04)00144-8 NERNET 0896-6273 Google Scholar
E. Shigetomi, S. Kracun and B. S. Khakh,
“Monitoring astrocyte calcium microdomains with improved membrane targeted GCaMP reporters,”
Neuron Glia Biol., 6
(3), 1
–9
(2010). http://dx.doi.org/10.1017/S1740925X10000219 1741-0533 Google Scholar
Y. Saiga, O. Shimomura and F. H. Johnson,
“Extraction, purification and properties of aequorin, a bioluminescent protein from the Luminous Hydromedusan, Aequorea,”
J. Cell. Comp. Physiol., 59
(3), 223
–239
(1962). http://dx.doi.org/10.1002/(ISSN)1553-0809 JCCPAY 0095-9898 Google Scholar
V. Baubet et al.,
“Chimeric green fluorescent protein-aequorin as bioluminescent Ca2+ reporters at the single-cell level,”
Proc. Natl. Acad. Sci. U. S. A., 97
(13), 7260
–7265
(2000). http://dx.doi.org/10.1073/pnas.97.13.7260 PNASA6 0027-8424 Google Scholar
A. Miyawaki et al.,
“Fluorescent indicators for based on green fluorescent proteins and calmodulin,”
Nature, 388 882
–887
(1997). http://dx.doi.org/10.1038/42264 NATUAS 0028-0836 Google Scholar
G. S. Baird, D. A. Zacharias and R. Y. Tsien,
“Circular permutation and receptor insertion within green fluorescent proteins,”
Proc. Natl. Acad. Sci. U. S. A., 96 11241
–11246
(1999). http://dx.doi.org/10.1073/pnas.96.20.11241 PNASA6 0027-8424 Google Scholar
L. Tian and L. L. Looger,
“Genetically encoded fluorescent sensors for studying healthy and diseased nervous systems,”
Drug Discov. Today Dis. Models, 5
(1), 27
–35
(2008). http://dx.doi.org/10.1016/j.ddmod.2008.07.003 DDTDBP 1740-6757 Google Scholar
D. A. Dombeck et al.,
“Functional imaging of hippocampal place cells at cellular resolution during virtual navigation,”
Nat. Neurosci., 13
(11), 1433
–1440
(2010). http://dx.doi.org/10.1038/nn.2648 NANEFN 1097-6256 Google Scholar
A. Muto et al.,
“Genetic visualization with an improved GCaMP calcium indicator reveals spatiotemporal activation of the spinal motor neurons in zebrafish,”
Proc. Natl. Acad. Sci. U. S. A., 108
(13), 5425
–5430
(2011). http://dx.doi.org/10.1073/pnas.1000887108 PNASA6 0027-8424 Google Scholar
A. Muto et al.,
“Real-time visualization of neuronal activity during perception,”
Curr. Biol., 23
(4), 307
–311
(2013). http://dx.doi.org/10.1016/j.cub.2012.12.040 CUBLE2 0960-9822 Google Scholar
M. S. Maisak et al.,
“A directional tuning map of Drosophila elementary motion detectors,”
Nature, 500
(7461), 212
–216
(2013). http://dx.doi.org/10.1038/nature12320 NATUAS 0028-0836 Google Scholar
M. Mank and O. Griesbeck,
“Genetically encoded calcium indicators,”
Chem. Rev., 108
(5), 1550
–1564
(2008). http://dx.doi.org/10.1021/cr078213v CHREAY 0009-2665 Google Scholar
L. L. Looger and O. Griesbeck,
“Genetically encoded neural activity indicators,”
Curr. Opin. Neurobiol., 22
(1), 18
–23
(2012). http://dx.doi.org/10.1016/j.conb.2011.10.024 COPUEN 0959-4388 Google Scholar
J. Nakai, M. Ohkura and K. Imoto,
“A high signal-to-noise Ca2+ probe composed of a single green fluorescent protein,”
Nat. Biotechnol., 19
(2), 137
–141
(2001). http://dx.doi.org/10.1038/84397 NABIF9 1087-0156 Google Scholar
Y. N. Tallini et al.,
“Imaging cellular signals in the heart in vivo: cardiac expression of the high-signal Ca2+ indicator GCaMP2,”
Proc. Natl. Acad. Sci. U. S. A., 103
(12), 4753
–4758
(2006). http://dx.doi.org/10.1073/pnas.0509378103 PNASA6 0027-8424 Google Scholar
L. Tian et al.,
“Imaging neural activity in worms, flies and mice with improved GCaMP calcium indicators,”
Nat. Methods, 6
(12), 875
–881
(2009). http://dx.doi.org/10.1038/nmeth.1398 1548-7091 Google Scholar
A. Shindo et al.,
“Tissue-tissue interaction-triggered calcium elevation is required for cell polarization during Xenopus gastrulation,”
PLoS One, 5
(2), e8897
(2010). http://dx.doi.org/10.1371/journal.pone.0008897 1932-6203 Google Scholar
J. Akerboom et al.,
“Optimization of a GCaMP calcium indicator for neural activity imaging,”
J. Neurosci., 32
(40), 13819
–13840
(2012). http://dx.doi.org/10.1523/JNEUROSCI.2601-12.2012 JNRSDS 0270-6474 Google Scholar
T.-W. Chen et al.,
“Ultrasensitive fluorescent proteins for imaging neuronal activity,”
Nature, 499
(7458), 295
–300
(2013). http://dx.doi.org/10.1038/nature12354 NATUAS 0028-0836 Google Scholar
M. Ohkura et al.,
“Genetically encoded green fluorescent Ca2+ indicators with improved detectability for neuronal Ca2+ signals,”
PLoS One, 7
(12), e51286
(2012). http://dx.doi.org/10.1371/journal.pone.0051286 1932-6203 Google Scholar
Y. Zhao et al.,
“An expanded palette of genetically encoded indicators,”
Science, 333
(6051), 1888
–1891
(2011). http://dx.doi.org/10.1126/science.1208592 SCIEAS 0036-8075 Google Scholar
J. Wu et al.,
“Improved orange and red Ca2+ indicators and photophysical considerations for optogenetic applications,”
ACS Chem. Neurosci., 4
(6), 963
–972
(2013). http://dx.doi.org/10.1021/cn400012b ACNCDM 1948-7193 Google Scholar
L. Stoppini, P. Buchs and D. Muller,
“A simple method for organotypic cultures of nervous tissue,”
J. Neurosci. Methods, 37 173
–182
(1991). http://dx.doi.org/10.1016/0165-0270(91)90128-M JNMEDT 0165-0270 Google Scholar
D. C. Lo, K. A. McAllister and L. C. Katz,
“Neuronal transfection in brain slices using particle-mediated gene transfer,”
Neuron, 13
(6), 1263
–1268
(1994). http://dx.doi.org/10.1016/0896-6273(94)90412-X NERNET 0896-6273 Google Scholar
K. A. McAllister,
“Biolistic transfection of neurons,”
Sci. STKE, 2000
(51), p|1
(2000). http://dx.doi.org/10.1126/stke.2000.51.pl1 Google Scholar
J. Wu et al.,
“A long Stokes shift red fluorescent Ca2+ indicator protein for two-photon and ratiometric imaging,”
Nat. Commun., 5
(5262),
(2014). http://dx.doi.org/10.1038/ncomms6262 Google Scholar
Y. Zhao et al.,
“Microfluidic cell sorter-aided directed evolution of a protein-based calcium ion indicator with an inverted fluorescent response,”
Integr. Biol., 6 714
–725
(2014). http://dx.doi.org/10.1039/c4ib00039k Google Scholar
H. Katayama et al.,
“A sensitive and quantitative technique for detecting autophagic events based on lysosomal delivery,”
Chem. Biol., 18
(8), 1042
–1052
(2011). http://dx.doi.org/10.1016/j.chembiol.2011.05.013 CBOLE2 1074-5521 Google Scholar
Y. Yamada and K. Mikoshiba,
“Quantitative comparison of novel GCaMP-type genetically encoded Ca2+ indicators in mammalian neurons,”
Front. Cell. Neurosci., 6 41
(2012). http://dx.doi.org/10.3389/fncel.2012.00041 FCNRAH 1662-5102 Google Scholar
BiographyBorbala Podor obtained her MSc degree from the University of Szeged, Hungary, where her thesis project focused on headaches and migraine research. She is pursuing her PhD on synaptic function and plasticity in the Department of Physiology & Biophysics at Dalhousie University, Halifax, Canada. Yi-ling Hu received her MD from Shandong Medical University in China and finished her postdoctoral training in the Department of Neurobiology & Developmental Sciences at University of Arkansas for Medical Sciences (UAMS) and in the Department of Biological Sciences at University of Delaware. Her research is focused on development and modification of genetically encoded probes of neural function. Masamichi Ohkura received his BS, MSc, and PhD from Tohoku University, Japan, and postdoctoral training at the University of North Carolina at Chapel Hill, USA, and the National Institute for Physiological Sciences, Japan. He is currently an associate professor of the Division of Joint Frontier Studies, Graduate School of Science and Engineering, and a Concurrent Associate Professor of Brain Science Institute, in Saitama University, Japan. Junichi Nakai graduated from Kansai Medical University, Japan, and received his MD. He obtained his PhD degree from Kyoto University, Japan. He was assistant professors in Kyoto University and the National Institute for Physiological Sciences, and was deputy laboratory head in RIKEN Brain Science Institute, Japan. He is currently professor of the Division of Joint Frontier Studies, Graduate School of Science and Engineering, and concurrent professor and director of Brain Science Institute, in Saitama University. Roger Croll obtained his BS from Tufts and PhD from McGill and did postdoctoral training at the University of California, Santa Cruz. He is currently a professor in the Department of Physiology & Biophysics at Dalhousie University and has also had positions as visiting scholar during sabbatical leaves at the Free University of Amsterdam, University of Hawaii, University of Queensland and at the Centre National de la Recherche Scientifique. Alan Fine received his AB from Harvard, VMD and PhD degrees from the University of Pennsylvania, and postdoctoral training at the National Institute for Mental Health in Washington DC, the Weizmann Institute of Science in Rehovot Israel, the University of Cambridge, and the Medical Research Council Centre in Cambridge UK. He has been a team leader at the National Institute for Medical Research in Mill Hill, London, and is currently university research professor at Dalhousie University. |


