
|
|
1.IntroductionWhen screening the past for methodological innovations that led to major advances in our understanding of the physiology of excitable tissues, neuroscientists have played a central role and their methodological work often spilled over into other scientific fields. This was particularly the case for cardiac electrophysiology, where examples that led to major scientific advancements range from the invention of the Ling–Gerard–Graham glass electrode in the late 1940s1 to optical ion indicators and to optogenetics as introduced only a few years ago.2 Being faced with the problem of assessing impulse propagation in networks of cultured cardiomyocytes with high spatiotemporal resolution in the early 1990s, the senior author of this study was yet another “specimen” of a cardiac electrophysiologist that had his hopes raised that the voltage-sensitive dye recording as developed by neuroscientists around Larry Cohen might solve the cardiac problem at hand.3,4 As it turned out, during his 2-year stay in the laboratory of Brian Salzberg, a former collaborator of Larry Cohen in the voltage-sensitive dye development group, the technology transfer from neuroscience to cardiomyocyte cell cultures worked out just fine.5–7 Getting to know Larry personally, however, had to wait until Brian’s lab went on its yearly summer trail to the MBL in Woods Hole. Among the many fruitful discussions with Larry and the members of his group, a discussion with Jian-Young Wu was especially important. While relaxing on Stony Beach over noon, Wu outlined the many advantages of using optical fibers to couple the voltage-sensitive dye signals onto individual detectors. Once back in Switzerland, this input proved invaluable for the development of a fast optical recording device that is in the meantime based on a fiberoptic array coupled to avalanche photodiodes and that is a prerequisite for conducting the study presented below.8 Apart from developing voltage-sensitive dyes, Larry and friends were also involved in pioneering work regarding indicators. In one of their publications relevant to this study, they showed in 1975 that the arsenazo III (the first dye indicator and an absorption dye) can be used to track fast, depolarization-induced changes of in the squid giant axon.9 The mechanism likely underlying their observation of an increase of intracellular peaking within after the start of depolarization was found 8 years later in the form of voltage-gated channels.10 Another 15 years later, the differentiation of stimulus-evoked fluorescence transients from fast calcium indicators was introduced as a means to characterize presynaptic calcium currents in neurons of rat brain slices by yet another frequent visitor of the MBL, Wade Regehr.11 This method has recently been refined with the goal to derive quantitative measures for calcium currents from optical recordings in neuronal tissue.12 Based on the principle of obtaining a signal reflecting inward currents () by the differentiation of optically recorded transients, we thought it worthwhile to investigate the hypothesis that a similar approach may be used for assessing during propagated electrical activity in cardiac tissue. Information as to differences in the spatial patterning of calcium currents in cardiac tissue is important, e.g., in the context of understanding discontinuous impulse conduction where L-type channel mediated inward currents were shown with the coupling clamp cell model to be increased at sites of delayed propagation where they contribute to sustained conduction in the presence of critical gap junctional uncoupling.13 In the same context, it was reported that the size of the optically measured transient is increased during delayed action potential propagation from a single cardiomyocyte critically coupled to a computer simulated cell.14 For this and related cases of discontinuous conduction, knowing the spatial extent of local differences in the time course/magnitude of would substantially enhance our understanding of mechanisms supporting compromised and, hence, arrhythmogenic impulse conduction in the heart. Using a fast and highly sensitive optical recording system, we show in this study that the rising phase of transients accompanying propagated electrical activity in strands of cardiomyocytes stained with calcium indicators exhibits two phases: a fast rise within the first and a slower rise to peak that is reached after an additional 20 to 30 ms. Pharmacological dissection of the main mechanisms contributing to the transients [; calcium-induced calcium release, (CICR)] revealed that the fast initial component of the transient primarily reflects entry through voltage-gated calcium channels. Accordingly, differentiation of the fast initial rise of resulted in a signal [optically recorded calcium current (ORCC)] that displayed a time course highly similar to that of L-type currents as reported before from patch clamp studies of rat cardiomyocytes.15 2.Methods2.1.Cell CultureExperiments were conducted in agreement with relevant institutional and Swiss Federal guidelines for animal experimentation. Patterned growth primary cultures of 1-day old Wistar neonatal rat ventricular cardiomyocytes were produced using previously described methods.16 Experimental preparations consisted of strands of cardiomyocytes that measured . Experiments were performed with 3- to 5-day-old cell cultures. 2.2.Optical RecordingPreparations were stained for 25 min at 36°C with Fluo-4 (Teflabs) or Fluo-4FF (Life Technologies) dissolved in cell culture medium (M199 with Hank’s salts, Life Technologies) containing 5% neonatal calf serum (Biochrom) and probenecid (Sigma) to limit leaking of the dye. Following staining, preparations were incubated for another 20 min in the same medium (w/o Fluo-4) before being mounted in a superfusion chamber17 that was placed on the stage of an inverted microscope (Zeiss Axiovert 135M). During experiments, preparations were continuously superfused at 36°C with Hank’s balanced salt solution (HBSS, Life Technologies) containing Hepes (titrated to pH 7.40) and probenecid. Before a given recording, preparations were prestimulated at 1 Hz for 10 s with an extracellular stimulation electrode placed from the recording area in order establish steady state conditions for impulse propagation at the measurement site. Optical recordings were synchronized to the last stimulation pulse and lasted to limit photobleaching and phototoxicity. Excitation light from a xenon light source (Optiquip, Model 1600) was bandpass-limited () and deflected toward the preparation by a 493-nm dichroic mirror. The emitted fluorescence (longpass 513 nm) was focused onto the input window of a fiberoptic array from which up to 70 fibers (1-mm diameter each) were routed to individual photodetectors (APD modules C5460-01, Hamamatsu). Experiments were performed with a NA objective (Zeiss) that resulted in a spatial resolution of the recording system of . The analog bandwidth of the recording system encompassed the range from 0.05 Hz to 2 kHz and simultaneously sampled signals were digitized at 20 kHz (14 Bit; 5-V analog input resolution). Signals were analyzed with customized software (IDL V5.3, Exelis VIS; MATLAB R2013a, MathWorks). 2.3.Experimental SolutionsCadmium chloride (, Sigma) and caffeine (, Sigma) were added to the supplemented superfusion solution (HBSS) described above to assess the origin of the signals. 2.4.Data AnalysisFluorescence signals are reported either as relative fluorescence values () or as normalized values. To form averages and compare signals acquired during propagated activity, propagation delays were eliminated by aligning the fluorescence transients with respect to their onset. The onset was defined as the point in time when the signals rose above 2% of their maximal amplitude. The derivative of the signal was obtained by a central difference of order 2 (five-point stencil method) applied to the fluorescence signals that were prefiltered with a Butterworth filter of order 5 with a cutoff frequency of 800 Hz (control and caffeine experiments) and 250 Hz (caffeine plus experiments). The time to peak of the derivatives of the fluorescence signals was calculated as the interval between the time when the signal crossed 10% of its maximal amplitude and the time when it reached the peak. 2.5.StatisticsValues are given as . In graphs, SDs are indicated as shaded bands. Number of samples refers to individual preparations () or, in the case of measurements in a single preparation, to the number of photodetectors (). The boxplots indicate the median (central mark of the box), the 25th and 75th percentiles (edges of the box), and the extreme points (whiskers). Data were compared using a two-tailed Student -test (homo- or heteroscedastic where appropriate) and difference between datasets were considered significant at . 3.Results3.1.Transients During Impulse PropagationThe spatiotemporal characteristics of transients accompanying action potential propagation were assessed in strands of cultured neonatal rat ventricular cardiomyocytes stained with Fluo-4. Preparations were prestimulated for 10 s at 1 Hz before recording propagated transients that were elicited by the last stimulation. A representative example of a recording is illustrated in Fig. 1 with (a) showing a phase contrast picture of the preparation with overlaid white circles, indicating the recording sites. Signals were amplified, lowpass-filtered () and digitized at 20 kHz. Digital postprocessing included offset correction and normalization of the signals to their resting fluorescence (). Signal onset was defined as the time when transients rose above 2% of their maximal amplitude. The overlay of all signals in Fig. 1(b) demonstrates that transients were similarly shaped and consisted of a fast rise that peaked after () followed by an initially slow (“plateau”) and then accelerated decay. The transition of slow to accelerated decay occurred at () after the peak of the transient. Plots of the initial part of the fast rising phase of the transients recorded from the second row of detectors are shown on an expanded timescale in Fig. 1(c). The uniform spacing of the normalized signals indicates the presence of an equally uniform electrical activation. As determined from a linear fit of the time when fluorescence signals reached 50% of their maximal amplitude (), transients propagated with a velocity of , which is typical for fast sodium inward current-based impulse propagation in these preparations.18 Fig. 1Spatiotemporal characteristics of transients measured during propagated electrical activity: (a) Phase contrast picture of a strand of cardiomyocytes with overlaid white circles indicating the position of individual photodetectors. The preparation was stimulated at 1 Hz on the left. (b) Superimposed transients recorded during propagated electrical activity. (c) Left panel: expanded view of the rising phase of the transient as recorded along the second row of detectors. The cross-points of the dashed line with the transients served to extract the time when fluorescence reached 50% of its full amplitude () at each recording site. Right panel: Plot of versus distance shows the uniform propagation of the transients with an average velocity of (dashed curve: absolute values; solid line: linear regression).  3.2.Components of the TransientIn order to assess the relative contributions of , CICR, and other sources of to the overall transient, preparations were sequentially superfused with caffeine to empty the sarcoplasmic reticulum (SR) and caffeine plus to simultaneously block . Recordings were limited to the initial part of the transient to reduce photobleaching and phototoxicity during the sequential illuminations. As shown by the raw signals and the normalized averages of a single experiment [Fig. 2(a)], caffeine caused a substantial reduction of the initial peak of the transient. At the same time, it unmasked a small but rapid initial rise of that was followed by a slower increase of reaching a maximum after the onset of the transient. This rapid increase of was largely suppressed by , indicating that it was caused by influx via L-type channels. The residual increase of in the presence of caffeine plus showed a slower and less pronounced initial rise that was likely due, at least in part, to entry via the sodium-calcium exchanger (NCX) operating in reverse mode. Fig. 2Components of the transient: (a) Upper row: transients measured in a single preparation during propagated electrical activity under control conditions (black), during superfusion with caffeine (blue) and with caffeine plus (red). Transients are aligned with respect to their onset to compensate for propagation delays. Lower row: of the transients under the three different conditions (normalized to control; ). (b) Left panel: transients obtained in six experiments under control conditions (black), in presence of caffeine (blue), and during exposure to caffeine plus (red) (; ). Right panel: Calculated differences between transients obtained under the three conditions illustrate the time course of the caffeine- (olive) and (green)-sensitive components of the overall transient. The residual signal is shown in red. (c) Relative contributions of the three components to the peak of the transient as indicated by arrows in (b, left panel). 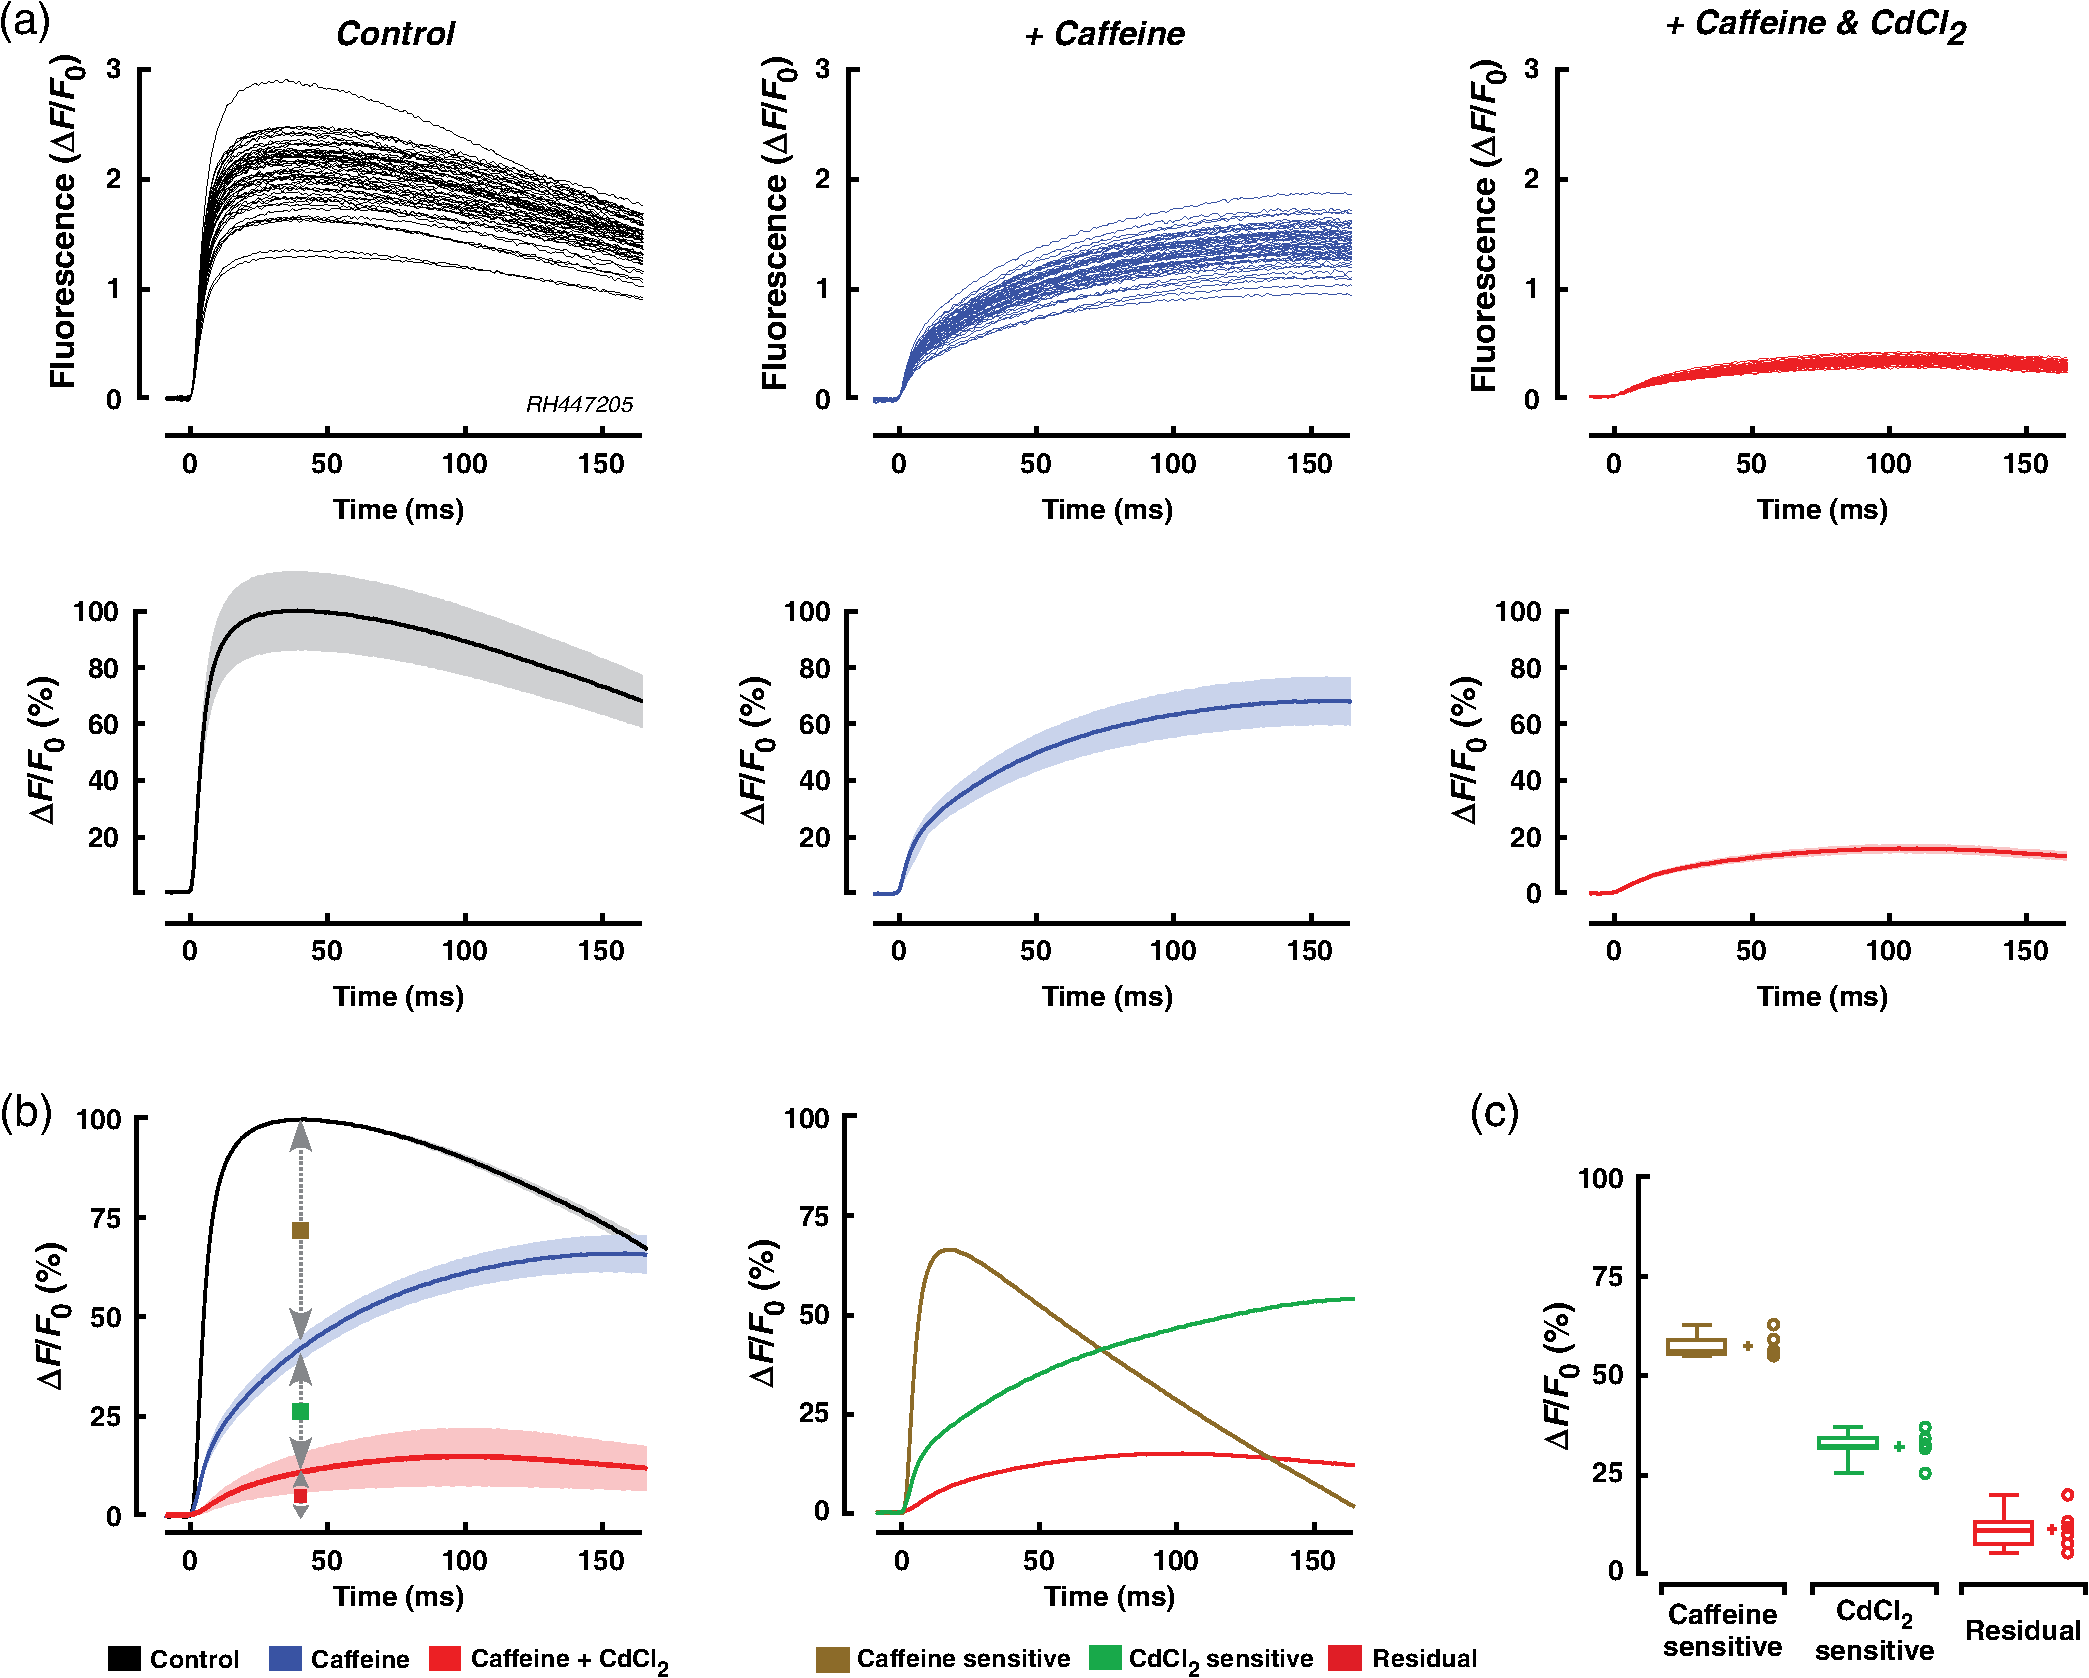 Figures 2(b) and 2(c) show the summary data obtained under the three different experimental conditions in six preparations. Under the simplified assumption that was linearly related to , the peak of the transient was primarily due to CICR (), (), and residual influx (). Each of the three components of the transient displayed a specific time course. The CICR-dependent increase of showed a fast rise (time to peak: ) that was followed by a monotonic decline to 0 within . -dependent changes of showed an equally fast initial increase but continued to rise thereafter during the duration of the recording. The small residual change of measured in the presence of caffeine and showed a slow increase that reached a peak after before starting to decline again. 3.3.Kinetics of the Fast Initial Rise inUnder the assumption that the fast initial rise of observed under control conditions and in the presence of caffeine is primarily based on , differentiation of the transient should result in a signal (ORCC) that reproduces the essential features of activation of known from patch clamp experiments. As shown in Fig. 3(a) for a single experiment, differentiation of the transients recorded under control conditions indeed produced signals that peaked at () after the onset and declined exponentially thereafter, duplicating the basic features of activation and inactivation as observed previously during action potential clamps in rat cardiomyocytes.15 Similarly shaped but smaller signals were found in the presence of caffeine. The finding that caused near-complete suppression of this signal demonstrates that it was primarily based on entry through voltage-activated channels. ORCCs acquired under control conditions by a single row of photodetectors during propagation of an action potential are shown in Fig. 3(b). Fig. 3Kinetics of the initial phase of the transient: (a) Upper row: Rising phase of transients as obtained in one preparation under control conditions (black), during exposure to caffeine (blue), and caffeine plus (red). Lower row: overlay of the transients (solid traces) on their derivatives (dashed traces; ; ). (b) Derivatives of single shot measurements as recorded along a row of detectors during action potential propagation. (c) Summary data of six preparations. Left panel: of transients. Middle panel: of the derivative of transients. Right panel: Normalized derivatives. (d) Determinations of the time to peak (period between red markers) of the derivatives for all experiments and conditions with a summary of the data shown in the rightmost panel. 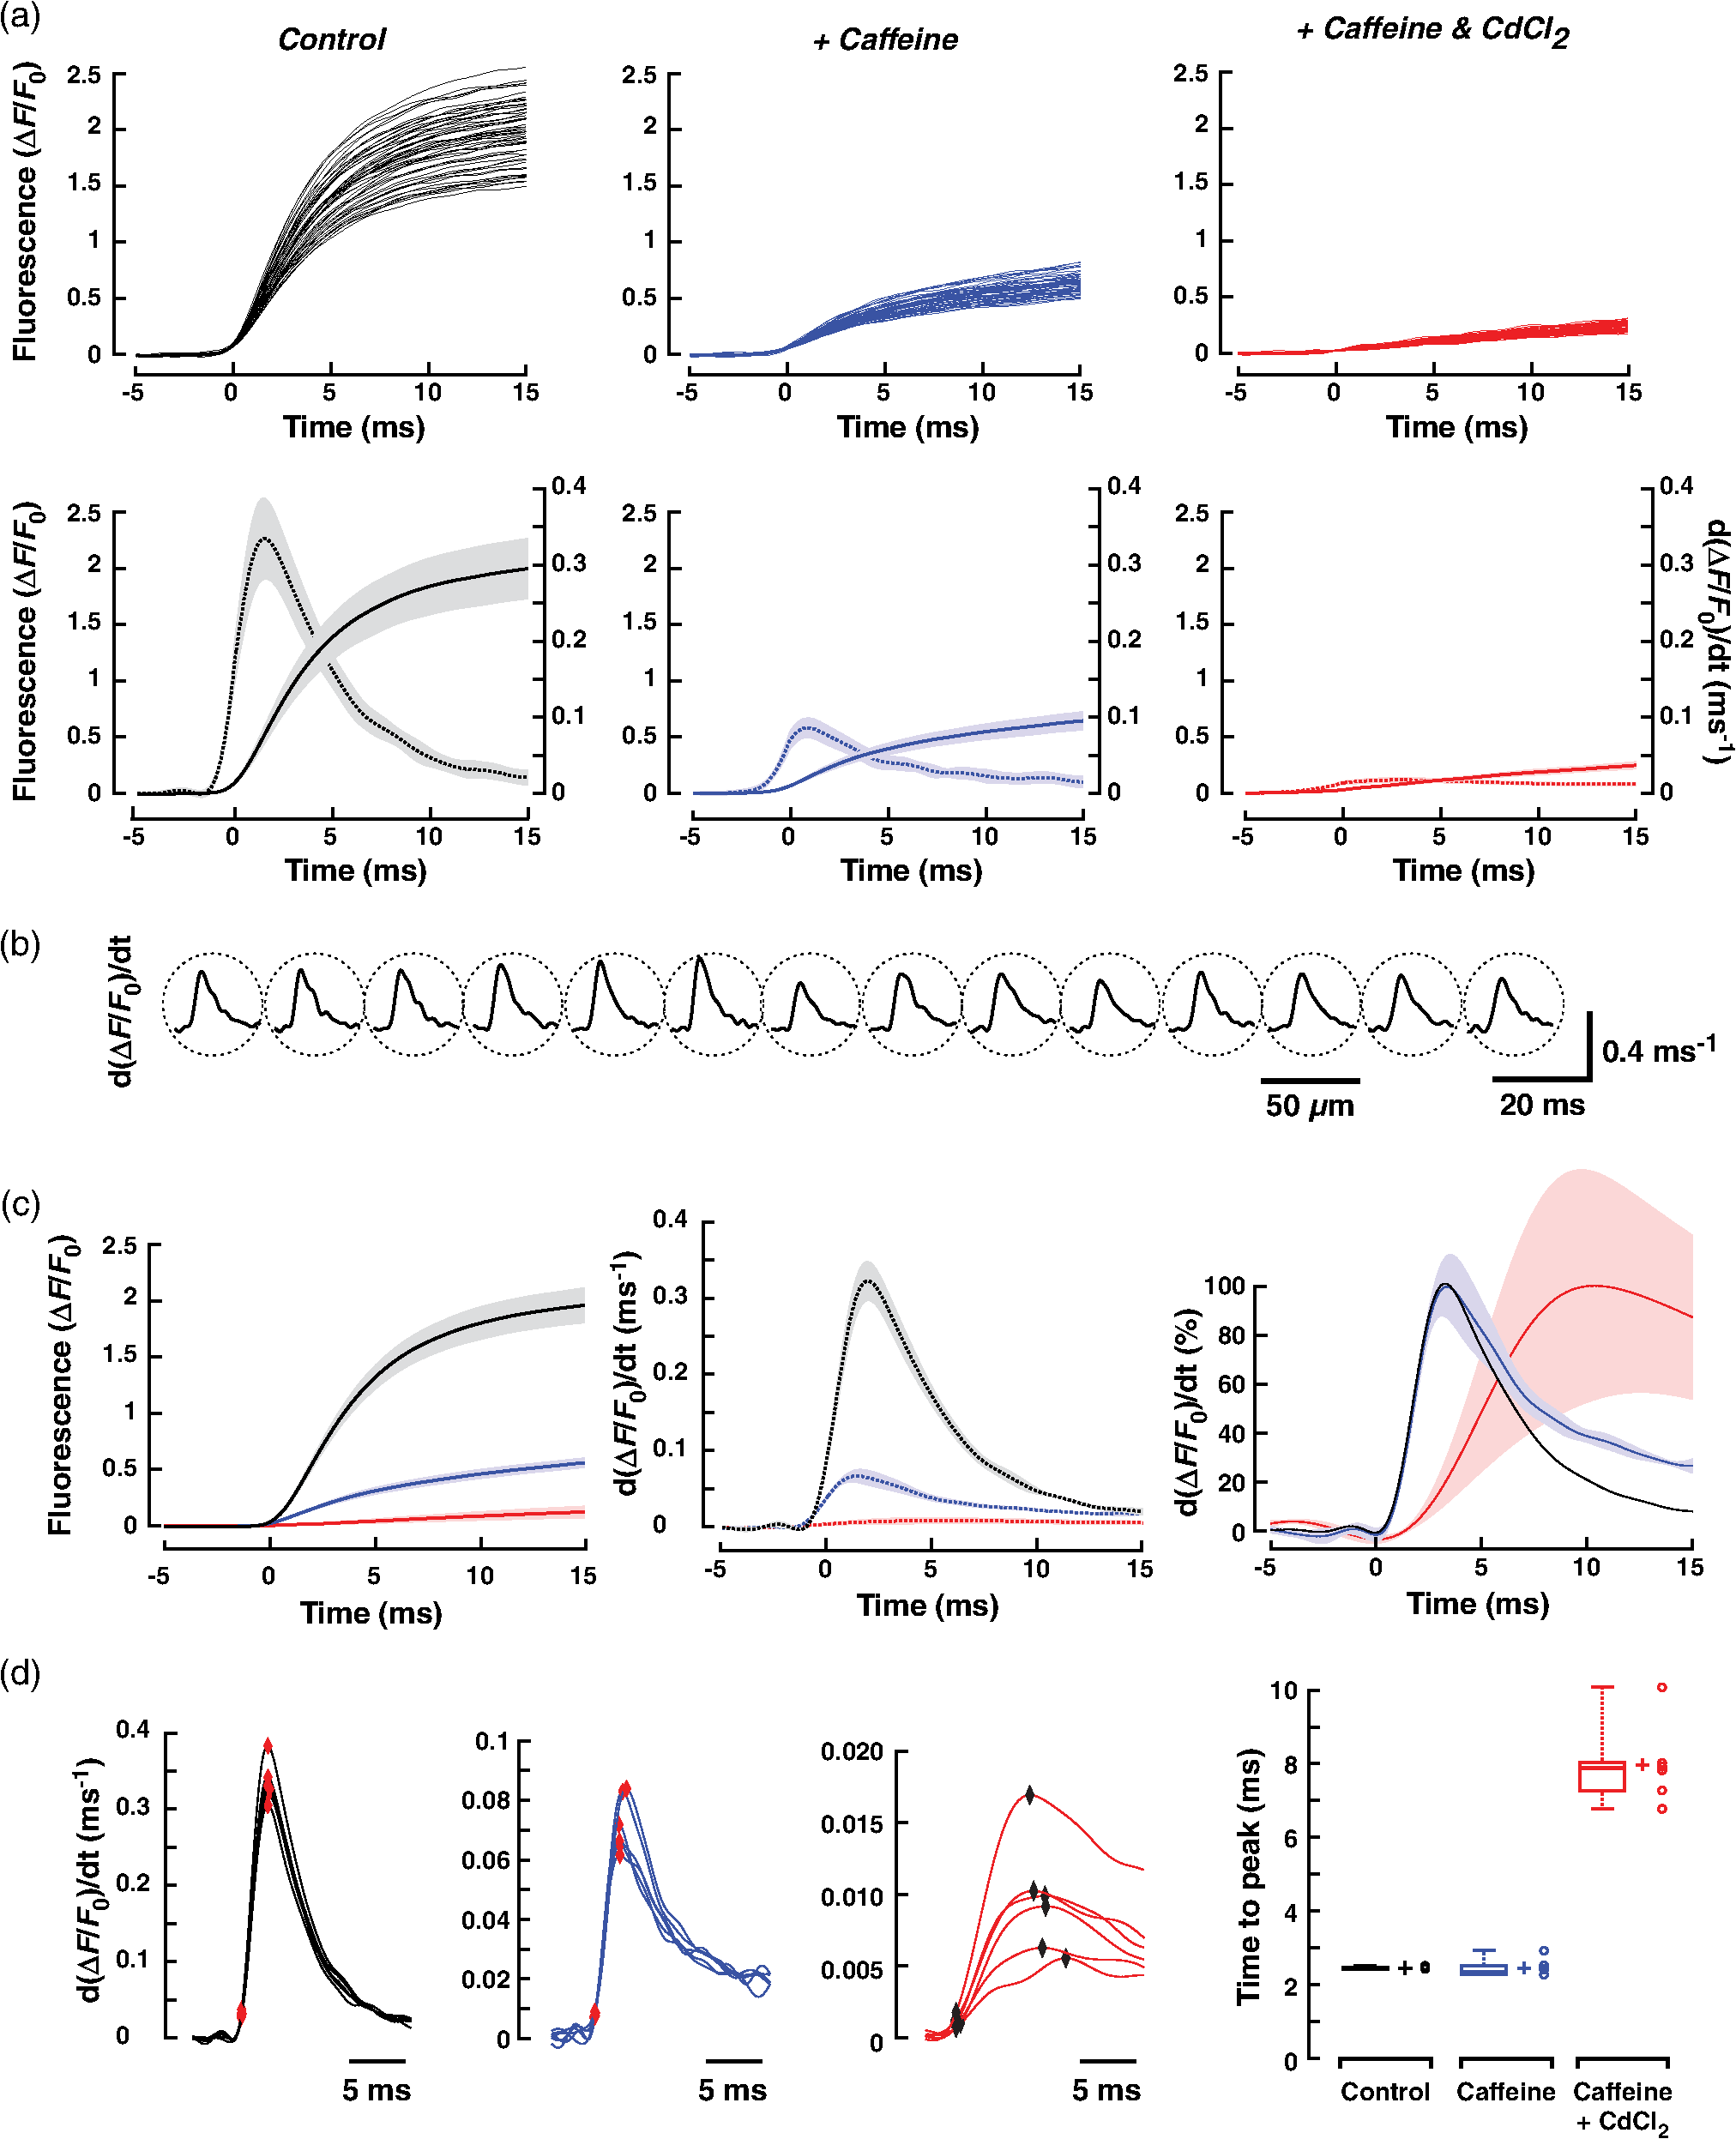 The summary data of all experiments in Fig. 3(c) illustrate that the caffeine substantially reduced the peak of from to (; ). As is evident after normalization of the traces [rightmost panel of Fig. 3(c)], caffeine had no appreciable effect on the time course of the rising phase of the signal while slightly slowing the decay of the signal which may be related to a reduction of -dependent inactivation of . The similarity of obtained under control conditions and in the presence of caffeine suggests that -mediated entry can be recorded even in presence of a functional SR. Differentiation of the small residual transient present during exposure of the preparations to caffeine and was only possible after subjecting the raw data to additional digital filtering (cf. methods). The peak of the differentiated signal of these transients was reached more slowly and amounted to ( versus control; ). As shown in Fig. 3(d), the time to peak of the differentiated signals amounted to (control), (caffeine), and (caffeine plus ; each). While values obtained under control and caffeine conditions were not different (), they were significantly faster than those recorded in the combined presence of caffeine and ( each). 3.4.Measurement of Transients with Fluo-4FFBecause high-fidelity recordings of transients in cardiac tissue are known to depend on the dissociation constant () of the indicator used, we repeated the experiments with preparations stained with the low-affinity indicator Fluo-4FF that has a for () which is times larger than that of Fluo-4 ().19 The comparison of transients obtained with Fluo-4 or Fluo-4FF stained single preparations shown in Fig. 4(a) reveals fast rising phases that peaked after (Fluo-4, ) and (Fluo-4FF, ; versus Fluo-4). A larger difference was observed for the decay of the transient that was prolonged and multiphasic in the case of Fluo-4 (time to 50% decline, : ) as compared with the faster exponential decay of Fluo-4FF (: ; versus Fluo-4). Also, signal amplitudes were significantly larger for Fluo-4 ( ) as opposed to Fluo-4FF ( ; ) stained preparations. Fig. 4Characteristics of transient recorded with Fluo-4FF: (a) Left panel: Rising phase of transients as obtained in one preparation stained with Fluo-4FF under control conditions. Right panel: superposition of the of transients recorded with Fluo-4 (red; ) and Fluo-4FF (black; ). (b) Left panel: initial phase of Fluo-4FF transient (; ) of a single experiment with the derivative shown below. Right panel: average signals obtained at the same position during exposure of the preparation to caffeine. (c) Summary data showing the transients under control conditions and in presence of caffeine (left; , ) and the derivatives thereof (right panel). (d) Time to peak of . 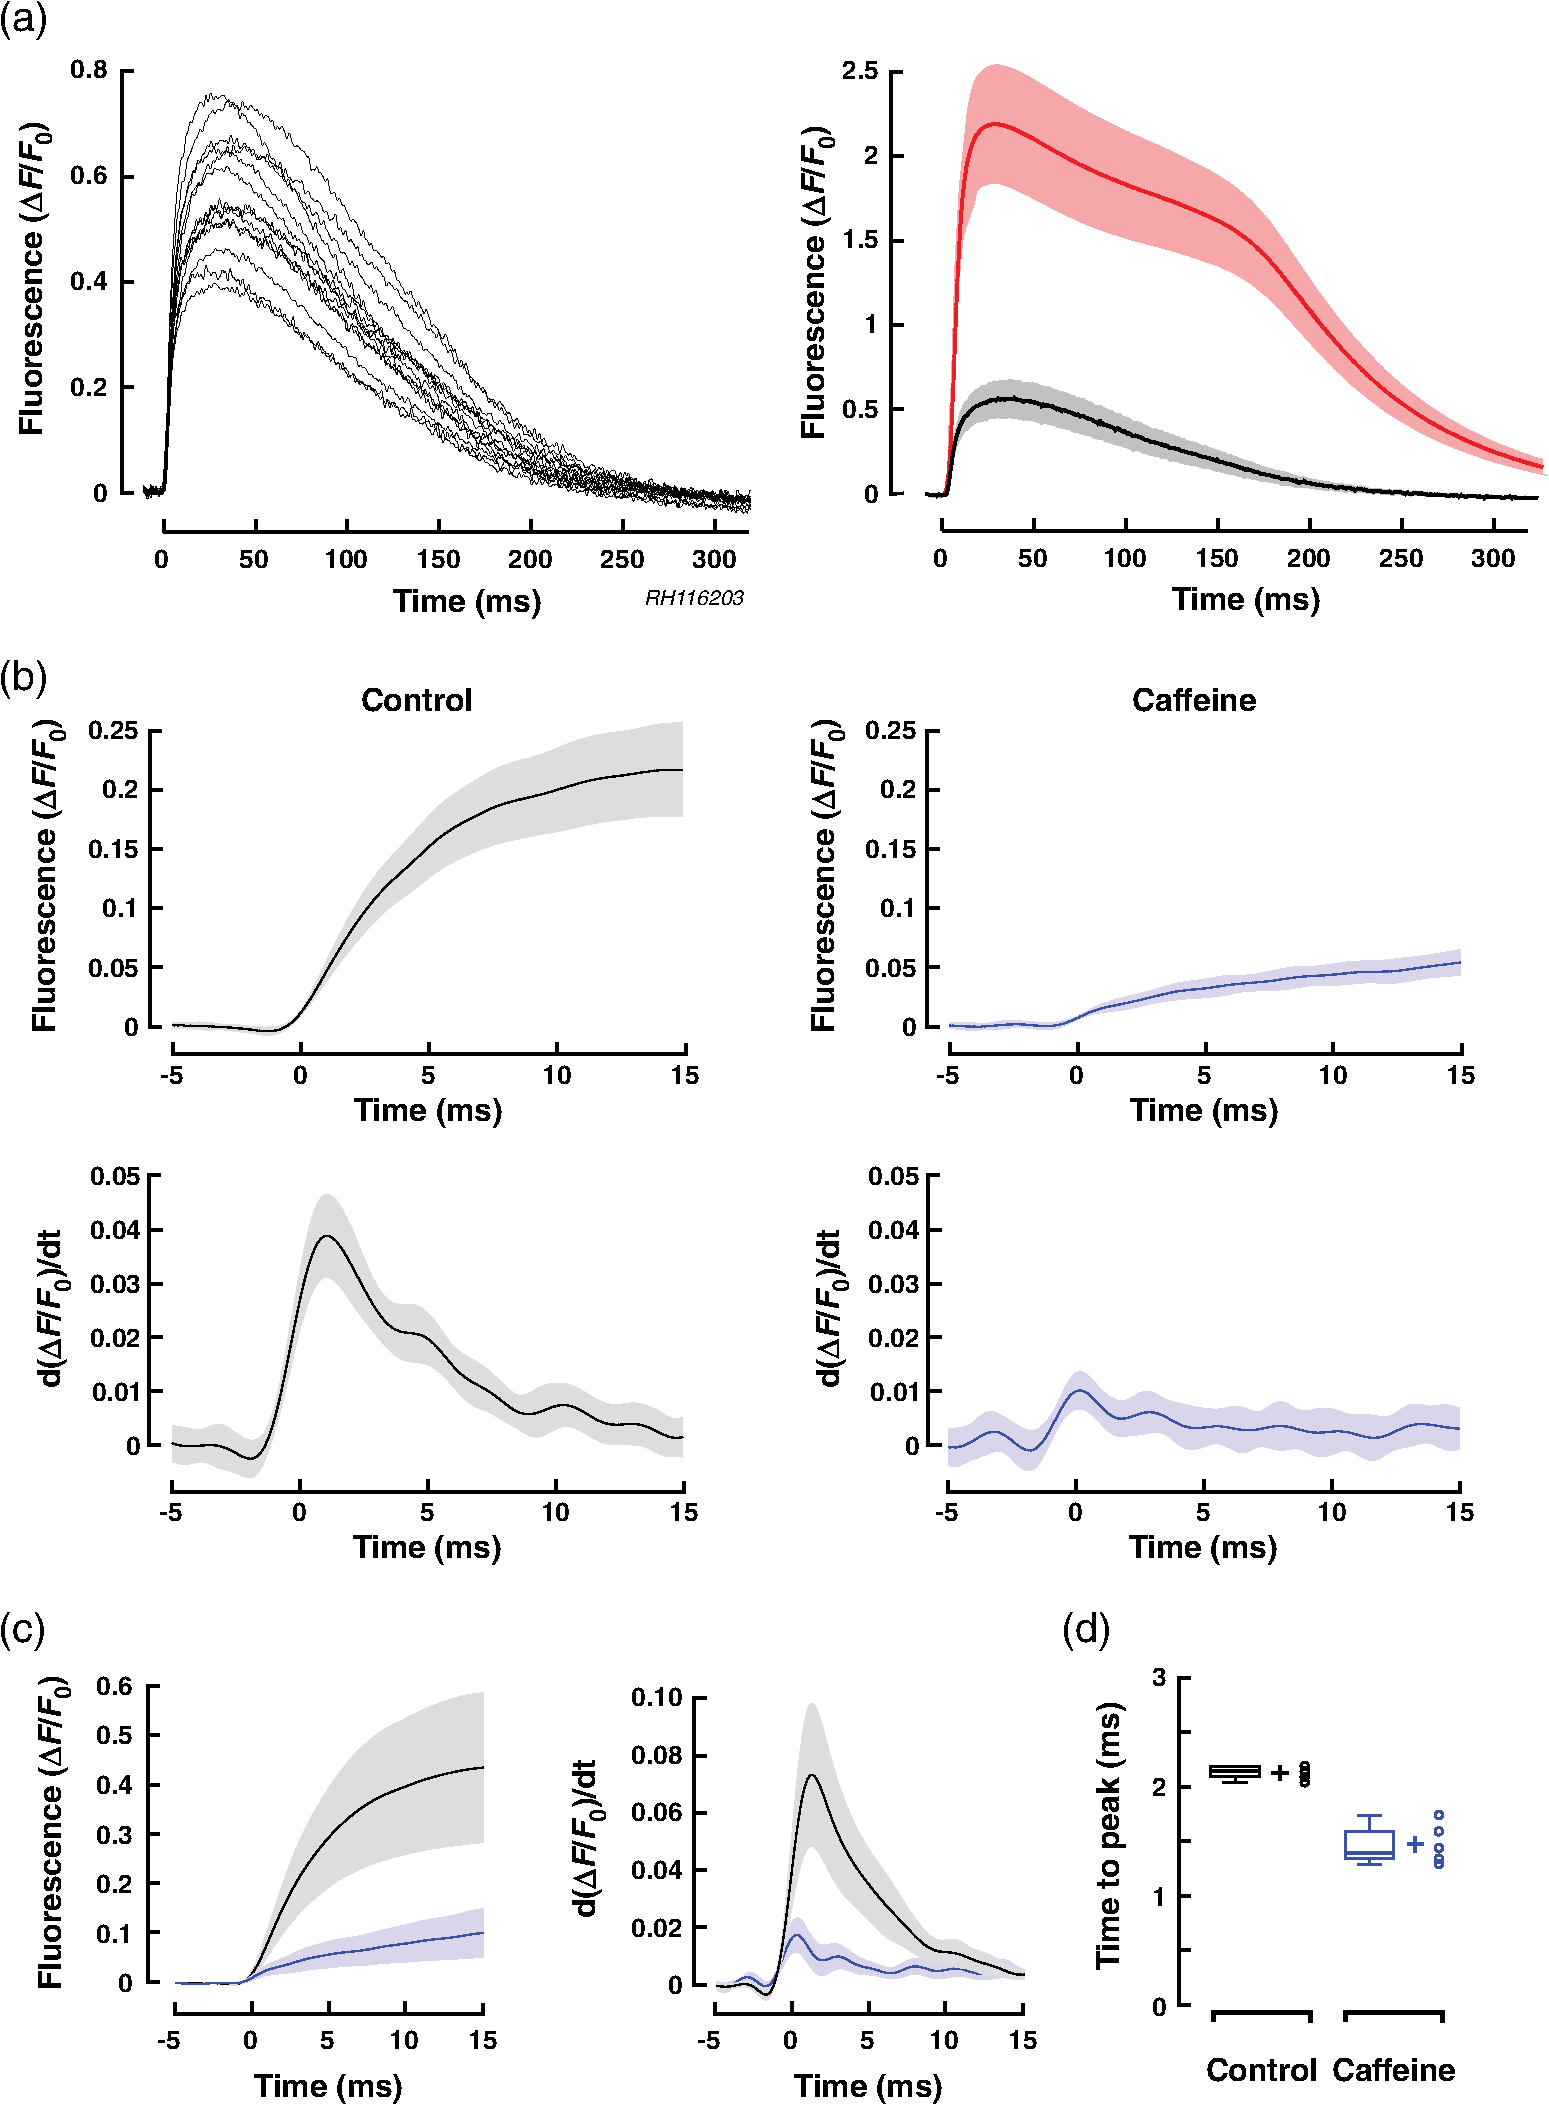 Average data obtained from six preparations stained with Fluo-4FF are depicted in Figs. 4(b) and 4(c). Under control conditions, transient amplitudes measured with Fluo-4FF (; ) were significantly smaller than those reported by Fluo-4 (; ; ; versus Fluo-4). On the other hand, the time to peak of was faster in the case of Fluo-4FF than Fluo-4 ( versus ; , ). Peak amplitudes of the differentiated signals were, as was to be expected for the times smaller amplitude of the transients in preparations stained with Fluo-4FF, reduced to a similar extent (). Exposing Fluo-4FF stained preparations to caffeine caused a depression of the transient by that was slightly larger than the effect observed in Fluo-4 stained preparations (, ). Because of the small transient amplitudes in the presence of caffeine, differentiation of the signal was barely possible because of low signal-to-noise ratios. Nevertheless, also for the case of Fluo-4FF stained preparations exposed to caffeine, showed a distinct transient that peaked after ( versus control). 4.DiscussionThe results of this study demonstrate the feasibility of measuring elicited by a propagating action potential in multicellular cardiac tissue by optical means. Prerequisites for such recordings are indicators that are fast and sensitive enough to resolve the kinetics of entry via voltage-activated L-type channels and an optical recording system that is sufficiently fast and sensitive to capture the -mediated increase of with signal-to-noise ratios large enough to permit a meaningful differentiation of the data. 4.1.Role of Kinetics and Affinity of Indicators in Optical MeasurementsPrevious studies of the kinetics of the indicator Fluo-3 using flash photolysis of DM-nitrophen in a cell-free system found the binding rate () to be diffusion limited suggesting a nearly instantaneous reaction of the dye to changes of .20 Using flash photolysis of caged in dendrites of neurons stained with Fluo-4, another group was able to resolve transients that peaked within less than 1 ms.21 These findings suggest that the Fluo-4 reacts to increases of with kinetics sufficiently fast to resolve entry via L-type channels in cardiomyocytes and that lower affinity dyes may not necessarily be needed for this specific application. Nevertheless, when comparing Fluo-4 with Fluo-4FF ( times lower affinity), we found the time to peak of the derivative of the initial fast rise of measured with Fluo-4 to be slightly slower () than the time to peak reported by Fluo-4FF. Similarly, in the presence of caffeine, the time to peak reported by Fluo-4 was slower than that of Fluo-4FF (). The latter measurements, however, need to be interpreted with caution because Fluo-4FF signals in the presence of caffeine were very small and obtaining an exact measure of the time to peak following differentiation of the signals was accordingly difficult. Under the assumption that the initial fast rise of intracellular [] is due to entry through voltage-gated channels, the time course of this increase reported by indicators is likely to somewhat underestimate the kinetics of the “real” increase because the diffusion of from the subsarcolemmal space toward the center of the cardiomyocytes will tend to slow the transient.22 Investigations into the magnitude of this effect would require an assessment of transients at high spatial resolution with confocal recording systems because the moderate spatial resolution () of the widefield epifluorescence approach used in this study causes signal averaging from entire cells and, hence, precludes a detailed assessment of the kinetics of subsarcolemmal versus center-cell transients. In contrast to their rather similar behavior in tracing the initial fast increase of following electrical activation ( after onset), the dyes differed substantially with regard to the remainder of the signals. While Fluo-4 reported a slightly faster time to peak of the transient (25.3 ms) than Fluo-4FF (30.6 ms), the decline thereafter was substantially delayed in the case of Fluo-4 (time to 50% decline: 169.4 ms versus 88.7 ms; ) which is likely explained by its low that implies a slow relaxation of the dye.23 Moreover, while the fluorescence decay of Fluo-4FF followed an exponential time course, the decline of Fluo-4 signals was characterized by an initial slow component (plateau) followed by a faster component. In simultaneous measurements of membrane voltage with RH237 and with Fluo-4 in porcine myocardium, a similar transition from slow to fast decline of the transient coincided with the onset of rapid final repolarization.19 Hypothetically, plateauing may be caused by nonlinearities of Fluo-4 at or a switch of NCX operation from reverse mode to forward mode. Absence of plateauing in case of Fluo-4FF measurements rather favors the hypothesis but further experiments are needed to resolve this question. 4.2.Components of the Calcium TransientThe peak of the rise of that accompanied propagated electrical activity was foremost due to (32%) and CICR (57%) with other mechanisms including entry via NCX playing a lesser role (11%). For CICR, a higher value was found during Fluo-4FF measurements of preparations exposed to caffeine (71%). The contribution of CICR to transients is in the range of values reported before for stimulated cultured neonatal rat cardiomyocytes exposed to ryanodine (63%) but is lower than that found in intact adult ventricular cardiomyocytes ().24,25 The difference to intact adult cells likely reflects a lesser developed SR and the lack of t-tubuli in cultured cells.26 Comparison data for the relative contribution of and residual sources of entry to the peak of the transient during action potentials for rat cardiomyocytes were not found and are, in the case of NCX, controversial. 4.3.Optically Recorded Calcium Currents (ORCCs)Arguments in favor of the hypothesis that the derivatives of the optically recorded transients accompanying action potential propagation under control conditions indeed represent ORCCs, are several fold: (1) Caffeine-induced suppression of CICR did not affect the time course of ORCCs: This observation excludes that CICR was involved in the early phase of the optically measured increase of following electrical excitation. This implies but does not prove that this phase was largely determined by . On the other hand, the finding that caffeine reduced the amplitude of the differentiated signal by 79% directly supports the hypothesis that ORCCs reflect because caffeine at identical concentrations has been shown before in patch clamp studies of rat cardiomyocytes to depress peak by 70% to 80%, i.e., to a very similar extent as was observed for ORCCs in this study.27 (2) ORCCs were entirely suppressed by in the continued presence of caffeine: During suppression of CICR with caffeine, the main contributors to the changes of left are voltage-activated channels and NCX operating in reverse mode. Separation of these two components by application of that reportedly blocks but not NCX28 caused complete suppression of ORCCs indicating that these signals were the result of entry through voltage gated calcium channels. The remaining small and slowly rising transient in the presence of caffeine and was likely due to NCX operating in reverse mode but this question was not further addressed. (3) Similarities of the shape of ORCCs with recorded during action potential clamp experiments in rat cardiomyocytes: With an average time to peak of 2.4 ms (Fluo-4) and 2.1 ms (Fluo-4FF) and considering that these values underestimate the “real” time to peak by because of their onset definition (cf. methods), the activation profile of ORCCs rather accurately duplicated the time to peak of L-type currents measured during action potential clamps in single adult rat cardiomyocytes (time to peak ).15 Similarly, the widths of ORCC transients measured at 50% of their maximal amplitude (Fluo-4 and Fluo-4FF: ) were close to the widths of L-type transients measured in the above-mentioned patch clamp study (). In combination, the three findings provide strong evidence that of the transient measured during propagated electrical activity accurately reproduces activation and the initial phase of inactivation of L-type channels. The fact that we were able to resolve this phase without pharmacological interventions suggests that there was negligible interference from CICR during the initial phase of the transient. This conclusion is supported by a recent model study suggesting that it takes up to 15 ms until influx initiated by an action potential reaches the SR and triggers CICR in cultures of neonatal rat cardiomyocytes.25 The situation may be different in intact adult ventricular cardiomyocytes with well-developed t-tubular systems where coupling delays between may be considerably smaller and, accordingly, CICR may interfere with ORCCs. Future experiments are needed to clarify this issue. 4.4.Limitations of the StudyWhile the findings of this study illustrate the feasibility of recording the temporal evolution of activation and inactivation of during propagated electrical activity in multicellular cardiac tissue, the precision with which the kinetics of these ORCCs were determined may be hampered by limitations of the kinetics of the indicators used and by cytosolic buffers competing with the indicators. While the similar temporal responses of Fluo-4 and Fluo-4FF rather exclude that the activation kinetics were grossly underestimated, the possible interference from cytosolic buffers that may slow the signal still needs to be analyzed. A further caveat relates to the magnitude of the caffeine-sensitive component of the whole cell transient reported in this study. It has been shown before that the direct interactions between caffeine and Fluo-3 cause a substantial reduction of indicator fluorescence.29 Under the assumption that Fluo-4 and Fluo-4FF share this property, the magnitude of the caffeine-sensitive component of the whole cell transient was likely overestimated and, accordingly, the relative size of related entry was underestimated. Finally, the functional interpretation of ORCCs would profit from simultaneous measurements of membrane voltage changes with voltage-sensitive dyes.30 5.ConclusionsIn summary, the findings that (1) ORCCs exhibit a shape highly similar to recorded during action potential clamps in rat cardiomyocytes, that (2) ORCCs are abolished by , and that (3) caffeine causes a suppression of the amplitude of ORCCs that reflects caffeine-induced suppression of strongly support the concept that ORCCs are based on currents through voltage-activated channels and that they reflect activation and the initial phase of inactivation of this current with high-temporal fidelity. What is still missing at this point is a methodological approach to obtain quantitative estimates of . Here, looking at recent developments in the neurosciences is once more helpful as a study that was published 1 month prior to the writing of this manuscript describes exactly such an approach.12 In this context and referring back to the general part of the introduction, it seems most appropriate to end with a quote by Silvio Weidmann from 1957: “It is my opinion that new developments in nerve physiology should serve as an incentive to those concerned with the electrophysiology of the heart.”31 AcknowledgmentsThe work was supported by the Swiss National Science Foundation (138297 to S. R.), by the European Network for Translational Research in AF (EUTRAF, 261057 to S. R.), and by the Leducq Foundation (to S. R.). We wish to thank Regula Flückiger-Labrada for her excellent cell culture work, Ernst Niggli for helpful discussions, and Françoise Rohr-Stettler for critically reading the manuscript. Conflict of interest: None. ReferencesG. Ling and R. Gerard,
“The normal membrane potential of frog sartorius fibers,”
J. Cell Comp. Physiol., 34 383
–396
(1949). http://dx.doi.org/10.1002/(ISSN)1553-0809 JCCPAY 0095-9898 Google Scholar
“Method of the year 2010,”
Nat. Methods, 8
(1), 1
–1
(2011). http://dx.doi.org/10.1038/nmeth.j.321 1548-7091 Google Scholar
L. B. Cohen and B. M. Salzberg,
“Optical measurement of membrane potential,”
Rev. Physiol. Biochem. Pharmacol., 83 35
–88
(1978). RPBEA5 0303-4240 Google Scholar
W. Ross et al.,
“Changes in absorption, fluorescence, dichroism, and birefringence in stained giant axons: optical measurement of membrane potential,”
J. Membr. Biol., 33 141
–183
(1977). http://dx.doi.org/10.1007/BF01869514 JMBBBO 0022-2631 Google Scholar
S. Rohr and B. M. Salzberg,
“Discontinuities in action-potential propagation along chains of single ventricular myocytes in culture: multiple site optical-recording of transmembrane voltage (MSORTV) suggests propagation delays at the junctional sites between cells,”
Biol. Bull., 183
(2), 342
–343
(1992). BIBUBX 0006-3185 Google Scholar
S. Rohr and B. M. Salzberg,
“Characterization of impulse propagation at the microscopic level across geometrically defined expansions of excitable tissue—multiple-site optical-recording of transmembrane voltage (MSORTV) in patterned growth heart cell-cultures,”
J. Gen. Physiol., 104
(2), 287
–309
(1994). http://dx.doi.org/10.1085/jgp.104.2.287 JGPLAD 0022-1295 Google Scholar
S. Rohr and B. M. Salzberg,
“Multiple-site optical-recording of transmembrane voltage (MSORTV) in patterned growth heart cell-cultures—assessing electrical behavior, with microsecond resolution, on a cellular and subcellular scale,”
Biophys. J., 67
(3), 1301
–1315
(1994). http://dx.doi.org/10.1016/S0006-3495(94)80602-2 BIOJAU 0006-3495 Google Scholar
S. Rohr and J. P. Kucera,
“Optical recording system based on a fiber optic image conduit: assessment of microscopic activation patterns in cardiac tissue,”
Biophys. J., 75
(2), 1062
–1075
(1998). http://dx.doi.org/10.1016/S0006-3495(98)77596-4 BIOJAU 0006-3495 Google Scholar
J. E. Brown et al.,
“Rapid changes in intracellular free calcium concentration. Detection by metallochromic indicator dyes in squid giant axon,”
Biophys. J., 15
(11), 1155
–1160
(1975). http://dx.doi.org/10.1016/S0006-3495(75)85891-7 BIOJAU 0006-3495 Google Scholar
R. DiPolo, C. Caputo and F. Bezanilla,
“Voltage-dependent calcium channel in the squid axon,”
Proc. Natl. Acad. Sci. U. S. A., 80
(6), 1743
–1745
(1983). http://dx.doi.org/10.1073/pnas.80.6.1743 PNASA6 0027-8424 Google Scholar
B. L. Sabatini and W. G. Regehr,
“Optical measurement of presynaptic calcium currents,”
Biophys. J., 74
(3), 1549
–1563
(1998). http://dx.doi.org/10.1016/S0006-3495(98)77867-1 BIOJAU 0006-3495 Google Scholar
N. Jaafari, M. De Waard and M. Canepari,
“Imaging fast calcium currents beyond the limitations of electrode techniques,”
Biophys. J., 107
(6), 1280
–1288
(2014). http://dx.doi.org/10.1016/j.bpj.2014.07.059 BIOJAU 0006-3495 Google Scholar
R. Kumar and R. W. Joyner,
“Calcium currents of ventricular cell pairs during action potential conduction,”
Am. J. Physiol., 268
(6), H2476
–H2486
(1995). AJPHAP 0002-9513 Google Scholar
M. B. Wagner et al.,
“Measurements of calcium transients in ventricular cells during discontinuous action potential conduction,”
Am. J. Physiol., 278
(2), H444
–H451
(2000). AJPHAP 0002-9513 Google Scholar
K. W. Linz and R. Meyer,
“Profile and kinetics of L-type calcium current during the cardiac ventricular action potential compared in guinea-pigs, rats and rabbits,”
Pflugers Arch., 439
(5), 588
–599
(2000). http://dx.doi.org/10.1007/s004240050982 0031-6768 Google Scholar
S. Rohr, R. Fluckiger-Labrada and J. P. Kucera,
“Photolithographically defined deposition of attachment factors as a versatile method for patterning the growth of different cell types in culture,”
Pflugers Arch, 446
(1), 125
–132
(2003). http://dx.doi.org/10.1007/s00424-002-1000-0 Google Scholar
S. Rohr,
“Temperature-controlled perfusion chamber suited for mounting on microscope stages,”
J. Physiol., 378 P90
(1986). http://dx.doi.org/10.1113/jphysiol.1986.sp016236 JPHYA7 0022-3751 Google Scholar
S. Rohr, J. P. Kucera and A. G. Kleber,
“Slow conduction in cardiac tissue, I: effects of a reduction of excitability versus a reduction of electrical coupling on microconduction,”
Circ. Res., 83
(8), 781
–794
(1998). http://dx.doi.org/10.1161/01.RES.83.8.781 CIRUAL 0009-7330 Google Scholar
W. Kong and V. G. Fast,
“The role of dye affinity in optical measurements of transients in cardiac muscle,”
Am. J. Physiol., 307
(1), H73
–H79
(2014). http://dx.doi.org/10.1152/ajpheart.00751.2013 AJPHAP 0002-9513 Google Scholar
A. L. Escobar et al.,
“Kinetic properties of DM-nitrophen and calcium indicators: rapid transient response to flash photolysis,”
Pflugers Arch., 434
(5), 615
–631
(1997). http://dx.doi.org/10.1007/s004240050444 0031-6768 Google Scholar
E. Korkotian and M. Segal,
“Synaptopodin regulates release of calcium from stores in dendritic spines of cultured hippocampal neurons,”
J. Physiol., 589
(24), 5987
–5995
(2011). http://dx.doi.org/10.1113/jphysiol.2011.217315 JPHYA7 0022-3751 Google Scholar
M. Canepari and F. Mammano,
“Imaging neuronal calcium fluorescence at high spatio-temporal resolution,”
J. Neurosci. Methods, 87
(1), 1
–11
(1999). http://dx.doi.org/10.1016/S0165-0270(98)00127-7 JNMEDT 0165-0270 Google Scholar
J. P. Kao and R. Y. Tsien,
“ binding kinetics of fura-2 and azo-1 from temperature-jump relaxation measurements,”
Biophys. J., 53
(4), 635
–639
(1988). http://dx.doi.org/10.1016/S0006-3495(88)83142-4 BIOJAU 0006-3495 Google Scholar
D. Bers, Excitation-Contraction Coupling and Cardiac Contractile Force, Kluwer, Dordrecht
(2001). Google Scholar
T. Korhonen, S. L. Hanninen and P. Tavi,
“Model of excitation-contraction coupling of rat neonatal ventricular myocytes,”
Biophys. J., 96
(3), 1189
–1209
(2009). http://dx.doi.org/10.1016/j.bpj.2008.10.026 BIOJAU 0006-3495 Google Scholar
J. B. Delcarpio, W. C. Claycomb and R. L. Moses,
“Ultrastructural morphometric analysis of cultured neonatal and adult rat ventricular cardiac muscle cells,”
Am. J. Anat., 186
(4), 335
–345
(1989). http://dx.doi.org/10.1002/(ISSN)1553-0795 AJANA2 0002-9106 Google Scholar
I. Zahradnik and P. Palade,
“Multiple effects of caffeine on calcium current in rat ventricular myocytes,”
Pflugers Arch., 424
(2), 129
–136
(1993). http://dx.doi.org/10.1007/BF00374603 0031-6768 Google Scholar
I. A. Hobai et al.,
“Inhibition by external of Na/Ca exchange and L-type Ca channel in rabbit ventricular myocytes,”
Am. J. Physiol., 272
(5), H2164
–H2172
(1997). AJPHAP 0002-9513 Google Scholar
M. Muschol, B. R. Dasgupta and B. M. Salzberg,
“Caffeine interaction with fluorescent calcium indicator dyes,”
Biophys. J., 77 577
–586
(1999). http://dx.doi.org/10.1016/S0006-3495(99)76914-6 BIOJAU 0006-3495 Google Scholar
V. G. Fast,
“Simultaneous optical imaging of membrane potential and intracellular calcium,”
J. Electrocardiol., 38
(4 Suppl), 107
–112
(2005). http://dx.doi.org/10.1016/j.jelectrocard.2005.06.023 JECAB4 0022-0736 Google Scholar
S. Weidmann,
“Resting and action potentials of cardiac muscle,”
Ann. N. Y. Acad. Sci., 65
(6), 663
–678
(1957). http://dx.doi.org/10.1111/nyas.1957.65.issue-6 ANYAA9 0077-8923 Google Scholar
BiographyFlorian Jousset is a postdoctoral assistant at the University of Bern. He received his MS degree in communication systems and his PhD degree in electrical engineering from the Swiss Federal Institute of Technology of Lausanne in 2006 and 2011, respectively. His current research interests include biomedical signal processing, mathematical modeling of cardiac cells, and optical recording systems. Stephan Rohr is a full professor of physiology at the University of Bern. He received his MD degree in 1984. From 1990 to 1992, he was a postdoctoral fellow in the laboratory of Prof. Brian M. Salzberg at UPenn in Philadelphia. His main research interests are related to questions on how the cellular architecture of cardiac tissue promotes arrhythmias with particular emphasis on arrhythmogenic crosstalk between stromal and parenchymal cells of the heart in health and disease. |


