
|
|
1.IntroductionSince the introduction of organic voltage-sensitive dyes (VSD),1 the membrane potential () change associated with neuronal activity could be measured at multiple cellular sites using fluorescence.2,3 This information, spatially and temporally correlated with signals, opens the gate to the understanding of many physiological processes underlying neuronal function.4 More recently, VSD imaging was combined, in single neurons, with fluorescence imaging, initially using sequential recordings5,6 and later using simultaneous recordings with two aligned cameras.7 Under general conditions, this experimental strategy allows correlating the change of intracellular concentration with the underlying . Nevertheless, if the change of intracellular concentration is due exclusively to influx through the plasma membrane, the measurement of concentration can be, in principle, converted into a measurement of current.8 Only in this case, when no release from internal stores occurs, the combined optical measurement of using voltage-sensitive dyes permits the study of the voltage regulation of channels. The theory of obtaining an optical measurement of a fast current starts with the analysis of the dye- binding reaction occurring in the presence of an endogenous cellular buffer. This scenario has been initially studied by Kao and Tsien,9 who established that the relaxation time of the dye- binding reaction () can be approximated by the equation For all indicators, the association constant () is fast and limited by diffusion, typically to , while the dissociation constant may vary two orders of magnitude. Thus, at different free concentrations ([]) can be estimated as a function of the equilibrium constant . Whereas for high-affinity indicators with , is typically and depends on [], for low-affinity indicators with , is faster (typically ) and does not depend on []. This theoretical consideration suggests that a fast current with a duration of a few milliseconds can be reliably tracked by low-affinity indicators. While the relaxation time of the dye- binding reaction sets the limit of detection of a influx, the measurement of a current is possible only if the total entering the cell through the plasma membrane is proportional to the bound to the dye. In a previous report, we described the conditions under which this requirement is fulfilled.10 In addition, we demonstrated that this is the case of the signal associated with the action potential in the CA1 pyramidal neuron of the hippocampus.10 Here, we describe more in detail how to achieve these measurements. In particular, we describe the necessary apparatus as well as the methodological aspects of this novel approach. We reported tests with five indicators [Oregon Green 488 BAPTA-1 (OGB1), Oregon Green 488 BAPTA-6F (OG6F), Oregon Green 488 BAPTA-5N (OG5N), Bis-Fura2 (BF2), and FuraFF] and, for the low-affinity indicators, confirmed their ability to track a current by performing computer simulations. We also describe an alternative approach of data analysis using the fit of the transient to obtain the current from a reduced number of trials. We finally further discuss how this novel approach overcomes the limitations of current measurements using electrode techniques. 2.Materials and Methods2.1.Slice Preparation, Solutions, and ElectrophysiologyExperiments were approved by the Isere prefecture (Authorisation n. 38 12 01) and the specific protocol (n. 197) by the ethics committee of the Grenoble Institute of Neuroscience. Hippocampal slices ( thick) were prepared from 21 to 35 postnatal days old C57Bl6 mice as previously described11 using either a VF-200 compresstome (Precisionary Instruments, Greenville, NC) or a Leica VT1200 (Leica, Wetzlar, Germany). Slices were cut in iced extracellular solution and incubated at 37°C for 1 h before use. The extracellular solution used contained (in mM) 125 NaCl, , , 3 KCl, , , and 20 glucose, bubbled with 95% and 5% . The intracellular solution contained (in mM) , 5 KCl, , , 0.3 tris-GTP, 12 tris-phosphocreatine, and 20 HEPES, adjusted to pH 7.35 with KOH. To block and channels in voltage clamp experiments, the external solution also contained tetrodotoxin, 5 mM tetraethylammonium (TEA), 4 mM 4-aminopyridine, and 250 nM apamin, and the internal solution also contained 5 mM TEA. In this work, five indicators (all purchased from Invitrogen, Carlsbad, California) were used at the concentration of 1 mM: OGB1 (, Ref. 12), OG6F (, as reported by the vendor), OG5N (, Ref. 13), BF2 (, as reported by the vendor), and FuraFF (, Ref. 14). indicators were dissolved directly into the internal solution. In voltage-imaging experiments, cells were loaded as previously described4 with the voltage-sensitive dye JPW1114 (Invitrogen). In calibrating experiments using the -releasing caged compound nitrophenyl-EGTA (NP-EGTA)15 (Invitrogen), the internal solution also contained . All other chemicals were purchased either from Tocris (Bristol, UK) or Sigma-Aldrich (St. Louis, Missouri). Experiments were performed at 32 to 34°C using an Olympus BX51 microscope equipped with a Nikon objective. Patch-clamp recordings were made using a Multiclamp amplifier 700A (Molecular Devices, Sunnyvale, California), and voltage and current signals were acquired with the analog-to-digital board of the CCD camera. The measured with the patch pipette was corrected for the junction potential () as calculated with the JPCalc software.16 In voltage clamp recordings, the current was evoked by depolarizing pulses from to and measured in the soma by subtracting the scaled subthreshold current associated with a voltage step from to . 2.2.Imaging SystemA schematic of the imaging system is shown in Fig. 1(a). Simultaneous UV/blue light-emitting diode (LED) illumination from the epifluorescence port of the microscope was allowed by a 409 nm dichroic mirror (FF409, Semrock, Rochester, New York). UV light was either at 365 nm for photolysis or at 385 nm for excitation of Fura indicators fluorescence. The 365-nm LED was controlled by an OptoFlash (CAIRN Research Ltd., Faversham, UK) and the other LEDs were controlled by an OptoLED (Cairn). The image could be demagnified either by 0.5 or by 0.25, obtaining the fields of view shown in Fig. 1(b). The two images were separated by a 593 nm dichroic mirror and acquired with a dual-head NeuroCCD-SMQ camera (Redshirt, Decatur, Georgia) at (with the CCD) and at (with the CCD). The image was, therefore, the mirrored picture of the image. Whereas the camera has pixels per head (full resolution), to achieve the speed of 20 kHz, binned stripes of pixels were imaged. To achieve simultaneous illumination and detection of OG5N and JPW1114, both indicators were excited at 470 nm. The sensitivity of the VSD at 470 nm was about four times less than that at 532 nm. Thus, while an action potential is associated with a fractional change of fluorescence () of 2 to 8% in the proximal apical dendrite at 532 nm, the same signal is associated with of 0.5 to 2% at 470 nm. Using this configuration, the emission of JPW1114 detected by the CCD is negligible as shown in Fig. 1(c), and the emission of OG5N detected by the CCD is also negligible as shown in Fig. 1(d). Thus, it is possible to discriminate and quantify fluorescence from fluorescence. Fig. 1The imaging system. (a) Schematic of the imaging system including simultaneous UV/blue light-emitting diode illumination and the dual-head CCD camera (illustrated in the picture) for simultaneous and imaging; the image from the objective is demagnified by a coupler before detection. (b) Images of a micrometer slide from the two aligned heads of the camera using and demagnifing couplers; the distance between two adjacent lines is . (c) Top: fluorescence subimages of the apical dendrite of a CA1 hippocampal pyramidal neuron filled with 1 mM Oregon Green 488 BAPTA-5N (OG5N); resting fluorescence from the camera is with respect to that from the camera; bottom: the fluorescence transient associated with an action potential is detected with the camera, and it is negligible at the camera. (d) Top: fluorescence subimages of the apical dendrite of another CA1 hippocampal pyramidal neuron filled with JPW1114; resting fluorescence from the camera is with respect to that from the CCD; bottom: the fluorescence transient associated with an action potential is detected with the CCD, and it is negligible at the camera. 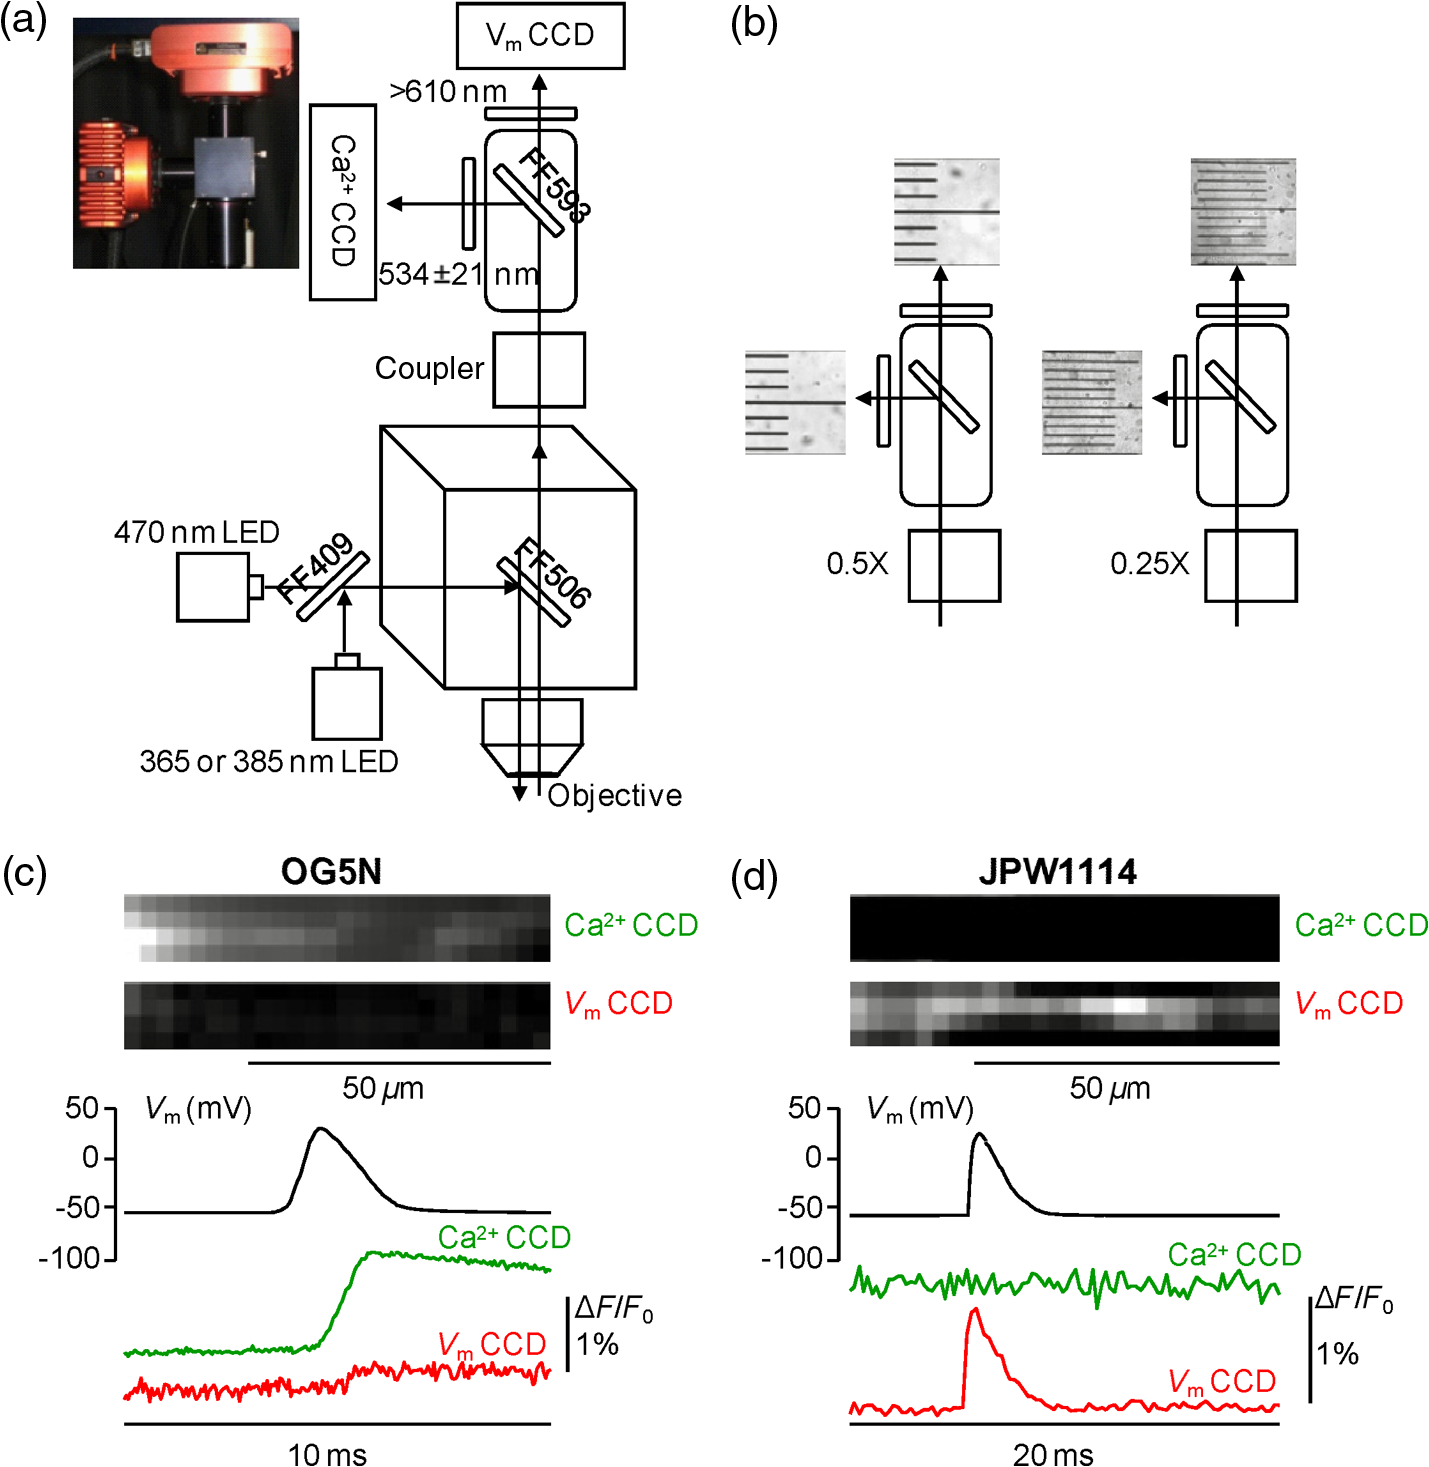 2.3.Recording and Analysis of Ca2+ and Vm Optical Signalsand recordings were performed at 20 kHz and data were initially expressed as . The high acquisition rate was necessary to prevent the loss of temporal information while applying the filtering procedure described below. recordings started 20 to 25 minutes after establishing the whole cell configuration, i.e., the time necessary to achieve the equilibrium of the indicator over the dendritic segment of recording. To improve the signal-to-noise ratio (S/N), fluorescence was generally averaged over 9 to 64 trials as specified in each figure legend and corrected for bleaching using trials without a signal. All data analysis was performed using software written in MATLAB® (The Mathworks, Natick, Massachusetts). The JPW1114- signal was calibrated in terms of change using a previously demonstrated protocol based on wide-field photorelease of L-glutamate from the caged compound 4-methoxy-7-nitroindolinyl-caged-L-glutamate (MNI-glutamate).17 Briefly, a calibration of the JPW1114- signal can be done if an electrical signal of known amplitude is available at all recording sites. In many neuronal types, activation of a large portion of ionotropic glutamate receptors makes them the dominant conductance and the resulting will be 0 mV in all the illuminated area. In CA1 hippocampal pyramidal neurons, a calibration is possible since the resting is uniform over the whole cell.18 Thus, the JPW1114- signal associated with a saturating photorelease of L-glutamate will correspond to a change of from the resting to 0 mV. A representative cell where this procedure was applied is shown in Fig. 2(a). The JPW1114- signal associated with an action potential was recorded from the initial apical dendritic segment of a CA1 hippocampal pyramidal neuron [Fig. 2(b)]. After this recording, we added tetrodotoxin to block voltage-gated channels and 1 mM MNI-glutamate to the external solution. Starting from the resting (), we uncaged L-glutamate producing a depolarization to 0 mV. The glutamate-induced optical signal [Fig. 2(b), green] provided the calibration for the action potential. Statistical significance was evaluated using either the paired test or the two-population (2P) test. Fig. 2Calibration of JPW1114- in terms of . (a) Initial apical dendritic segment of a CA1 hippocampal pyramidal neuron loaded with the VSD JPW1114; the region from where fluorescence was averaged is outlined in yellow. (b) JPW1114- associated with an action potential or glutamate photorelease; the calibration protocol is applied from the resting membrane potential, which is assumed to be uniform over the cell; the massive ionotropic glutamate receptors activation drives the illuminated dendritic area to 0 mV. The action potential trace is from an average of 32 trials; the calibration trace was from an average of nine trials. 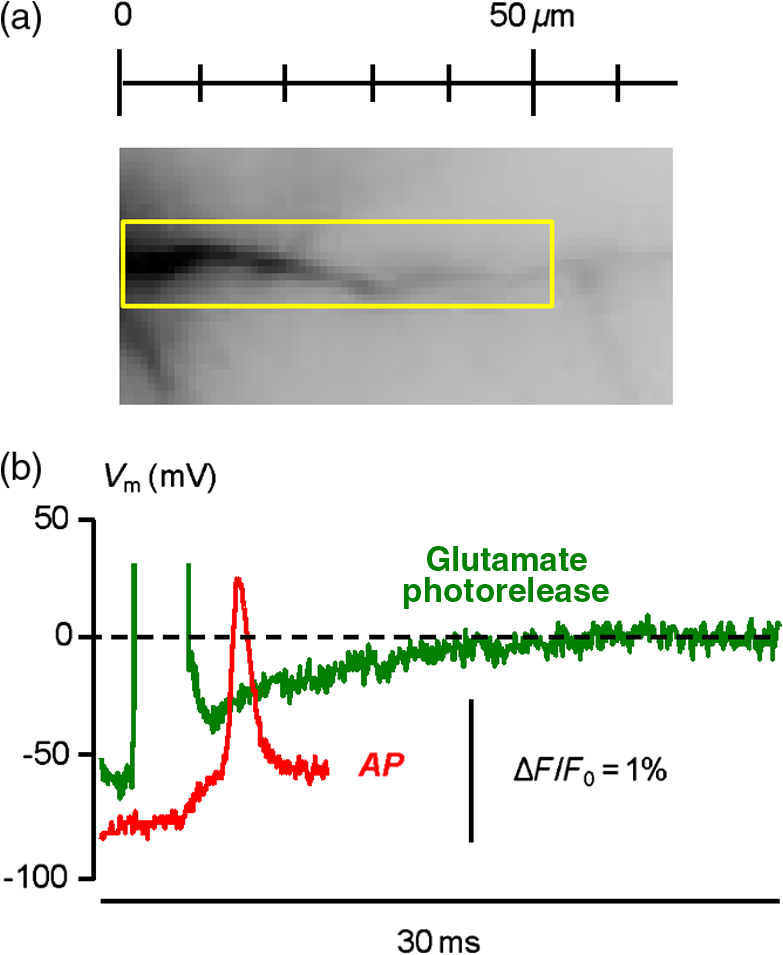 2.4.Computer SimulationsThe results of the analysis of the kinetics of the five indicators were compared with those obtained by computer simulations using a previously published theoretical framework.19 Briefly, we simulated the reaction of the dye ([D]) with in the presence of 1 mM of an endogenous buffer ([B]). For comparison with voltage clamp experiments, using the current measured with the patch electrode as current (), we numerically solved the set of differential equations: The values of the association and equilibrium constants of the endogenous buffer were and , while . The value of the association constant of all indicators was , as reported by Kao and Tsien,9 while was derived for each different indicator from the values reported above. Numerical solutions were obtained using the MATLAB® function “ode45.” 3.Results3.1.Comparative Analysis of the Kinetics of Different IndicatorsThe theoretical considerations described in the Introduction suggest that the kinetics of a fast current with a duration of a few milliseconds can be reconstructed from the fluorescence change of a low-affinity indicator. The ultimate strategy to test this hypothesis is to verify that the signal is linear with the integral of the current measured, under voltage clamp, in the presence of and blockers (see Materials and Methods). The protocol used in these tests, illustrated in Fig. 3(a), consisted of two depolarizing square pulses. The current associated with the first pulse, from to not evoking a current, was scaled and subtracted from the current associated with a pulse from to . This procedure permitted the extraction of the current from the total current recording containing the leak current and the capacity transient. The integral of the current obtained in this way was then compared to the signal. Figure 3(b) shows results from five representative cells, each recorded with a different indicator: the first 7 ms of normalized to 1 (black traces), the corresponding normalized integrals (red traces), and the associated normalized signals (blue traces). The signals obtained in these experiments were faithfully mimicked by the results of computer simulations, reported on the right, performed as described in the Materials and Methods. Fig. 3Kinetics of different indicators investigated in voltage clamp. (a) Voltage clamp protocol consisting of two 16 ms voltage pulses from , the first one below the threshold for activation of channels and the second one to ; experiments were performed in the presence of and channel blockers; the current () was extracted by subtraction of the scaled subthreshold current; the kinetics of the current were analyzed in correlation with that of the fluorescence change in the initial segment of the apical dendrite; all data were averages of 16 trials. (b) and from five representative cells filled with 1 mM of one of the following indicators: Oregon Green 488 BAPTA-1 (OGB1), Oregon Green 488 BAPTA-6F (OG6F), OG5N, Bis-Fura2 (BF2), or FuraFF; the integrals of () are also shown; signals are normalized to their maxima over the first 7 ms after the pulse beginning; simulations of the dye- binding reaction are reported on the right. (c) From two of the representative cells filled either with OGB1 or with OG5N, the and normalized to their maxima over the first 4 ms after the pulse beginning; the difference between the two curves is also reported. (d) of the surface of () obtained for each of the five indicators tested from the number of cells reported; OGB1: , ; OG6F: , ; OGB1: , ; BF2: , ; FuraFF: , ; the values of for OGB1 with respect to those for OG5N, and the values of for BF2 with respect to those for FuraFF were significantly different (two-population test, and , respectively). Panels (a) and (c) were adapted from Ref. 10. 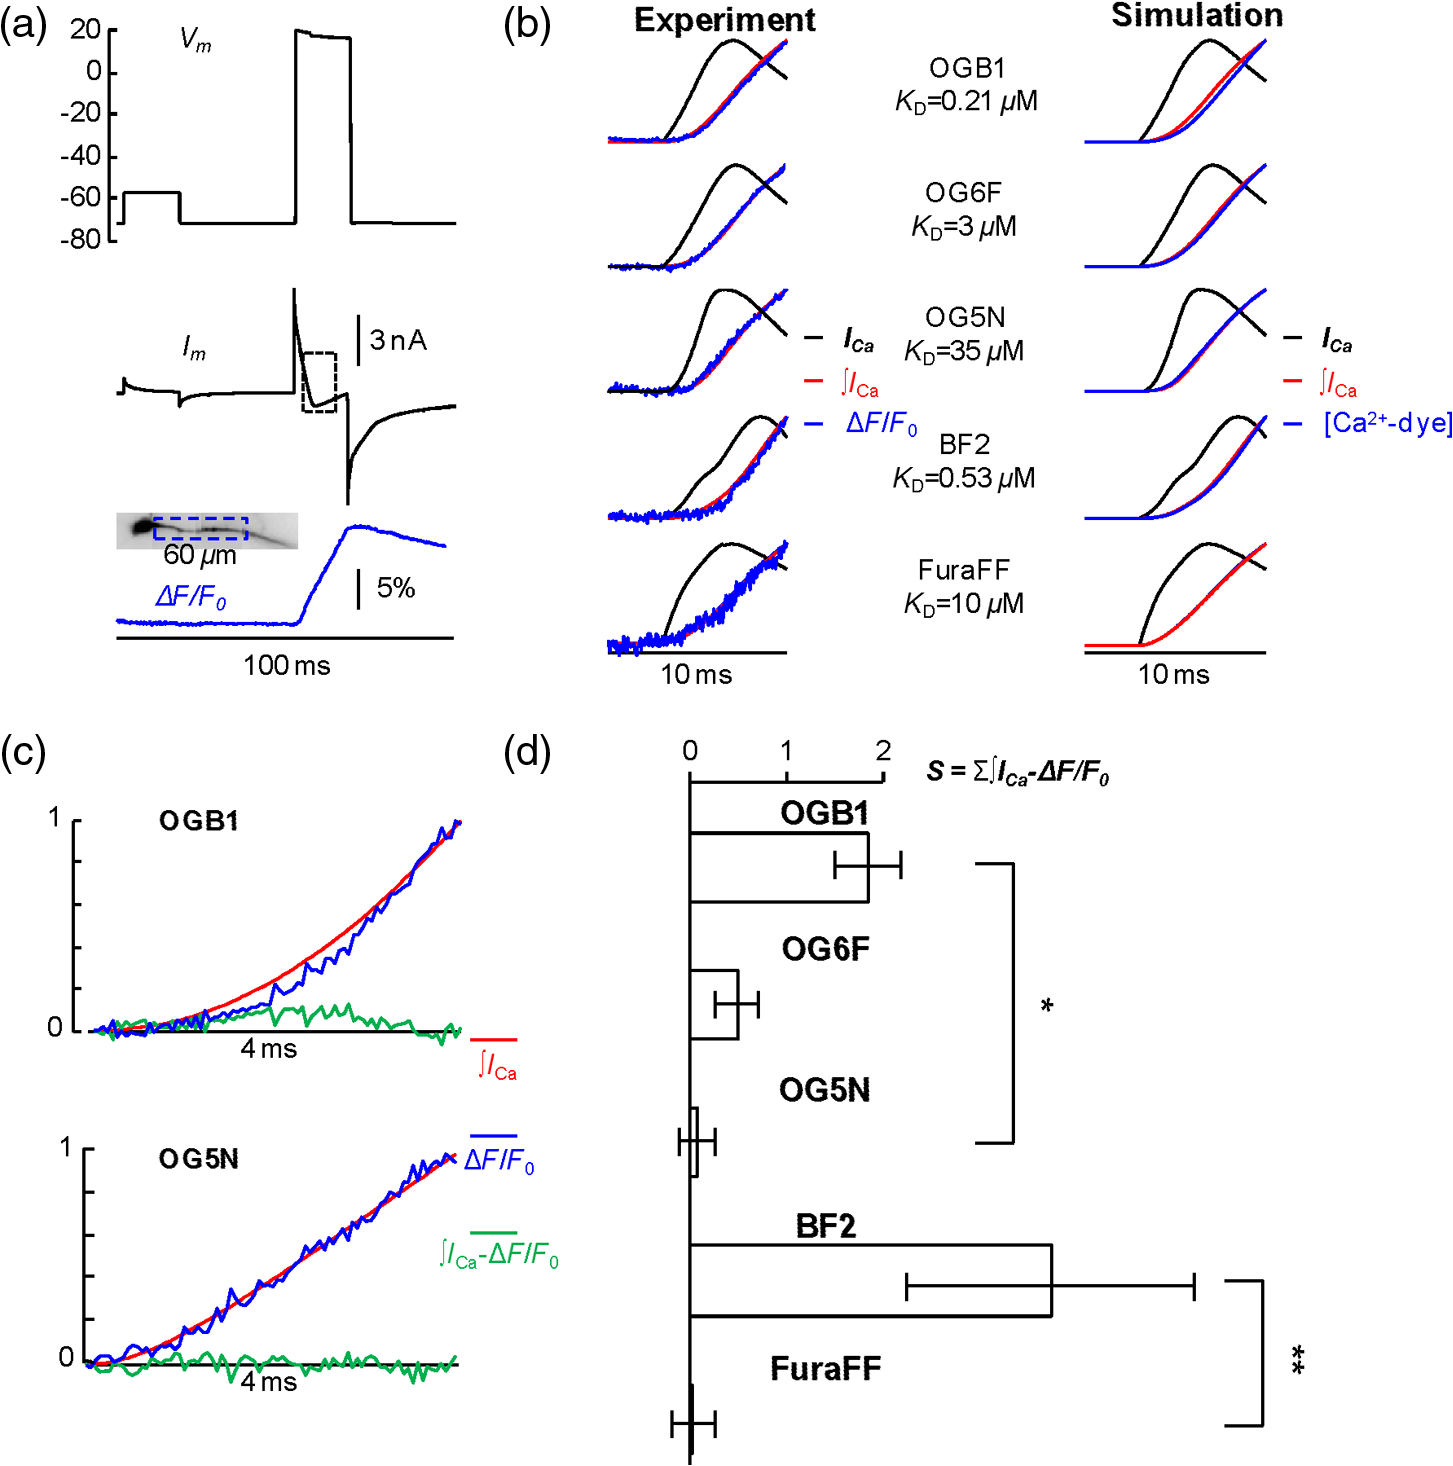 To quantify the difference of kinetics between the signal and the integral we computed the area () of the difference of the two curves normalized to 1 over the first 4 ms as shown in Fig. 3(c). The statistics of for the five groups of cells ( to 12 for each indicator) is illustrated in Fig. 3(d). The values of with the two low-affinity indicators, OG5N and FuraFF, were statistically different from the values of with the high-affinity indicators, OGB1 and BF2 (2P test, ). In particular, the low-affinity indicators were able to track fast currents. OG5N- has an S/N more than times three larger than that of FuraFF- when associated with the same signal. For this reason, OG5N should be used for measuring relative small currents as those reported here. However, FuraFF can be better combined with JPW1114 for simultaneous and imaging7 and should be used for larger currents where fluorescence averaging over many trials is less critical. The tests presented here suggest that all organic indicators with for of can be potentially used to faithfully extract the time course of a fast current. 3.2.Calibration of the OG5N-ΔF/F0 Signal and Extraction of the Ca2+ CurrentAn important aspect of the imaging technique is its ability to provide an estimate of the intracellular concentration. In general terms, this estimate is not straightforward since the important information may involve knowing the free concentration () as well as the that binds to the dye and to the endogenous buffer. However, for a quantitative estimate of , the important information is exclusively the total concentration () entering the cell. The estimate of corresponding to a particular signal will allow determining the charge concentration and deriving the corresponding volume density (). A way to produce a of known amplitude is to release from a caged compound. The cell in Fig. 4(a) was filled with an intracellular solution, also containing of NP-EGTA and . NP-EGTA before photolysis is a high-affinity chelator (). The decreases by a factor of 12,500 after photolysis.15 While in the pipette 50% of the NP-EGTA is bound to , this percentage is unknown in the cell where it is regulated by the global homeostasis. However, when the cell of Fig. 4(a) was depolarized from to , a persistent OG5N- signal was observed. Since this signal typically corresponds to times the signal associated with one action potential and associated with an action potential in this dendrite type is ,20 at is . Since of NP-EGTA is 80 nM, at , of NP-EGTA is always bound to . Under this condition, as shown in Fig. 4(a), the indicator is still not saturated since a further depolarization step of +50 mV produced an OG5N- signal . Having established that at , is bound to NP-EGTA and available for release, the calibration protocol illustrated in Fig. 4(b) consisted of applying a sequence of 16 UV pulses (of 20 ms duration every 5 s) and measuring the OG5N- signal associated with each pulse. The released at the pulse follows the geometric progression:21 where . The OG5N- corresponding to a given is obtained by fitting this geometric progression to the sequential decrease of the OG5N- amplitude. In this particular cell, we obtained that an OG5N- of 1% corresponded to . From this calibration the associated with the action potential was derived in the following way, as shown in Fig. 4(c). First, the signal was converted into a charge-to-volume ratio (Q/V) using the equation where is the fundamental charge, dm is the decimeter unit, and is the Avogadro number. Second, the converted signal was filtered using a Savitzky-Golay filter and preserving the kinetics of the original signal.22 Finally, was obtained by applying the time derivative to the filtered signal as shown in Fig. 4(c). Previously reported data analysis using this calibration procedure indicated that the corresponding to an OG5N- signal of 1% varies from 16 to .10 Thus, a standard estimate of OG5N- corresponding to· can be applied in cells where the calibration protocol is not directly performed.Fig. 4Calibration of currents using photorelease. (a) OG5N- from the initial segment of the cell shown on the top (region of fluorescence average outlined) associated with a depolarization from to (top) and from to (bottom). (b) From the same cell filled with a solution containing nitrophenyl-EGTA and , sequential UV-flashes (pulses) at produced an OG5N- signal of decreasing amplitude (left); the OG5N- amplitude versus the pulse was fitted with a geometric sequence to obtain the efficiency of each pulse ( in this example); considering the photoreleased by the first pulse, a signal of 1% corresponded to in this specific cell. (c) Calibrated OG5N- (middle trace) associated with an action potential (top trace) and corresponding (bottom trace). Data are from an average of 64 trials. Panel (a) was adapted from Ref. 10.  3.3.Estimate of Signals by ΔF/F0 Filtering or Curve FittingThe OG5N- signal associated with an action potential can be measured from a dendritic segment with good S/N, which can be further improved by averaging several trials. The extraction of , however, is based on the calculation of the time derivative, which requires the signal noise to be smaller than the signal change between two consecutive samples. A way to obtain this condition is to temporally filter the signal up to the limit of distortion of its kinetics. In our previous report, we have shown that the Savitzky-Golay algorithm is an optimal filtering tool for improving the S/N of the OG5N- signal without significant temporal distortion using time windows of up to 20 to 30 samples.10 The application of this procedure allows extracting from relatively large dendritic compartments and averaging several trials. The challenge for the improvement of data analysis was to go beyond the limitations of the filtering approach. This can be done by fitting the raw or the filtered OG5N- signal with a model function obtaining a noiseless curve that mimics the time course of the OG5N- signal. While the choice of the model might be arbitrary, a simple function that resembles the time course of the OG5N- transient is the sigmoid. In particular, the OG5N- signal normalized to its asymptotic value can be mimicked by the products of sigmoid functions : where is time, and are the parameters to be determined by the fit, and is the arbitrary number of sigmoid functions. We tried several integer values for , and we found that 3 was the minimum number of sigmoid functions always providing a fit with the same kinetics of the OG5N- signal. The product of three sigmoid functions was, therefore, set as the general model to fit the signal, and its ability to extract either from small dendritic regions or from relatively large regions in single trials was assessed in the cell reported in Fig. 5(a). In particular, we analyzed signals associated with an action potential from an average of 32 trials or from a single trial [Fig. 5(b)]. Figure 5(c) shows the signals from the average of 32 trials in a large dendritic region of length (region A) and in a small dendritic site of (region B). The same panel (right traces) also shows the signal in region A from the single trial. Each raw signal was filtered with the Savitzky-Golay algorithm at a time window of 10, 20, or 40 samples. Alternatively, it was fitted with the three-sigmoid model. The filtering algorithm improves the S/N but starts producing a temporal distortion at 40 samples. The consequent distortion of the extracted is evident in the case of the average of 32 trials in region A shown in the left column of Fig. 5(d). While in this case the obtained by filtering with a time window of 20 samples has an acceptable S/N, the same filtering approach applied to extract either from region B or from region A in a single trial generates a noisy signal (middle and right traces). In all cases, however, the fit approach generates noiseless curves that faithfully reproduce the time course of the OG5N- signals from which signals can be extracted. This technical improvement in data analysis is critical for many applications. In particular, when the spikes occurrence is stochastic, must be extracted from single trials. Alternatively, the gain in analysis performance can be spent to extract from small or relatively dim regions.Fig. 5Extraction of the current using filtering or curve fitting. (a) Fluorescence images of a cell filled with OG5N; region A comprises of dendrite from where fluorescence was averaged; region B is a single pixel. (b) Action potential signal from an average of 32 trials (left) or from a single trial (right). (c) From the same trials above, OG5N- signals from the average of 32 trials in region A (left), from the average of 32 trials in region B (middle), or from the single trial in region B (right); the signals were either unfiltered (top, blue traces), filtered with the Savitzky-Golay algorithm at time windows of 10 (SG10), 20 (SG20), and 40 (SG40) samples, or fitted by the product of three sigmoid functions (FIT); the filter algorithm and the fit were implemented by the “smooth” and “lsqcurvefit” MATLAB® functions, respectively. (d) From the filtered or the fitted traces above, were calculated for the three cases: average of 32 trials in region A (left), average of 32 trials in region B (middle), or single trial in region A (right); the approach of data fitting permits extraction from sites of using averaged trials or from larger regions in single trials.  3.4.Simultaneous and Optical MeasurementsTo illustrate the ability of simultaneous and optical measurements to investigate currents and the behavior of underlying channels, we report here an analysis of the associated with an action potential in the initial segment of the apical dendrite of the CA1 hippocampal pyramidal neuron. In the cell of Fig. 6(a), action potentials were evoked by current injection and recorded optically in the first dendritic segment as reported in the top of Fig. 6(b). One action potential was evoked starting from and another action potential was evoked starting from . The simultaneously recorded signals are shown in the bottom of Fig. 6(b). The associated with the action potential starting from was larger than that of the associated with the action potential starting from . The time course of can be precisely correlated with the time course of as shown in Fig. 6(c). In 14 cells in which this protocol was applied, the mean of the peak in the first dendritic segment was for the action potential starting at and for the action potential starting at as shown in Fig. 6(d). The was consistently larger for the action potential starting at (, paired test). As demonstrated in a previous report,10 the different amplitude observed under the two conditions was mainly due to activation of T-type voltage-activated channels, which recovered from inactivation when the cell was hyperpolarized to .23 Fig. 6Dendritic associated with an action potential at different starting . (a) Fluorescence images of a cell filled with OG5N and JPW1114; the region from where fluorescence was average is outlined. (b) Optical measurements of (top traces) and (bottom traces) with an action potential starting either at or . (c) superimposed to the optically recorded action potential in the two cases. (d) of the peak associated with an action potential starting either at or from 14 cells; the peak was significantly higher for the action potential starting at (, paired test). 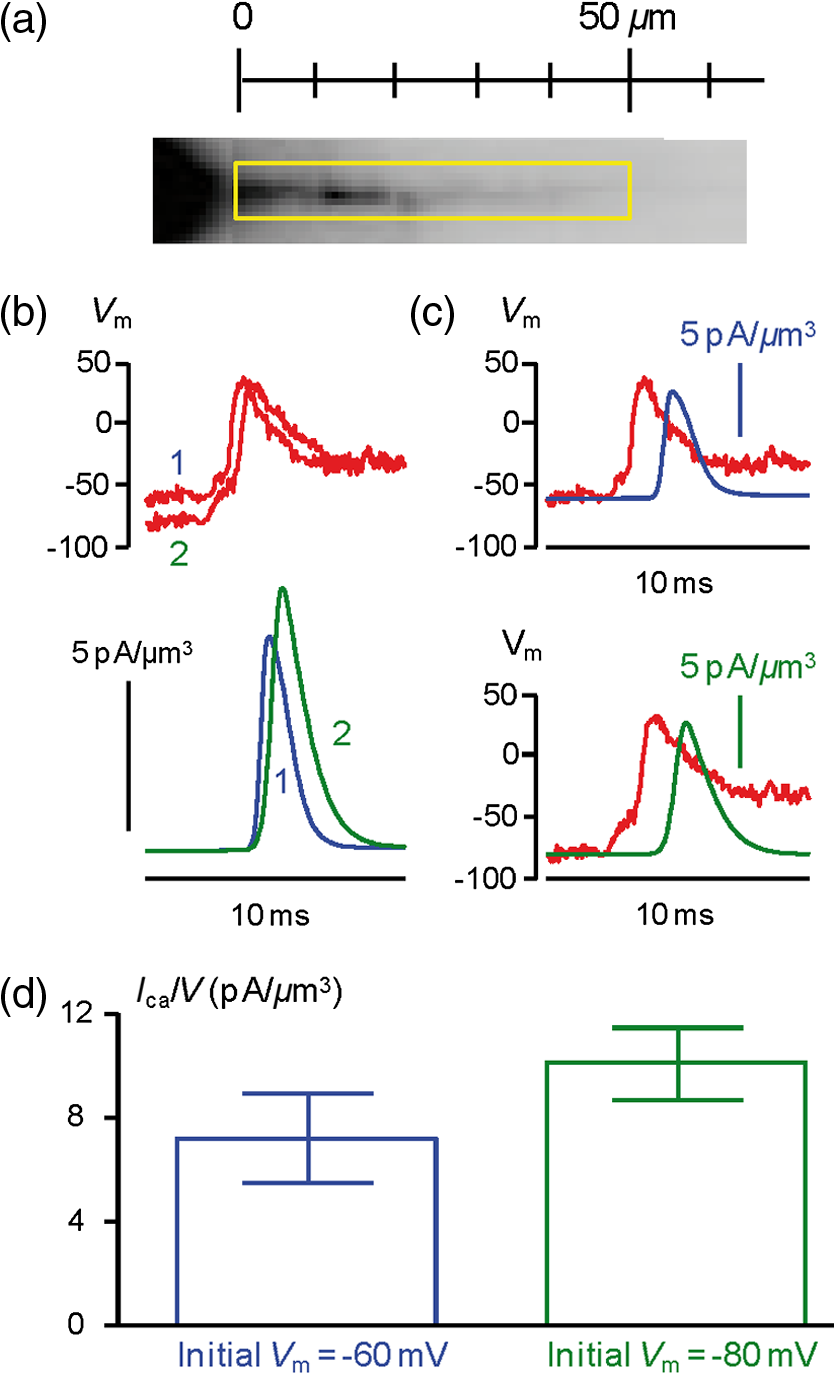 4.DiscussionSince the introduction of organic VSD and thanks to the work of Lawrence B. Cohen and colleagues, it was expected that the improved S/N of measurements24 could open the gate to applications where an imaging approach could eventually overcome the intrinsic limitations of electrode techniques. The more recent introduction of fluorescent probes that could be directly injected into cells25 allowed recordings of of .26 The patch clamp technique, however, is routinely used to measure not only , but also the membrane current in the voltage clamp mode. Our current understanding of ion channel function is mainly derived from the use of the patch clamp techniques. This measurement, in a single-electrode or two-electrode voltage clamp, consists of maintaining the cell at a given by compensating the cell current with an injected current.27 The current measured with the electrode is, therefore, the summation of the filtered currents from all different cellular regions, including remote regions where is unclamped.28 To study the function of native ion channels at different sites of neurons and under physiological electrical activity, this approach is practically not applicable for a series of reasons. First, the voltage clamp condition is not applicable in a cell where is not uniform. Second, although local current measurements from a limited number of cellular sites can be obtained using dendritic patch clamp recordings,29 not only the number of recording sites is limited with respect to an imaging approach but each current is also the summation of currents from different sites, filtered with respect to the site of recording. In other words, a voltage clamp current measurement carries no information about the site of origin of the current. Third, the physiological behavior of a channel occurs when changes physiologically, which is not the condition of the voltage clamp. Injecting a current to dynamically clamp the cell and reproducing a physiological change, for instance, an action potential, does not solve the problem since the potential drop due to the series resistance and the space-clamp of the cell will generate a nonuniform distortion of the form. Fourth, separation of a current mediated by a specific ion requires the pharmacological block of all other currents. Obviously, these channels are necessary for a physiological change. For instance, an action potential requires , , and channels, and the study of a specific current during this event would require the block of the other two currents. For currents, the imaging approach described in this report potentially overcomes all these limitations. In contrast to patch clamp recordings, these calcium optical currents can be measured in conditions of a physiological change of . The measured currents are confined to the sites where they are recorded. The additional information on local change, necessary to correlate the behavior of the conductance with its biophysical properties, is obtained by performing combined and imaging experiments. The possibility to extract from imaging experiments was foreseen in the past. Thus, as expected by the pioneering study of Kao and Tsien9 and by the computer simulations reported here, the kinetics of can be reconstructed without distortion and correlated with change. The crucial information on the at the same site of the is given by the concomitant optical measurement. In this way, it is possible to follow the activation and deactivation of the channel as a function of the change during physiological activity. The optical measurement of is, however, affected by some limitations. First, obviously, it cannot be performed when a concomitant release from internal stores occurs. Second, it cannot be applied to measure a slow that occurs at the same time scale of sequestration and extrusion. This, as shown in a previous report,10 will introduce a negative current artifact in the measurement. Third, in the optical measurement, the calibration can be provided in terms of , while the evaluation of requires precise morphological reconstruction of the site of recording. The optical measurements of became possible only recently, thanks to the remarkable advance in light sources and detection devices for and ion imaging.30 The simultaneous measurement of and can be also achieved using the low-affinity indicator Fura-FF and the optical settings described in a previous article.7 The S/N of Fura-FF signal, however, is substantially lower compared to the equivalent OG5N- signal. Another possibility for simultaneous measurements of and using OG5N is its combination with a red-excitable VSD, such as those described by Yan et al.31,32 Such indicators would allow combining simultaneous blue illumination for OG5N with red optimal illumination for the VSD. Among these indicators, we tested Di-2-ANBDQ(F)PTEA, and we found that its fluorescence excited at 470 nm decreases in intensity when is depolarized (data not shown). Thus, when exciting Di-2-ANBDQ(F)PTEA at 470 and at 630 nm simultaneously, the signal associated with a change is smaller than the equivalent signal obtained by red illumination only. Finally, for signals that are consistent from trial to trial, measurements of and can be obtained sequentially with the combination of JPW1114 and OG5N by alternating optimal excitation of fluorescence at 470 nm with optimal excitation of fluorescence at 532 nm. The present approach should drastically improve our understanding of the physiological function of channels by providing the possibility to explore the biophysics of native channels during physiological activity in subcellular loci of the complex neuronal architecture. The method described here is, therefore, another important brick in the long history of membrane potential imaging applications. AcknowledgmentsWe thank Philippe Moreau for technical help and Jean-Claude Vial for useful discussions. This work was supported by the Agence Nationale de la Recherche (Grant Voltimagmicro, program Emergence-10, Labex Ion Channels Science and Therapeutics: program number ANR-11-LABX-0015 and National Infrastructure France Life Imaging Noeud Grenoblois). ReferencesL. B. Cohen et al.,
“Changes in axon fluorescence during activity: molecular probes of membrane potential,”
J. Membr. Biol., 19
(1), 1
–36
(1974). http://dx.doi.org/10.1007/BF01869968 JMBBBO 0022-2631 Google Scholar
L. B. Cohen, B. M. Salzberg and A. Grinvald,
“Optical methods for monitoring neuron activity,”
Annu. Rev. Neurosci., 1 171
–182
(1978). http://dx.doi.org/10.1146/annurev.ne.01.030178.001131 ARNSD5 0147-006X Google Scholar
M. Zochowski et al.,
“Imaging membrane potential with voltage-sensitive dyes,”
Biol. Bull., 198
(1), 1
–21
(2000). http://dx.doi.org/10.2307/1542798 BIBUBX 0006-3185 Google Scholar
M. Canepari, K. Vogt and D. Zecevic,
“Combining voltage and calcium imaging from neuronal dendrites,”
Cell. Mol. Neurobiol., 28
(8), 1079
–1093
(2008). http://dx.doi.org/10.1007/s10571-008-9285-y CMNEDI 0272-4340 Google Scholar
M. Canepari, M. Djurisic and D. Zecevic,
“Dendritic signals from rat hippocampal CA1 pyramidal neurons during coincident pre- and post-synaptic activity: a combined voltage- and calcium-imaging study,”
J. Physiol., 580
(2), 463
–484
(2007). http://dx.doi.org/10.1113/jphysiol.2006.125005 JPHYA7 0022-3751 Google Scholar
M. Canepari and K. E. Vogt,
“Dendritic spike saturation of endogenous calcium buffer and induction of postsynaptic cerebellar LTP,”
PLoS ONE, 3
(12), e4011
(2008). http://dx.doi.org/10.1371/journal.pone.0004011 1932-6203 Google Scholar
K. E. Vogt et al.,
“High-resolution simultaneous voltage and Ca2+ imaging,”
J. Physiol., 589
(3), 489
–494
(2011). http://dx.doi.org/10.1113/tjp.2011.589.issue-3 JPHYA7 0022-3751 Google Scholar
B. L. Sabatini and W. G. Regehr,
“Optical measurement of presynaptic calcium currents,”
Biophys. J., 74
(3), 1549
–1563
(1998). http://dx.doi.org/10.1016/S0006-3495(98)77867-1 BIOJAU 0006-3495 Google Scholar
J. P. Kao and R. Y. Tsien,
“Ca2+ binding kinetics of fura-2 and azo-1 from temperature-jump relaxation measurements,”
Biophys. J., 53
(4), 635
–639
(1988). http://dx.doi.org/10.1016/S0006-3495(88)83142-4 BIOJAU 0006-3495 Google Scholar
N. Jaafari, M. De Waard and M. Canepari,
“Imaging fast calcium currents beyond the limitations of electrode techniques,”
Biophys. J., 107
(6), 1280
–1288
(2014). http://dx.doi.org/10.1016/j.bpj.2014.07.059 BIOJAU 0006-3495 Google Scholar
N. Jaafari et al.,
“Economic and simple system to combine single-spot photolysis and whole-field fluorescence imaging,”
J. Biomed. Opt., 18
(6), 060505
(2013). http://dx.doi.org/10.1117/1.JBO.18.6.060505 JBOPFO 1083-3668 Google Scholar
B. L. Sabatini, T. G. Oertner and K. Svoboda,
“The life cycle of Ca(2+) ions in dendritic spines,”
Neuron, 33
(3), 439
–452
(2002). http://dx.doi.org/10.1016/S0896-6273(02)00573-1 NERNET 0896-6273 Google Scholar
M. Canepari and D. Ogden,
“Kinetic, pharmacological and activity-dependent separation of two Ca2+ signalling pathways mediated by type 1 metabotropic glutamate receptors in rat Purkinje neurones,”
J. Physiol., 573
(1), 65
–82
(2006). http://dx.doi.org/10.1113/jphysiol.2005.103770 JPHYA7 0022-3751 Google Scholar
R. Schneggenburger and E. Neher,
“Intracellular calcium dependence of transmitter release rates at a fast central synapse,”
Nature, 406
(6798), 889
–893
(2000). http://dx.doi.org/10.1038/35022702 NATUAS 0028-0836 Google Scholar
G. C. Ellis-Davies and J. H. Kaplan,
“Nitrophenyl-EGTA, a photolabile chelator that selectively binds Ca2+ with high affinity and releases it rapidly upon photolysis,”
Proc. Natl. Acad. Sci. USA, 91
(1), 187
–191
(1994). http://dx.doi.org/10.1073/pnas.91.1.187 1091-6490 Google Scholar
P. H. Barry,
“JPCalc, a software package for calculating liquid junction potential corrections in patch-clamp, intracellular, epithelial and bilayer measurements and for correcting junction potential measurements,”
J. Neurosci. Methods, 51
(1), 107
–116
(1994). http://dx.doi.org/10.1016/0165-0270(94)90031-0 JNMEDT 0165-0270 Google Scholar
K. E. Vogt et al.,
“Combining membrane potential imaging with L-glutamate or GABA photorelease,”
PLoS ONE, 6
(10), e24911
(2011). http://dx.doi.org/10.1371/journal.pone.0024911 1932-6203 Google Scholar
S. Gasparini and J. C. Magee,
“Phosphorylation-dependent differences in the activation properties of distal and proximal dendritic Na+ channels in rat CA1 hippocampal neurons,”
J. Physiol., 541
(3), 665
–672
(2002). http://dx.doi.org/10.1113/jphysiol.2002.020503 JPHYA7 0022-3751 Google Scholar
M. Canepari and F. Mammano,
“Imaging neuronal calcium fluorescence at high spatio-temporal resolution,”
J. Neurosci. Methods, 87
(1), 1
–11
(1999). http://dx.doi.org/10.1016/S0165-0270(98)00127-7 JNMEDT 0165-0270 Google Scholar
M. Maravall et al.,
“Estimating intracellular calcium concentrations and buffering without wavelength ratioing,”
Biophys. J., 78
(5), 2655
–2667
(2000). http://dx.doi.org/10.1016/S0006-3495(00)76809-3 BIOJAU 0006-3495 Google Scholar
M. Canepari et al.,
“Photochemical and pharmacological evaluation of 7-nitroindolinyl-and 4-methoxy-7-nitroindolinyl-amino acids as novel, fast caged neurotransmitters,”
J. Neurosci. Methods, 112
(1), 29
–42
(2001). http://dx.doi.org/10.1016/S0165-0270(01)00451-4 JNMEDT 0165-0270 Google Scholar
A. Savitzky and M. J. E. Golay,
“Smoothing and differentiation of data by simplified least squares procedures,”
Anal. Chem., 36 1627
–1639
(1964). http://dx.doi.org/10.1021/ac60214a047 ANCHAM 0003-2700 Google Scholar
C. C. Kuo and S. Yang,
“Recovery from inactivation of T-type Ca2+ channels in rat thalamic neurons,”
J. Neurosci., 21 1884
–1892
(2001). JNRSDS 0270-6474 Google Scholar
W. N. Ross et al.,
“A large change in dye absorption during the action potential,”
Biophys. J., 14
(12), 983
–986
(1974). http://dx.doi.org/10.1016/S0006-3495(74)85963-1 BIOJAU 0006-3495 Google Scholar
S. Antic and D. Zecevic,
“Optical signals from neurons with internally applied voltage-sensitive dyes,”
J. Neurosci., 15
(2), 1392
–1405
(1995). JNRSDS 0270-6474 Google Scholar
M. Canepari et al.,
“Imaging inhibitory synaptic potentials using voltage sensitive dyes,”
Biophys. J., 98
(9), 2032
–2040
(2010). http://dx.doi.org/10.1016/j.bpj.2010.01.024 BIOJAU 0006-3495 Google Scholar
B. Sakmann and E. Neher,
“Patch clamp techniques for studying ionic channels in excitable membranes,”
Annu. Rev. Physiol., 46 455
–472
(1984). http://dx.doi.org/10.1146/annurev.ph.46.030184.002323 ARPHAD 0066-4278 Google Scholar
S. R. Williams and S. J. Mitchell,
“Direct measurement of somatic voltage clamp errors in central neurons,”
Nat. Neurosci., 11
(7), 790
–798
(2008). http://dx.doi.org/10.1038/nn.2137 NANEFN 1097-6256 Google Scholar
G. J. Stuart and N. Spruston,
“Probing dendritic function with patch pipettes,”
Curr. Opin. Neurobiol., 5
(3), 389
–394
(1995). http://dx.doi.org/10.1016/0959-4388(95)80053-0 COPUEN 0959-4388 Google Scholar
R. Davies, J. Graham and M. Canepari,
“Light sources and cameras for standard in vitro membrane potential and high-speed ion imaging,”
J. Microsc., 251
(1), 5
–13
(2013). http://dx.doi.org/10.1111/jmi.2013.251.issue-1 JMICAR 0022-2720 Google Scholar
W. L. Zhou et al.,
“Intracellular long-wavelength voltage-sensitive dyes for studying the dynamics of action potentials in axons and thin dendrites,”
J. Neurosci. Methods, 164
(2), 225
–239
(2007). http://dx.doi.org/10.1016/j.jneumeth.2007.05.002 JNMEDT 0165-0270 Google Scholar
P. Yan et al.,
“Palette of fluorinated voltage-sensitive hemicyanine dyes,”
Proc. Natl. Acad. Sci. USA, 109
(50), 20443
–20448
(2012). http://dx.doi.org/10.1073/pnas.1214850109 1091-6490 Google Scholar
BiographyNadia Jaafari obtained her PhD from the University of Marseille and worked for several years in the laboratory of J.M. Henley at Medical Research Council Centre for Synaptic Plasticity in Bristol. She is currently an INSERM senior research associate in the laboratory of Marco Canepari. Elodie Marret graduated from the University Joseph Fourier in Grenoble, and she is currently an INSERM technician in the laboratory of Marco Canepari. Marco Canepari is an INSERM first-class researcher (CR1) working in the Laboratoire Interdisciplinare de Physique in Grenoble. He obtained his PhD at SISSA/ISAS in Trieste, and he worked in several laboratories as a postdoctoral scientist, including the laboratory of Dejan Zecevic at Yale University School of Medicine. |


