1.IntroductionThe date August 14, 1976, has come to mark the turning point in my scientific life. On that day, I began my research involving the development of voltage-sensitive dyes, joining Larry Cohen, Brian Salzberg, and Amiram Grinvald at the Marine Biological Laboratory in Woods Hole, Massachusetts. This research has led to my following a path toward ontogenetic opto-electrophysiology for the remainder of my career. 2.BeginningIn the early 1970s, I was carrying out light-scattering studies on depolarization-induced swelling phenomena exhibited by synaptosomes, under Professor Akira Inouye, in Kyoto University.1 During the course of these experiments, I was following, with serious interest, a series of papers by Larry Cohen, beginning with the paper entitled “Changes in axon light scattering and birefringence during nerve activity” by L. B. Cohen, R. D. Keynes, and B. Hille, which appeared in 1968 in the journal Nature.2 This provided great incentive, and, soon in the summer of 1976, I contacted Larry Cohen at the Marine Biological Laboratory (MBL) in Woods Hole, and immediately (on that very day), arranged to visit the MBL, where I began work on optical recording of membrane potential using voltage-sensitive dyes (VSDs), joining Larry Cohen, Brian Salzberg, and Amiram Grinvald. That time was during the infancy of the development of VSDs, just four years after the initial report of merocyanine I,3,4 and the schedule of the experiments was very hard. In later years, Amiram and I called those days “our Woods Hole time,” remembering our past Woods Hole life. The laboratory bubbled to create the forefront of a new science. For the first few days, I felt a little diffident and behind Larry, Brian, and Amiram. However, soon their heat sparked me to become an ardent “opticalist,” and later I was called “Merocyanino” by Brian: I still have that poem that Brian wrote about Merocyanino… “Oh, Kohtaro Kamino is a Merocyanino, and a member of that very famous band… or something like that!” It was most rewarding to have witnessed the birth of a new ongoing frontier field in science close at hand, and it was an experience I have never forgotten. Furthermore, the years 1976 and 1977, when I was a member of the laboratory of Larry Cohen in Woods Hole and at Yale, was a transformative period that pointed me in a new direction for my then future research. In this paper, I will attempt to describe, somewhat subjectively, my trajectory from early VSDs to the beginnings of ontogenetic opto-physiology using the VSDs as a continuation of the work in Larry’s laboratory. 3.VSD-Screening: Beginning of the TaskIn 1976 and 1977, when I was working in Larry’s laboratory, the research program was at the stage of screening of VSDs and of the preliminary examinations of multiple-site optical recording of membrane potential. Up to that time, utilizing giant axons of the squid as screening preparations, Larry’s team had already tested several hundred dyes, looking for useful voltage-sensitive signals3–6 (for a review see Ref. 7), and they had shown that almost all of these dye-signals depended linearly on changes in membrane potential (for a review see Ref. 7). However, in the early 1970s, despite the initial application of a merocyanine dye to invertebrate central neurons,8,9 the identification of VSDs was not yet complete. That is, the application of optical techniques to neurons of ordinary dimensions remained limited by several interrelated factors: the small size of the signals, pharmacological effects, photodynamic damage, and dye bleaching. So we have continued to synthesize additional dyes and attempted to improve the measuring techniques in order to solve these serious problems.1011.–12 At that stage, although no theoretical or experimental correlation had yet been obtained between the chemical structures of the dyes and their voltage-sensitivity, some analogues of merocyanine, oxonol, and styryl dyes were empirically identified based upon data derived from screening myriad dyes. Through these screening tests, I learned a fundamental lesson, viz., that the method of “enumeration” could be a powerful “methodology” at the stage when little is known about clues to establish a model and/or a hypothesis for research. Here, it is important to note that eventually, the VSDs led to the development of genetically targetable molecular membrane potential probes such as the fluorescent protein voltage probes.13,14 At that early stage, novel dyes were synthesized in Alan Waggoner’s laboratory (Amherst) and at the Nippon Kankoh Shikiso Kenkyusho (Okayama, Japan). At Larry’s suggestion, in the early months just before the 1977 squid-season in Woods Hole, I spent time engaged in dye synthesis with C. H. Wang under the supervision of Alan Waggoner in his laboratory (Fig. 1). Throughout this work, I learned important lessons for understanding the chemical structures of the dyes: this was useful in designing new dyes later on. These experiments were, perhaps, a premium gift to me from Larry. I express my gratitude to him. Fig. 1A piece of my note on syntheses of voltage-sensitive dyes, in Alan Waggoner’s laboratory, dated May 3, 1977.  Here, I would like to emphasize that precise phenomenological analyses of the observed optical changes/signals have carved a path toward optical recording/imaging of membrane potential. Thus, I think that differences in philosophy caused the confrontation between Larry and Ichiji Tasaki concerning the origin of optical signals observed during action potentials.4,15,16 Tasaki stuck to his contention that optical signals related to action potentials originated in conformational changes and/or phase transitions in nerve membrane macromolecules coincident with nerve impulse, although his discovery of fast changes in fluorescence of the squid giant axon stained with 8-anilino naphthalene-1-sulfonic acid was actually an early indication of the voltage-sensitivity of the VSDs.17 On the other hand, stubborn insistence upon the Tasaki-hypothesis (ideology) continued to confuse the Japanese physiologist/biophysicist community for a while.18 I was seriously asked by Tasaki “Why have you contacted Larry?” This episode dwells upon my mind as a watershed event; so much so that I think this contention between empiricism and idealism has an instructive meaning as well as being interesting from the standpoint of the history and philosophy of science. Indeed, from this episode, I have learned the lesson that a hypothesis can be selected because it looks theoretically “natural” but was not chosen by “nature.” 4.Early Multisite Optical Recording Systems in MBL and YaleThe VSDs are able to provide a useful new technique for measuring membrane potential in systems where, because of the small size of individual cells, the use of conventional microelectrodes is inconvenient or impossible. Furthermore, the multiple-site optical recording method using VSDs has been developed for simultaneous monitoring of electrical activity. This idea was also originally proposed by Larry Cohen. In an era before that idea could be practically realized, he already stated, “it seems reasonable to imagine an array of 100 photodetectors that would allow simultaneous potential recordings from 100 individual cells.”15 This description was very impressive, and I sniffed out the germ of an idea that dominated my later research. At the period that I was working on the screening of the VSDs in the laboratory of Larry for the detection of optical changes from squid (Loligo pealii) giant axons, we routinely used a simple measuring apparatus with the apparatus set on an optical bench. Besides that, for the simultaneous detection of optical signals from individual invertebrate neurons,9 a recording system that utilized a compound microscope was employed. 4.1.Light-Guide-PhotodiodesFirst, for the simultaneous recording from multiple individual neurons, several discrete light-guides were used. The light-guide-photodiode module was positioned over the image plane of a microscope so that optical absorption signals were monitored simultaneously.9,19,20 This was the prototype of the multiple-site optical recording system. It was not an obvious idea to use a microscope as part of the optics of the multiple-site optical recording system, and, indeed, it was uncommon and innovational to use a microscope, which is usually employed to observe very small morphological objects, for the purpose of recording “dynamical functions in living cells,” such as changes in membrane potential. Oddly, this episode so strongly impacted me that it turned my view of “microscopes” around. The maximum number of light-guide-photodiode modules that could be accommodated was 14. This relatively small number of detectors imposed a limitation on this method. 4.2.From the Light-Guide Photodetector Module to the Photodiode ArrayThe next step in the development of multiple-site optical recording methods was the introduction of a photodiode matrix array in Larry’s laboratory; however, photodiode arrays had not yet been introduced by 1977. Just before I moved to Tokyo, Larry talked to me about his ideas and plans to use a photodiode matrix array as a detector to monitor optical signals from the image plane of the microscope (Fig. 2). These discussions impelled me to assemble my own multiple-site optical recording system. Fig. 2A piece of the discussion note on the idea of using a photodiode matrix array shown me by Larry, dated December 7, 1976. 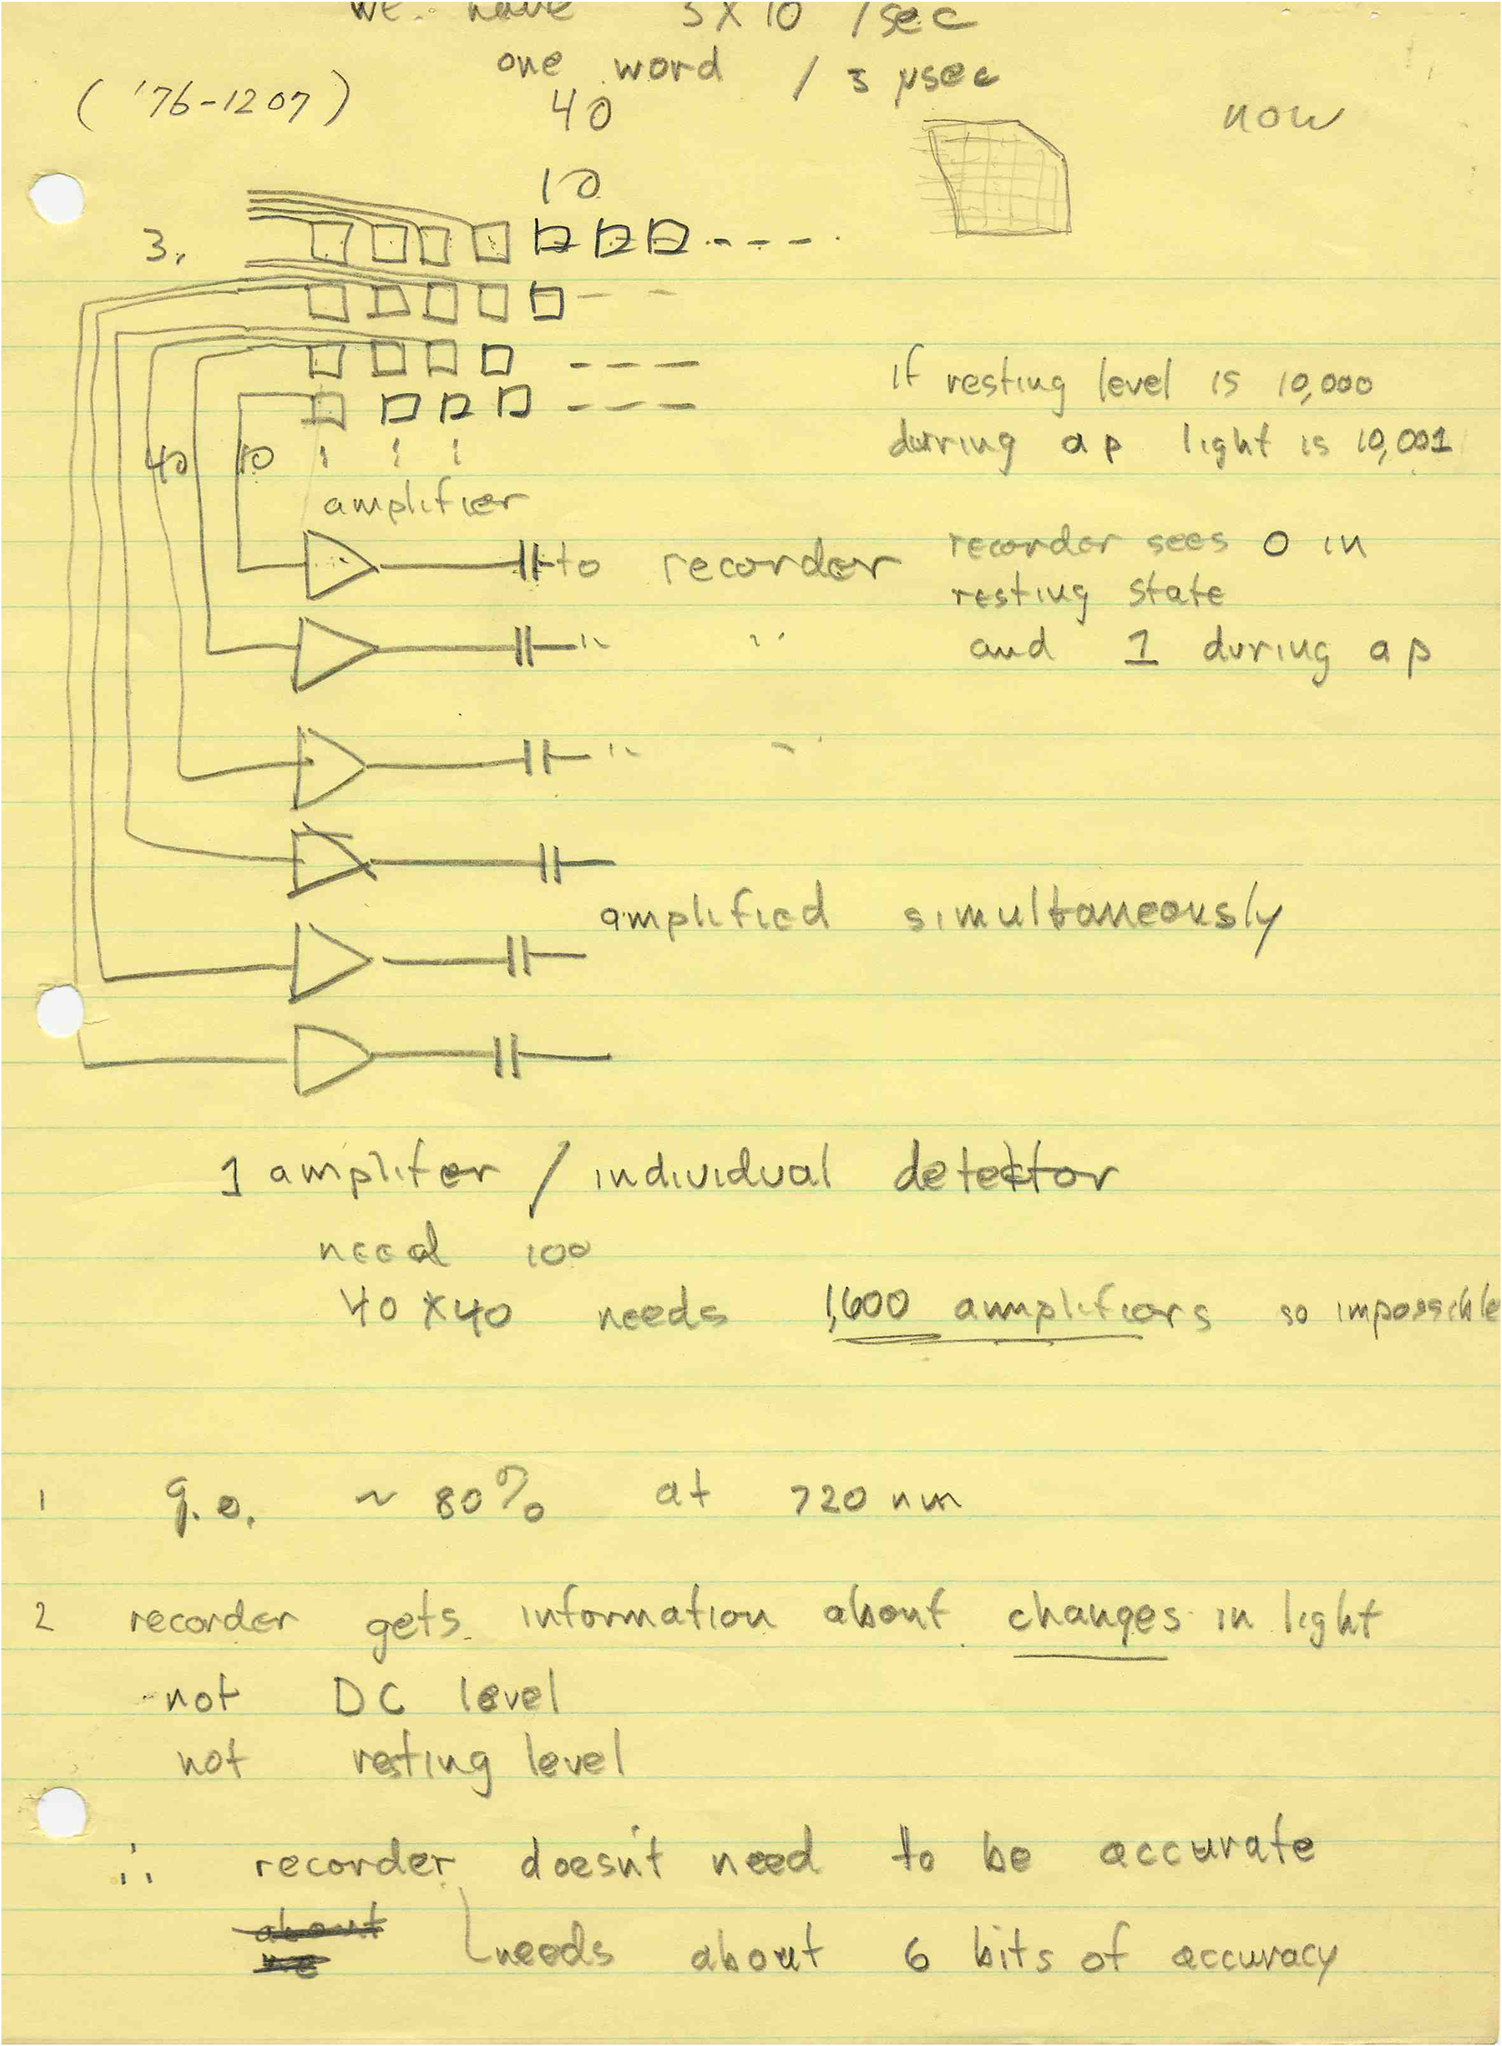 Actually, Larry and Amiram began to introduce a photodiode matrix array in 1978 (and Brian began to use a matrix array at about the same time; personal communication), and the first paper using a 124-element photodiode array appeared in the Journal of Neurophysiology.21 With the introduction of the photodiode array, a large computer was also first introduced into the recording system (although a small computer had been used to acquire multiple-site date from invertebrate ganglia in 1976.)9,19 Using this system, it became possible to monitor optical signals from many more than 100 sites of a preparation. Eventually, this system morphed into the CCD and CMOS cameras which have given such a powerful impetus to the development of the use of opto-electronics in biological systems. Here, I would like to emphasize my view that this multiple-site optical recording system has become, in effect, the origin of all of the optical imaging apparatuses which have recently inundated the bioscientific marketplace. 5.First Setting Up in TokyoIn 1978, after I moved to Tokyo Medical and Dental University, at the invitation of Professor Akira Watanabe, I began to construct an optical recording system in collaboration with Shiro Fujii and Akihiko Hirota. The first system was a light-guide photodiode module (Fig. 3), patterned after the system used in Larry’s lab,9,19 and the construction was carried out on the basis of my own actual experience at the MBL and at Yale. Although, in this recording system, the maximum number of regions from which electrical activity could be simultaneously recorded was 16, we were able to obtain some interesting findings related to embryogenesis of electrical activity, as described below. Fig. 3The primitive multisite detector which was made of 8-light guides conducted to an individual photodiode, constructed in my laboratory in 1979. 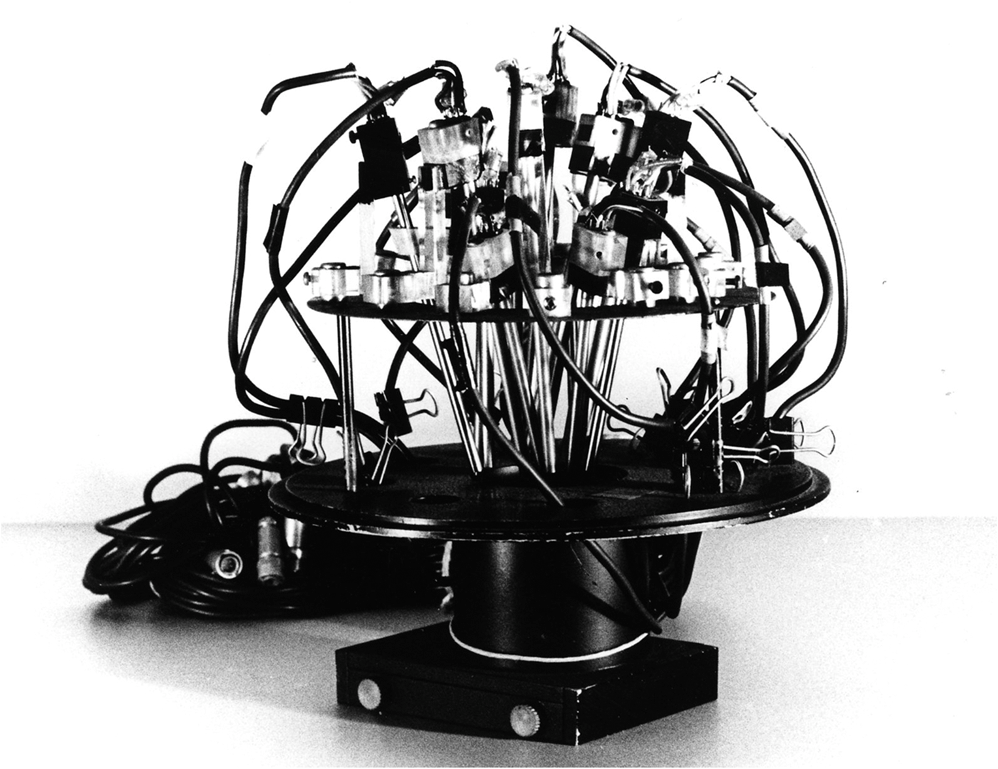 Technical improvements continued in my laboratory, with the multiple-site optical method advancing from , to , and then -element photodiode arrays.2223.–24 And, eventually, in 1992, we constructed a system incorporating a 1020-element photodiode array (Fig. 4).25 At the early stage in Tokyo, our laboratory was very small with a small grant, but my personal experience gained in the laboratory of Larry Cohen was a more powerful prize than having a big grant! 6.Optical Approach to “Ontogeny” of Electrophysiology6.1.BackgroundWhile I was working in the laboratory of Larry Cohen, I felt energized and kept looking for undeveloped problems to which I could apply my growing knowledge and technical skill with multiple-site optical recording of membrane potential using VSDs. As it turned out, I was led to the idea of the “ontogeny” of electrophysiological function: a new combination of “embryology” and “electrophysiology.” Later, I termed this interest “functiogenesis,” a coined word corresponding to “morphogenesis.” Ontogeny and embryology are “chaotic” and are sciences of “process” rather than “stage”: the process of ontogenetic development is far more interesting than mere enlargement. For such a specific object, the multisite optical recording with the VSD has been methodologically and strategically most adaptable to common electrophysiology which directs the state of “being.” With this in mind, I have chosen the cardiac and neural systems in the early stage of chick and rat embryos as the object of research. 6.2.StrategyThe ontogenetic approach to the generation of physiological events during natural development could be a useful strategy for studying the heart and central nervous systems. It would allow us to progressively analyze the complex functional organization and architecture of both cardiac and nervous systems in a manner reminiscent of the expansion of a complex function in a power series. However, conventional electrophysiological analysis in early embryonic cardiac and nervous tissues is technically difficult or impossible because the cells are extremely inaccessible: microelectrode examination of early embryonic heart cells and neurons, which provides the most direct test of their electrophysiology, is often a very difficult task or just impossible because of the small size and fragility of the cells and neurons. For this reason, electrophysiological studies of very early embryonic heart and nervous system have been severely hampered. Here, optical methods for monitoring electrical activity using the VSDs have been introduced, and it has been possible to make recordings from primitive hearts and neurons at very early embryonic stages: in this way, “physiology” and “ontogeny” have been linked together. 6.3.Embryonic HeartThe Greek philosopher Aristotle had already stated that “the heart is the first organ of the embryo to reach a functional state” millennia before our time (requoted in Ref. 26). It was natural, then, for me to devote our attention to the embryonic/ontogenetic origin and early development of electrophysiology and related functions associated with morphogenesis in the embryonic heart, before we tackled embryonic nervous stems with VSD-based multiple-site optical recording methods. In the latter part of 1978, seeking embryogenesis (ontogenesis) of the cardiac electrophysiological function, we began to record, optically, the spontaneous electrical activity in the chick heart at early embryonic developmental stages, devising optimal procedures for embryonic tissues. Finally, at midnight of December 15, 1978, we first recorded rhythmical spontaneous optical signals in a precontractile embryonic heart of the chick at the 9-somite stage (about 33 h of incubation time), using the merocyanine-oxazolone dye (NK2367).27 At that time, I experienced the most marvelous and exhilarating palpitation, dizzy, with heart beating, and in a state of mind that I have never felt before. But, those signals were partly masked by a tremendous noise, and changed their shape in a short time. Next, considering that the early embryonic heart cells is primitive and delicate, and that it may be very sensitive to small changes in the environment, I designed a new merocyanine–rhodanine dye, NK2761, based on the experience in Larry’s and Waggoner’s laboratories, and this was synthesized by Nippon Kankoh-Shikiso Kenkyusho (Okayama, Japan). This new dye is an analogue of Dye XXIII,5 in which the alkyl chain attached to the rhodanine nucleus is replaced by a butyl group.28 This dye has several advantages over previous merocyanine–rhodanine dyes: in particular, its membrane affinity is greater, so that a lower concentration of the dye can be used for staining. Therefore, any associated pharmacological effects are lessened. Furthermore, the bleaching time of the dye is relatively long, and this property is advantageous, especially for the relatively long continuous recording necessary to analyze rhythm generation in the embryonic heart. In addition, NK2761 is sufficiently soluble in a physiological Ringer’s solution. However, if the butyl group is replaced by a longer alkyl chain, such as a hexyl, heptyl, or octyl group, the dye is more hydrophobic and is not so readily soluble in water (Fig. 5). Fig. 5Chemical structure of a merocyanine-oxazolone dye and three merocyanine–rhodanine dyes involved NK2761. 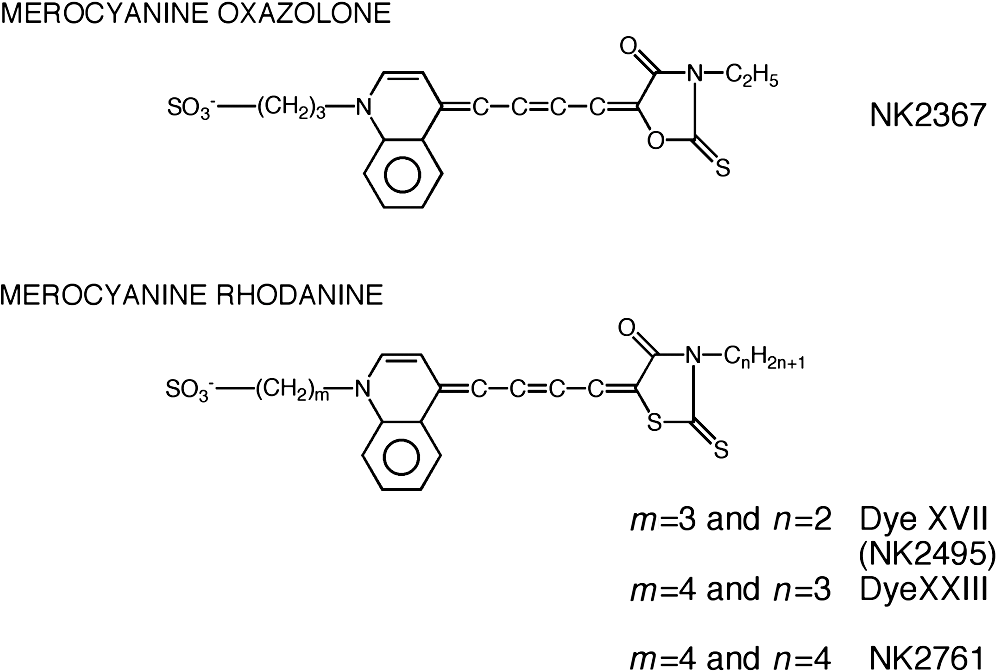 Using this new dye (NK2761), we were first able to record the pacemaker potential in the 8-somite embryonic precontractile chick heart, and to certify the embryonic origin of localization of the pacemaking area, corresponding to the primitive AV-node28 [Fig. 6(a)]. This report was soon reviewed in a commentary entitled “The expanding use of potential-sensitive dyes.”29 We subsequently discovered that rhythmical spontaneous electrical activity originally begins in the prefused cardiac primordial cells at the 6-somite chick embryo, in collaboration with Tetsuro Sakai and Hitoshi Komuro.30 Fig. 6(a) Spontaneous absorption signals detected simultaneously from five regions in an 8-somite embryonic chick precontractile primitive tubular heart. Dotted lines indicate the gradient of pacemaker potential (diastolic slow depolarization phase).28 (b) Spontaneous electrical activity optically recorded from the many adjacent separate loci of the primordial area in the 6-somite embryo. The relative position of the photodiode-matrix array on the image of the primordial area is indicated on the lower right corner (Hirota et al., 1987). 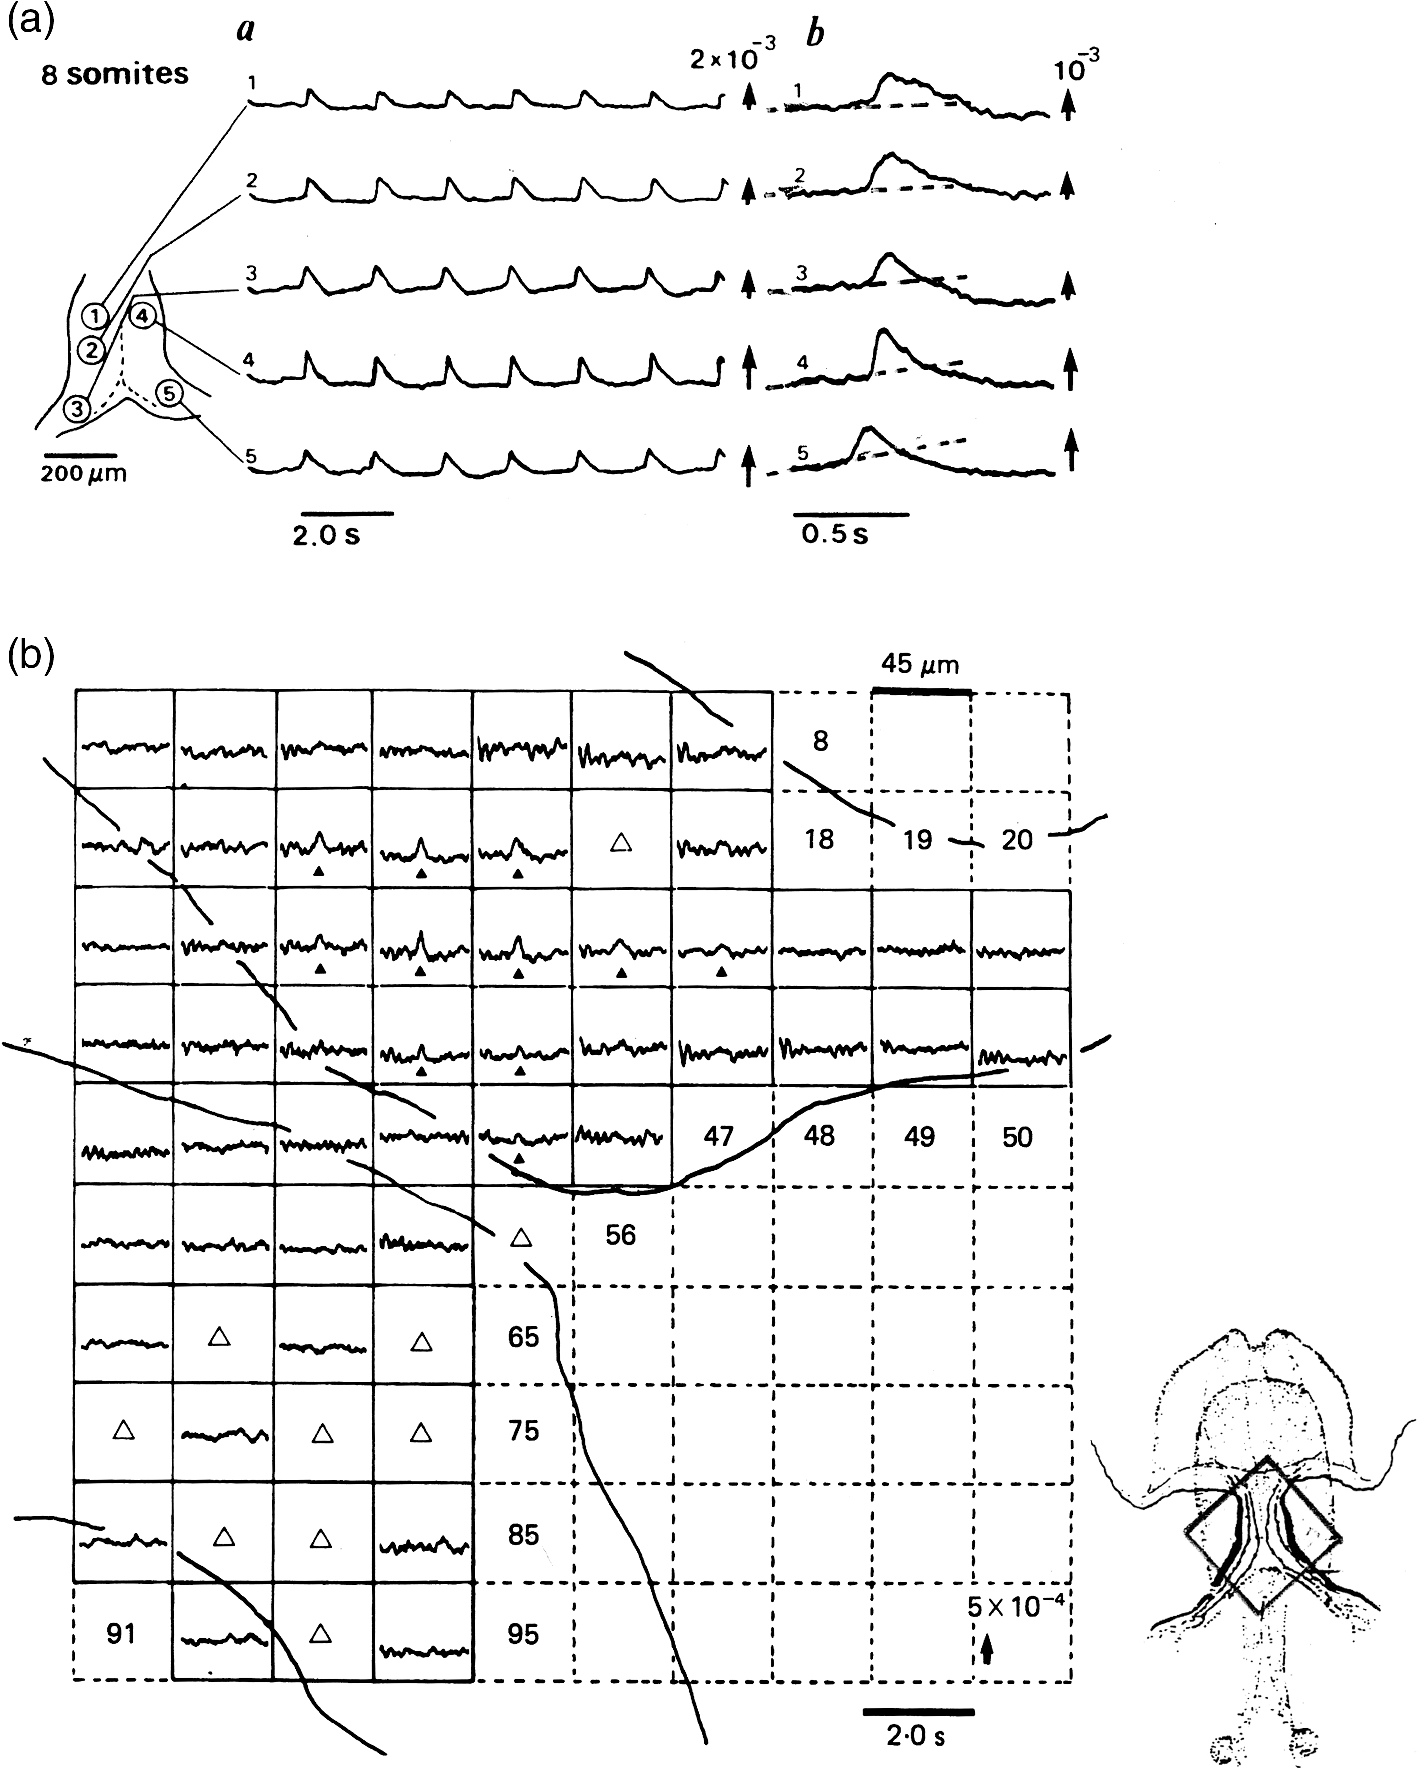 These discoveries of ours show that the electrical activity, which has lurked in the prefused primordial and fused primitive precontractile cardiac cells, have been waiting to be flushed by optical recording for the millennia since Aristotle’s suggestion. This would be a bit of history of science [Fig. 6(b)]. Our next step was to expand our research into the embryogenesis of “supracellular functional organization” in cardiac tissue. Professor Bob DeHaan suggested that “with the voltage-sensitive probes, you will be able to answer many of the questions that have plagued developmental physiologists for decades” (personal letter), and, indeed, we were able to examine many questions, including problems related to the early development of rhythm generation,31,32 the conduction patterns of spontaneous excitation,33 the onset of excitation–contraction coupling22,23 (also for a review refer to Ref. 34), and the spatiotemporal functional organization of the pacemaking area35,36 (for a review refer to Ref. 37). 6.4.Embryonic Central Nervous SystemsAfter we completed our early work on cardiogenesis, we shifted our interest to questions related to the embryonic central nervous systems. Although a complete understanding of the functional organization/architecture of the central nervous system requires a detailed knowledge of the early embryonic development of electrophysiological functions, as is the case with embryonic heart cells, the small size, fragility of the cells, and primitive morphology have made direct recording of electrical activity in embryonic neurons difficult or impossible. Therefore, compared with studies of morphogenesis, studies of the ontogenetic origin, and generation of “physiological functions/events” in the nervous system during the early phases of embryonic development made little progress. Thus, the prospect of using VSD-optical techniques to record electrical events from early embryonic nervous systems intrigued us from the start. In 1992, we began to investigate the embryonic origin and early development of electrophysiological organization in the embryonic brainstem of the chick, in collaboration with two additional newcomers; Yoko Momose-Sato and Katsushige Sato. In this work, we attempted to apply the VSD-optical methods for monitoring electrical activity to the embryonic chick brainstem. As a first step, we assessed the spatial pattern of neural responses to vagal stimulation in the brainstem of the 7-day old chick embryo, and we began to study the functional organization of the nucleus related to the vagus nerve in the embryonic brainstem.38 In these experiments, we verified that the multiple-site optical recording method using a merocyanine–rhodanine dye (NK2761) was also well-suited to the analysis of spatiotemporal patterns of neural responses.39 Here, spatiotemporal mapping analysis was particularly useful, revealing the power of the multiple-site optical recording technique. Exploiting this advantage, we were able to specify the primitive, embryonic localization of such vagal nuclei as the nucleus tractus solitarius (NTS) and the dorsal motor nucleus of the vagus nerve. Our next step was using a procedure to separate the component of the optical signal related to the postsynaptic potentials, and we were able to exhibit the spatiotemporal developmental process of the excitatory postsynaptic potential (EPSP) in the NTS (Fig. 7).40 Furthermore, we demonstrated that the vagus nerve-related EPSP in the chick is mediated by glutamate, and contains both NMDA and non-NMDA components.41 This clearly relates to the ontogenetic origin of synaptic function in the vertebrate central nervous system. We also found both spontaneous and evoked spreading depolarization waves in the central nervous system of earlier embryonic chicks42 (for a review refer to Ref. 43). Fig. 7Multiple-site optical recording of the neural activity evoked by vagus nerve stimulation in an embryonic 8-day chick brainstem slice preparation. Enlargements of optical signals obtained from three different positions are shown at the bottom. The optical signals are composed of fast and slow signals, corresponding to presynaptic and postsynaptic potentials. (Modified from Ref. 40.) 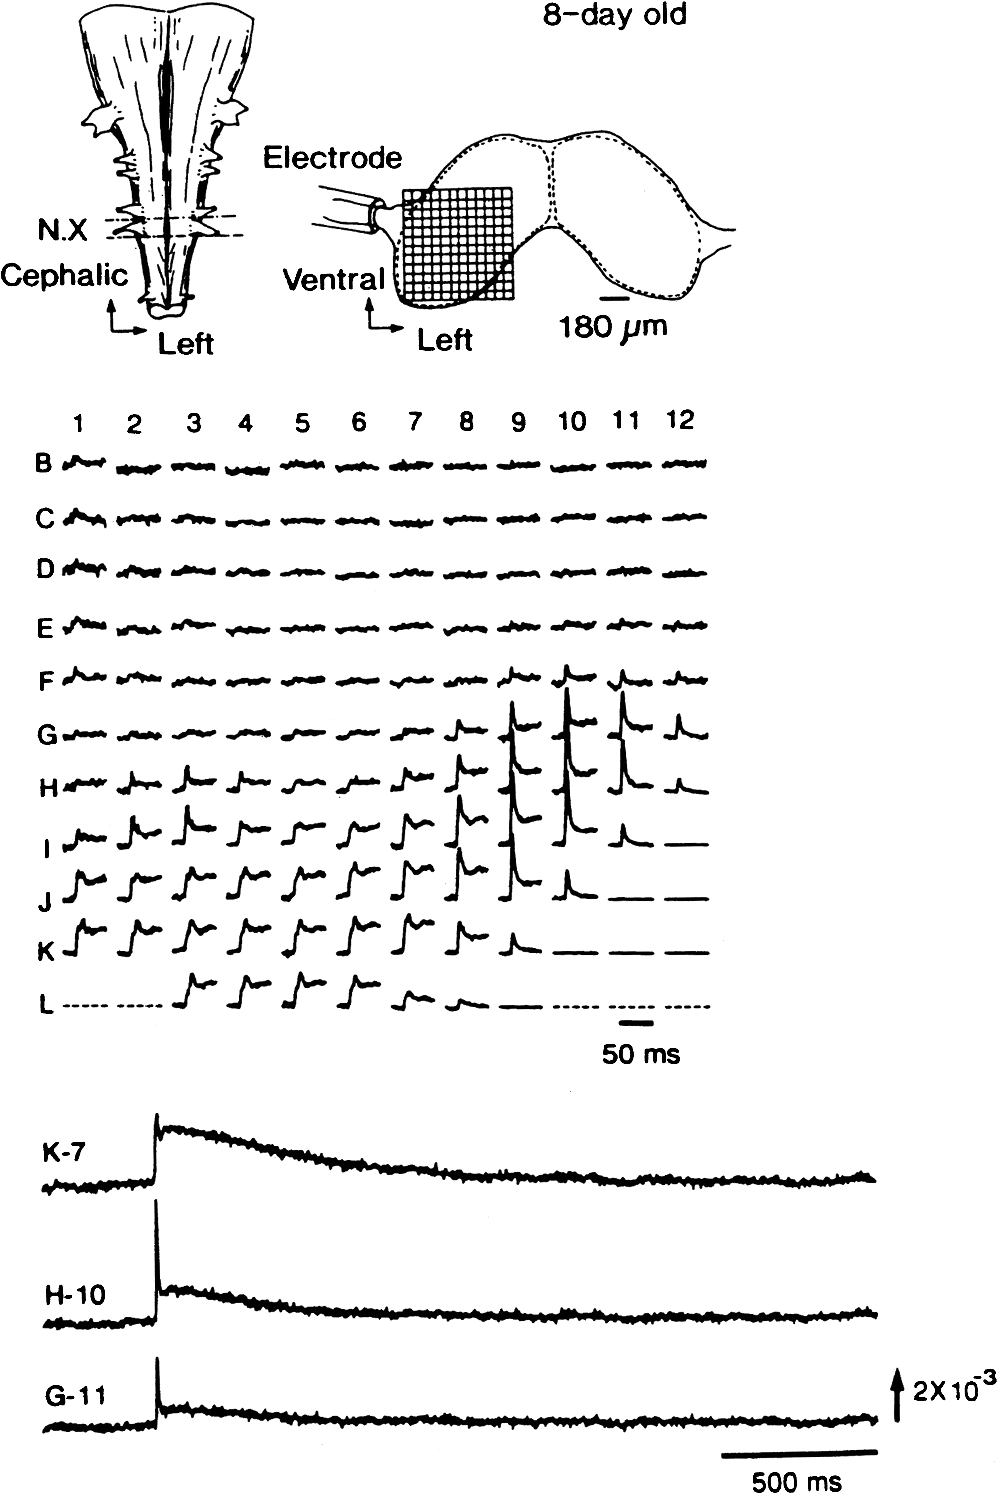 These early works, which began the optical studies of the ontogenetic process of organization/architecture of electrophysiological functions in the vertebrate embryonic central nervous system, are continued today by Katsushige Sato and Yoko Momose-Sato and by others.44,45 7.SupplementSupplementally, I would like to focus attention on the electrochemical aspects of VSD-optical recording and its applications. VSD-optical recording of membrane potential consists, essentially, of electrochemical coupling of the chemical structure of the VSD to the membrane potential. Thus, VSDs have drawn increasing attention from electrochemistry, and a field of chemistry has been developed.4647.–48 On the other hand, the action potential represents the emergence of electrochemical dynamics in excitable cells such as nerve and skeletal- and cardiac-muscle cells. Thus, I fancy that elucidating the ontogenetic onset of the spontaneous action potential in the prefused cardiac primordial cells may be similar to the observation of animal electricity by Galvani, although it is too pompous. Eventually, as the reader can easily see, all of my research has been optically motivated through Larry’s laboratory since my early experiments with light scattering. As Brian pointed out at my retirement from Tokyo Medical and Dental University, Goethe’s dying words were “Mehr Licht!” (Fig. 8). AcknowledgmentsI am most grateful to Larry Cohen, Brian Salzberg, and Amiram Grinvald for their personal and academic friendship since 1976. I also wish to acknowledge all of my collaborators in Tokyo. Further, I specially thank Katsushige Sato for his assistance in preparation of this paper, and Brian Salzberg and Dejan Zecevic for their editing of this special issue. ReferencesK. KaminoK. InouyeA. Inouye,
“Potassium ion-induced swelling of nerve-ending particles by light-scattering measurement,”
Biochim. Biophys. Acta, 330 39
–52
(1973). http://dx.doi.org/10.1016/0005-2736(73)90282-4 BBACAQ 0006-3002 Google Scholar
L. B. CohenR. D. KeynesB. Hille,
“Light scattering and birefringence changes during nerve activity,”
Nature, 218 438
–441
(1968). http://dx.doi.org/10.1038/218438a0 NATUAS 0028-0836 Google Scholar
B. M. Salzberget al.,
“A large change in axon fluorescence, potentially useful in the study of simple nervous systems,”
Biol. Bull., 143 475
(1972). BIBUBX 0006-3185 Google Scholar
H. V. Davilaet al.,
“Changes in ANS and TNS fluorescence in giant axons from Loligo,”
J. Membr. Biol., 15 29
–46
(1974). http://dx.doi.org/10.1007/BF01870080 JMBBBO 0022-2631 Google Scholar
L. B. Cohenet al.,
“Changes in axon fluorescence during activity: molecular probes of membrane potential,”
J. Membr. Biol., 19 1
–36
(1974). http://dx.doi.org/10.1007/BF01869968 JMBBBO 0022-2631 Google Scholar
W. N. Rosset al.,
“Changes in absorption, fluorescence, dichroism and birefringence in stained giant axon: optical measurement of membrane potential,”
J. Membr. Biol., 33 141
–183
(1977). http://dx.doi.org/10.1007/BF01869514 JMBBBO 0022-2631 Google Scholar
L. B. CohenB. M. Salzberg,
“Optical measurement of membrane potential,”
Rev. Physiol. Biochem. Pharmacol., 83 35
–88
(1978). RPBEA5 0303-4240 Google Scholar
B. M. SalzbergH. V. DavilaL. B. Cohen,
“Optical recording of impulses in individual neurons of an invertebrate central nervous system,”
Nature, 246 508
–509
(1973). http://dx.doi.org/10.1038/246508a0 NATUAS 0028-0836 Google Scholar
B. M. Salzberget al.,
“Optical recording of neuronal activity in an invertebrate central nervous system: simultaneous monitoring of several neurons,”
J. Neurophysiol., 40 1281
–1291
(1977). JONEA4 0022-3077 Google Scholar
L. B. Cohenet al.,
“Possible improvements in optical methods for monitoring membrane potential,”
Biol. Bull. Woods Hole, 153 419
(1977). Google Scholar
A. Grinvaldet al.,
“Larger fluorescence and birefringence signals for optical monitoring of membrane potential,”
Biophys. J., 21 82a
(1978). BIOJAU 0006-3495 Google Scholar
R. K. Guptaet al.,
“Improvement in optical methods for measuring rapid changes in membrane potential,”
J. Membr. Biol., 58 123
–137
(1981). http://dx.doi.org/10.1007/BF01870975 JMBBBO 0022-2631 Google Scholar
L. Jinet al.,
“Random insertion of split-cans of the fluorescent protein venus into Shaker channels yields voltage sensitive probes with improved membrane localization in mammalian cells,”
J. Neurosci. Methods, 199 1
–9
(2011). http://dx.doi.org/10.1016/j.jneumeth.2011.03.028 Google Scholar
L. Jinet al.,
“Single action potentials and subthreshold electrical events imaged in neurons with a fluorescent protein voltage probe,”
Neuron, 75 779
–785
(2012). http://dx.doi.org/10.1016/j.neuron.2012.06.040 NERNET 0896-6273 Google Scholar
L. B. Cohen,
“Changes in neuron structure during action potential propagation and synaptic transmission,”
Physiol. Rev., 53 373
–418
(1973). PHREA7 0031-9333 Google Scholar
L. B. Cohen,
“Historical overview and general methods of membrane potential imaging,”
Membrane Potential Imaging in the Nervous System: Methods and Applications, 1
–11 Springer, New York
(2010). Google Scholar
I. Tasakiet al.,
“Changes in fluorescence, turbidity and birefringence associated with nerve excitation,”
Proc. Natl. Acad. Sci. U. S. A., 61 883
–888
(1968). http://dx.doi.org/10.1073/pnas.61.3.883 PNASA6 0027-8424 Google Scholar
Y. KobatakeI. TasakiA. Watanabe,
“Phase transmission in membrane with reference to nerve excitation,”
Adv. Biophys., 2 1
–31
(1971). ADVBAT 0065-227X Google Scholar
B. M. Salzberget al.,
“New and more sensitive molecular probes of membrane potential: simultaneous optical recordings from several cells in the central nervous system of the leech,”
Biophys. J., 16 23a
(1976). BIOJAU 0006-3495 Google Scholar
A. Grinvaldet al.,
“Simultaneous recording from twelve neurons in the supra-esophageal ganglion of Balanus nubilus using a new potential sensitive dye,”
Biol. Bull. Woods Hole, 151 411
(1976). Google Scholar
A. Grinvaldet al.,
“Simultaneous optical monitoring of activity of many neurons in invertebrate ganglia using a 124-element photodiode array,”
J. Neurophysiol., 45 829
–840
(1981). JONEA4 0022-3077 Google Scholar
A. Hirotaet al.,
“Optical studies of excitation–contraction coupling in the early embryonic chick heart,”
J. Physiol. (Lond.), 366 89
–106
(1985). Google Scholar
A. Hirotaet al.,
“Early events in development of electrical activity and contraction in embryonic rat heart assessed by optical recording,”
J. Physiol. (Lond.), 369 209
–227
(1985). Google Scholar
H. Komuroet al.,
“Effects of calcium on electrical propagation in early embryonic precontractile heart as reveled by multiple-site optical recording of action potential,”
J. Gen. Physiol., 85 365
–382
(1985). http://dx.doi.org/10.1085/jgp.85.3.365 JGPLAD 0022-1295 Google Scholar
A. Hirotaet al.,
“A new simultaneous 1020-site optical recording system for monitoring neural activity using voltage-sensitive dyes,”
J. Neurosci. Methods, 56 187
–194
(1995). http://dx.doi.org/10.1016/0165-0270(94)00123-X JNMEDT 0165-0270 Google Scholar
D. W. Thompson, The Work of Aristotle, Clarendon Press, Oxford
(1910). Google Scholar
J. D. Boyd,
“Development of the heart,”
Handbook of Physiology. Circulation, 2511
–2543 Am. Physiol. Soc., Washington, DC
(1965). Google Scholar
A. HirotaS. FujiiK. Kamino,
“Optical monitoring of spontaneous electrical activity of 8-somite embryonic chick heart,”
Jpn. J. Physiol., 29 635
–639
(1979). http://dx.doi.org/10.2170/jjphysiol.29.635 JJPHAM 0021-521X Google Scholar
K. KaminoA. HirotaS. Fujii,
“Localization of pacemaking activity in early embryonic heart monitored using voltage-sensitive dye,”
Nature, 290 595
–597
(1981). http://dx.doi.org/10.1038/290595a0 NATUAS 0028-0836 Google Scholar
“The expanding use of potential-sensitive dyes,”
Nature (News and Views), 292 891
–892
(1981). Google Scholar
A. Hirotaet al.,
“Mapping of early development of electrical activity in the embryonic chick heart using multiple-site optical recording,”
J. Physiol. (London), 369 209
–227
(1985). Google Scholar
S. FujiiA. HirotaK. Kamino,
“Optical recording of development of electrical activity in embryonic chick heart during early phases of cardiogenesis,”
J. Physiol. (Lond.), 311 147
–160
(1981). Google Scholar
S. FujiiA. HirotaK. Kamino,
“Optical indications of pacemaker potential and rhythm generation in early embryonic chick heart,”
J. Physiol. (Lond.), 312 253
–263
(1981). Google Scholar
A. Hirotaet al.,
“Initial development of conduction pattern of spontaneous action potential in early embryonic precontractile chick heart,”
Dev. Biol., 99 517
–528
(1983). http://dx.doi.org/10.1016/0012-1606(83)90301-9 DEBIAO 0012-1606 Google Scholar
K. KaminoA. HirotaH. Komuro,
“Optical indications of electrical activity and excitation–contraction coupling in the early embryonic heart,”
Adv. Biophys., 25 45
–93
(1989). http://dx.doi.org/10.1016/0065-227X(89)90004-X ADVBAT 0065-227X Google Scholar
K. Kaminoet al.,
“Functional pacemaking area in the early embryonic chick heart assessed by simultaneous multiple-site optical of spontaneous action potentials,”
J. Gen. Physiol., 91 573
–591
(1988). http://dx.doi.org/10.1085/jgp.91.4.573 JGPLAD 0022-1295 Google Scholar
K. KaminoH. KomuroT. Sakai,
“Regional gradient of pacemaker activity in the early embryonic chick heart monitored by multisite optical recording,”
J. Physiol. (Lond.), 402 301
–314
(1988). Google Scholar
K. Kamino,
“Optical approaches to ontogeny of electrical activity and related functional organization during early heart development,”
Physiol. Rev., 71 53
–91
(1991). PHREA7 0031-9333 Google Scholar
K. Kaminoet al.,
“Multiple-site optical monitoring of neural activity evoked by vagus nerve stimulation in the embryonic chick brain stem,”
J. Physiol. (Lond.), 409 263
–283
(1989). Google Scholar
Y. Momose-Satoet al.,
“Optical mapping of the early development of the response pattern to vagal stimulation in embryonic chick brain stem,”
J. Physiol. (Lond.), 442 649
–668
(1991). Google Scholar
H. Komuroet al.,
“Optical detection of postsynaptic potentials evoked by vagal stimulation in the early embryonic chick brain stem slice,”
J. Physiol. (Lond.), 442 631
–648
(1991). Google Scholar
Y. Momose-Satoet al.,
“Optical mapping of early embryonic expression of -/APV-sensitive components of vagal glutaminergic EPSPs in the chick brainstem,”
J. Neurosci., 14 7572
–7584
(1994). JNRSDS 0270-6474 Google Scholar
Y. Momose-Satoet al.,
“Spreading depolarization waves triggered by vagal stimulation in the embryonic chick brain: optical evidence for intercellular communication in the developing CNS,”
Neuroscience, 102 245
–262
(2001). http://dx.doi.org/10.1016/S0306-4522(00)00477-2 NERSD9 0735-2743 Google Scholar
Y. Momose-SatoK. SatoK. Kamino,
“Optical approaches to embryonic development of neural function in the brainstem,”
Prog. Neurobiol., 63 151
–197
(2001). http://dx.doi.org/10.1016/S0301-0082(00)00023-X PGNBA5 0301-0082 Google Scholar
Y. Momose-SatoK. Sato,
“Optical recording of vagal pathway formation in the embryonic brainstem,”
Auto. Neurosci., 126–127 39
–49
(2006). http://dx.doi.org/10.1016/j.autneu.2006.02.013 ANUEB2 1566-0702 Google Scholar
Y. Momose-SatoK. Sato,
“The embryonic brain and development of vagal pathways,”
Respir. Physiol. Neurobiol., 178 163
–173
(2011). http://dx.doi.org/10.1016/j.resp.2011.01.012 RPNEAV 1569-9048 Google Scholar
L. M. Loewet al.,
“Evidence for charge shift electrochromic mechanism in probe of membrane potential,”
Nature, 281 497
–499
(1979). http://dx.doi.org/10.1038/281497a0 NATUAS 0028-0836 Google Scholar
R. J. TwiegC. W. Dirk,
“Design, properties and applications of nonlinear optical chromophore,”
Science and Technology of Organic Thin Films for Waveguiding Nonlinear Optics, 45
–135 Cardon and Breach, Amsterdam
(1996). Google Scholar
J. J. Wolff,
“Organic materials for second order non-linear optics,”
Adv. Phys. Org. Chem., 32 121
–217
(1999). http://dx.doi.org/10.1016/S0065-3160(08)60007-6 APORAO 0065-3160 Google Scholar
|


CITATIONS
Cited by 3 scholarly publications.
Optical recording
Heart
Photodiodes
Nervous system
Neurons
Nerve
Neurophotonics


