
|
|
1.IntroductionUnderstanding neuronal input–output transformations requires experimental characterization of how electrical signals generate and propagate in axonal and dendritic arbors. Although whole cell patch clamp techniques have enabled high temporal resolution and high signal-to-noise ratio (S/N) electrical recordings in somata and large dendrites, smaller structures remain difficult to access with patch electrodes. Voltage-sensitive dyes (VSDs) provide an alternative method to track membrane potential and have been effectively imaged with one-photon epifluorescence microscopy to characterize action potential propagation in small diameter axons and dendrites.1–6 Due to the close spatial mingling of neuronal substructures, improving lateral and axial confinement with confocal microscopy could enable discrimination of signals arising from adjacent or overlapping structures; however, the relatively low fractional sensitivity of voltage sensors ( to 20% per 100 mV in brain slices) necessitates excitation densities and collection efficiencies sufficient to overcome high fractional shot noise.7–9 Loss of photon flux through confocal pinhole and lens arrays stipulates extensive signal averaging10 or long integration times11 to increase the S/N. Among efforts to measure voltage transients with two-photon fluorescence,12,13 Acker et al.14 achieved high spatial specificity by implementing two-photon excitation in “single voxel” (nonscanning) mode to record voltage transients in single dendritic spines. However, low fractional voltage dye sensitivity, combined with fast sampling rates necessitated by rapid voltage transients, limits the number of points from which high S/N voltage-sensitive fluorescence changes can be collected in serial. Here we propose an alternative method to obtain voltage signals from specific structures of interest while preserving the ability to record from several spatial locations in parallel. To this end, we implemented one-photon computer-generated holography (CGH)15 to target VSD excitation over laterally extended regions, imaging epifluorescence signals in widefield mode with a high frame-rate camera. Cells filled with voltage dye were imaged and based on structure shape and location, a phase profile was calculated and addressed to a spatial light modulator (SLM) such that illumination at the sample plane was confined to the dendrite or axon of interest. In contrast with full-field illumination, patterned excitation minimized signal degradation arising from nonspecific autofluorescence, spilled dye, or nearby labeled structures. Importantly, with CGH-shaped illumination we could discriminate kinetic differences between action potential–evoked fluorescence transients recorded from neighboring axons and dendrites, differences that could not be appreciated with widefield illumination. These results suggest that CGH can provide a scanless means to increase the spatial specificity of functional fluorescence measurements. 2.Methods2.1.Slice Preparation, Cell Loading, and RecordingWe prepared slices of somatosensory cortex from wild-type mice (C57BL/6J) in accordance with the guidelines of European Union and institutional guidelines of the care and use of laboratory animals (Council directive 86/609 European Economic Community). Male or female mice (3 to 4 weeks of age) were deeply anesthetized with isoflurane (5%) and killed through decapitation. The brain was rapidly removed and placed in ice-cold () or room temperature cutting solution containing the following (in mM): 110 choline chloride, 2.5 KCl, 7.0 , 0.5 , 25 , 1.25 , 20 glucose, and aerated with 95% , 5% to a final pH of 7.4. We dissected the cerebral cortex, blocking it to take coronal slices of somatosensory cortex. The cortical block was glued to an ice-cold stage on a Leica microslicer, and slices were cut in ice-cold cutting solution. Cut sections were placed in an incubator at 35°C for 0.5 h in the cutting solution in a chamber containing ACSF (in mM): 125 NaCl, 2.5 KCl, 1.0 , 2.0 , 25 , 1.25 , 20 glucose, and 0.4 L-ascorbic acid. Slices were kept at room temperature for at least 0.5 h before dye loading and recording in a submersion chamber. 2.2.Dye LoadingWe visualized recovered cortical slices with Olympus BX51WI’s native infrared differential-interference contrast (IR-DIC) path, further magnifying the image onto a scientific complementary metal oxide semiconductor (sCMOS, ORCA Flash 4, Hamamatsu) camera with a magnification changer (Fig. 1 “MC”; Luigs and Neumann, Ratingen, Germany) mounted above the tube lens. We loaded neurons with VSD with a glass patch electrode by filling the tip with dye-free internal solution (in mM: 130 K-gluconate, 7 KCl, 4 ATP-Mg, 0.3 GTP-Na, 10 phosphocreatine-Na, 10 HEPES; adjusted to pH 7.4 and ), then back-filling with the dye-containing internal solution (JPW3028, 400 to ), and performed whole-cell somatic recordings from the selected neuron under DIC optics. The dye JPW3028 is a doubly positively charged analog of the aminostyryl-pyridinium series of lipophilic VSDs available from Invitrogen as D-6923. This electrochromic dye does not significantly increase the membrane capacitance of the labeled neuron, as evident from several control measurements showing that the waveform of the electrically recorded action potentials remains unaltered after intracellular dye loading.16 Dye-free solution in the tip is necessary because this highly lipophilic molecule would otherwise spill onto the slice before sealing and patching the cell of interest, as any dye bound to membrane outside the cell of interest increases the background fluorescence and thus degrades recording sensitivity. The cell was patched and stained at room temperature for 15 to 30 min by allowing passive diffusion of the dye into the cell. The dye diffuses slowly compared with other dyes of the same size and weight due to its high affinity for lipid membranes. After staining, we carefully detached the patch electrode from the neuron, forming an outside-out patch, after which the slice was incubated at room temperature for 1 to 2 h, allowing the dye to diffuse from the soma into the axon and neighboring basal dendrites. Fig. 1Computer-generated holography (CGH) schematic and axial propagation. (a) The beam emitting from the solid-state 532 nm, 450 mW laser (LS) is attenuated with a neutral density filter (ND), a half-wave plate () and polarizing beam splitter (BS), reading and adjusting the power with removable mirror (M2), and a power meter (PM). Lenses () and (), and pinhole (PH, ) clean and expand the beam to fill the active area of the spatial light modulator. Lens () converts the modulated wavefront into a spatial light pattern, which is demagnified into the sample plane by a telescope formed by () and the objective (, , ). The zero-order component is blocked by before the beam enters the Olympus BX51WI microscope. The 532-nm fluorescence excitation light is reflected through the objective by a 560LP dichroic. Fluorescence transmitted by the dichroic is long-pass filtered (, 593LP) and imaged onto a high-speed scientific-CMOS camera (sCMOS) by the native Olympus tube lens () and magnification changer (MC). (b) Scheme of large shaped “square with slot” illumination used for imaging dendrites and axons before voltage imaging measurement. The squared spot (100 μm) has a light-free region in the center (of around width) to spare the dye filled soma from unnecessary illumination and photodamage. The lateral shape masks (green) are specified based on widefield epifluorescence images of voltage-sensitive dye (VSD) filled structures. (c) Simulated axial propagation profile of light shaped to the contours of the axons or dendrites of interest. Full width at half maximum (FWHM) -confinement is . (d) Simulated axial propagation profile of large-spot “pseudowidefield” (pWF) illumination. FWHM -confinement is . 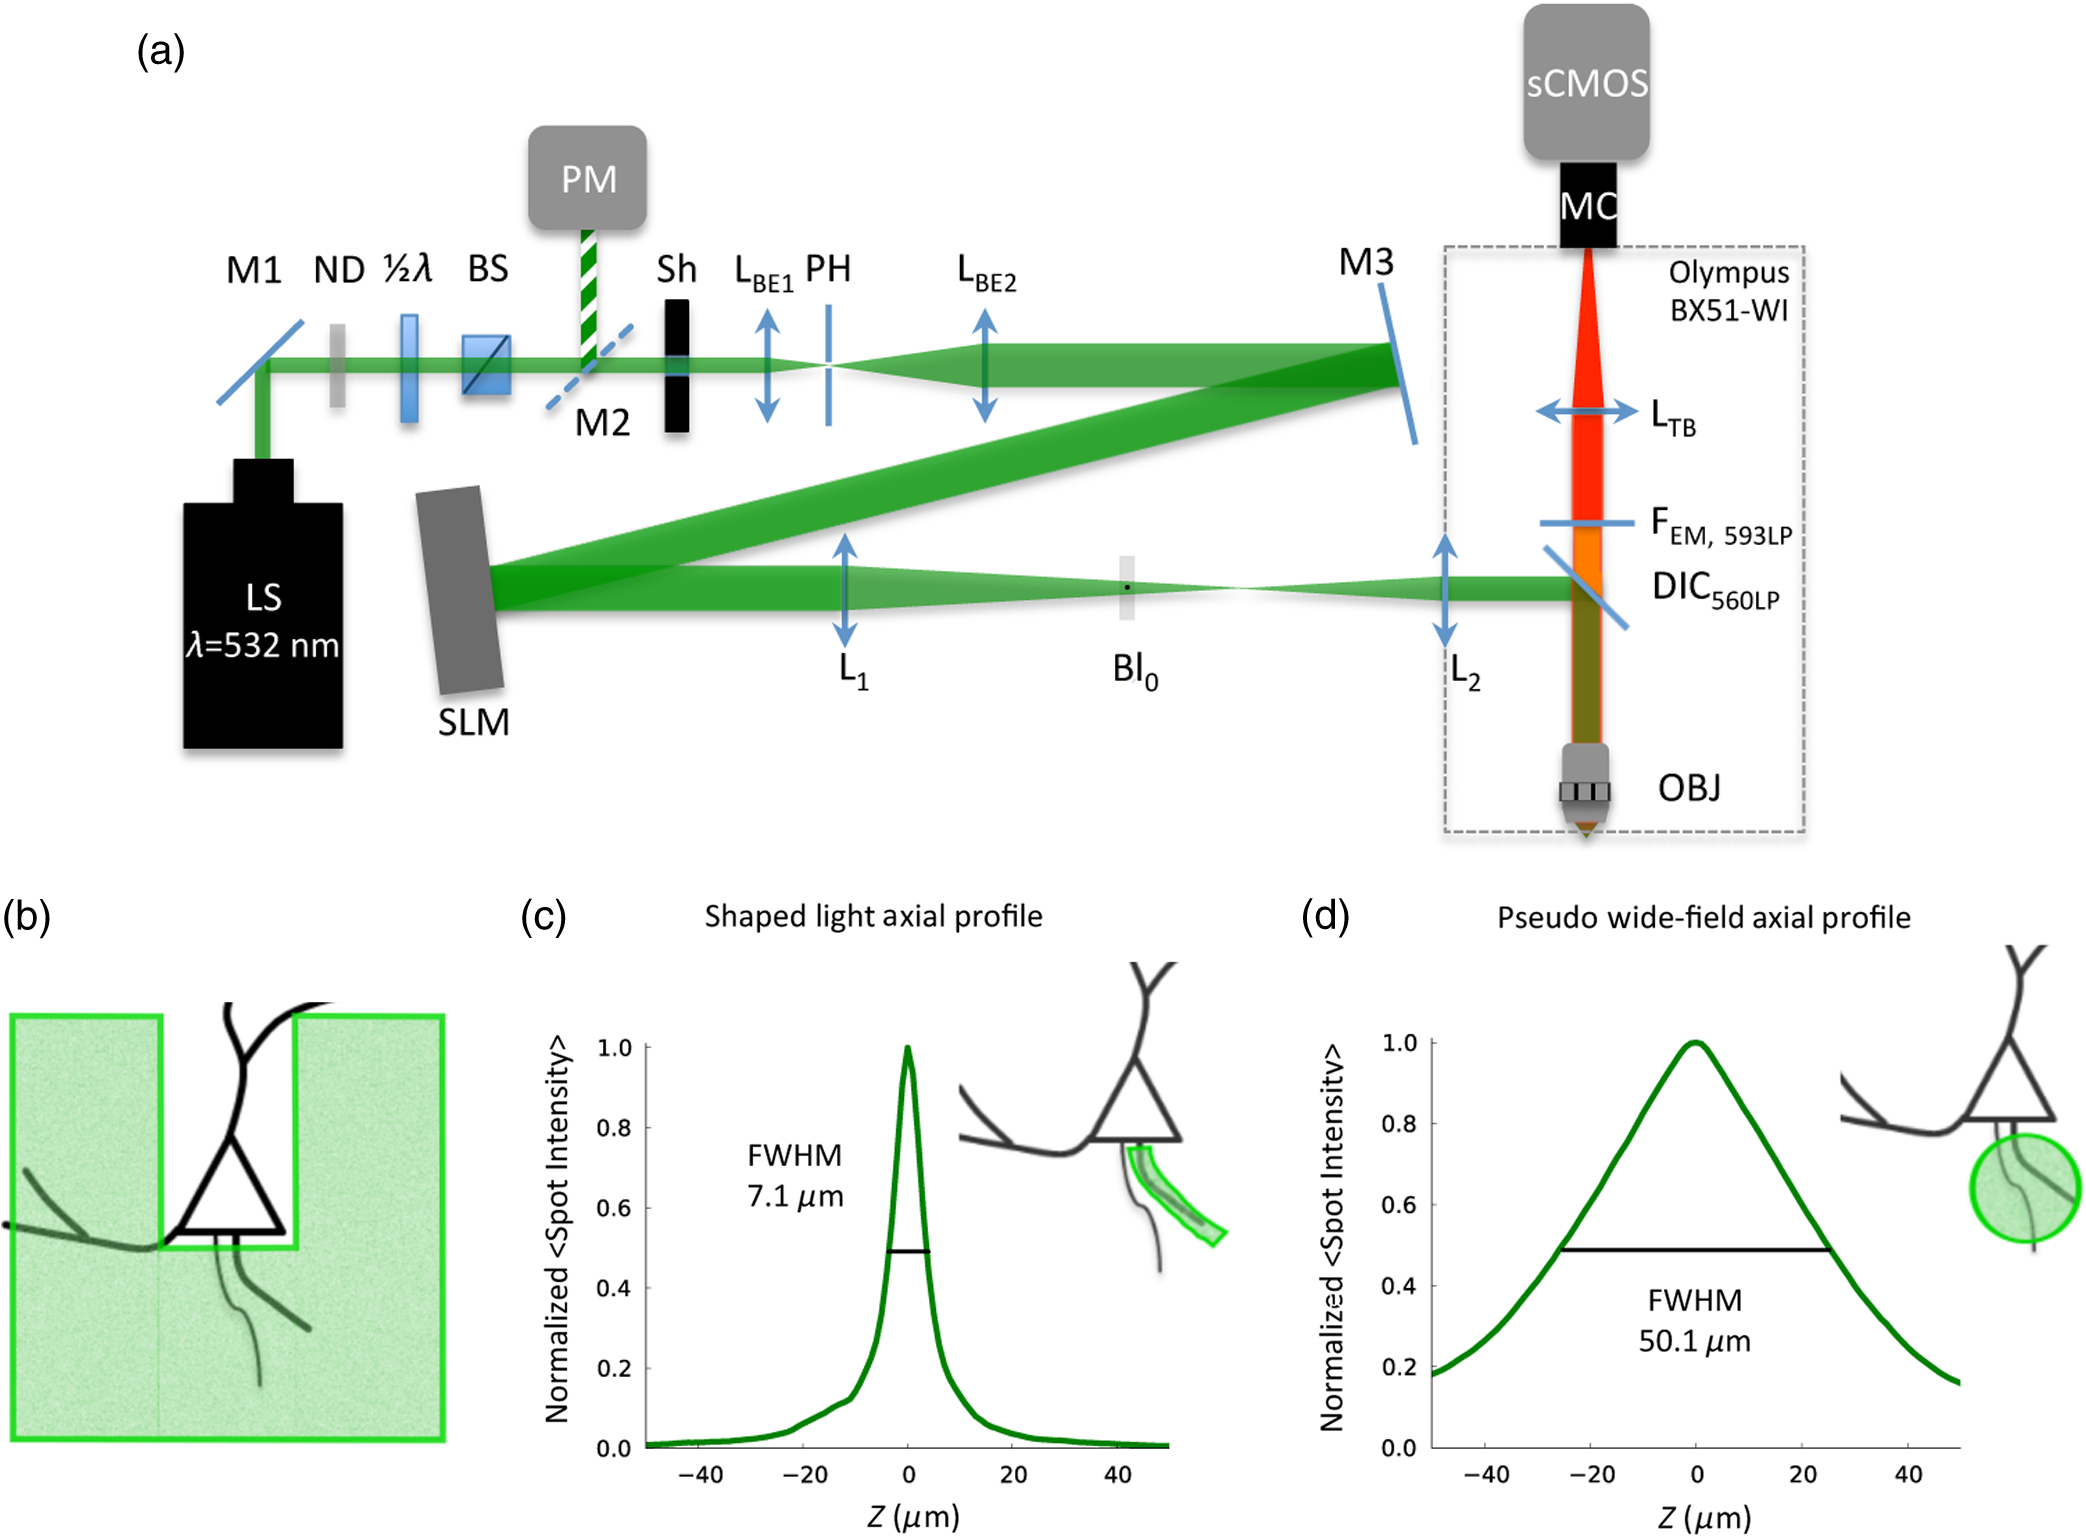 2.3.Computer-Generated HolographyDye-loaded cells were illuminated with a 450 mW frequency-doubled diode-pumped low-noise laser emitting at 532 nm (Fig. 1 “LS”; MLL-FN-532-450-5-LAB-TTL, Changchun New Industries Optoelectronics Tech. Co. Ltd., Changchun, China) with CGH to achieve desired spatial patterns of light at the objective focal plane. Specifically, the laser beam (Fig. 1, LS) is attenuated with a neutral density (ND) filter, a half-wave plate () and polarizing beam splitter, reading and adjusting the power with a removable mirror (M2), and a power meter (PM, Newport 818-ST2). Lenses () and (), and pinhole (PH, ) clean and expand the beam to fill the active area of the liquid crystal on silicon spatial light modulator (LCOS-SLM, Hamamatsu X10468-01). Lens () converts the modulated wavefront into a spatial light pattern, which is demagnified into the sample plane by a telescope formed by , () and the microscope objective (Fig. 1 “OBJ,” Olympus LUMFLN 60XW, , ). The 532-nm fluorescence excitation light is reflected through the objective by a 560-nm long-pass dichroic (FF560-FDi01-25x36, Semrock, Rochester, New York). Fluorescence transmitted by the dichroic is long-pass filtered (, 593LP, FF01-593/LP-25, Semrock) and imaged onto a high speed scientific-CMOS camera (sCMOS, Hamamatsu ORCA Flash 4.0) or electron multiplying charge-coupled device (EMCCD, Andor 860 iXon3) by the native Olympus tube lens () and MC used to target patch clamp electrodes. In order to block the zero-order non phase-modulated component reflected from the SLM, we introduced a defocus in the beam by adjusting the distance between and in order to displace the zero-order focus by 30 to 40 mm after the Fourier plane of the first lens.17,18 For the diffracted first order, the defocus was compensated with a spherical Fresnel lens at the SLM. Thus, with the zero-order displaced 30 to 40 mm from the effective Fourier plane of , we could block the unwanted zero-order component with a point block [Fig. 1(a), “” tape on cover slip] without perturbing the propagation of the hologram (first-order beam). Phase holograms were calculated with an iterative Fourier transform algorithm (IFTA).19–22 The IFTA-generated phase profiles were computed and addressed to the SLM using “Wavefront Designer IV,” in house software written in C++ with Qt 4.4.0 and fftw 3.1.2.23 After the dye diffusion period, we imaged the neuron’s dendrites and axon at depths of 10 to , weakly illuminating (excitation density ) with a CGH-generated square shape () leaving a light-free slot in the center wide [see Fig. 1(b)]. Positioning the soma in this light free slot enabled examination of axonal and dendritic structures, while sparing the dye-filled soma from unnecessary photodamage. Low-power density illumination was paired with long (500 ms) camera integration time and binning ( or ) to maximize collection and minimize light exposure and photodamage to stained axons and dendrites during preimage acquisition. We then used fluorescence images of the axon and dendrites to define the spatial patterns of illumination for VSD signal acquisition trials, sculpted to the structure’s contours [Fig. 1(c)]. For VSD signal acquisition, we decreased the frame integration time to () and modulated the laser power to achieve an excitation density in the range of 0.6 to across the axon- or dendrite-shaped region. Laser light was gated onto the cell with a high-speed shutter [Fig. 1(a)] “Sh”; Uniblitz LS6, driver D880C; Rochester, New York] for 10 to 30 ms trials, with 1 to 2 min intertrial intervals. During each trial, we stimulated action potentials with brief current pulses (5 to 10 ms, 400 to 800 pA) applied through a dye-free pipette patched in whole-cell configuration. Electrical and optical waveforms were monitored for significant changes in width and fall-time indicative of photodamage, at which point the experiment was discontinued. CGH-sculpted light illumination trials were interleaved with “pseudowidefield” (pWF) trials illuminated with a large diameter (25 to ) spot with poor axial confinement [Fig. 1(d)], increasing laser power to maintain an excitation density equal to that of the sculpted light trials. Current clamp signals were recorded at 20kHz with a MultiClamp 700B amplifier and 1440A digitizer (Molecular Devices, Sunnyvale, California), which also triggered camera acquisition and shutter opening. Micromanager24 piloted the sCMOS and Andor Solis drove the EMCCD. We analyzed fluorescence signals during experiments with the ImageJ25 time series plug-in and custom MATLAB scripts. Posthoc image visualization, processing, analysis, and statistics were performed in ImageJ and “VKAT: Voltage-imaging Kinetics Analysis Tool,” a wxpython-based GUI leveraging modules Numpy and Matplotlib. 2.4.Axial Propagation SimulationsIn order to estimate and compare the -confinement of CGH shaped and “pWF” configurations, we simulated the distribution of the holographic beam propagating along the optical axis around the objective focal plane as described in Ref. 26. Briefly, we calculated the beam irradiance around the objective focal plane after the input phase hologram propagates through the telescope formed by , , and the objective using the angular spectrum approach of plane waves with a thin element approximation. Lutz et al.26 demonstrated that the simulations faithfully predict the experimentally measured propagation of shaped, CGH-generated spots. Although these simulations do not factor in depth-dependent brain tissue scattering, Zahid et al.18 have shown that holographic spots maintain axial confinement at depths of in hippocampal slices. The axial confinement of the simulated beam propagation was quantified as full width at half maximum (FWHM) of intensity averaged over the “dendrite shaped” region of interest (ROI) in each axial plane [Fig. 1(c)]. 2.5.AnalysisAxons and dendrites were discriminated visually, axons being thin and straight with collaterals issuing at obtuse angles, and dendrites thicker, spiny, and branching off in acute angle “Y”s. We spatially averaged fluorescence signals from each imaged axon or dendrite over groups of 12 to 18 pixels. Acquiring frames at 6410 Hz, our sCMOS camera operated in “rolling shutter” mode, resulting in a systematic exposure delay of each horizontal line on the chip. Any temporal distortion potentially induced by the rolling shutter was canceled by spatially averaging axon and dendrite ROIs over pixels located across similar numbers of horizontal lines. All data shown and reported come from single-trial measurements. We applied a low-pass binomial filter (1 to 2 passes) to reduce high-frequency noise. In order to improve the temporal precision of spike kinetic measurements, the data collected at were reconstructed using cubic spline interpolation, and then resampled to 100 kHz before measuring spike width and rise time. Both for shaped and pWF trials, spike kinetic measurements were taken from ROIs in which both CGH excitation and widefield imaging were parfocal with the structure of interest. Axons and dendrites occupied different axial planes preventing simultaneous widefield epifluorescence imaging of both structures. Axonal and dendritic data were thus collected in separate, alternate trials. Because the signal from different parts of the neuron varies owing to factors other than voltage (e.g., partitioning of dye in inner and outer membranes), changes in voltage indicated by changes in fluorescence could not be calibrated on an absolute scale. We therefore limited comparison of signals emanating from axonal and dendritic compartments to kinetic parameters that do not depend on precise, absolute voltage scale calibration. Since variable nonspecific fluorescence precludes signal amplitude comparisons between different ROIs, we performed paired comparisons of baseline fluorescence, noise, fractional change, and S/N in compartments illuminated with shaped and large spot pWF in alternate trials. To quantify spike-evoked fluorescence amplitude, we calculated the fractional change in fluorescence , with respect to the baseline fluorescence for each signal-bearing pixel. Specifically where is the average trace intensity 3 ms before the shutter opens and is the average “baseline” trace intensity during 3 ms after shutter opening but before spiking. For each trace, we also quantified the S/N: where and of samples acquired during “baseline” (BL, t = 1:n):We quantified differences between the kinetics (spike width, rise time) and S/N characteristics between axonal- and dendritic-generated waveforms, as well as CGH and “pWF” (large spot) configurations. 3.ResultsWe utilized CGH to confine VSD fluorescence excitation light to an axon or dendrite of interest [Figs. 1(c), 2(b), and 2(c)], comparing signals obtained in this fashion to those illuminated in “pWF,” that is with a large spot of light with poor axial confinement [Figs. 1(d) and 2(a)]. CGH-sculpted illumination generated an excitation spot that precisely covered the structure of interest and corresponded to approximately of the area of the 25 to -diameter circles used for pWF trials [Figs. 1(c) and 1(d)]. Axial propagation simulations of 532 nm CGH-generated shapes predict axial confinement between 7.0 and for shaped illumination [Fig. 1(c)], and between 41 and for pWF spots [Fig. 1(d)]. Both CGH and “pWF” excitation of dye in axons and dendrites generated fluorescence signals from which spike waveforms could be resolved in single trials [Figs. 2(a)–2(c) and 2(e)]. Fig. 2Holographic light sculpting enables discrimination of spike kinetic properties from neighboring axons and dendrites. (a) VSD fluorescence transients from axonal (blue) and dendritic (red) regions of interest (ROIs) with large () spot “pWF” illumination. The axon (in focus in image) and dendrite (more superficial, out focus in image) occupy different axial planes. (b) VSD fluorescence transient emanating from a dendrite occupying a focal plane 5 to deeper than the axon in panel (a). Light is holographically targeted to excite fluorescence only in dendritic tip ROI (red trace), without exciting fluorescence in the adjacent axon in an out-of-focus deeper axial plane (blue trace). (c) Light is holographically targeted to excite fluorescence only in axonal ROI (blue trace), without exciting fluorescence in the adjacent dendrite in an out-of-focus more superficial plane (red trace). Dendritic (panel b) and axonal (panel c) traces were acquired in separate trials. Traces in (a)–(c) and (e) represent single trials averaged over 12 to 18-pixel ROIs collected at 6.41 kHz and low pass filtered (filter type: binomial, 2 passes). (d) Fluorescence image and schematic of dye-filled pyramidal neuron and schematic (lower) showing position of recorded axon (blue) and dendrite (red). The image (upper) is a maximum intensity projection of fluorescence images collected in the deeper axonal plane and more superficial basal dendrite plane. (e) An overlay of axonal (blue) and dendritic (red) traces acquired in alternate trials (panels b and c), peak-aligned and amplitude-normalized to show the faster rise-time and shorter duration of the axonal spike. (f) CGH-shaped excitation of dye in adjacent axons and dendrites (i.e., b and c), showed dendritic spike-evoked fluorescence transients with a greater FWHM than in axon. This difference was not measured in trials when the structures were simultaneously illuminated with large diameter spot “pWF.” (g) Similar to (f), CGH-shaped dye excitation revealed faster rise times in axonal versus dendritic spike-evoked fluorescence transients, a difference not observed with “pWF” illumination. Measurements for (f) and (g) were taken from ROIs in which CGH excitation and widefield imaging are parfocal with the quantified structure. Asterisks (*) indicate Student’s t-test . 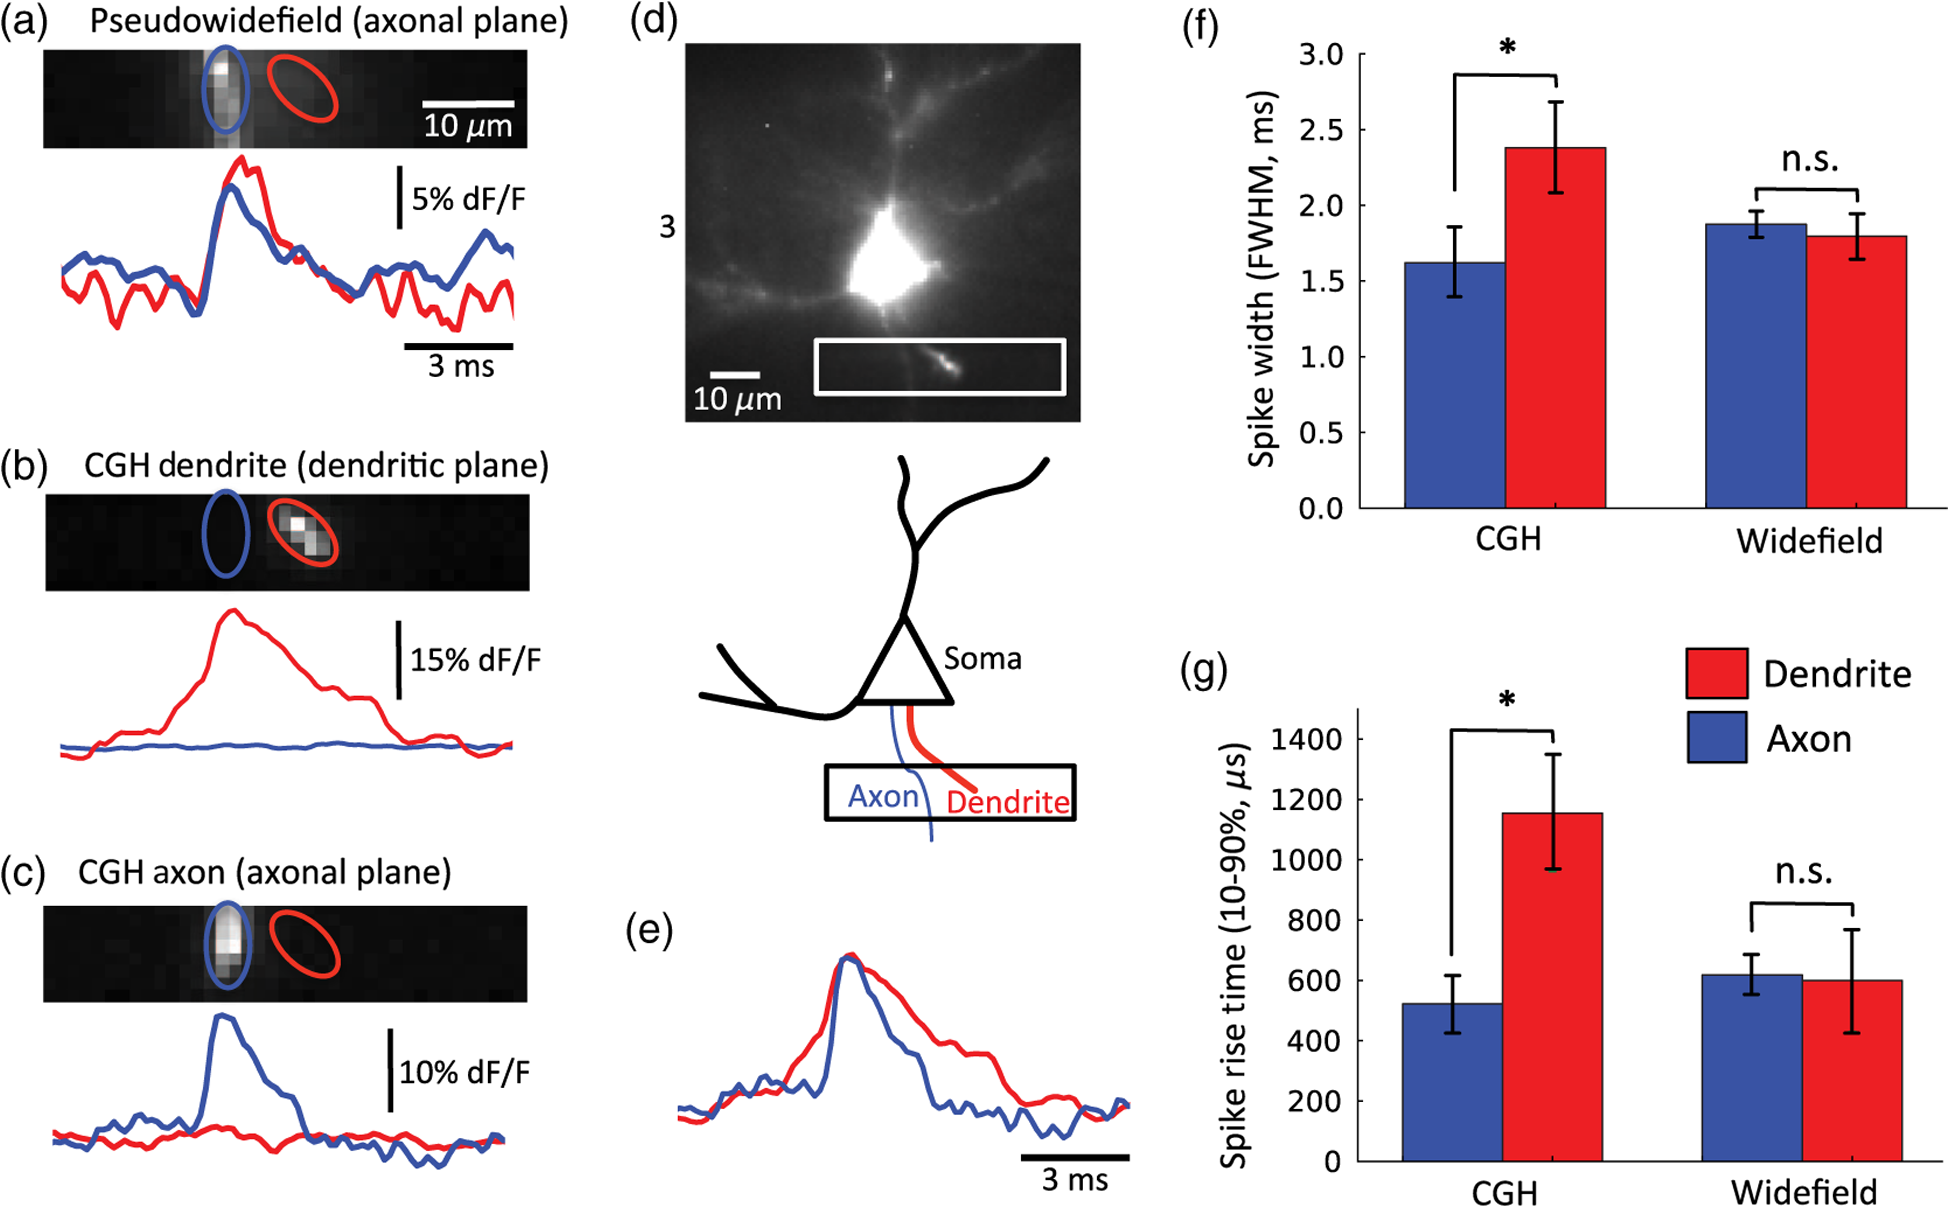 3.1.Targeted Fluorophore Excitation Enables Signal Discrimination in Neighboring StructuresWe found that CGH-shaped voltage dye fluorescence excitation in neighboring axons and dendrites enabled discrimination of differing action potential kinetics not possible with large-field illumination. Specifically, we compared 10% to 90% rise time and FWHM of action potential-evoked fluorescence transients recorded in axons and dendrites illuminated with CGH-sculpted shapes in alternate trials (Fig. 2). Corresponding to previously reported electrical27,28 and optical measurements,2,4,5 action potential rise time and FWHM were shorter [ Student’s t-test; Figs. 2(b), 2(c), 2(e), and 2(g)] in axons (FWHM: standard error of the mean, S.E.M.; rise time: S.E.M., trials from two cells) than in dendrites (FWHM: S.E.M.; rise time: S.E.M.; trials from two cells). Displayed action potential-evoked fluorescence transients emanating for the dendrite [Fig. 2(b)] and axon [Fig. 2(c)] were collected in separate trials since these structures occupied two different planes of focus. Figure 2(e) redisplays these two traces, amplitude normalized and peak aligned to show the difference in spike kinetics undetectable with pWF illumination [Fig. 2(a)]. Trials interleaved in which neighboring axons and dendrites were simultaneously illuminated with large spots did not show differences [Fig. 2(a), 2(f), and 2(g), Student’s t-test] in spike kinetics in the same axonal (FWHM: S.E.M.; rise time: S.E.M.; trials in two cells) and dendritic ROIs (FWHM: S.E.M.; rise time: S.E.M.; trials in two cells), even though these structures occupied different planes of focus. 3.2.Targeted Excitation Increases Fractional Spike-Evoked Transient Amplitude but not Signal-To-NoisePaired comparisons of CGH shaped () or “pWF” () trials revealed significantly decreased background fluorescence (, averaged over time postshutter opening and prespike), increased RMS noise and increased peak action potential evoked [ summarized by Fig. 3(table)]. Although inhomogeneous partitioning of the lipophyllic voltage dye precludes comparison of the signal amplitude between axonal and dendritic compartments, here we compare emanating from the same ROIs under sculpted and pWF illumination conditions. Since both the signal () and RMS noise increased with CGH-shaped excitation, we observed no change in S/N. Fig. 3Comparison of baseline fluorescence, signal noise, spike-waveform amplitude, and signal-to-noise ratio (S/N). The table shows mean and standard error of the mean for trials taken with CGH shaped VSD excitation and large-spot “pWF” excitation for: (1) background fluorescence (, postshutter opening and prespike) fluorescence in arbitrary units (A.U.) after dark (preshutter opening) value subtraction; (2) root-mean-square (RMS) noise of the prespike signal (); (3) maximum (%) of the action potential-evoked fluorescence transient, and; (4) the S/N ratios. Paired Student’s t-tests indicate significant increases in RMS noise and peak , and reduction baseline fluorescence between CGH shaped and pWF trials, illustrated as a percent change in the bar graph (lower). There was no significant difference in S/N between CGH shaped and pWF trials. 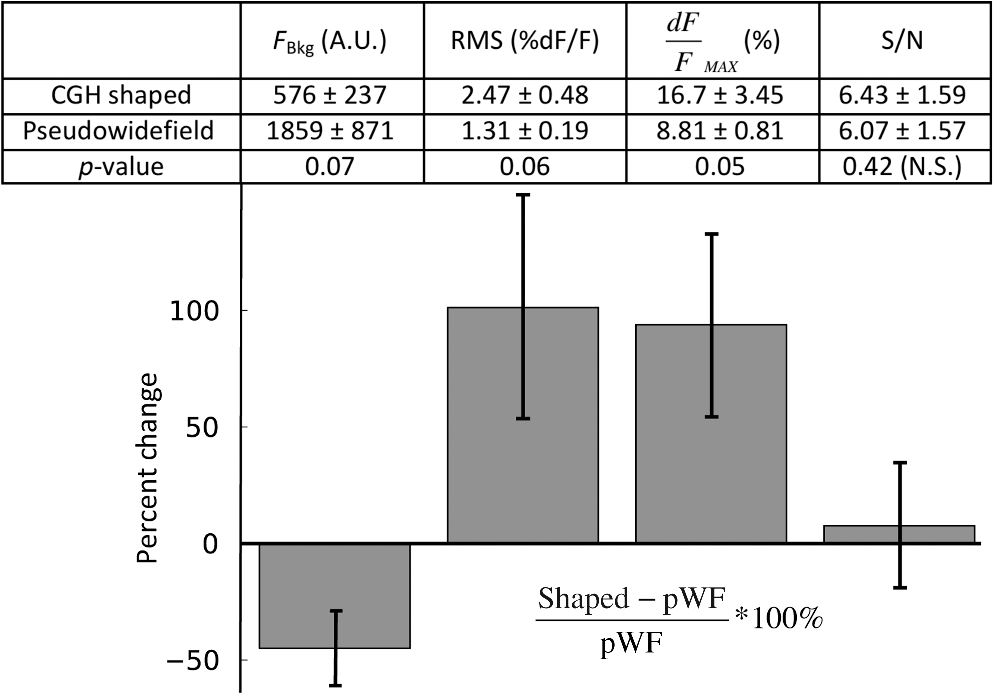 4.DiscussionWe demonstrate that the CGH light targeting to neuronal structures enables functional fluorescence transient spatial specificity unachievable with widefield epifluorescence. Importantly, differences in action potential kinetics between adjacent axons and dendrites could be discerned with targeted CGH illumination, but not with pWF illumination. This gain in spatial specificity, despite reducing baseline fluorescence and total photon flux, did not decrease signal-to-noise ratios (Fig. 3, S/N). Specifically, the increased baseline noise () was compensated by increased transient , presumably due to the higher fraction of photons emanating from external membrane-embedded fluorophores undergoing synchronous electrochromatic shifts during action potential propagation. In the pWF case, increased baseline fluorescence drives an expected decrease in RMS noise, as shot-noise decreases in proportion to the square root of photon flux. These additional photons could originate from autofluorescence, spilled dye, or labeled structures outside of the focal plane and contribute asynchronously or nonspecifically to the spike-evoked fluorescence transient. Hence, although targeted illumination recruited lower photon fluxes, a higher fraction of light evolved from fluorophores subject to near-simultaneous transmembrane potential changes, as evidenced by increased peak spike-evoked , on average 16% compared to 9% for pWF illumination of the same ROIs (Fig. 3). In certain trials, spike-evoked peak approached values closer to theoretically estimated limits for electrochromic probes7,29 [for example, 26% in Fig. 2(b)] than the values typically ( per 100 mV) achieved in axons and dendrites in scattering tissue.2–6 In addition to arbitrary lateral patterning capabilities, CGH light targeting confined fluorescence excitation to in the axial direction for light patterns shaped to cover 10 to segments of axons and dendrites [Fig. 1(c) and 1(d)]. Amplitude-based one-photon methods for lateral light shaping, including light-emitting diode arrays30 and digital micromirror devices,31,32 do not achieve optical sectioning. Moreover, in contrast with confocal methods for excitation focal volume confinement, CGH enables simultaneous parallel illumination of the entire ROI, removing constraints on the sample rate imposed by serial scanning travel and dwell time. Moreover, CGH provides gains in collection efficiency since fluorescence can be imaged in widefield without losses through pinholes or lens arrays. Increasing spatial specificity without sacrificing information-bearing photons in the collection path is especially important for shot-noise–limited functional fluorescence measurements, in which the S/N scales in proportion to the square root of the photon flux. Although not quantified here, the lateral and axial confinement of CGH-shaped excitation may also prevent photodamage in neighboring dye-containing structures. In the future, the axial sectioning capability of CGH can be further exploited in two-photon with temporal focusing,33–35 which confines two-photon fluorescence by geometrically dispersing laser pulses, thus reducing peak power outside of the focal plane. Although for the one-photon CGH case axial confinement degrades linearly in proportion to lateral area,26 with temporal focusing the lateral area and axial confinement are decoupled for laterally extended regions.35 In addition, temporally focused shapes show high robustness to scattering, further recommending this approach for extended shape fluorescence excitation in depth.36,37 One undisputable disadvantage of CGH is the inhomogeneous light distribution within generated light patterns. These intensity “speckles” vary by 15% to 20% for one-photon excitation, and up to for two-photon, due to the quadratic dependence of the signal on the excitation density. Speckles arise primarily from the approximation in the IFTA and cross talk between adjacent pixels of the LCOS-SLM. Techniques such as rotating diffusers35 and phase mask shift-averaging38 can average over speckles and smooth the spatial distribution, but at the cost of light efficiency, axial or temporal resolution. Speckle-free illumination can also be accomplished with generalized phase contrast,33,39 an interferometric method for light shaping. Overcoming the problem of speckle, especially in the two-photon case, will be important since large intensity fluctuations can exceed photodamage thresholds. In conjunction with the rapidly expanding toolbox of organic29,40–47 and protein-based, genetically targetable voltage,48–57 calcium, and neurotransmitter reporters, holographic light shaping can enable high S/N, parallel detection of neural-evoked fluorescence transients from neighboring cells or subcellular compartments. Here, we have demonstrated that light targeting increases spatial specificity even for cases in which the dye itself is confined to the membrane of a single cell. Targeted light spatial specificity gains could prove more critical with dye bulk loading or with dense expression of genetically targeted voltage-sensitive fluorescent proteins. AcknowledgmentsThis work was supported by the Centre National de la Recherche Scientifique (V. E.), the Agence Nationale de la Recherche (grant ANR-10-INSB-04-01, France-BioImaging Infrastructure Network), and a United States National Science Foundation International Research Fellowship (A. J. F). We also thank the FRC and the Rotary Club for financial support through the program “Espoir en Tête” 2012. We thank Leslie Leow (UConn) for providing JPW3028, and Marco Canepari (Grenoble Institut des Neurosciences, France) for lending the Andor 860 EMCCD. We also thank Vincent de Sars for the continued development of “Wavefront Designer” software, and Marc Guillon and Oscar Hernandez for holographic wavefront propagation simulations. ReferencesM. PopovicX. GaoD. Zecevic,
“Voltage-sensitive dye recording from axons, dendrites and dendritic spines of individual neurons in brain slices,”
J. Visualized Exp., 69 e4261
(2012). JVEOA4 1940-087X Google Scholar
S. AnticG. MajorD. Zecevic,
“Fast optical recordings of membrane potential changes from dendrites of pyramidal neurons,”
J. Neurophysiol., 82
(3), 1615
–1621
(1999). JONEA4 0022-3077 Google Scholar
A. Foustet al.,
“Action potentials initiate in the axon initial segment and propagate through axon collaterals reliably in cerebellar Purkinje neurons,”
J. Neurosci., 30
(20), 6891
–6902
(2010). http://dx.doi.org/10.1523/JNEUROSCI.0552-10.2010 JNRSDS 0270-6474 Google Scholar
A. J. Foustet al.,
“Somatic membrane potential and Kv1 channels control spike repolarization in cortical axon collaterals and presynaptic boutons,”
J. Neurosci., 31
(43), 15490
–15498
(2011). http://dx.doi.org/10.1523/JNEUROSCI.2752-11.2011 JNRSDS 0270-6474 Google Scholar
M. A. Popovicet al.,
“The spatio-temporal characteristics of action potential initiation in layer 5 pyramidal neurons: a voltage imaging study,”
J. Physiol., 589
(Pt 17), 4167
–4187
(2011). JPHYA7 0022-3751 Google Scholar
A. E. CasaleD. A. McCormick,
“Active action potential propagation but not initiation in thalamic interneuron dendrites,”
J. Neurosci., 31
(50), 18289
–18302
(2011). http://dx.doi.org/10.1523/JNEUROSCI.4417-11.2011 JNRSDS 0270-6474 Google Scholar
B. KuhnP. FromherzW. Denk,
“High sensitivity of Stark-shift voltage-sensing dyes by one- or two-photon excitation near the red spectral edge,”
Biophys. J., 87
(1), 631
–639
(2004). http://dx.doi.org/10.1529/biophysj.104.040477 BIOJAU 0006-3495 Google Scholar
J. N. KerrW. Denk,
“Imaging in vivo: watching the brain in action,”
Nat. Rev. Neurosci., 9
(3), 195
–205
(2008). http://dx.doi.org/10.1038/nrn2338 NRNAAN 1471-0048 Google Scholar
D. A. Dombecket al.,
“Optical recording of fast neuronal membrane potential transients in acute mammalian brain slices by second-harmonic generation microscopy,”
J. Neurophysiol., 94
(5), 3628
–3636
(2005). http://dx.doi.org/10.1152/jn.00416.2005 JONEA4 0022-3077 Google Scholar
L. M. PalmerG. J. Stuart,
“Membrane potential changes in dendritic spines during action potentials and synaptic input,”
J. Neurosci., 29
(21), 6897
–6903
(2009). http://dx.doi.org/10.1523/JNEUROSCI.5847-08.2009 JNRSDS 0270-6474 Google Scholar
T. TominagaY. Tominaga,
“A new nonscanning confocal microscopy module for functional voltage-sensitive dye and imaging of neuronal circuit activity,”
J. Neurophysiol., 110
(2), 553
–561
(2013). http://dx.doi.org/10.1152/jn.00856.2012 JONEA4 0022-3077 Google Scholar
A. E. Finket al.,
“Two-photon compatibility and single-voxel, single-trial detection of subthreshold neuronal activity by a two-component optical voltage sensor,”
PLoS One, 7
(8), e41434
(2012). http://dx.doi.org/10.1371/journal.pone.0041434 1932-6203 Google Scholar
J. A. Fisheret al.,
“Two-photon excitation of potentiometric probes enables optical recording of action potentials from mammalian nerve terminals in situ,”
J. Neurophysiol., 99
(3), 1545
–1553
(2008). http://dx.doi.org/10.1152/jn.00929.2007 JONEA4 0022-3077 Google Scholar
C. D. AckerP. YanL. M. Loew,
“Single-voxel recording of voltage transients in dendritic spines,”
Biophys. J., 101
(2), L11
–L13
(2011). http://dx.doi.org/10.1016/j.bpj.2011.06.021 BIOJAU 0006-3495 Google Scholar
J. E. CurtisB. A. KossD. G. Grier,
“Dynamic holographic optical tweezers,”
Opt. Commun., 207 169
(2002). http://dx.doi.org/10.1016/S0030-4018(02)01524-9 OPCOB8 0030-4018 Google Scholar
M. CanepariM. DjurisicD. Zecevic,
“Dendritic signals from rat hippocampal CA1 pyramidal neurons during coincident pre- and post-synaptic activity: a combined voltage- and calcium-imaging study,”
J. Physiol., 580
(Pt. 2), 463
–484
(2007). JPHYA7 0022-3751 Google Scholar
M. Polinet al.,
“Optimized holographic optical traps,”
Opt. Express, 13
(15), 5831
–5845
(2005). http://dx.doi.org/10.1364/OPEX.13.005831 OPEXFF 1094-4087 Google Scholar
M. Zahidet al.,
“Holographic photolysis for multiple cell stimulation in mouse hippocampal slices,”
PLoS One, 5
(2), e9431
(2010). http://dx.doi.org/10.1371/journal.pone.0009431 1932-6203 Google Scholar
R. W. GerchbergW. O. Saxton,
“A pratical algorithm for the determination of the phase from image and diffraction pictures,”
Optik, 35 237
–246
(1972). OTIKAJ 0030-4026 Google Scholar
J. R. Fienup,
“Phase retrieval algorithms: a comparison,”
Appl. Opt., 21 2758
–2769
(1982). http://dx.doi.org/10.1364/AO.21.002758 APOPAI 0003-6935 Google Scholar
F. WyrowskiO. Bryngdahl,
“Iterative Fourier-transform algorithm applied to computer holography,”
J. Opt. Soc. Am A, 5 1058
(1988). http://dx.doi.org/10.1364/JOSAA.5.001058 JOAOD6 1084-7529 Google Scholar
Z. ZalevskyD. MendlovicR. G. Dorsch,
“Gerchberg-Saxton algorithm applied in the fractional Fourier or the Fresnel domain,”
Opt. Lett., 21 842
–844
(1996). http://dx.doi.org/10.1364/OL.21.000842 OPLEDP 0146-9592 Google Scholar
M. FrigoS. G. Johnson,
“The design and implementation of FFTW3,”
Proc. IEEE, 93
(2), 216
–231 http://dx.doi.org/10.1109/JPROC.2004.840301 0018-9219 Google Scholar
A. Edelsteinet al.,
“Computer control of microscopes using μmanager,”
Curr. Protoc. Mol. Biol.,
(2010). Google Scholar
W. S. Rasband,
“ImageJ,”
U. S. National Institutes of Health, Bethesda, Maryland http://imagej.nih.gov/ij/ Google Scholar
C. Lutzet al.,
“Holographic photolysis of caged neurotransmitters,”
Nat. Methods, 5
(9), 821
–827
(2008). http://dx.doi.org/10.1038/nmeth.1241 1548-7091 Google Scholar
G. Stuartet al.,
“Action potential initiation and backpropagation in neurons of the mammalian CNS,”
Trends Neurosci., 20
(3), 125
–131
(1997). http://dx.doi.org/10.1016/S0166-2236(96)10075-8 TNSCDR 0166-2236 Google Scholar
Y. Shuet al.,
“Modulation of intracortical synaptic potentials by presynaptic somatic membrane potential,”
Nature, 441
(7094), 761
–765
(2006). http://dx.doi.org/10.1038/nature04720 NATUAS 0028-0836 Google Scholar
G. HubenerA. LambacherP. Fromherz,
“Anellated hemicyanine dyes with large symmetrical solvatochromism of absorption and fluorescence,”
J. Phys. Chem. B, 107
(31), 7896
–7902
(2003). http://dx.doi.org/10.1021/jp0345809 JPCBFK 1520-6106 Google Scholar
N. Grossmanet al.,
“Multi-site optical excitation using ChR2 and micro-LED array,”
J. Neural Eng., 7
(1), 16004
(2010). http://dx.doi.org/10.1088/1741-2560/7/1/016004 1741-2560 Google Scholar
L. J. Horneck,
“128 X 128 deformable mirror device,”
IEEE Trans. Electron. Devices, 30
(5), 539
–545
(1983). http://dx.doi.org/10.1109/T-ED.1983.21163 IETDAI 0018-9383 Google Scholar
C. W. Lianget al.,
“Patterned photostimulation with digital micromirror devices to investigate dendritic integration across branch points,”
J. Visualized Exp., 49 2003
(2011). http://dx.doi.org/10.3791/2003 JVEOA4 1940-087X Google Scholar
E. Papagiakoumouet al.,
“Scanless two-photon excitation of channelrhodopsin-2,”
Nat. Methods, 7
(10), 848
–854
(2010). http://dx.doi.org/10.1038/nmeth.1505 1548-7091 Google Scholar
E. Papagiakoumouet al.,
“Temporal focusing with spatially modulated excitation,”
Opt. Express, 17 5391
–5401
(2009). http://dx.doi.org/10.1364/OE.17.005391 OPEXFF 1094-4087 Google Scholar
E. Papagiakoumouet al.,
“Patterned two-photon illumination by spatiotemporal shaping of ultrashort pulses,”
Opt. Express, 16 22039
–22047
(2008). http://dx.doi.org/10.1364/OE.16.022039 OPEXFF 1094-4087 Google Scholar
E. Papagiakoumouet al.,
“Functional patterned multiphoton excitation deep inside scattering tissue,”
Nat. Photonics, 7
(4), 274
–278
(2013). http://dx.doi.org/10.1038/nphoton.2013.9 1749-4885 Google Scholar
A. Begueet al.,
“Two-photon excitation in scattering media by spatiotemporally shaped beams and their application in optogenetic stimulation,”
Biomed. Opt. Express, 4
(12), 2869
–2879
(2013). http://dx.doi.org/10.1364/BOE.4.002869 BOEICL 2156-7085 Google Scholar
L. GolanS. Shoham,
“Speckle elimination using shift-averaging in high-rate holographic projection,”
Opt. Express, 17
(3), 1330
–1339
(2009). Google Scholar
J. Glückstad,
“Phase contrast image synthesis,”
Opt. Commun., 130 225
(1996). http://dx.doi.org/10.1016/0030-4018(96)00339-2 OPCOB8 0030-4018 Google Scholar
E. W. Milleret al.,
“Optically monitoring voltage in neurons by photo-induced electron transfer through molecular wires,”
Proc. Natl. Acad. Sci. U. S. A., 109
(6), 2114
–2119
(2012). http://dx.doi.org/10.1073/pnas.1120694109 PNASA6 0027-8424 Google Scholar
L. B. CohenB. M. SalzbergA. Grinvald,
“Optical methods for monitoring neuron activity,”
Ann. Rev. Neurosci., 1 171
–182
(1978). http://dx.doi.org/10.1146/annurev.ne.01.030178.001131 ARNSD5 0147-006X Google Scholar
A. Grinvaldet al.,
“Optical imaging of neuronal activity,”
Physiol. Rev., 68
(4), 1285
–1366
(1988). PHREA7 0031-9333 Google Scholar
A. GrinvaldR. Hildesheim,
“VSDI: a new era in functional imaging of cortical dynamics,”
Nat. Rev. Neurosci., 5
(11), 874
–885
(2004). http://dx.doi.org/10.1038/nrn1536 NRNAAN 1471-0048 Google Scholar
D. S. PeterkaH. TakahashiR. Yuste,
“Imaging voltage in neurons,”
Neuron, 69
(1), 9
–21
(2011). http://dx.doi.org/10.1016/j.neuron.2010.12.010 NERNET 0896-6273 Google Scholar
P. Fromherzet al.,
“ANNINE-6plus, a voltage-sensitive dye with good solubility, strong membrane binding and high sensitivity,”
Eur. Biophys. J.: EBJ, 37
(4), 509
–514
(2008). http://dx.doi.org/10.1007/s00249-007-0210-y EBJOE8 0175-7571 Google Scholar
A. L. Obaidet al.,
“Novel naphthylstyryl-pyridium potentiometric dyes offer advantages for neural network analysis,”
J. Neurosci. Methods, 134
(2), 179
–190
(2004). http://dx.doi.org/10.1016/j.jneumeth.2003.11.011 JNMEDT 0165-0270 Google Scholar
J. P. Wuskellet al.,
“Synthesis, spectra, delivery and potentiometric responses of new styryl dyes with extended spectral ranges,”
J. Neurosci. Methods, 151
(2), 200
–215
(2006). http://dx.doi.org/10.1016/j.jneumeth.2005.07.013 JNMEDT 0165-0270 Google Scholar
P. Zouet al.,
“Bright and fast multicoloured voltage reporters via electrochromic FRET,”
Nat. Commun., 5 4625
(2014). \NCAOBW 2041-1723 Google Scholar
W. Akemannet al.,
“Imaging neural circuit dynamics with a voltage-sensitive fluorescent protein,”
J. Neurophysiol., 108
(8), 2323
–2337
(2012). http://dx.doi.org/10.1152/jn.00452.2012 JONEA4 0022-3077 Google Scholar
W. Akemannet al.,
“Imaging brain electric signals with genetically targeted voltage-sensitive fluorescent proteins,”
Nat. Methods, 7
(8), 643
–649
(2010). http://dx.doi.org/10.1038/nmeth.1479 1548-7091 Google Scholar
B. J. Bakeret al.,
“Genetically encoded fluorescent voltage sensors using the voltage-sensing domain of Nematostella and Danio phosphatases exhibit fast kinetics,”
J. Neurosci. Methods, 208
(2), 190
–196
(2012). http://dx.doi.org/10.1016/j.jneumeth.2012.05.016 JNMEDT 0165-0270 Google Scholar
L. Barnettet al.,
“A fluorescent, genetically-encoded voltage probe capable of resolving action potentials,”
PLoS One, 7
(9), e43454
(2012). http://dx.doi.org/10.1371/journal.pone.0043454 1932-6203 Google Scholar
J. M. Kraljet al.,
“Optical recording of action potentials in mammalian neurons using a microbial rhodopsin,”
Nat. Methods, 9
(1), 90
–95
(2012). http://dx.doi.org/10.1038/nmeth.1782 1548-7091 Google Scholar
J. M. Kraljet al.,
“Electrical spiking in Escherichia coli probed with a fluorescent voltage-indicating protein,”
Science, 333
(6040), 345
–348
(2011). http://dx.doi.org/10.1126/science.1204763 SCIEAS 0036-8075 Google Scholar
Y. GongJ. Z. LiM. J. Schnitzer,
“Enhanced archaerhodopsin fluorescent protein voltage indicators,”
PLoS One, 8
(6), e66959
(2013). http://dx.doi.org/10.1371/journal.pone.0066959 1932-6203 Google Scholar
F. St-Pierreet al.,
“High-fidelity optical reporting of neuronal electrical activity with an ultrafast fluorescent voltage sensor,”
Nat. Neurosci., 17
(6), 884
–889
(2014). http://dx.doi.org/10.1038/nn.3709 NANEFN 1097-6256 Google Scholar
L. Jinet al.,
“Single action potentials and subthreshold electrical events imaged in neurons with a fluorescent protein voltage probe,”
Neuron, 75
(5), 779
–785
(2012). http://dx.doi.org/10.1016/j.neuron.2012.06.040 NERNET 0896-6273 Google Scholar
BiographyAmanda J. Foust is a National Science Foundation international postdoctoral fellow in the Department of Neurophotonics at Paris Descartes University, adapting and optimizing computer-generated holography methods for brain circuit reverse engineering. Amanda began optical neurophysiology research in the laboratory of David Rector at Washington State University (Pullman, Washington; BS 2006). She holds MPhil and PhD degrees from Yale University where she used voltage-sensitive dyes to study axonal information processing in the laboratory of David McCormick. Valeria Zampini is a research engineer at Paris Descartes University, Paris, France, specializing in electrophysiology. She previously worked as a postdoc at the École normale supérieure, Paris, France (2010 to 2013), where she studied synaptic integration in unipolar brush cells interneurons of the vestibulo-cerebellum. During her PhD and first postdoctoral training she studied vestibular and cochlear hair cells physiology and calcium channels responsible for synaptic release in these receptors (University of Pavia, Italy; University of Sheffield, United Kingdom). Dimitrii Tanese received his BA and MS degrees from the University of Bologna, Italy. He obtained his PhD degree from the University Pierre et Marie Curie in Paris, working on semiconductor microcavities. He is a postdoctoral fellow from 2013 until the present at the Neurophotonics Laboratory in Paris. He is currently involved in the development of optical methods for voltage imaging and neuronal photoactivation based on shaped illumination. Eirini Papagiakoumou is a researcher at the Neurophotonics Laboratory of Paris Descartes University. She obtained her PhD degree in physics at the National Technical University of Athens working on cell micromanipulation with optical tweezers, laser ablation of tissues and waveguiding laser radiation. Her current interests focus on the use of wavefront engineering techniques and nonlinear phenomena on two-photon microscopy, applied in neuroscience and principally in high resolution neuronal photoactivation and imaging. Valentina Emiliani is the director of the Neurophotonics Laboratory. She obtained her PhD degree in physics at the University ‘La Sapienza’ Rome. As a postdoc, she investigated carrier transport in quantum wires (Max Born Institut, Berlin) and light propagation in disordered structures (LENS, Florence) by SNOM and cell mechanotransduction by optical tweezers (Institute Jacques Monod, Paris). In 2005, she formed the “wavefront engineering microscopy” group at Paris Descartes University, pioneering the use of wavefront shaping for neuroscience. |


