
|
|
1.OverviewA central challenge of modern systems neuroscience is monitoring the neural activity of neuronal populations in vivo and understanding the relationships among activity, information processing, and behavior. In the last two decades, an increasingly powerful means of meeting this challenge has come from a combination of optical microscopy, activity-dependent fluorescent sensor proteins, and strategies for labeling specific neuronal populations and subcellular structures. Optical imaging has several advantages over traditional electrophysiological measurements.1 First, it allows for simultaneous recordings of many neurons at the same time, a task for which electrode-based recording rapidly encounters limits. Second, electrodes cause tissue damage and, for prolonged recording, glial cell growth, problems that optical recording largely misses. Third, optical imaging enables measurement of multiple forms of activities, including action potential firing, synaptic activity, and other subcellular signals. The ability of investigators to reach this goal is limited by three factors in the temporal domain: (a) the speed of the imaging apparatus, (b) the speed of the signal to be monitored, and (c) the response speed of the probe. Additionally, many probes developed over the last few decades suffer from (d) low signal-to-noise ratio (SNR) necessitating averaging across multiple cells or trials, due to low brightness or dynamic range (the ratio of the lowest fluorescent signal to the highest one; denoted as ), and (e) inability to target specific cell subtypes and/or cellular subdomains. Although many new indicators have addressed these challenges, certain performance limitations remain. In our laboratory, we have focused our efforts to improve genetically encoded calcium indicator proteins (GECIs), specifically the green fluorescent protein (GFP)-Calmodulin fusion protein (GCaMP). We aim to refine it in two areas: increase its ability to report calcium changes over an extended range of concentrations (otherwise known as the sensitive range) and the speed at which they respond to those fluctuations.2 Here, we will first discuss the limiting factors indicated above and review recent developments in modern probes with a special focus on GECIs.3 Finally, we will present the properties of Fast-GCaMP6f, a successful hybrid of the rapid-responding Fast-GCaMPs,2 and the bright GCaMP6f4 aimed at further improvement of the response probe’s kinetics. 2.Neural Activity-Dependent Probes: Past, Present, and Near FutureIdeally, neural activity imaging would capture temporal accuracy and reflect changes in signal amplitude comparable to electrophysiological techniques while providing a significant improvement in spatial resolution as well as subcellular and multiunit recording capability. Addressing this challenge requires advances in both instrumentation and in probe design. First, imaging setups must be capable of monitoring neuronal activity at speeds suitable for detecting single events. Currently, scanning-based optical recording methods can reach millisecond-range resolution when applied to small populations of neurons. Light sheet microscopy5 can monitor wider fields of view at video frame rates, raising the possibility of monitoring complete neuronal populations in small nervous systems, such as zebrafish larval brains. This ability to monitor wide fields at video frame rates is also available using one-photon microscopy at superficial locations in brain tissue. Second, while electrophysiological techniques exclusively report changes in membrane voltage or current, optical probes can report membrane voltage and also a variety of cellular signaling ions or molecules like calcium, glutamate, cAMP, or cGMP. Each of these signals provides a different view of neural activity. For purposes of monitoring action potentials, an ideal probe will have (a) kinetics as fast as the physiological quantity to be measured, (b) high brightness, and (c) large signal changes per physiological event that do not saturate with sustained activity. Here, we review some commonly used probes, describe their characteristics and limitations, and discuss potential improvements. 2.1.Voltage Sensitive IndicatorsSince neuronal activity is represented by changes in membrane potential, voltage sensors might appear to be a logical goal for probe design. However, imaging voltage is an exceptionally difficult problem. Voltage signals last around 1 ms, 10 to 100 times faster than even the fastest calcium signals.6,7 An equally serious problem arises from the fact that voltage indicators must be confined to the plasma membrane, providing a very small volume for signal integration. Thus, even if a voltage probe gave the same per-molecule fluorescence signal as a cytoplasmic calcium indicator, its signals would still have to be averaged over many cells or many trials. An additional challenge is posed by the difficulty of specifically delivering small-molecule indicators to neuronal plasma membranes, the site of the signal of interest. For these reasons, voltage-sensitive dyes (i.e., small-molecule fluorescent indicators) have suffered from poor SNR, which can be improved by excitation of the dyes at their red spectral edge of absorption.8 Despite these challenges, voltage-sensitive dyes have proven to be useful in bulk tissue for reporting subthreshold activity7 and in some in vivo applications.9,10 More recently, voltage measurement has become possible using genetically encodable voltage indicator (GEVIs) proteins (reviewed in Refs. 11 and 12). All GEVIs contain a voltage sensor domain (for instance, from a Shaker potassium channel13 or a Ciona intestinalis voltage-sensitive phosphatase14). This domain is fused with a single fluorescent protein, or with a pair of fluorescent proteins which interact via Förster resonance energy transfer (FRET).15 Under ideal conditions, GEVIs give signals comparable in size and kinetics to small-molecule voltage indicators.12 Two recently developed GEVI proteins, ArcLight16 and MacQ,17 can detect multiple-spike-averaged fluorescence responses with time resolution in the tens of milliseconds. Another new probe, ASAP1, which is based on circularly permuted GFP, generates responses 1 to 10 ms long in response to single stimulated action potentials in cultured human embryonic kidney cells.18 At present, the main disadvantage of GEVIs is the same as that of small-molecule indicators: low per-spike SNR. This problem may be overcome by development efforts to increase the per-molecule brightness and voltage response.19 Another approach would be to specifically limit probe expression to the part of the membrane that undergoes voltage changes, and to improve the SNR and decrease the amount of “sensing capacitance” added by the addition of movable, charged voltage sensors to the membrane.20 2.2.Glutamate SensorsGlutamate is the predominant excitatory neurotransmitter in the brain, and probes have been designed to report changes in extracellular glutamate.21,22 Glutamate sensors do not directly report neural spiking activity, but exhibit the downstream consequence of neurotransmitter release from glutamate-secreting neurons, as well as other processes that shape glutamate concentration such as reuptake, diffusion in and around synapses, and changes in the amount of released glutamate (i.e., plasticity).21–23 The fluorescent indicator protein for glutamate (FLIPE)21 and glutamate-sensing fluorescent reporter (GluSnFR)22 are FRET-based, containing sequences from the bacterial glutamate-binding protein Gltl (also referred to as ybeJ) and cyan and yellow fluorescent proteins.15,22 These sensors suffer from low SNR. Recently, a single fluorescent protein glutamate sensor, iGluSnFR, has been developed. iGluSnFR comprises a circularly permuted GFP linked to a bacterial glutamate/aspartate-binding protein, and has been used for long-term imaging of glutamate release in soma, dendrites and dendritic spines in worms, zebrafish, and mammals.24,25 Compared with the FRET-based probes, iGluSnFR has high SNR and brightness, photostability, and fast kinetics (rise , decay ). In situations where the glutamatergic activity arriving at a postsynaptic neuron is the parameter of interest, glutamate-sensor proteins hold promise as a tool for neuroscience. 2.3.Calcium IndicatorsTo date, the most useful means of reporting neuronal activity has been the measurement of intracellular calcium dynamics. Calcium is a universal intracellular signal in eukaryotic cells, and the concentration of free calcium in cytoplasm is typically around . This concentration is four orders of magnitude lower than the extracellular concentration and rises substantially after action potential-driven calcium entry ( signals can rise within 1 ms and fall in 10 to 100 ms in small subcellular structures26). Calcium signals regulate a variety of cellular functions ranging from gene transcription to cell division.27 In neurons, presynaptic drives neurotransmitter release and postsynaptic calcium induced synaptic plasticity.28,29 Action potential firing leads to calcium influx through voltage-dependent calcium channels,30,31 and both NMDA-type and AMPA-type glutamate receptors admit into the cytoplasm at sites of synaptic contact.32,33 Finally, is released from internal stores via second messenger signaling pathways through a variety of G-protein-coupled receptors.34 Thus, calcium is a key signaling ion whose concentration changes are spatially specific and associated with a wide variety of neuronal signaling events.35,36 The main disadvantage of using calcium for reporting neural activity is the fact that the conversion of neuronal activity to signals takes place via intermediate filtering steps. removal mechanisms scale with the surface-to-volume ratio; therefore, calcium signals typically last for tenths of seconds or longer at the soma, and 10 to 100 ms in axonal boutons and dendritic spines.35,36 This has the consequence of limiting the fidelity of inferred activity. The conversion of calcium signals back to neural activity requires deconvolution algorithms37 and other statistical approaches to allow estimation of spike timing. However, so far this limitation has been offset by the advantage that calcium concentration can rise dramatically after even one action potential, and by the fact that as a divalent cation, calcium interacts strongly with binding targets, making possible the development of fluorescent calcium indicator dyes and proteins. Consequently, calcium imaging is currently the technology of choice for following neural activity in brain circuits. Calcium indicators currently in use fall into two categories: synthetic small-molecule organic dyes and designed sensor proteins. Synthetic small-molecule indicators are based on the chelator 1,2-bis(o-aminophenoxy)ethane-N,N,N′N′-tetraacetic acid (BAPTA), which has low pH sensitivity and fast kinetics.38 Small-molecule dyes have advantages that include fast binding and dissociation kinetics, near-linear response properties, and large fluorescence changes.39,40 The fast binding and dissociation kinetics allow for detection of fast calcium fluctuations. Calcium indicators, such as Oregon Green BAPTA-1 (OGB-1), give large fluorescence changes upon binding calcium and show high photostability, and are widely used in intact brain tissue.41 However, calcium indicators are subject to fast extrusion from the cell and are typically bulk loaded into tissue, providing low contrast between a cell and its surroundings. The development of GECI proteins based on fluorescent proteins began in the 1990s. This class of probes enabled targeted expression in specific cell types as well as long-term labeling of cells and structures of interest with high optical contrast.3 GECIs fall into several families defined by their functional design principles.42 2.3.1.Förster resonance energy transfer–based genetically encoded calcium indicatorsThe first GECIs (“cameleons”) were recombinant FRET-based proteins containing a calmodulin (CaM) domain joined to a myosin light chain kinase peptide M13 domain bound to calcium-bound CaM. These domains were flanked by EBFP/ECFP at the -terminus and EGFP/YFP at the -terminus.43 After binding, CaM interacts with the adjacent M13 peptide, leading to conformational and distance changes between the two fluorophores. The early FRET-based indicators such as Cameleon-2 used EBFP/EGFP donor-acceptor pairs and suffered from dim fluorescence and photobleaching.44 More recent variations with CFP/YFP pairs (yellow cameleons, or YC) exhibit higher SNR and photostability.45,46 Unfortunately, the first YC series of sensors were negatively affected by and pH sensitivity, a lack of folding efficiency at 37°C, and low fractional fluorescence change. A series of redesigns was implemented by employing improved variants of YFP or by substituting M13 with another CaM-binding peptide.45,47–50 Currently, commonly used FRET-CaM-based sensors include YC2.60 and YC3.60, which51 have been shown to reliably monitor cortical L2/3 pyramidal neurons and cerebellar Purkinje cells,51,52 and D3cpV, which has been shown to track sensory stimuli in L2/3 pyramidal neurons of the somatosensory cortex53 and cerebellar Purkinje cells.54 A recent design improvement in the YC series is YC-Nano, which has an unusually high affinity for , and thus a low dissociation constant () ( to 140 nM).46 YC-Nano can report single complex spikes in cerebellar Purkinje cells.46 However, the high affinity is accompanied by slow intramolecular dynamics, since these probes also have extremely slow kinetics, with fluorescence signals that take seconds to decay. Such sluggishness creates substantial challenges in monitoring neurons that fire more often than once per second.51,55 Another FRET-based GECI with a faster responsiveness exploits the vertebrate skeletal and cardiac muscle Troponin C (TnC) as the binding domain. TnC was chosen as a calcium sensor for its decreased potential interactions with endogenous proteins and its faster binding rates. Early variants such as TN-XL demonstrated a faster decay rate in Drosophila motor neurons (rise , decay ).56 A newer version of TN-XL, TN-XXL, has been used for the long-term tracking of the mouse visual cortex,57 but despite its improved SNR it showed relatively slow kinetics (rise , decay ; as measured in Drosophila). At present, TN-XXL has fallen out of use because of the superior brightness of the GCaMP series of GECIs. However, it is worth noting that a TnC-based GECI using the FRET principle, called Twitch, has potentially useful features.58 Twitch uses a mutated TnC with only one or two binding sites remaining. This has the consequence of reducing Twitch’s cooperativity and increasing the sensitive concentration range. The SNR of Twitch has been improved by linker diversification, and Twitch has been used to successfully track activity of L2/3 pyramidal neurons in vivo.58 Since Twitch is FRET-based, it potentially uses different wavelengths from GFP-based GECIs, and opens new spectral bands for imaging.58 However, like all FRET-based indicators, Twitch sensors still have considerably slower off-responses to calcium than synthetic and single-fluorophore indicators of comparable affinity [see Fig. 4(d)]. 2.3.2.GCaMPsIn our laboratory, we focus on a GFP-Calmodulin fusion protein [GCaMP, Fig. 1(a)],59 which, because of recent improvements in brightness, photostability, and biostability, has rapidly ascended in popularity. The first GCaMP, GCaMP1, established the basic functional architecture: a circularly permuted EGFP domain (cp149 to 144) with linkers connecting a skeletal muscle myosin light chain kinase M13 peptide to the -terminus and a CaM domain to the -terminus.60 When calcium binds CaM, the combination binds with M13, protecting the GFP chromophore from the aqueous environment and leading to an increase in fluorescence. Even though the dynamic range and affinity to calcium () were sufficient for monitoring physiologic [] changes, GCaMP1 had poor folding, slow maturation at 37°C and high pH sensitivity.61 Subsequent rounds of development62,63 replaced the M13 sequence with the CaM-binding RS20 domain of smooth muscle myosin light chain kinase63 and other changes64 leading to GCaMP3, a probe that outperformed D3cpV and TN-XXL in photostability, low baseline brightness, signal amplitude in mammalian neurons, and peak responses in Drosophila and C. elegans,65 and could be used for the monitoring of neuronal ensemble activity in behaving animals.66 Fig. 1Engineering a faster GCaMP. (a) Crystal structure of calcium-bound GCaMP (PDB: 3EVR) showing the barrel of the circularly permuted EGFP attached to a calmodulin domain (with calcium binding sites indicated by arrows) and the calmodulin-binding RS20 domain. (b) A functional model of GCaMP molecular dynamics. Intramolecular associations between the cpEGFP (pale green and green), calmodulin C-lobe (high affinity loops III and IV; dark yellow) and N-lobe (low affinity loops I and II; yellow) and RS20 protein (red) require calcium. A large calcium step leads to fast activation of the cpEGFP starting with N-lobe binding, whereas small calcium transients slower activation starting with the C-lobe. 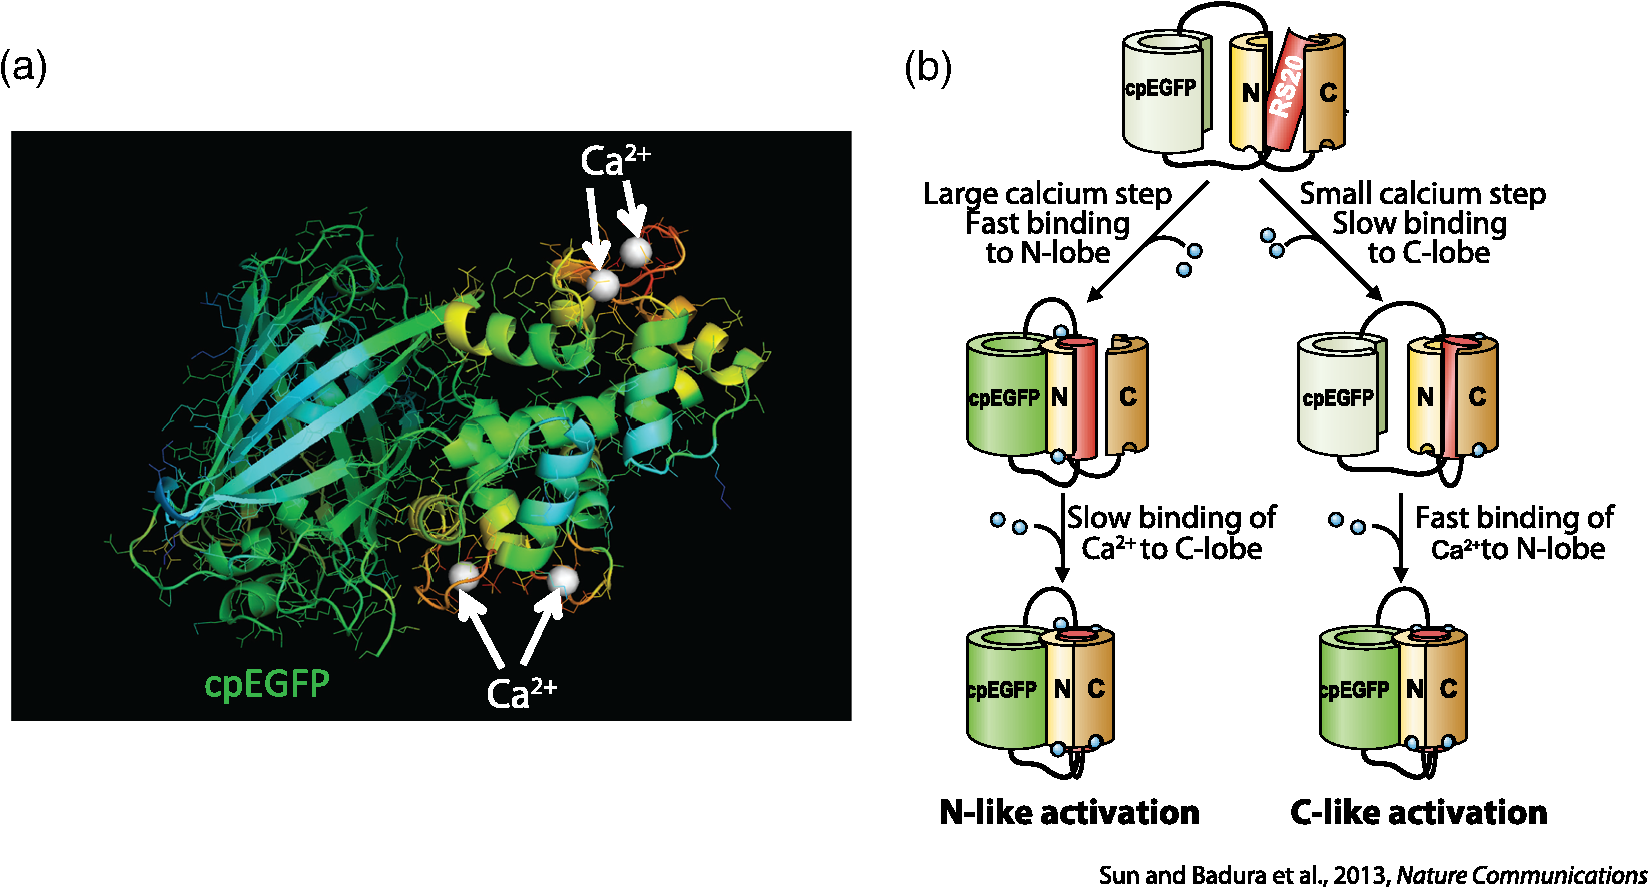 After GCaMP3, improvements in GCaMP have diverged into two paths, one focused on brightness and the other focused on speed. From a design team at Janelia Farm research campus of the Howard Hughes Medical Institute, improvements in brightness and stability arose with the GCaMP567 and GCaMP64 family of probes. The fastest of these, GCaMP6f, has a faster off-response rate than GCaMP5G or GCaMP3. In the Nakai laboratory in Japan, GCaMP7 and GCaMP8 also show increased brightness.68,69 In our laboratory, we have focused our efforts on speeding up GCaMP’s kinetics. In 2013, based on GCaMP3 as a starting sequence, we developed Fast-GCaMP variants that have 20-fold accelerated off-responses compared with GCaMP3.2 We now distinguish the original Fast-GCaMPs from newer variants by referring to them using the nomenclature “Fast-GCaMP3-xxx.” Response dynamics of the Fast-GCaMP3 series were improved by targeting mutations to the CaM domain and its binding partner, the RS20 domain.2 Since both Fast-GCaMP3 and GCaMP6 variants showed excellent performance in mammalian cells and GCaMP6 probes showed improved brightness and SNR, we decided to combine mutations in the two probe families. Based on the speed and brightness of available probes, we chose GCaMP6f4 as a starting sequence and inserted mutations denoted as RS06 and RS09, the Fast-GCaMP3 variants that showed the fastest kinetics in neurons.2 The result is Fast-GCaMP6f, a series of probes with both high brightness and rapid response dynamics upon calcium binding. 3.Results3.1.Targeted Approach to Increasing Genetically Encoded Calcium Indicator DynamicsIn order to maximize the speed of GECI responses, we started with GCaMP6f as our template, which among the high-affinity GCaMP6 variants showed the fastest fluorescent transients in vivo.4 We then introduced the Fast-GCaMP M374Q (“RS06”) and L414T (“RS09”) mutations, which disrupt the RS20-calmodulin interaction and generated variants with the fastest off-responses when introduced to the GGaMP3 scaffold, into the GCaMP6f sequence [Fig. 2(a)].2 The novel variants are named Fast-GCaMP6f-RS06 and Fast-GCaMP6f-RS09. The emission maxima of these two variants are similar to those of GCaMP3 and GCaMP6f [Fig. 2(b)]; at saturating []) when excited with the GFP wavelength (). We purified these two variants and performed steady-state titrations [Fig. 3(a)] to estimate the , dissociation constant for (), and the cooperativity (Hill coefficient, ). The calcium-binding affinities of the novel variants were comparable to their Fast-GCaMP3 counterparts and the fluorescence dynamic ranges were almost as great as GCaMP6f (Table 1). Fig. 2Combining Fast-GCaMP3 mutations and GCaMP6f protein. (a) Schematic representation of the RS06 and RS09 mutations in the GCaMP6f sequence. The crystal structure on the left shows GCaMP in the folded state. (b) Emission spectra for Fast-GCaMP6f-RS06, Fast-GCaMP6f-RS09 and GCaMP6f. 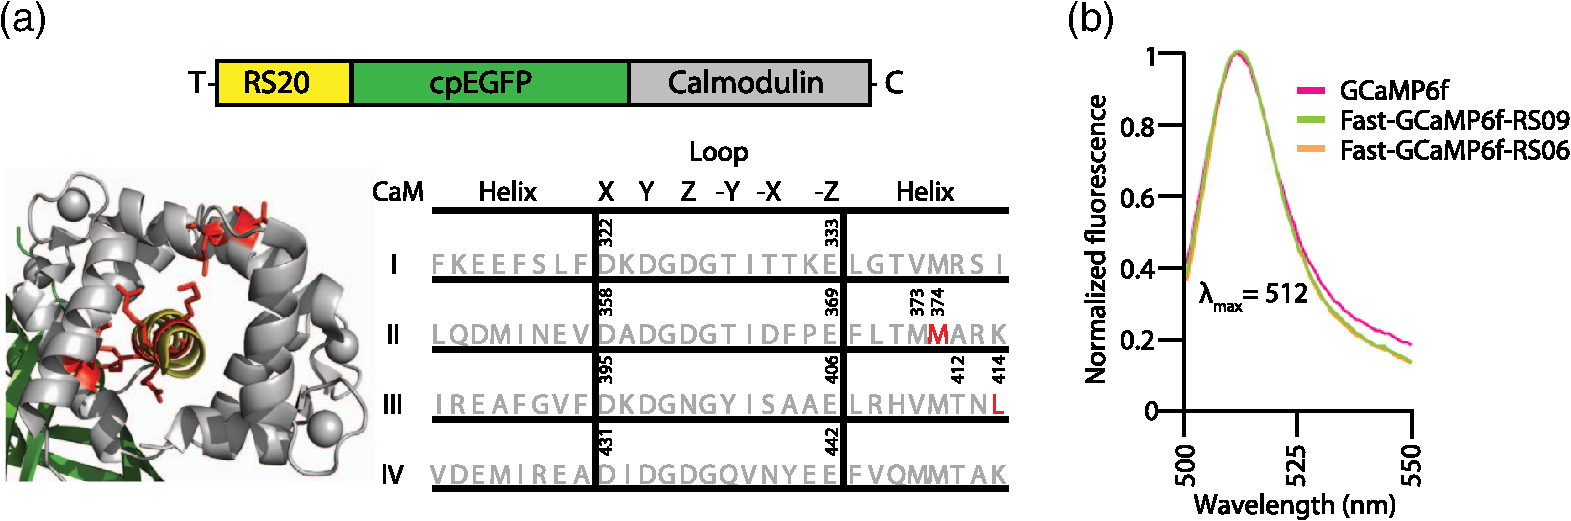 Fig. 3Fast-GCaMP6f variants retain the brightness of GCaMP6f. (a) titration curves of the small-molecule dye Oregon green BAPTA-1, and various GCaMP variants. Solid curves represent fits to the Hill equation. (b) Bar graphs depict high-calcium brightness () and minimum low-calcium brightness () of Fast-GCaMP6f-RS06, Fast-GCaMP6f-RS09, and GCaMP6f relative to GCaMP3 measured at 25°C (pH 7.20). (c) Dynamic range and maximum brightness of Fast-GCaMP6f-RS06, Fast-GCaMP6f-RS09, and GCaMP6f relative to the previously described Fast-GCaMP3 series.2 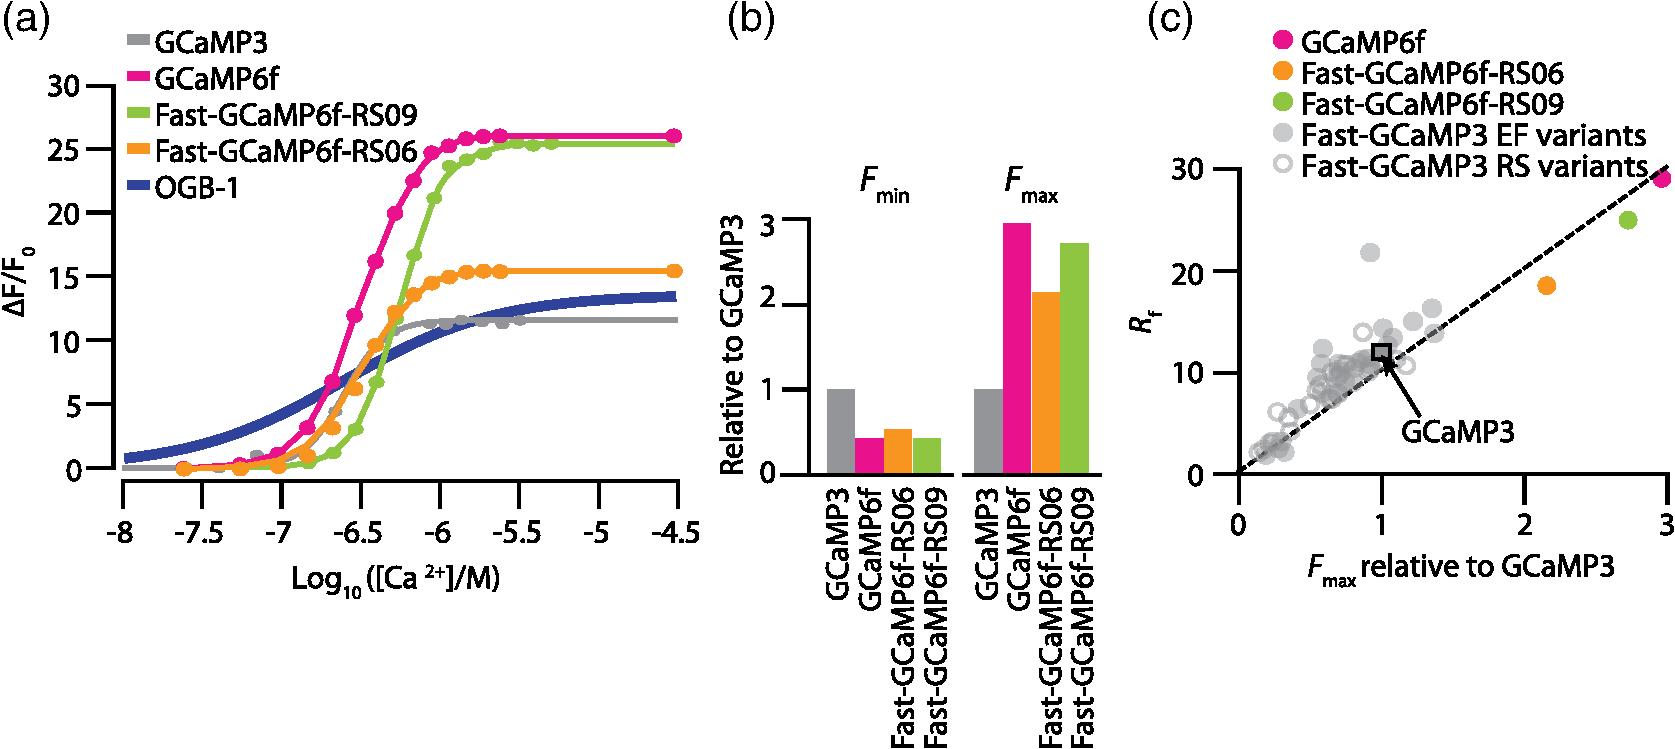 Table 1Biophysical properties of novel Fast-GCaMP6f variants and previously described GCaMP variants. KD (nM) was measured at 25°C (pH 7.20) and decay t1/2 (ms) was measured at 25°C and 37°C.
3.2.Fast-GCaMP6f Variants Retain the Brightness of GCaMP6fA key feature of GCaMP6 variants is that they have much greater brightness at saturating calcium () than GCaMP3.4 Both Fast-GCaMP6f-RS06 and Fast-GCaMP6f-RS09 retained the per-molecule brightness of the GCaMP6f probe: values were comparable to GCaMP6f and exceeded that of GCaMP3. The brightness at low calcium () was not significantly different from GCaMP6f [Fig. 3(b)]. Similar to our previous report,2 and values were strongly correlated [Fig. 3(c)]. 3.3.Fast-GCaMP6f Variants Show Improved Off-Responses to Decreases in CalciumWe used stopped-flow fluorimetry to characterize the response kinetics of the two novel hybrid variants to an instantaneous drop in concentration from to zero [less than 10 nM; Fig. 4(a)]. Like GCaMP3 and Fast-GCaMP3, the Fast-GCaMP6f variants responded with a double exponential time course, in contrast with the OGB-1 single exponential fit. We compared the half-decay-time off-response () at room temperature (25°C) and mammalian physiological temperature (37°C) to the of GCaMP3, GCaMP6f, and OGB-1 at 37°C [Fig. 4(b)]. Both Fast-GCaMP6f-RS06 and Fast-GCaMP6f-RS09 showed significantly faster off-responses when compared to GCaMP6f (Table 1; at 25°C: , and ; at 37°C: , , and ). We did not find a reciprocal relationship between and [Fig. 4(c); at 25°C]. This stands in contrast to small-molecule calcium indicators as well as Fast-GCaMP variants with modified CaM EF-hand loop domains. Here, the mutations to the CaM and RS20 interference introduced in Fast-GCaMP6f-RS06 and Fast-GCaMP6f-RS09 dramatically accelerated the decay responses yielding a 3- and 4-fold increase in the over that of the GCaMP6f, respectively. Taken together, these measurements indicate that response kinetics depend not only on affinity as regulated by the calcium binding site but also on intramolecular conformational changes downstream of calcium binding. Fig. 4Purified Fast-GCaMP6f variants show rapid off-responses to decreases in calcium. (a) Schematic of a stopped-flow fluorimeter. (b) The fluorescence decay responses of OGB1 and various GCaMP variants to a downward step in from to less than 10 nM at 37°C. Traces are scaled to the maximum fluorescence intensity at . (c) Relationship between and at 25°C of Fast-GCaMP6f-RS06, Fast-GCaMP6f-RS09, and GCaMP6f. GCaMP3, OGB, Fast-GCaMPs (both EF and RS variants), Twitch probes (Twitch-1 and Twitch 4; values adapted from Ref. 58, TN-XL and TN-XXL are shown for comparison (values adapted from Refs. 56 and 57). TN-XXL decay times were measured in Drosophila. Kinetics of all other probes were measured using stopped-flow fluorimetery. 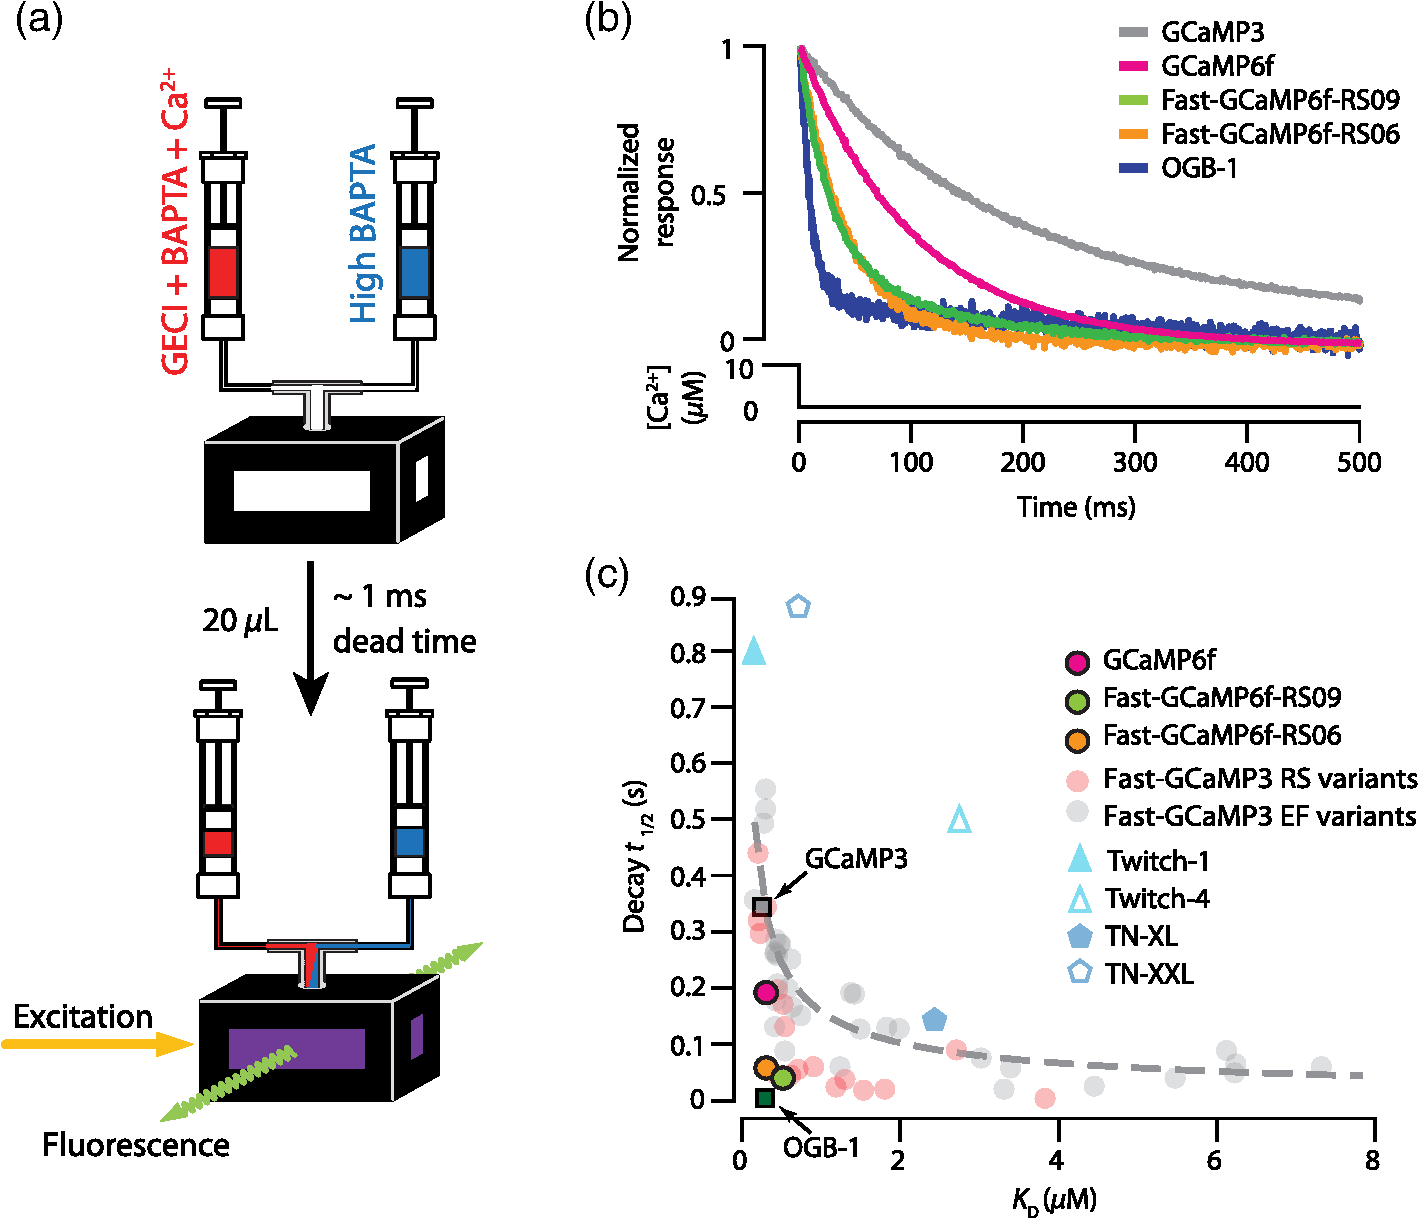 3.4.Fast-GCaMP6f Variants Allow Rapid Monitoring of Activity in Brain SlicesTo assess the performance of the novel GECIs in mammalian neurons, we performed calcium imaging of L2/3 cortical neurons in acutely cut brain slices [Fig. 5(a)] using two-photon microscopy. Following in utero electroporation of GCaMP6f, Fast-GCaMP6f-RS06 or Fast-GCaMP6f-RS09 at embryonic day 15 (E15), brain slices were prepared from 14- to 21-day-old mice. Action potentials were evoked by current injections in whole-cell patch recordings. To quantify the response times, we estimated the time to first response () and times. The was calculated as the time for the fluorescent signals to reach standard deviations above the baseline (). The did not differ significantly between the Fast-GCaMP6f-RS06, Fast-GCaMP6f-RS09, and GCaMP6f [Fig. 5(b)]. However, GCaMP6f-RS09 showed a significantly improved decay response when compared to GCaMP6f [Fig. 5(c); mean for , mean for , mean for ]. As expected from the purified protein measurements, GCaMP6f showed a slightly higher peak amplitude than Fast-GCaMP6f-RS09 and Fast-GCaMP6f-RS06 [Fig. 5(d)]. Fig. 5Fast-GCaMP6f-RS06 and Fast-GCaMP6f-RS09 show fast responses in mammalian brain slices. (a) A two-photon image of a patched L2/3 pyramidal neuron expressing GCaMP6f. The outline depicts the patch electrode position. The white line represents the dendritic scan location. (b) Response onsets of the fluorescent responses to action potentials elicited by a depolarizing current step for the two new variants and that of the GCaMP3 and GCaM6f (for GCaMP6f, ; GCaMP3, ; Fast-GCaMP6f-RS06, ; Fast-GCaMP6f-RS09, ). Line segments indicate means. (c) Decay times for the same neurons; -value = 0.003 for comparison between the Fast-GCaMP6f-RS09 and the . (d) of GCaMP6f, Fast-GCaMP6f-RS09 and Fast-GCaMP6f-RS09. 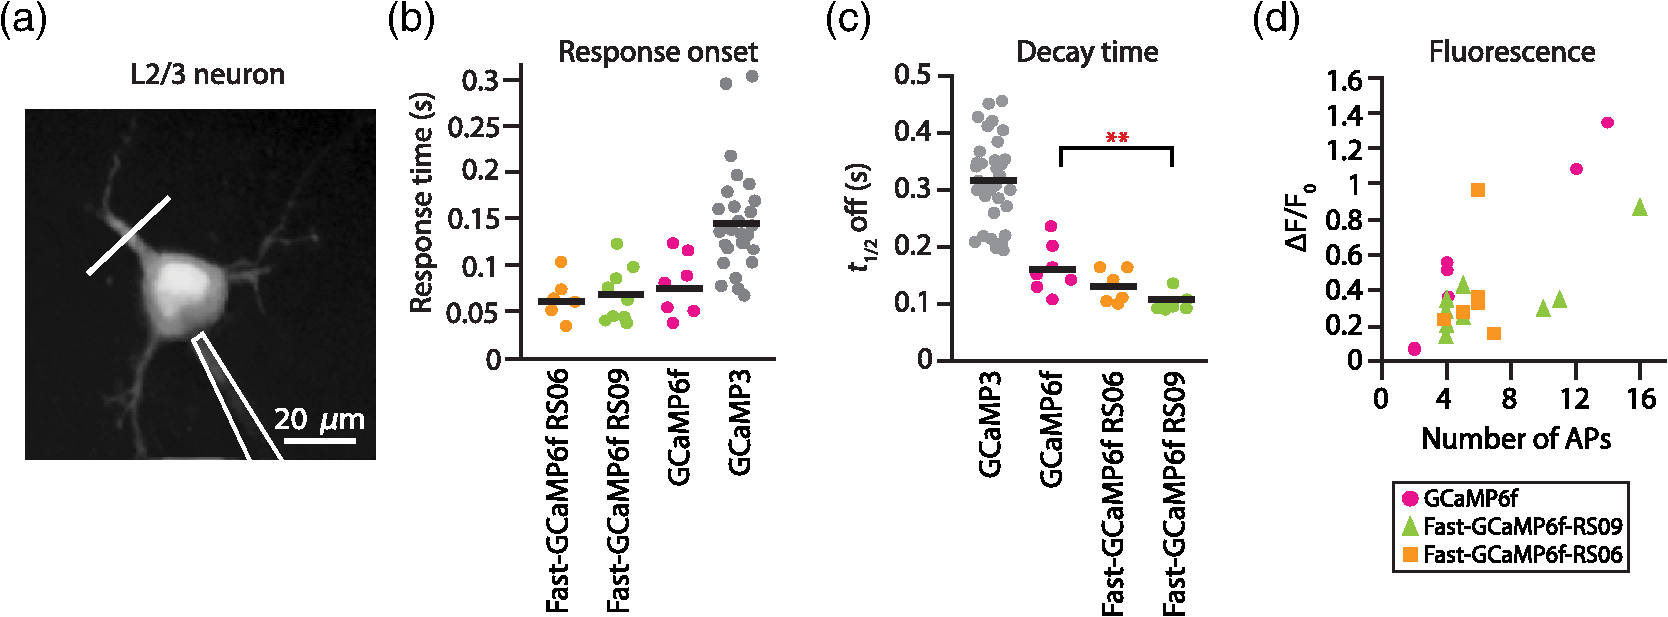 3.5.Imaging Cerebellar Purkinje Cell Activity in Awake MiceBased on the performance of purified protein and measurements in L2/3 pyramidal cells, we selected Fast-GCaMP6f-RS09 for in vivo testing. We injected AAV2/1.hSyn.GCaMP6fRS09 or AAV2/1.hSyn.GCaMP6f into the cerebellar cortex of 8- to 14-week-old mice. We monitored the activity of cerebellar Purkinje cells, which generate a characteristic dendritic calcium response accompanying each complex spike.70,71 Fluorescence signals were monitored across dendritic arbors [Fig. 6(a), left panel] in awake head-fixed mice freely ambulating on a treadmill. Both Fast-GCaMP6f-RS09 and GCaMP6f showed spontaneous complex spikes [typical responses Fig. 6(a), right panel; averaged responses normalized to the peak Fig. 6(b)]. For all spike peaks (15 cells producing 1021 spikes for Fast-GCaMP6f-RS09 and 10 cells producing 476 spikes for GCaMP6f), we measured the peak amplitude and the response kinetics. The time from peak fluorescence to 50% of the peak fluorescence was defined as the half time decay. Consistent with the purified protein measurement (see Fig. 3), the peak of GCaMP6f was significantly higher than that of Fast-GCaMP6f-RS09 [Fig. 6(c); median for , median for ]. However, Fast-GCaMP6f-RS09 showed significantly faster decay times than GCaMP6f [Fig. 6(d); median for , median for ]. Taken together, these results show that Fast-GCaMP6f-RS09 successfully combines the fast response rates of Fast-GCaMP with the increased brightness and dynamic range of GCaMP6f. Fig. 6Fast-GCaMP6f-RS09 gives faster-decaying complex spike responses. (a) Left, average fields of view and relative fluorescence traces for GCaMP6f (top) and Fast-GCaMP6f-RS09 (bottom) expressing Purkinje cells. Right, purple and green traces represent -mediated fluorescence change over time and the black tick marks represent detected complex spikes (CSs). (b) Averaged CS-evoked calcium transients for GCaMP6f (purple) and Fast-GCaMP6f-RS09 (green) scaled to match their peak amplitudes. (c) Box plots comparing the of GCaMP6f and Fast-GCaMP6f-RS09. (d) Box plots comparing the decay times of GCaMP6f and Fast-GCaMP6f-RS09. In (c) and (d), the median is indicated by the horizontal black thick mark, and green (GCaMP6f) and purple (Fast-GCaMP6f-RS09) boxes represent the SEM. 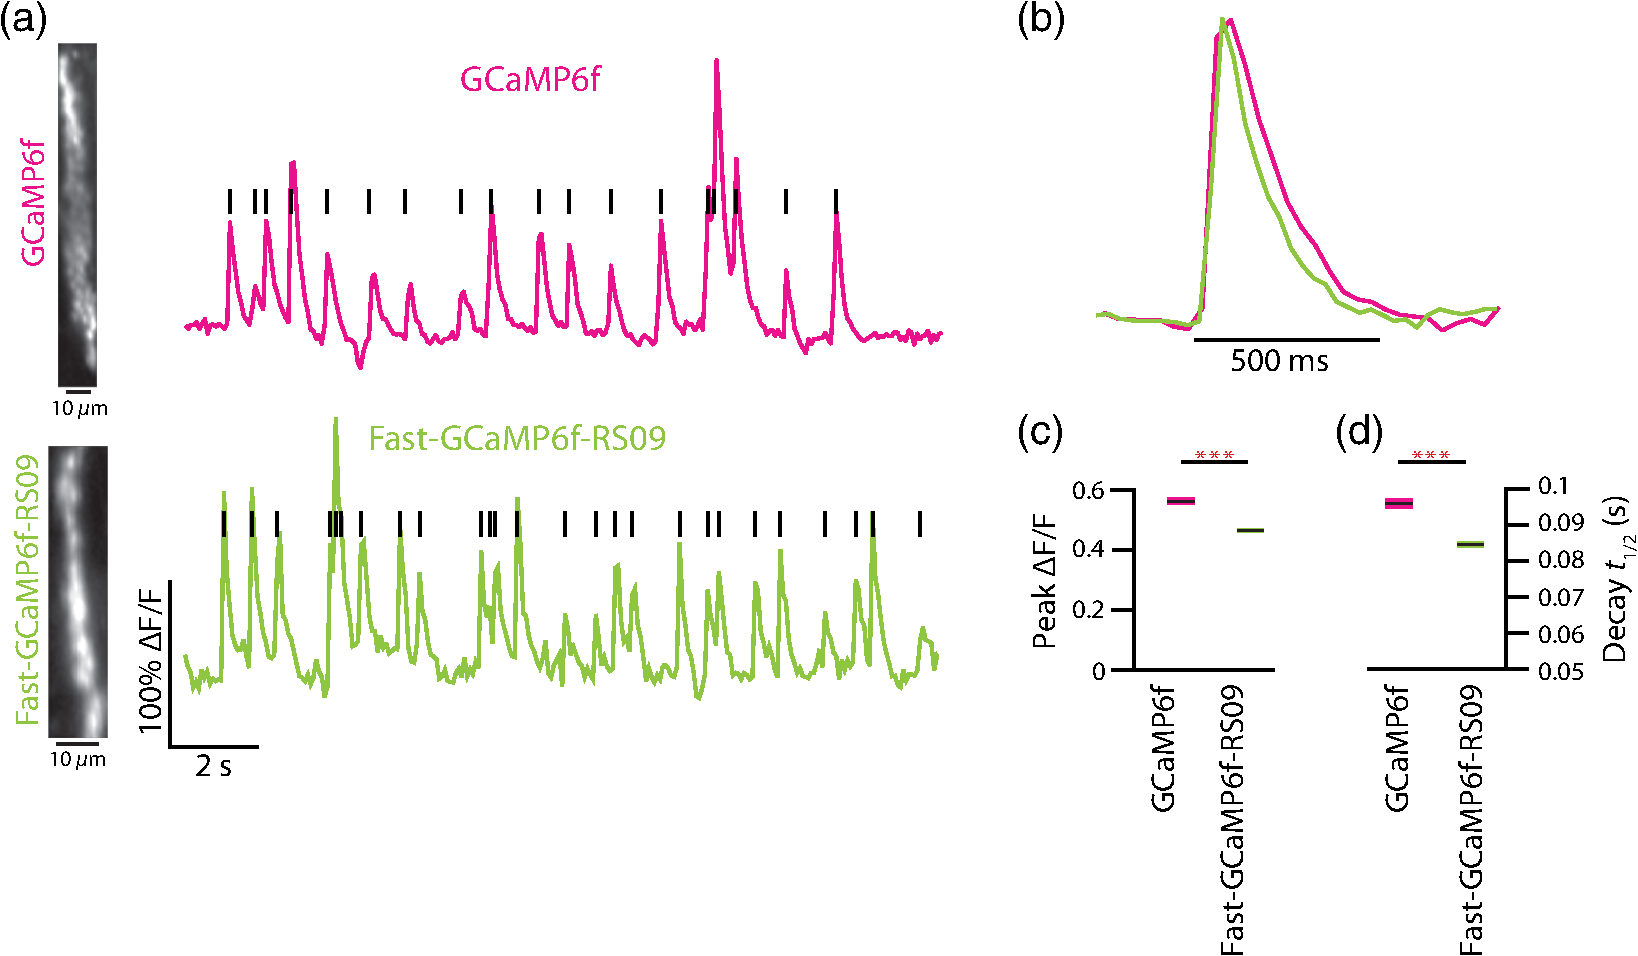 4.DiscussionMost activity probes developed in the last 3 years offer excellent photostability and satisfactory brightness. Additionally, viral delivery methods, transgenic animals, and conditional Cre-dependent expression and other promoters allow high levels of cell-type specificity.72 In vivo, GECI and GEVI expression in neurons is commonly achieved with adeno-associated viruses (AAVs), which show stable levels of protein expression in vivo and allow long-term imaging.73–76 Therefore, often the question is not what probe is the best but rather which probe will best suit one’s applications. Probe choice should be constrained by three characteristics: (1) response kinetics, (2) probe sensitivity, and (3) SNR, as well as other specific aspects of the research question. Many groups have focused their efforts solely on improving the SNR associated with a single action potential in an otherwise silent neuron. However, in vivo neurons fire at a variety of rates. To fully address the challenge of circuit monitoring, all three characteristics should be considered. 4.1.Probe KineticsIn our current work, we have focused on improving GCaMP’s kinetics, to which end we have generated two fast and bright calcium sensor proteins: Fast-GCaMP6f-RS06 and Fast-GCaMP6f-RS09. This innovation was necessary because, unlike BAPTA-based synthetic probes such as Oregon Green BAPTA-1, GCaMP must not only bind calcium but also undergo additional, rate-limiting conformational changes before entering or exiting the fluorescent state. These conformational changes decouple binding affinity from on- and off-response kinetics. As a result, GCaMP fluorescence signals change at a slower rate than binding and unbinding of calcium to its calmodulin domain. Consistent with this, much of our improvement in accelerating the decay response was achieved by reducing the kinetic restrictions placed by the intramolecular interactions. So far, we have not pursued major improvements in the on-response of GCaMP to increasing steps in calcium. This is an important goal because at present, GCaMP takes tens of milliseconds to respond to action potentials. Based on previous stopped-flow measurements, GCaMP’s on-response to calcium resembles the forward binding steps of calcium to calmodulin. Calmodulin’s calcium-binding sites are divided between a C-lobe and an N-lobe, where binding to the C-lobe occurs at submicromolar calcium concentrations and is relatively slow, and binding to the N-lobe requires supramicromolar calcium concentrations and has a submillisecond component [Fig. 1(b)].77 One possible route to accelerating GCaMP’s response may be to enhance the N-lobe activation route, for instance by forcing the C-lobe into a bound conformation even at resting calcium concentrations. This would allow faster tracking of individual action potentials. Another kinetic limit in tracking action potential activity arises from the fact that cell bodies take to clear calcium. In these situations, Fast-GCaMP’s fluorescence signals would be limited by the slow time course of calcium changes. In the future, this limitation can be addressed by targeting Fast-GCaMP to subcellular compartments. Such an approach has been taken by tethering GCaMP2 to synaptic vesicles by fusion to synaptophysin.78 The resulting probe, SyGCaMP2, is confined to presynaptic terminals, where calcium transients are considerably faster than at the cell body. It will be of substantial interest to similarly tether Fast-GCaMP6f variants. Such an innovation would provide a substantial advantage for GCaMP relative to small-molecule indicators. To summarize, a good activity-tracking probe should minimize temporal filtering by not introducing unwanted delays. If the neurons of interest exhibit low firing frequencies and accuracy is more important than speed, FRET-based, ratiometric indicators such as Twitch, as well as the slow GCaMP variants such as GCaMP6s, will be the sensors of choice. However, in neurons with higher levels of activity, indicators with fast responses such as GCaMP6f and our new Fast-GCaMP6f-RS09 will more accurately track changes in firing frequencies. 4.2.Sensitive Range to Calcium ChangesThe optimal choice of GECI also depends on the calcium concentration range that one wants to investigate. In neurons, the resting concentration typically varies between 50 and 200 nM, while [] during activity-induced elevation can reach 1 to .79,80 High affinity GECIs with a near the resting [] permit high-SNR monitoring of small transients, but saturate at high concentrations and may also perturb the cell’s intrinsic -dependent processes.43,81 An ideal sensor will span the entire range of likely calcium concentrations in a linear way. A key parameter of a probe’s sensitive range is its cooperativity, which is described by its Hill coefficient . Physically, is related to the binding stoichiometry of the probe. As a rule of thumb, a probe goes from 9% to 91% of its fluorescence range over a range of decades of concentration. For example, OGB-1 () is capable of monitoring decades, or a 100-fold range of []. GCaMP, which is based on calmodulin ( to 4), has a sensitive range of only 0.5 to 0.7 decade, or a 3- to 5-fold range of []. Therefore, a [] transient peaking at even a few micromolar will saturate the GCaMP signal. In this way, high cooperativity, a phenomenon that allows strong intramolecular conformational changes, also narrows the probe’s sensitive range. This limitation makes it very hard for any one GCaMP to track both low and high rates of action potential firing [Fig. 1(b)]. As a remedy for the high positive cooperativity and narrow calcium concentration range of GCaMP, it should be possible to strategically deploy combinations of GCaMP variants. This step has already been taken with small-molecule indicators,82 where simultaneous loading with two indicators of different affinities leads to a larger calcium sensitivity range than either indicator alone. Similarly, coexpression of Fast-GCaMPs with two different affinities for calcium should allow the monitoring of a wider range of calcium concentrations. In this strategy, individual GCaMP molecules have high cooperativity, but in the aggregate behave with “virtual negative cooperativity.” This approach should be achievable using expression vectors large enough to contain multiple Fast-GCaMP sequences.83 4.3.Signal-to-Noise RatioImproving SNR depends on both the physical properties of a probe (such as brightness, sensitive and dynamic range, and kinetics) and on the features of the signal to be monitored. For instance, a very brief and spatially restricted signal is more difficult to measure than one that is long-lasting and spatially extended. In general, SNR increases when the fluorescence can be integrated in space and time. Spatial integration depends on the subcellular localization of a probe, as well as the signal to be studied. Thus, GECIs, which are expressed in the cytoplasm and track decisecond-scale calcium signals, have a higher SNR than GEVIs,3 which are limited to the membrane and track millisecond-scale voltage changes. In order to retain single-spike resolution, the probe’s signal should last up to roughly the reciprocal of the spike rate;19 a slower indicator will distinguish poorly between the spikes and a faster indicator will not take advantage of time periods during which the signal can be integrated. In the case of calcium signals, activity patterns can be recovered with retention of SNR using deconvolution algorithms.37 Another limit to SNR comes from the amount of indicator that can be safely expressed by a neuron without perturbing internal cellular dynamics. To address this constraint, improvements in features such as dynamic range, and minimum and maximum brightness will positively affect the SNR.4,46,57 As genetically encodable indicators continue to improve, they will continue to have a cardinal advantage over small molecule dyes, which indiscriminately stain cellular structures or have to be loaded into single cells on an individual basis, and typically permit imaging for only minutes to hours.84 Genetically encodable indicators can be used to label selected cells and subcellular domains, and allow repeated observation for days to weeks. Now that the GECIs have turned the corner to everyday usability, they can help researchers to attain new heights in the reliable imaging of neuronal activity in living brain networks. 5.MethodsAll animal experimental procedures were approved by the Princeton University Institutional Animal Care and Use Committee and performed in accordance with the animal welfare guidelines of the National Institutes of Health. 5.1.Fast-GCaMP6f Variant SynthesisPoint mutations to GCaMP6f were generated using the QuikChange II Site-Directed Mutagenesis Kit and Primer Design Program (Agilent Technologies, Santa Clara, California) as described before.2 We selected point mutations which previously improved GCaMP3 dynamics.2 In short, coding regions were polymerase chain reaction amplified and cloned into the NotI and XbaI sites of the pET28b (Novagen) expression vector. Starter cultures of transformed (BL21(DE3) Escherichia coli (New England Biolabs, Ipswich, Massachusetts) were grown first for 4 h in 10 ml LB medium supplemented with kanamycin shaken at 225 rpm at 37°C. Later, the cultures were added to 1 liter of LB medium and shaken at 225 rpm at 37°C until the OD at 600 nm reached 1.0. The temperature was then reduced to 25°C and protein expression was induced with 1-mM IPTG for 12 to 16 h. Cells were collected and mechanically lysed. Remaining cell debris was removed by 40,000 g centrifugation for 1 h at 4°C. The clear lysate was eluted with 500-mM imidazole, concentrated, passed through a PD-10 desalting column (GE Healthcare, Life Sciences, Pittsburgh, Pennsylvania), and re-suspended in storage buffer (30-mM MOPS, 100-mM KCl, pH 7.20). Protein concentration was determined using absorption spectroscopy. The protein was stored at 4°C. 5.2.Purified Protein CharacterizationTo measure the properties of purified Fast-GCaMP, we used 10-mM EGTA (complexometry-grade, Sigma-Aldrich, St. Louis, Missouri) for steady-state measurements and 2-mM BAPTA (Molecular Probes, Life Technologies, Grand Island, New York) for kinetic measurements. Calcium buffers of various free concentrations were generated by mixing high- ( plus EGTA or BAPTA) and zero- (EGTA or BAPTA alone) solutions,36 obtained either from a commercial source (Invitrogen, Grand Island, New York) or made according to the method of Neher.42 Free concentrations were verified through titration of Fura-2 and Fura-4F (Molecular Probes). Free concentrations were calculated using MaxChelator85 assuming an ionic strength of 0.15 N for 10-mM , 100-mM KCl, and 3-mM KMOPS (pH 7.20). Emission spectra were measured on a FluoroLog 3 spectrofluorometer (Horiba Jobin Yvon Inc., Edison, New Jersey). For calcium dependence, steady-state measurements were made using an -2500 fluorescence spectrophotometer (488-nm excitation and 509-nm emission) running FL Solutions version 4.1 software (Hitachi, Japan) at 23°C using 0.5 to of purified protein suspended in either zero- buffer or high- buffer, followed by reciprocal dilution with the other buffer to reach free concentrations between 0.01 and . The molar protein concentration was determined by measuring absorbance at 280 nm (); concentrations were further confirmed using after alkali denaturation with 0.1 M NaOH for 3 min to eliminate fluorescence and generate an absorption band with . Stopped-flow measurements were performed at 25°C or 37°C on an AutoSF-120 instrument with the Stopflow data acquisition software (version 1.0.1830, KinTek, Austin, Texas). Excitation was supplied by a xenon arclamp monochromator with excitation at 488 nm and a emission filter (Chroma Technologies, Brattleboro, Vermont) was used for detection. The mixing dead time was . Each measurement consisted of of reactant from each chamber. At least five measurements were averaged and analyzed for 1 to 2 exponential components. Traces were fitted to a double exponential . To estimate the decay half-life (), was used in compensating for the instrument dead time and was used as the equilibrium. 5.3.Combined Patch Clamp Recordings and Calcium Imaging of Cortical L2/3 NeuronsIn utero electroporation of E-15 Swiss Webster mice (strain B6.129-Calb1tm1Mpin/J, The Jackson Laboratories, Bar Harbor, Maine) with plasmids expressing Fast-GCaMP6f variants and GCaMP6f under the CAG promoter yielded expression of the GECI in L2/3 pyramidal neurons. -thick cortical brain slices were prepared from P14-21 mice using ice-cold artificial CSF (aCSF) (126-mM NaCl, 3-mM KCl, 1-mM , 20-mM D-glucose, 25-mM , 2-mM and 1-mM ; saturated with 95% ). Slices were preincubated at 34°C for 1 h and then kept at room temperature. During recording and imaging, session slices were transferred to an immersion-type recording chamber perfused at 2 to with aCSF solution heated up to the physiological temperature () and saturated with 95% . Patch clamp recordings were obtained with borosilicate electrodes (6 to 9 MΩ) filled with a solution containing high potassium intercellular solution (133-mM methanesulfonic acid, 7.4-mM KCl, 0.3-mM , 3-mM , and 0.3-mM ; 290 mOsm; pH adjusted to 7.30 with KOH) using a shadowpatch technique. Electrophysiological signals were acquired with an Axopatch 200B amplifier and Clampex 8.0 software (Axon Instruments, Foster City, California). After whole-cell break-in, cells were held in current clamp mode (holding currents at , to ; series resistance 15 to 30 MΩ). Series resistance was monitored periodically and compensated by balancing the bridge. Spiking was induced through injection of current pulses at various amplitudes and durations and individual trials were separated by at least 10 s. L2/3 neurons were imaged using a custom-built two-photon laser scanning microscope using pulsed 830 nm (OGB-1) or 920 nm (GCaMP) excitation from a Ti:sapphire laser (Mira 900, Coherent). Excitation power was kept below 15 mW at the backplane of the objective (, NA 0.8 IR-Achroplan; Carl Zeiss, Thornwood, New York). Line scans (500 Hz) were made from dendrites at least 1 cell-diameter away from the soma. Data acquisition was controlled by ScanImage r3.6.1. 5.4.Imaging of Purkinje Cells in Awake Behaving MiceC57BL/6J mice 8 to 14 weeks old were purchased from The Jackson Laboratories at least 1 week prior to the beginning of experimental procedures. Mice were anesthetized with isoflurane. A small craniotomy was made over the right side of the cerebellum. A coverslip with a premolded Kwik-Sil plug was placed on the exposed brain and held in place by a two-piece headplate. The animal was allowed to recover overnight and on the following day anesthetized with isoflurane and injected intraperitoneally with hyperosmotic d-mannitol (15% in PBS). Approximately 15 min after d-mannitol injection, the plug covering the craniotomy was removed and AAV viral construct was injected into the cerebellar cortex (two to three injections, , 150 to below the surface). The injections contained either AAV2/1.hSyn.GCaMP6f or AAV2/1.hSyn.GCaMP6fRS09 viral constructs (Penn Vector Core, University of Pennsylvania, Pennsylvania, Philadelphia). Two-photon imaging was performed after 7 days. The mouse was head-fixed on top of a cylindrical treadmill and allowed to freely locomote. Fluorescence signals from dendritic trees of Purkinje cells were acquired with a custom-built two-photon microscope that collected data as movies of either (, 2 ms per line) or (, 1 ms per line; bidirectional scan). Dendritic calcium spikes were detected with a three-step process as previously described.70 The size of each individual calcium spike was computed as previously described.71 For each spike waveform, the baseline was defined as the 8-percentile of the value in the 500 ms window preceding the spike onset.70 The baseline was subsequently subtracted from the spike waveform. The peak amplitude for the spike was defined as the maximum of the normalized waveform. The time required to go from the peak to 50% of the peak was defined as the half-time decay. The -values for panels (d) and (e) of Fig. 5 were calculated with a one-tailed two-sample Kolmogorov–Smirnov test. AcknowledgmentsThis work was supported by NIH R01 NS045193 (S.W.), RC1 NS068414 (S.W.), McKnight Technological Innovations Award (S.W.) and by the NJCBIR fellowship CBIR12FEL031 (A.G.). We thank Smita Patel for advice and equipment access for stopped-flow fluorimetry, Fred Hughson for plasmids and protein purification materials, Loren Looger and Jasper Akerboom for advice and GCaMP constructs, Alexei Korennykh for the GCaMP crystal structure rendering and Bernd Kuhn for scientific discussion. ReferencesX. R. Sunet al.,
“SnapShot: optical control and imaging of brain activity,”
Cell, 149 1650
–1652
(2012). http://dx.doi.org/10.1016/j.cell.2012.06.009 CELLB5 0092-8674 Google Scholar
X. R. Sunet al.,
“Fast GCaMPs for improved tracking of neuronal activity,”
Nat. Commun., 4 2170
(2013). http://dx.doi.org/10.1038/ncomms3170 NCAOBW 2041-1723 Google Scholar
L. L. LoogerO. Griesbeck,
“Genetically encoded neural activity indicators,”
Curr. Opin. Neurobiol., 22 18
–23
(2012). http://dx.doi.org/10.1016/j.conb.2011.10.024 COPUEN 0959-4388 Google Scholar
T. W. Chenet al.,
“Ultrasensitive fluorescent proteins for imaging neuronal activity,”
Nature, 499 295
–300
(2013). http://dx.doi.org/10.1038/nature12354 NATUAS 0028-0836 Google Scholar
M. B. Ahrenset al.,
“Whole-brain functional imaging at cellular resolution using light-sheet microscopy,”
Nat. Methods, 10 413
–420
(2013). http://dx.doi.org/10.1038/nmeth.2434 1548-7091 Google Scholar
D. Dimitrovet al.,
“Engineering and characterization of an enhanced fluorescent protein voltage sensor,”
PloS ONE, 2
(5), e440
(2007). http://dx.doi.org/10.1371/journal.pone.0000440 1932-6203 Google Scholar
D. S. Peterkaet al.,
“Imaging voltage in neurons,”
Neuron, 69 9
–21
(2011). http://dx.doi.org/10.1016/j.neuron.2010.12.010 NERNET 0896-6273 Google Scholar
B. Kuhnet al.,
“High sensitivity of Stark-shift voltage-sensing dyes by one- or two-photon excitation near the red spectral edge,”
Biophys. J., 87 631
–639
(2004). http://dx.doi.org/10.1529/biophysj.104.040477 BIOJAU 0006-3495 Google Scholar
A. GrinvaldR. Hildesheim,
“VSDI: a new era in functional imaging of cortical dynamics,”
Nat. Rev. Neurosci., 5 874
–885
(2004). http://dx.doi.org/10.1038/nrn1536 NRNAAN 1471-0048 Google Scholar
B. Kuhnet al.,
“In vivo two-photon voltage-sensitive dye imaging reveals top-down control of cortical layers 1 and 2 during wakefulness,”
Proc. Natl. Acad. Sci. U. S. A., 105 7588
–7593
(2008). http://dx.doi.org/10.1073/pnas.0802462105 PNASA6 0027-8424 Google Scholar
T. Knopfelet al.,
“Optical probing of neuronal circuit dynamics: genetically encoded versus classical fluorescent sensors,”
Trends Neurosci., 29 160
–166
(2006). http://dx.doi.org/10.1016/j.tins.2006.01.004 TNSCDR 0166-2236 Google Scholar
H. Mutohet al.,
“Genetically engineered fluorescent voltage reporters,”
ACS Chem. Neurosci., 3 585
–592
(2012). http://dx.doi.org/10.1021/cn300041b ACNCDM 1948-7193 Google Scholar
M. S. SiegelE. Y. Isacoff,
“A genetically encoded optical probe of membrane voltage,”
Neuron, 19 735
–741
(1997). http://dx.doi.org/10.1016/S0896-6273(00)80955-1 NERNET 0896-6273 Google Scholar
Y. Murataet al.,
“Phosphoinositide phosphatase activity coupled to an intrinsic voltage sensor,”
Nature, 435 1239
–1243
(2005). http://dx.doi.org/10.1038/nature03650 NATUAS 0028-0836 Google Scholar
T. Förster,
“Zwischenmolekulare energiewanderung und fluoreszenz,”
Annalen der Physik, 437 55
–75
(1948). http://dx.doi.org/10.1002/(ISSN)1521-3889 ANPYA2 0003-3804 Google Scholar
G. Caoet al.,
“Genetically targeted optical electrophysiology in intact neural circuits,”
Cell, 154 904
–913
(2013). http://dx.doi.org/10.1016/j.cell.2013.07.027 CELLB5 0092-8674 Google Scholar
Y. Gonget al.,
“Imaging neural spiking in brain tissue using FRET-opsin protein voltage sensors,”
Nat. Commun., 5 3674
(2014). http://dx.doi.org/10.1038/ncomms4674 NCAOBW 2041-1723 Google Scholar
F. St-Pierreet al.,
“High-fidelity optical reporting of neuronal electrical activity with an ultrafast fluorescent voltage sensor,”
Nat. Neurosci., 17 884
–889
(2014). http://dx.doi.org/10.1038/nn.3709 NANEFN 1097-6256 Google Scholar
B. A. Wiltet al.,
“Photon shot noise limits on optical detection of neuronal spikes and estimation of spike timing,”
Biophys. J., 104 51
–62
(2013). http://dx.doi.org/10.1016/j.bpj.2012.07.058 BIOJAU 0006-3495 Google Scholar
W. Akemannet al.,
“Effect of voltage sensitive fluorescent proteins on neuronal excitability,”
Biophys. J., 96 3959
–3976
(2009). http://dx.doi.org/10.1016/j.bpj.2009.02.046 BIOJAU 0006-3495 Google Scholar
S. Okumotoet al.,
“Detection of glutamate release from neurons by genetically encoded surface-displayed FRET nanosensors,”
Proc. Natl. Acad. Sci. U. S. A., 102 8740
–8745
(2005). http://dx.doi.org/10.1073/pnas.0503274102 PNASA6 0027-8424 Google Scholar
S. A. Hireset al.,
“Optical measurement of synaptic glutamate spillover and reuptake by linker optimized glutamate-sensitive fluorescent reporters,”
Proc. Natl. Acad. Sci. U. S. A., 105 4411
–4416
(2008). http://dx.doi.org/10.1073/pnas.0712008105 PNASA6 0027-8424 Google Scholar
C. Dullaet al.,
“Imaging of glutamate in brain slices using FRET sensors,”
J. Neurosci. Methods, 168 306
–319
(2008). http://dx.doi.org/10.1016/j.jneumeth.2007.10.017 JNMEDT 0165-0270 Google Scholar
J. S. Marvinet al.,
“A genetically encoded, high-signal-to-noise maltose sensor,”
Proteins, 79 3025
–3036
(2011). http://dx.doi.org/10.1002/prot.23118 0887-3585 Google Scholar
B. G. Borghuiset al.,
“Two-photon imaging of nonlinear glutamate release dynamics at bipolar cell synapses in the mouse retina,”
J. Neurosci., 33 10972
–10985
(2013). http://dx.doi.org/10.1523/JNEUROSCI.1241-13.2013 JNRSDS 0270-6474 Google Scholar
M. J. HigleyB. L. Sabatini,
“Calcium signaling in dendrites and spines: practical and functional considerations,”
Neuron, 59 902
–913
(2008). http://dx.doi.org/10.1016/j.neuron.2008.08.020 NERNET 0896-6273 Google Scholar
A. GhoshM. E. Greenberg,
“Calcium signaling in neurons: molecular mechanisms and cellular consequences,”
Science, 268 239
–247
(1995). http://dx.doi.org/10.1126/science.7716515 SCIEAS 0036-8075 Google Scholar
B. L. Sabatiniet al.,
“Ca(2+) signaling in dendritic spines,”
Curr. Opin. Neurobiol., 11 349
–356
(2001). http://dx.doi.org/10.1016/S0959-4388(00)00218-X COPUEN 0959-4388 Google Scholar
R. S. Zucker,
“Calcium- and activity-dependent synaptic plasticity,”
Curr. Opin. Neurobiol., 9 305
–313
(1999). http://dx.doi.org/10.1016/S0959-4388(99)80045-2 COPUEN 0959-4388 Google Scholar
H. Miyakawaet al.,
“Synaptically activated increases in Ca2+ concentration in hippocampal CA1 pyramidal cells are primarily due to voltage-gated Ca2+ channels,”
Neuron, 9 1163
–1173
(1992). http://dx.doi.org/10.1016/0896-6273(92)90074-N NERNET 0896-6273 Google Scholar
D. B. Jaffeet al.,
“The spread of Na+ spikes determines the pattern of dendritic Ca2+ entry into hippocampal neurons,”
Nature, 357 244
–246
(1992). http://dx.doi.org/10.1038/357244a0 NATUAS 0028-0836 Google Scholar
B. L. BloodgoodB. L. Sabatini,
“Regulation of synaptic signalling by postsynaptic, non-glutamate receptor ion channels,”
J. Phys., 586 1475
–1480
(2008). http://dx.doi.org/10.1113/jphysiol.2007.148353 JPHYA7 0022-3751 Google Scholar
Y. Kovalchuket al.,
“NMDA receptor-mediated subthreshold Ca(2+) signals in spines of hippocampal neurons,”
J. Neurosci., 20
(5), 1791
–1799
(2000). JNRSDS 0270-6474 Google Scholar
A. J. VerkhratskyO. H. Petersen,
“Neuronal calcium stores,”
Cell Calcium, 24 333
–343
(1998). http://dx.doi.org/10.1016/S0143-4160(98)90057-4 CECADV 0143-4160 Google Scholar
W. MullerJ. A. Connor,
“Dendritic spines as individual neuronal compartments for synaptic Ca2+ responses,”
Nature, 354 73
–76
(1991). http://dx.doi.org/10.1038/354073a0 NATUAS 0028-0836 Google Scholar
R. Yasudaet al.,
“Imaging calcium concentration dynamics in small neuronal compartments,”
Sci. STKE, 2004 pl5
(2004). http://dx.doi.org/10.1126/stke.2192004pl5 Google Scholar
J. T. Vogelsteinet al.,
“Spike inference from calcium imaging using sequential Monte Carlo methods,”
Biophys. J., 97 636
–655
(2009). http://dx.doi.org/10.1016/j.bpj.2008.08.005 BIOJAU 0006-3495 Google Scholar
R. Y. Tsien,
“Fluorescent probes of cell signaling,”
Ann. Rev. Neurosci., 12 227
–253
(1989). http://dx.doi.org/10.1146/annurev.ne.12.030189.001303 ARNSD5 0147-006X Google Scholar
R. Y. Tsien,
“Fluorescent indicators of ion concentrations,”
Methods Cell Biol., 30 127
–156
(1989). http://dx.doi.org/10.1016/S0091-679X(08)60978-4 MCBLAG 0091-679X Google Scholar
R. Y. Tsien,
“The green fluorescent protein,”
Ann. Rev. Biochem., 67 509
–544
(1998). http://dx.doi.org/10.1146/annurev.biochem.67.1.509 ARBOAW 0066-4154 Google Scholar
F. HelmchenA. Konnerth, Imaging in Neuroscience: A Laboratory Manual, Cold Spring Harbor Laboratory Press, New York
(2011). Google Scholar
M. MankO. Griesbeck,
“Genetically encoded calcium indicators,”
Chem. Rev., 108 1550
–1564
(2008). http://dx.doi.org/10.1021/cr078213v CHREAY 0009-2665 Google Scholar
A. Miyawakiet al.,
“Fluorescent indicators for Ca2+ based on green fluorescent proteins and calmodulin,”
Nature, 388 882
–887
(1997). http://dx.doi.org/10.1038/42264 NATUAS 0028-0836 Google Scholar
O. Griesbeck,
“Fluorescent proteins as sensors for cellular functions,”
Curr. Opin. Neurobiol., 14 636
–641
(2004). http://dx.doi.org/10.1016/j.conb.2004.08.002 COPUEN 0959-4388 Google Scholar
A. Miyawakiet al.,
“Dynamic and quantitative Ca2+ measurements using improved cameleons,”
Proc. Natl. Acad. Sci. U. S. A., 96 2135
–2140
(1999). http://dx.doi.org/10.1073/pnas.96.5.2135 PNASA6 0027-8424 Google Scholar
K. Horikawaet al.,
“Spontaneous network activity visualized by ultrasensitive Ca2+ indicators, yellow Cameleon-Nano,”
Nat. Methods, 7 729
–732
(2010). http://dx.doi.org/10.1038/nmeth.1488 1548-7091 Google Scholar
T. Nagaiet al.,
“Expanded dynamic range of fluorescent indicators for Ca(2+) by circularly permuted yellow fluorescent proteins,”
Proc. Natl. Acad. Sci. U. S. A., 101 10554
–10559
(2004). http://dx.doi.org/10.1073/pnas.0400417101 PNASA6 0027-8424 Google Scholar
S. Topellet al.,
“Circularly permuted variants of the green fluorescent protein,”
FEBS Lett., 457 283
–289
(1999). http://dx.doi.org/10.1016/S0014-5793(99)01044-3 FEBLAL 0014-5793 Google Scholar
O. Griesbecket al.,
“Reducing the environmental sensitivity of yellow fluorescent protein,”
J. Biol. Chem., 276 29188
–29194
(2001). http://dx.doi.org/10.1074/jbc.M102815200 JBCHA3 0021-9258 Google Scholar
G. S. Bairdet al.,
“Circular permutation and receptor insertion within green fluorescent proteins,”
Proc. Natl. Acad. Sci. U. S. A., 96 11241
–11246
(1999). http://dx.doi.org/10.1073/pnas.96.20.11241 PNASA6 0027-8424 Google Scholar
Y. Yamadaet al.,
“Quantitative comparison of genetically encoded Ca indicators in cortical pyramidal cells and cerebellar Purkinje cells,”
Front. Cell. Neurosci., 5 18
(2011). http://dx.doi.org/10.3389/fncel.2011.00018 1662-5102 Google Scholar
H. Lütcke,
“Optical recording of neuronal activity with a genetically-encoded calcium indicator in anesthetized and freely moving mice,”
Front. Neural Circuits, 4 9
(2010). http://dx.doi.org/10.3389/fncir.2010.00009 FNCRA5 1662-5110 Google Scholar
D. J. Wallaceet al.,
“Single-spike detection in vitro and in vivo with a genetic Ca2+ sensor,”
Nat. Methods, 5 797
–804
(2008). http://dx.doi.org/10.1038/nmeth.1242 1548-7091 Google Scholar
B. Kuhnet al.,
“An amplified promoter system for targeted expression of calcium indicator proteins in the cerebellar cortex,”
Front. Neural Circuits, 6 49
(2012). http://dx.doi.org/10.3389/fncir.2012.00049 FNCRA5 1662-5110 Google Scholar
T. Hendelet al.,
“Fluorescence changes of genetic calcium indicators and OGB-1 correlated with neural activity and calcium in vivo and in vitro,”
J. Neurosci., 28 7399
–7411
(2008). http://dx.doi.org/10.1523/JNEUROSCI.1038-08.2008 JNRSDS 0270-6474 Google Scholar
M. Manket al.,
“A FRET-based calcium biosensor with fast signal kinetics and high fluorescence change,”
Biophys. J., 90 1790
–1796
(2006). http://dx.doi.org/10.1529/biophysj.105.073536 BIOJAU 0006-3495 Google Scholar
M. Manket al.,
“A genetically encoded calcium indicator for chronic in vivo two-photon imaging,”
Nat. Methods, 5 805
–811
(2008). http://dx.doi.org/10.1038/nmeth.1243 1548-7091 Google Scholar
T. Thestrupet al.,
“Optimized ratiometric calcium sensors for functional in vivo imaging of neurons and T lymphocytes,”
Nat. Methods, 11 175
–182
(2014). http://dx.doi.org/10.1038/nmeth.2773 1548-7091 Google Scholar
T. Maoet al.,
“Characterization and subcellular targeting of GCaMP-type genetically-encoded calcium indicators,”
PloS ONE, 3 e1796
(2008). http://dx.doi.org/10.1371/journal.pone.0001796 1932-6203 Google Scholar
J. Nakaiet al.,
“A high signal-to-noise Ca(2+) probe composed of a single green fluorescent protein,”
Nat. Biotechnol., 19 137
–141
(2001). http://dx.doi.org/10.1038/84397 NABIF9 1087-0156 Google Scholar
D. F. Reiffet al.,
“In vivo performance of genetically encoded indicators of neural activity in flies,”
J. Neurosci., 25 4766
–4778
(2005). http://dx.doi.org/10.1523/JNEUROSCI.4900-04.2005 JNRSDS 0270-6474 Google Scholar
M. Ohkuraet al.,
“Genetically encoded bright Ca2+ probe applicable for dynamic Ca2+ imaging of dendritic spines,”
Anal. Chem., 77 5861
–5869
(2005). http://dx.doi.org/10.1021/ac0506837 ANCHAM 0003-2700 Google Scholar
Y. N. Talliniet al.,
“Imaging cellular signals in the heart in vivo: Cardiac expression of the high-signal Ca2+ indicator GCaMP2,”
Proc. Natl. Acad. Sci. U. S. A., 103 4753
–4758
(2006). http://dx.doi.org/10.1073/pnas.0509378103 PNASA6 0027-8424 Google Scholar
A. Mutoet al.,
“Genetic visualization with an improved GCaMP calcium indicator reveals spatiotemporal activation of the spinal motor neurons in zebrafish,”
Proc. Natl. Acad. Sci. U. S. A., 108 5425
–5430
(2011). http://dx.doi.org/10.1073/pnas.1000887108 PNASA6 0027-8424 Google Scholar
L. Tianet al.,
“Imaging neural activity in worms, flies and mice with improved GCaMP calcium indicators,”
Nat. Methods, 6 875
–881
(2009). http://dx.doi.org/10.1038/nmeth.1398 1548-7091 Google Scholar
D. A. Dombecket al.,
“Functional imaging of hippocampal place cells at cellular resolution during virtual navigation,”
Nat. Neurosci., 13 1433
–1440
(2010). http://dx.doi.org/10.1038/nn.2648 NANEFN 1097-6256 Google Scholar
J. Akerboomet al.,
“Optimization of a GCaMP calcium indicator for neural activity imaging,”
J. Neurosci., 32 13819
–13840
(2012). http://dx.doi.org/10.1523/JNEUROSCI.2601-12.2012 JNRSDS 0270-6474 Google Scholar
A. Mutoet al.,
“Real-time visualization of neuronal activity during perception,”
Curr. Biol., 23 307
–311
(2013). http://dx.doi.org/10.1016/j.cub.2012.12.040 CUBLE2 0960-9822 Google Scholar
M. Ohkuraet al.,
“Genetically encoded green fluorescent Ca2+ indicators with improved detectability for neuronal Ca2+ signals,”
PloS ONE, 7
(12), e51286
(2012). http://dx.doi.org/10.1371/journal.pone.0051286 1932-6203 Google Scholar
I. Ozdenet al.,
“Reliable coding emerges from coactivation of climbing fibers in microbands of cerebellar Purkinje neurons,”
J. Neurosci., 29 10463
–10473
(2009). http://dx.doi.org/10.1523/JNEUROSCI.0967-09.2009 JNRSDS 0270-6474 Google Scholar
F. Najafiet al.,
“Sensory-driven enhancement of calcium signals in individual Purkinje cell dendrites of awake mice,”
Cell Rep., 6 792
–798
(2014). http://dx.doi.org/10.1016/j.celrep.2014.02.001 CREED8 2211-1247 Google Scholar
E. M. Callaway,
“A molecular and genetic arsenal for systems neuroscience,”
Trends Neurosci., 28 196
–201
(2005). http://dx.doi.org/10.1016/j.tins.2005.01.007 TNSCDR 0166-2236 Google Scholar
J. E. Rabinowitzet al.,
“Cross-packaging of a single adeno-associated virus (AAV) type 2 vector genome into multiple AAV serotypes enables transduction with broad specificity,”
J. Virol., 76 791
–801
(2002). http://dx.doi.org/10.1128/JVI.76.2.791-801.2002 JOVIAM 1070-6321 Google Scholar
J. E. Rabinowitzet al.,
“Cross-dressing the virion: the transcapsidation of adeno-associated virus serotypes functionally defines subgroups,”
J. Virol., 78 4421
–4432
(2004). http://dx.doi.org/10.1128/JVI.78.9.4421-4432.2004 JOVIAM 1070-6321 Google Scholar
J. Zabneret al.,
“Adeno-associated virus type 5 (AAV5) but not AAV2 binds to the apical surfaces of airway epithelia and facilitates gene transfer,”
J. Virol., 74 3852
–3858
(2000). http://dx.doi.org/10.1128/JVI.74.8.3852-3858.2000 JOVIAM 1070-6321 Google Scholar
B. L. Davidsonet al.,
“Recombinant adeno-associated virus type 2, 4, and 5 vectors: transduction of variant cell types and regions in the mammalian central nervous system,”
Proc. Natl. Acad. Sci. U. S. A., 97 3428
–3432
(2000). http://dx.doi.org/10.1073/pnas.97.7.3428 PNASA6 0027-8424 Google Scholar
G. C. Faaset al.,
“Calmodulin as a direct detector of Ca2+ signals,”
Nat. Neurosci., 14 301
–304
(2011). http://dx.doi.org/10.1038/nn.2746 NANEFN 1097-6256 Google Scholar
E. Dreostiet al.,
“A genetically encoded reporter of synaptic activity in vivo,”
Nat. Methods, 6 883
–889
(2009). http://dx.doi.org/10.1038/nmeth.1399 1548-7091 Google Scholar
E. GambleC. Koch,
“The dynamics of free calcium in dendritic spines in response to repetitive synaptic input,”
Science, 236 1311
–1315
(1987). http://dx.doi.org/10.1126/science.3495885 SCIEAS 0036-8075 Google Scholar
W. G. RegehrD. W. Tank,
“Calcium concentration dynamics produced by synaptic activation of CA1 hippocampal pyramidal cells,”
J. Neurosci., 12 4202
–4223
(1992). JNRSDS 0270-6474 Google Scholar
F. Helmchenet al.,
“Calcium dynamics associated with a single action potential in a CNS presynaptic terminal,”
Biophys. J., 72 1458
–1471
(1997). http://dx.doi.org/10.1016/S0006-3495(97)78792-7 BIOJAU 0006-3495 Google Scholar
S. D. BrenowitzW. G. Regehr,
“Calcium dependence of retrograde inhibition by endocannabinoids at synapses onto Purkinje cells,”
J. Neurosci., 23 6373
–6384
(2003). JNRSDS 0270-6474 Google Scholar
H. K. Oyiboet al., In Synapses: From Molecules to Circuits & Behavior, Cold Spring Harbor Laboratory, New York
(2013). Google Scholar
T. NevianF. Helmchen,
“Calcium indicator loading of neurons using single-cell electroporation,”
Pflugers Archiv., 454 675
–688
(2007). http://dx.doi.org/10.1007/s00424-007-0234-2 0365-267X Google Scholar
C. Patton, Google Scholar
BiographyAleksandra Badura is a postdoctoral fellow in the Wang Lab at Princeton University. Her two main projects encompass research on improving genetically encodable calcium indicator proteins to monitor neural activity in living brain tissue and studies on nonmotor roles for the cerebellum in cognitive processing. She received her PhD degree from Erasmus University in Rotterdam, where she studied motor performance and motor learning and specialized in single-unit electrophysiological recordings in awake mice. Xiaonan Richard Sun is a fourth-year medical student at Rutgers-Robert Wood Johnson Medical School. He received his BA degree in molecular biology and biochemistry from Rutgers University. He is a Wang Lab alumnus and received his PhD degree from Princeton University in 2013 as part of the MD/PhD program. In the Wang Lab, he engineered novel GCaMP variants with improved kinetics and affinity to calcium for monitoring neural activity in mammalian neurons. Andrea Giovannucci is a NJCBIR postdoctoral fellow in the Wang Lab at Princeton University, where he specializes in in vivo calcium imaging applied to the study of motor learning. He received his PhD degree in computer science from the Spanish National Research Council (IIIA-CSIC), where he investigated auction mechanisms and optimization. Before joining the Wang Lab he was a postdoctoral fellow at SPECS, Pompeu Fabra University, Barcelona, where he focused on computational neuroscience and neuroprosthetics. Laura A. Lynch is a research specialist and the laboratory manager in the Wang Lab at Princeton University. She received her BA degree from the University of Pennsylvania and her MS and PhD degrees from Rutgers University. In the Wang Lab, she manages the laboratory and provides key support on a variety of projects including probe design. She is also responsible for the maintenance of several transgenic mouse lines representing mouse models of autism. Samuel S.-H. Wang is an associate professor of neuroscience at Princeton University. Before becoming a professor, he studied at Caltech, Stanford, and Bell Labs. His research primarily concerns the application of advanced optical methods to the study of brain circuits. He studies the cerebellum’s role in nonmotor functions and is using neural imaging of this part of the brain to search for clues to the causes of autism, a major concern of his laboratory. |
||||||||||||||||||||||||||||||||||||||||||||||||||


