
|
|
1.IntroductionElucidating the mechanisms underlying physiological and pathophysiological cellular processes requires the possibility to quantitatively and noninvasively observe cell structure and dynamics down to cellular and subcellular levels.1 In addition, cell processes are usually multifaceted and cannot be efficiently grasped with techniques providing a view of a single aspect. Thus, the development of high resolution imaging approaches providing simultaneous measurements of multiple relevant biophysical cell parameters is a prerequisite to dissect complex cellular processes. Considering that most biological cells are transparent, i.e., they differ only slightly from their surroundings in terms of optical properties (including absorbance, reflectance, etc.), it is obvious that obtaining a comprehensive understanding of cellular physiological and pathophysiological processes with optical approaches remains a difficult challenge. Consequently, a wide range of optical approaches have been developed in cell biology.2 Specifically, the development of both new modes of contrast generation and new forms of high resolution microcopy techniques which allow us to break the so-called “diffraction limit” of resolution, which limits the smallest observable details in the image to around 200–500 nm, represent a very active area of research in the field of cell biology.3 In contrast to fluorescence microscopy, which today represents a powerful and widely used cell imaging technique,4 contrast-generating modes, based on wavefront phase information, represent an intrinsic contrast of transparent specimens, which have already in the mid-20th century demonstrated their relevance for noninvasive visualization of cell structure, in particular because the Zernicke’s invention of phase contrast (PhC)5 and the DIC techniques developed by Smith6 and Nomarski.7 Currently, PhC and Normarski’s differential interference contrast (DIC) are widely used contrast-generating techniques available for high-resolution light microscopy. Without using any staining, PhC and DIC allow the visualization of transparent specimens making visible, in particular, the fine subcellular structural organization. Basically, these two noninvasive contrast-generating techniques are based on their capacity for transforming in detectable intensity modulation the minute relative phase shift that a transparent microscopic object induces either between the transmitted wave light and the undeviated background wave (PhC) or between two orthogonally polarized transmitted waves (DIC). In contrast to PhC and DIC, the invention of interference microscopy with separate object and reference beams at the end of the 19th century provides a direct and quantitative measurement of the phase difference introduced by the observed object. Practically, due to the seminal work of Barer, interference microscopy applied to cell imaging has permitted the quantitative measurement of important biophysical cells parameters including dry mass8 and intracellular RI9. However, because of temporal phase shifting, interferometric techniques require very demanding and costly opto-mechanical designs and phase shifts are very sensitive to experimental artifacts and noise, only a few attempts to dynamically image live cells in biology have been reported.10,11 Nevertheless, scientific advances lowering the cost of lasers and data acquisition equipment as well as the development of computing facilities, the large spread of personal computers and digital signal processors have brought fundamentally new perspectives in the field of interferometry and holography. Consequently, during the last decades, numerous quantitative phase microscopy (QPM) techniques based on an interferometer or holographic approaches have been developed. These approaches are much simpler to implement than classical interference microscopy and provide reliable and quantitative phase mapping of the observed specimen, therefore, they have started to be efficiently used in the field of cell biology.12,13 In a first part of this review, we present the current state of the art of quantitative phase measurement based on digital holographic microscopy (DHM) with a special focus on the advantages provided by the possibility to propagate the whole object wave (amplitude and phase) diffracted by the observed specimen during the numerical reconstruction of the digitally recorded holograms. A paragraph describing quantitative phase tomographic approaches providing a full three-dimensional (3-D) image—in particular a 3-D RI distribution—of the observed specimen are also presented. In a second part, we briefly describe some relevant applications related to cell biology provided by different QPM techniques. Special attention is paid to the biological information provided by the quantitative phase signal (QPS) through the derivation of specific cell biophysical parameters. In the third part, we describe how quantitative phase (QP)-DHM and quantitative phase tomography (QPT), due to their capacity for quantitatively monitoring cell structure and dynamics through the measurements of different cell biophysical parameters, can begin to address specific questions in the field of cellular neuroscience and psychiatric research. Specifically, the possibility to noninvasively visualize spine dynamics and resolve neuronal network activity by performing a simultaneous multiple sites optical recording of transmembrane currents as well as identifying new early cell biomarkers of vulnerability, neuroprogession, and diagnosis of mental disorders are discussed. Finally, some perspectives related to the development of QPM and/or QPT in high-throughput multimodality approaches are presented. 2.Principles of Quantitative Phase Measurements Based on Digital Holographic Microscopy2.1.Digital HolographyHolography techniques were developed by Gabor in 1948 with the aim of improving the detection of spatial resolution in the X-ray wavelength by exploiting its lensless imaging capabilities. This resulted in the possibility of generating an exact replica during the illumination of the recorded hologram (reconstruction process) with a specific magnification of the full object wavefront created by the observed specimen.14 The use of digital means in holography gradually occurred at the end of the 1960s, when Goodman used a vidicon detector to encode a hologram which could be reconstructed on a computer.15 However, the interest in digital holography rose with the availability of cheaper digital detectors and charge-coupled device cameras.16,17 The two practical main approaches to recover the object wave from the recorded hologram are namely temporal decoding, i.e., phase shifting and spatial decoding i.e., off-axis methods. Phase-shifting reconstruction methods are based on the combination of several frames, and enable the suppression of the zero order and one of the cross terms through temporal sampling.18,19 The most well-known phase-shifting algorithm, proposed by Yamaguchi,20 is based on the recording of four frames separated by a phase shift of a quarter of a wavelength. Various combinations of frames derived from interferometry have been considered19,21 and many different approaches have been developed to produce the phase shift including high precision piezo-electric transducers, which move a mirror in the reference wave or acousto-optics modulators using the light frequency shift, etc. One of the main issues in phase-shifting methods is the requirement of several frames for reconstruction in interferometric setups, which are commonly very sensitive to vibrations. Thus, it could be difficult to ensure stable phase shifts and an invariant sample state during acquisition. In addition, the requirements on the accuracy of the phase shifts are rather high in regard to displacements on the order of magnitude of hundreds of nanometers, implying the use of high-precision transducers. Consequently, several attempts were made to either reduce the required number of frames for reconstruction, which led to two-frame reconstruction,22,23 or to simultaneously enable the recoding of the various phase-shift frames, by employing, for example, multiplexing methods.24 On the other hand, more refined algorithms were developed to relax the accuracy requirements of phase-shift methods.25–27 It should also be mentioned that the development of a fast temporal phase-shifting procedure within the framework of tomography28 as well as approaches based on the spatial analysis of fringe pattern,29,30 sometimes referred as spatial phase shifting, has permitted to successfully reconstruct the object wave in an off-axis configuration.31,32 The second main approach for recovering the object wave is based on an off-axis configuration, so that the different diffraction terms encoded in the hologram (zero-order wave, real and virtual images) are propagating in different directions, enabling their separation for reconstruction.33 This configuration was the one employed for the first demonstration of a fully numerical recording and reconstruction holography.16,17 In practice, reconstruction methods based on an off-axis configuration usually rely on Fourier methods to filter one of the diffraction terms. This concept was first proposed by Takeda et al.34 in the context of interferometric topography. The method was later extended for smooth topographic measurements for phase recovery35 and generalized for use in DHM with amplitude and phase recovery.36 As discussed in the following paragraphs, the main characteristic of this approach is its capability for recovering the complex object wave through only one acquisition, thus greatly reducing the influence of vibrations. However, as the diffraction terms are spatially encoded in the hologram, this one shot capability potentially comes at the cost of the usable bandwidth. In addition, the frequency modulation, induced by the angle between the reference and the object wave, has to guarantee the separability of the information contained in the different diffraction terms that are encoded in the hologram while carrying a frequency compatible with the sampling capacity of the digital detectors. 2.2.Quantitative Phase Digital Holographic MicroscopyA digital holographic microscope37 comprises both an optical setup devoted to hologram formation and software specially developed to numerically process the digitized hologram. The hologram results from the interference of the object beam with a reference wave that can be kept separate from the object beam. The goal is to precisely estimate the propagated wavefront corresponding to either the virtual or the real image of the specimen. Different optical setups have been proposed to perform microscopy with holography. Some lensless setups have been proposed to image small fields38–40 by using strongly diverging wavefields, such as spherical waves emitted by punctual sources. Optical setups that make use of a microscope objective (MO) offer the largest numerical apertures.36,41 A typical DHM arrangement we have developed and used to explore transparent specimens including living cells, is the quantitative monitoring of the phase retardation of the transmitted wavefront [Fig. 1(a)].41 Fig. 1(a) Transmission optical setup for QP-DHM (b) role of the microscope objective (MO): magnifying the image of the specimen but also, in terms of wavevectors, decreasing the lateral wavevector component or by a factor proportional to the magnification (M) of the MO, so that the hologram can be sampled by an electronic camera according to the Shannon’s rules (c,d) three-dimensional (3-D) perspective images in false colors of a living human red blood cell (RBC) and a mouse cortical neuron in culture, respectively. Each pixel represents a quantitative measurement of the phase retardation or cellular optical path length (OPL) induced by the cell with a sensitivity corresponding to a few tens of nanometers. By taking into account the measured mean values of the RBC and neuronal cell body refractive indices (RIs) resulting from the decoupling procedure (cf. below), scales (at right), which relate OPL (deg) to morphology in the -axis (), can be constructed. Abbreviations: BS, beam splitter; CCD, camera; M1 and M2, mirrors; MO, microscope objective; O, object beam; R, reference beam; RL, reference lens and OC, object condenser; object or specimen. 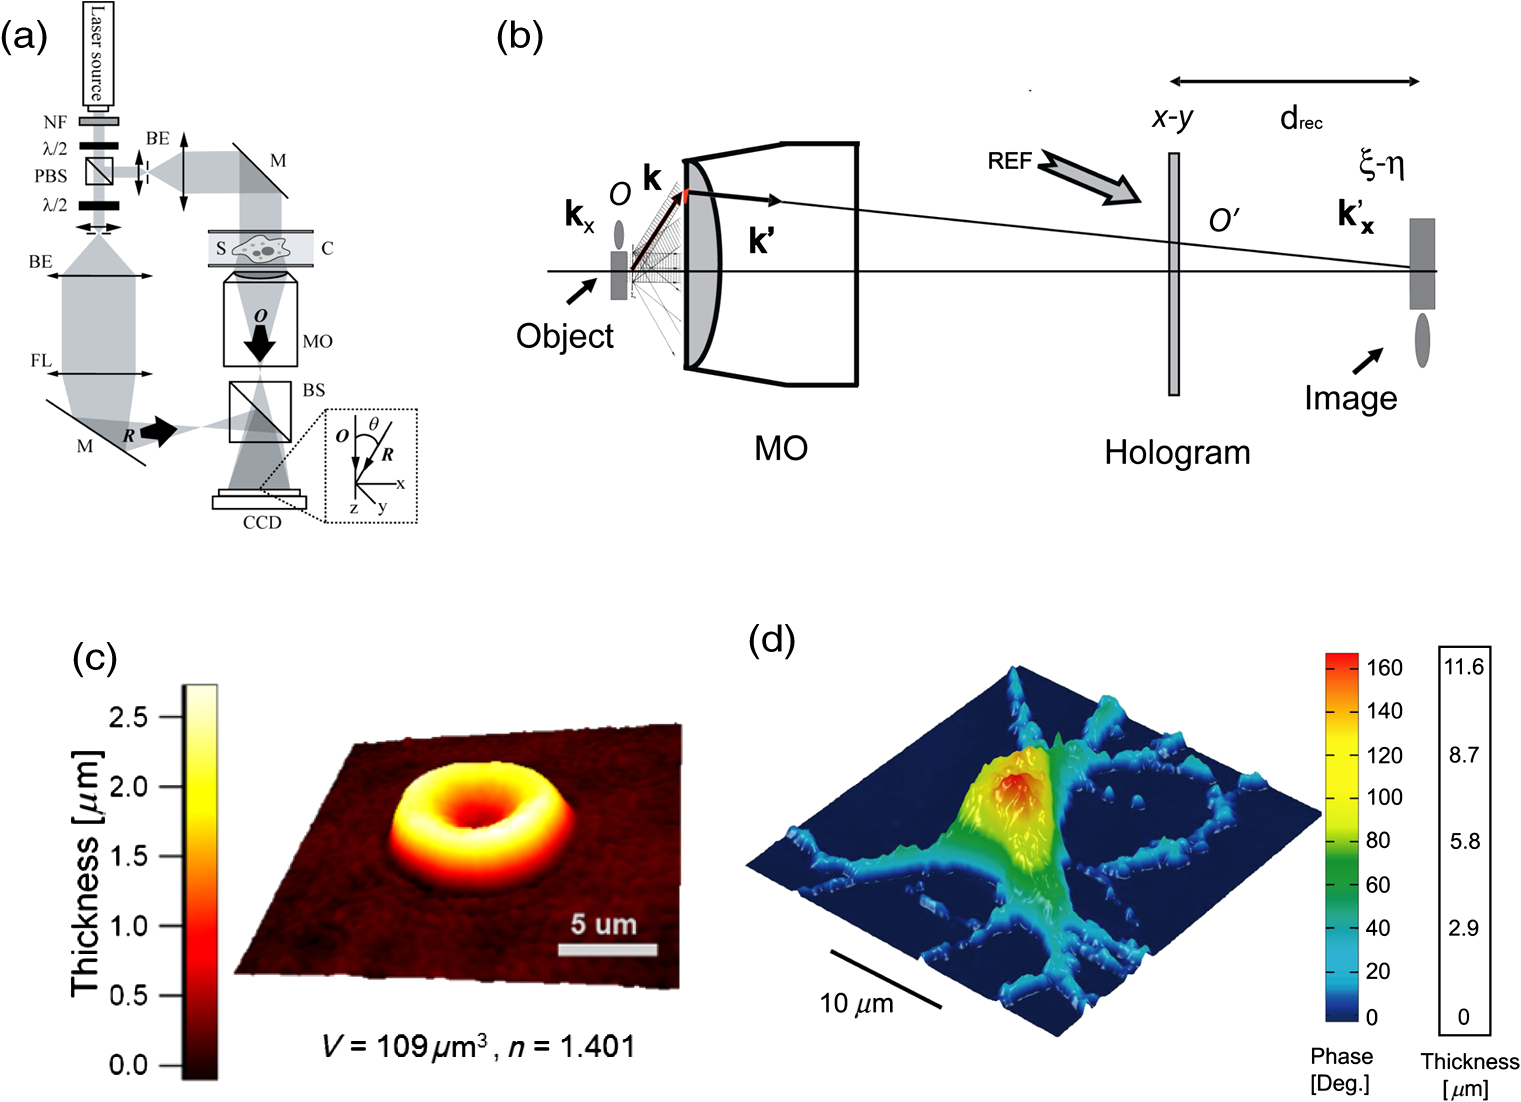 Other configurations are possible depending on the targeted application,12,42 but will not be reviewed in detail here. An important issue is the need for a reference beam that is controllable in both in intensity and polarization, thus enabling one to improve contrast and signal. The holographic principle also permits other valuable concepts which particularly building on the possibility of superimposing several holograms. Holograms with several reference waves corresponding to several polarization states can be generated in order to analyze the birefringence properties of specimens including strained dielectrics or biological molecules.43,44 Reference waves corresponding to different wavelengths can also be generated, permitting the use of synthetic wavelengths from a single hologram.45 As in other developments in digital holography, the hologram reconstruction method in DHM is based on the theory of diffraction. When an MO is used and the specimen can be maintained in the MO’s focal plane, the image is formed at infinity. The hologram at infinity is simply the Fourier transform of the specimen. Inverse Fourier transformation straightforwardly provides the reconstructed wavefront in the focal plane of the MO. However, specimens are generally not fully contained in the focal plane of the MO, and thus a real and/or virtual image is formed at a finite distance from the MO [Fig. 1(b)]. Intercepting the wavefront at a finite distance from the specimen image gives rise to holograms in the Fresnel zone. Thus, the Huygens-Fresnel expression of diffraction can be used to calculate the propagation of the reconstructed wave. It should be noted that the MO introduced in the interferometer allows one to adapt the wavefield to the sampling capacity of the camera. Indeed, the lateral components of the wavevector or can be divided by the magnification factor M of the MO. Taking advantage of a full digital approach, a computer can perform the reconstruction by simulating the reference wave and multiplying it by the hologram intensity distribution. Then, the distribution of the wavefront in space is obtained by simulating the propagation of the wavefront reconstructed in the plane of the hologram. As previously mentioned, the wavefront gives rise to several propagated beams corresponding to the zero, and diffracted orders. When an MO is used, the latter two orders give rise to real and virtual images, respectively, that appear as twin images which are the reflection of one another on a virtual mirror that takes the place of the hologram plane. The off-axis geometry introduces a spatial carrier frequency, and demodulation restores the full spatial frequency content of the wavefront. The main advantage of this approach is that all the information for reconstructing the complex wavefield comes from a single hologram.36 In microscopy, the full bandwidth of the beam delivered by the MO can be acquired without limitation. Scale adjustments can made to preserve the correct sampling of the MO’s full bandwidth so that no loss of resolution is conceded. Finally, selection of a signal corresponding to a diffraction order of in the Fourier domain of the hologram allows for the full restoration of the object wavefront transmitted by the MO. Therefore, reconstructing the wavefront in 3-D is simply done by propagating the wavefront generated in the hologram plane to the image plane , which is situated at a distance . This could be efficiently achieved by computing the Fresnel transform of the wavefield. Thus, DHM brings quantitative data simultaneously derived from the amplitude and the phase of the complex reconstructed wavefront that is diffracted by the object. Our method requires the adjustment of several reconstruction parameters, which can be done using a computer-aided method we developed. Some image processing is also needed to improve the accuracy of the reconstructed phase.46 Moreover any type of aberrations can also be corrected during such a numerical reconstruction process.47,48 Using a high numerical aperture, submicron transverse resolution has been achieved to a 300-nm lateral resolution. Accuracies of approximately 0.1° have been estimated for phase measurements. In reflection geometry, this corresponds to a vertical resolution of less than 1 nm at a wavelength of 632 nm.49 In transmission geometry, the resolution is limited to a few nanometers as far as living cells are concerned. It is also worthwhile to note that when the experimental configuration of the hologram recording requires distances of reconstruction for which the Fresnel approximation does not properly work, the propagation of the wavefront generated by the hologram can be efficiently performed with the angular spectrum approach.50,51 On the other hand, the characterization of the effect of noise on the formation of the hologram and on the reconstruction of the image results in an improved signal-to-noise ratio (SNR), using the coherent detection of scattered light.52,53 This improvement is often described as “coherent amplification” of the signal. 2.3.Quantitative Phase Tomographic Microscopy: Full Three-Dimensional Imaging TechniqueIn general, a single wavefront determination obtained from a single hologram is not sufficient to obtain a full 3-D image of an object. An exception concerns sparse media, similar to those found in particle image velocimetry (PIV), where each particle can be considered as an isolated punctual object and its position determined in 3-D by the methods of “in-line” holography.54,55 Thus, the combination of data reconstructed from several holograms, obtained at either several wavelengths (variable -vector amplitude) or at several incidence angles (variable -vector direction), is needed to achieve true 3-D imaging. Several articles report results obtained by changing the wavelength (variable -vector amplitude) as shown by Marron.56 However, in this study, the range of the wavelength scan remained very small and consequently the resolution was weak. Arons et al. using “Fourier synthesis holography”57 have also discussed a similar approach. In digital holography, multiple wavelengths have been used to reconstruct 3-D structures.58 In the field of microscopy, such multiwavelength tomographic imaging techniques, based on reconstruction from multiple holograms, have yielded very accurate images of cells, erythrocytes in particular.59,60 An alternative, but somehow similar approach, is to use a wide bandwidth source and form a hologram in the plane where the mutual coherence between the object and reference wave is nonzero: this concept introduces coherence gating in the space domain. It has been proven to perform well.61,62 On the other hand, the variable -vector direction approach more exactly meets the concept found in the literature under the name of “diffraction tomography”63 for reconstruction of the scattering potential associated with the structure of the diffracting object. A diffracted wave can be collected and reconstructed from the holograms at various incidences. Practically, the phase and amplitude of the diffracted wave are directly reconstructed from the hologram and can be used to compute the scattering potential at every point of the specimen. From these data, the 3-D distribution of the RI can be established providing a 3-D tomographic image of the cell constituents. Tomography of cells based on DHM is new and original. In 2006, a first approach consisting of the rotation of the specimen,64,65 has been developed. It was demonstrated that the RI of the cell body could be measured in 3-D with a spatial resolution better than in all directions. Other approaches consisting of rotating the beam rather than the object have been proposed.28,66–69 Kou70 and Sheppard71 have compared both approaches in their principles and shown consistent differences in the performance of each modality. Different reconstruction algorithms have been used to reconstruct objects from several holograms obtained at variable -vector directions or amplitudes including projection28,64 and diffraction algorithms.72–74 3.Cell Imaging with Quantitative Phase MicroscopyBiological specimens, such as living cells and tissues, are usually phase objects, that is they are transparent and made visible most often by PhC as explained above. The phase signal originates in the RI difference generated by the presence of organic molecules in cells, including proteins, DNA, organelles, and nuclei. Consequently, QPM visualizes cells by quantitatively providing the phase retardation that they induce on the transmitted wavefront.41 3-D perspective images of such a phase retardation corresponding to a living human red blood cell and a mouse cortical neuron in culture are shown in Figs. 1(c) and 1(d), respectively. This QPS signal is given by the following equation: where is the cellular thickness, is the intracellular RI averaged over the optical path length of optical rays crossing the specimen, and is the RI of the surrounding medium. The cellular quantitative phase contrast results from the fact that the intracellular RI is different from the RI of the perfusion solution .3.1.Cell Counting, Classification Analysis, and Cytotoxic Screening AssayPractically, the QPS is particularly well suited to the development of algorithms, allowing automated cell counting,75–79 recognition, and classification.80–89 As far as red blood cells (RBCs) are concerned, QPM allows one to achieve a morphometry-based RBCs’ analysis. Indeed, the intracellular content of mature nucleus-and organelle-free RBCs, which can be assimilated from an optical point of view to a homogeneous solution mainly containing hemoglobin, induces a quantitative phase shift directly proportional to the RBC thickness.78,85,87,88,90–96 Since the QPS is also sensitive to intracellular RI, it specifically provides some information about the intracellular content. Based on this information, interesting applications allowing discrimination between physiological and pathophysiological states have been achieved, particularly in the fields of assisted reproduction86,97,98 and cancer research.99–102 In addition, in vitro label-free cytotoxicity screening assays based on QP-DHM have been recently validated due to the flexibility offered by numerical reconstruction.103–106 3.2.Exploration of Cell Movements and DynamicsQPM approaches as nonscanning techniques are usually well suited to monitor dynamic cell processes. Dynamic motions during the migrations of human dendritic cells107 and subcellular contraction of embryonic cardiomyocytes108,109 have been successfully measured. On the other hand, due to the numerical propagation of the reconstructed object wavefront, QP-DHM allowing, one to apply autofocusing32,110,111–114,115 and extended depth of focus116–122 has opened the possibility of efficiently monitoring cell migration in 3-D.110,112,123–130 In addition, these numerical possibilities offer an alternative to the shallow depth of field of conventional microscopy, which hampers any fast 3-D tracking of cells in their environment specifically when microfluidic devices are considered.131,132 Coherently, autofocusing and extended depth of focus abilities also facilitate the 3-D tracking of micro- or nano-particles,126,133–135 particularly in combination with approaches capable of second harmonic generation,136,137 the use of which is highly promising in medical fields including drug carrier, tumor detection and treatment, gene therapy. 3.3.Dry Mass, Cell Growth, and Cell CycleAs described by Eq. (1), the measured quantitative phase shift induced by an observed cell on the transmitted light wavefront is proportional to the intracellular RI, which mainly depends on protein content. Therefore, this measure can be used to directly monitor protein production, owing to a relation established more than 50 years ago by Barer.8 Practically, the phase shift induced by a cell is related to its dry mass (DM) by the following equation (converted to the International System of Units): where is the mean phase shift induced by the whole cell, is the wavelength of the illuminating light source, is the projected cell surface, and is a constant known as the specific refraction increment (in cubic meters per kilogram) and is related to the intracellular content. is approximated by , when considering a mixture of all the components of a typical cell.Recently, several groups using various QPM techniques have begun to exploit this phase-DM relationship to study the dynamics of cell growth as well as to the characterization of the cell cycle.138–143 As far as RBCs are concerned, this relationship has also been explicitly and implicitly used to calculate hemoglobin content, which corresponds to the RBC DM.92,144–147 3.4.Cell Membrane Fluctuations and Biomechanical PropertiesRBCs, while being carried throughout the vascular tree to deliver oxygen from the lungs to the tissues, are squeezed as they pass capillaries which are often smaller than the cell diameter. This ability can be attributed to the remarkable elastic properties of the membrane structure. As a consequence of these elastic properties, RBCs show cell membrane fluctuations (CMFs) at the nanometric scale, often called flickering. Owing to their high sensitivity allowing one to quantitatively measure RBC membrane fluctuations over the whole cell surface, different QPM techniques have shed new light on these CMFs by providing quantitative information about the biomechanical properties of the RBC membrane.145,148–153 We should also mention the integration of QPM with optical tweezers, which represents a very promising tool, especially with respect to monitoring trapped objects along the axial direction including nanoparticles,154,155 as well as manipulating and testing the biomechanical properties of cells).81,156–160 3.5.Dynamics of Absolute Cell Volume and Transmembrane Water MovementsMembranes of animal cells are highly permeable to water; therefore, movement of water across membranes is dictated in large part by osmotic pressure gradients.161,162 Any imbalance in intracellular and extracellular osmolarity is paralleled by water movements across cell membranes affecting the cell volume along with the concentration of intracellular compounds.163 However, even at constant extracellular osmolarity, the volume constancy of any mammalian cell is permanently challenged by the normal activity of the cells.164 Thus, the maintenance of a constant volume is critical for cell homeostasis and requires the continued operation of cell volume regulatory mechanisms.161 Water crosses cell membranes through several routes (simple diffusion through the lipid bilayer, transmembrane proteins such as specialized water channels, aquaporins, etc.).162 Consequently, the accurate measurement of both the absolute cell volume and water membrane permeability represents indices which can provide highly relevant information about the mechanisms involved in the cell volume regulatory processes. However, the noninvasive measurement of these two parameters at the single cell level is not a trivial issue.165 Below, we present how these parameters can be calculated from the QPS although, as indicated by Eq. (1), information concerning the intracellular content related to is intrinsically mixed with morphological information relating to a thickness . Practically, different strategies have been developed to separately measure cell morphology and RI. Some authors166,167 measured the intracellular RI by trapping cells between two cover slips separated by a known distance. However, this approach which prevents cell movement, precludes the possibility of exploring dynamic cellular processes, including cell volume regulation. Recently, spectroscopy phase microscopy approaches145,147,168 have addressed this limitation, at least as far as cells with high intrinsic dispersion properties are considered, including red blood cells (owing to presence of hemoglobin pigment). However, such spectroscopy approaches are only applicable to a very limited variety of cell types, most of which have intrinsic dispersion almost identical to that of water. We have developed another approach called the decoupling procedure, to separately measure the parameters and from the phase signal , based on a modification of the extracellular RI, . Basically, this method consists of performing a slight alteration of the extracellular RI and recording two holograms corresponding to the two different values of , providing two quantitative phase images from which and can be calculated. We have considered two different approaches to modify : the first approach requires sequentially perfusing a standard cell perfusion solution and a second solution with a different RI, but with the same osmolarity to record the two corresponding holograms at a single wavelength.169 Practically, this procedure has permitted us to quantitatively measure some highly relevant RBC parameters, including mean corpuscular volume and mean corpuscular hemoglobin concentration.92 However, owing to the solution exchange time, this approach precludes the possibility of monitoring dynamic changes of cell morphology and RI that occur during fast biological processes. To overcome these drawbacks, we have developed a second approach based on a dual-wavelength DHM (DW-DHM)45 which exploits the dispersion of the extracellular medium, enhanced by the utilization of an extracellular dye, to achieve separate measurements of the intracellular RI and the absolute cell volume in real time.170 These approaches have been successfully applied to study the osmotic water membrane permeability —representing the water volume flux per unit of time per unit of membrane surface for a given applied osmotic gradient—by monitoring cell volume changes while retaining the cell functionality.165 In addition, resulting from the linear relationship between the intracellular RI and the DM as well as from a DM balance equation, it has been possible to determine the RI of the transmembrane flux .165 The high precision with which can be determined reveals if the transmembrane water flux is accompanied by solute transport and provides some important information about the underlying mechanisms involved in the transmembrane water movements. 4.Resolving Neuronal Network Activity and Visualizing Spine Dynamics4.1.BackgroundWithin the brain, water is distributed between blood, cerebrospinal fluid, and interstitial and intracellular compartments. Practically, water moves across these compartments following the differences in osmotic and hydrostatic pressures. At constant hydrostatic pressure gradients, water movements largely depend on the osmotic gradients, which are created by the concentration of osmolytes, including ions, amino acids, and derivatives, in particular, some neurotransmitters, in the extracellular and intracellular compartments. At the microscopic level, water transport is involved in cell volume regulation and in controlling the dimensions of the extracellular space (ECS).171,172 However, neuronal activity challenges the hemostasis of these intra and extra cellular compartments. Indeed, considering a low intracellular concentration of , resulting from both a neuronal membrane with a low permeability to and sodium-potassium transporters continuously pumping out , if the conductances suddenly increase it will cause to rush into the neuronal cell. This movement of ions along their concentration gradient is also enhanced by the transmembrane electrostatic gradient corresponding to a negative resting membrane potential () mainly due to a large quantity of negatively charged intracellular proteins. This inward flow of ions changes the electrochemical gradient, which in turn produces a further rise in the membrane potential called a depolarization. This mechanism is precisely what initiates the action potential. Otherwise, the currents flowing inward at a point on the axon during an action potential spread out along the axon and depolarize the adjacent sections of its membrane. When actions potentials are conducted down an axon—their size remains undiminished as they travel— they finally induces a depolarization in a presynaptic terminal button, which is the end of axonal branches which generally face the postsynaptic membrane of the neuron that receives the message. The two membranes face each other across the synaptic cleft which is a gap of around 20-nm wide. Practically, when the depolarization reaches the terminal button, small vesicles containing molecules of the neurotransmitter and located just inside the presynaptic membrane, fuse with the membrane and then break down, spilling their contents into the synaptic cleft. Then, the neurotransmitter diffuses across the synaptic clef and by attaching postsynaptic membrane opens neurotransmitter–receptor ion channels, which permit the passage of specific ions into or out the cell, thus changing the local membrane potential of the postsynaptic neuron, which could, in turn, induces or inhibits the generation of action potentials.173 Consequently, these transmembrane ions movements and neurotransmitter releases including glutamate, glycine, and GABA (gamma-aminobutyric acid) related to the neuronal activity are accompanied by transmembrane water movements for osmotic reasons. This results in the regulation of both the ECS and the cell volume being affected by the level of neural activity. On the other hand, a distinct feature of nervous tissue is the intricate network of synaptic connections among neurons with diverse morphologies. Although initial connections are formed largely through molecular mechanisms, it has been clearly established that electrical activities influence not only the structure and efficacy of existing synapses, but can also contribute to the production of new synapses, in particular through changes in the size and shape of dendritic spines and the formation on new ones. Indeed, synapses can mainly occur in three places of the postsynpatic neuron: on the soma, on other axons, and on the smooth surface of dendrites—branched projections which compose most of the receptive surface of a neuron- or on dendritic spines—small membranous protrusions, with typical sizes of a few hundred nanometers, that stud the dendrites. The axodendritic synapses represent the largest proportion of the excitatory synapses in the mammalian brain and the glutamate is the most common excitatory neurotransmitter, inducing a depolarization of the postsynaptic neurons particularly by opening the (NMDA), the 2-amino-3-(3-hydroxy-5-methylisoxazole-4-yl) propionate (AMPA), and the kainate ionotropic receptors, representing the three main classes of glutamate-receptor ion channels. All these abilities of synapses to strengthen, weaken or to be created over time in response to increases or decreases to the neuronal network activity, called synaptic plasticity, that have been intensively studied in recent years, have been significantly stimulated by the development of new optical methods, which have permitted the resolution of the morphology and the dynamics of dendritic spines.174 Furthermore, plasticity mechanisms affect information transfer on multiple time scales and levels of specificity and play a pivotal role in integrative function and learning. However, with a few exceptions, including activity-induced LTP and LTD (long-term potentiation and long-term depression) and some specific activity-dependent mechanisms that can modulate the density of dendritic spines onto which the majority of fast excitatory synaptic transmission operates, our understanding of how electrical activity affects the structure and function of neuronal networks is very limited. Within this framework, the development of techniques that provide a noninvasive resolution of both local neuronal network activity and dendritic spine dynamics is highly relevant. In light of this, we present how QP-DHM can start to originally address both of these issues due to the possibilities of high resolution and of monitoring cell volume and transmembrane water. 4.2.Imaging Neuronal Activity by Measuring Transmembrane Water Movements with Quantitative Phase Digital Holographic MicroscopyWith respect to the study of neuronal activity, electrophysiological approaches, in particular patch-clamp techniques, have permitted major breakthroughs leading, in particular, to the discovery of LTP and LTD, by setting a voltage across the neuronal membrane and directly measuring the current flowing through a single ion channel. Basically, a patch clamp is the best standard for assessing ion channel function because it allows the discrimination of ionic currents in the femto-ampere (10–15 fA) range with microsecond time resolution. Practically, the most commonly used patch-clamp mode is the whole-cell mode. In short, in this configuration, an open tip thin glass micropipette, which contains both an ionic solution mimicking the intracellular solution and chlorided silver electrode connected to a highly sensitive electronic amplifier, is pressed against a cell membrane. A brief strong suction is applied to both assist in the formation of a high-resistance seal between the glass and the cell membrane and to disrupt the membrane patch. The interior of the pipette becomes continuous with the cytoplasm and a bath electrode is used to set the zero level. In whole-cell measurements, the two main configurations are the (1) voltage-clamp mode and the (2) current-clamp mode. In the voltage-clamp mode, the cell membrane potential is kept constant via a negative feedback loop injecting a compensating current into the cell that resembles the current that is flowing through the whole-cell membrane. Practically, the recording of this compensating current provides information about the whole-cell membrane conductance. In addition, the current-voltage relationships can be investigated since the membrane potential can be manipulated independently of ionic currents. In contrast, in the current-clamp mode, the injected current is kept constant and changes in the membrane potential can be measured. However, a patch clamp is still a highly invasive laborious process requiring precise micromanipulations and a high degree of operations, which generally impose the recording of voltages on a limited number of cells that form a neuronal network. Optical techniques, however, seem to be an ideal solution for measuring membrane potentials since they are relatively noninvasive and could work both at low and high magnifications. For instance, calcium indicators used in combination with high resolution two-photon microscopy allow the performing measurements of the spiking activity from hundreds to several thousand neurons in mammalian circuits while still keeping track of the activity of each neuron individually.175,176 However, calcium imaging has its shortcomings and cannot substitute for voltage imaging.176 Practically, voltage imaging methods have lagged behind calcium imaging due to important challenges related to physical constraints of the measurements themselves, including an electrical field highly located in the thin membrane region, an essentially two-dimension plasma membrane which cannot contain an arbitrary number of voltage chromophores without disrupting its properties, as well as the fact that the plasma membrane represents only a small proportion of the total membrane surface in the neuron on which the chromophores are attached. Finally, the relatively high speed of the electrical responses of mammalian neurons also represents a serious challenge for voltage measurements. Consequently, despite some promising perspectives, the different voltage imaging methods suffer from poor SNR and secondary side effects, and they have up to now fallen short of providing single-cell resolution when imaging the activity of neuronal populations.176 Otherwise, it is well known that neuronal activity induces modifications of the intrinsic optical properties at the subcellular,177–180 cellular181,182 and tissue level.183–185 Consequently, we have attempted to establish an accurate relationship between QPS and the transmembrane current. Practically, we set out experiments combining electrophysiology in a whole-cell configuration and QP-DHM, performed in a well-established biological model involving conductance, a human embryonic kidney (HEK) cell line, and transfected to express the neuronal ligand-gated chloride ion channel called , the acronym of its endogenous ligand, the gamma-aminobutyric acid which is an inhibitory neurotransmitter. These experiments have stressed the fact that a net ionic influx corresponds to a phase decrease due to the osmotic water entry while a net ionic efflux induces a phase increase reflecting the osmotic exit of water. Under the following two assumptions—(1) the value linearly depends on the concentration of the different intracellular components according to the seminal work of Davies and Wilkins186 and (2) the volume variations induced by the transmembrane water movements accompanying the ionic movements are proportional to the number of ions having passed through the membrane or channels—it has been possible to establish the following relation between the QP signal and transmembrane current where is the cell volume measured at the beginning of the experiments at a time , are the nonelectrogenic volume changes corresponding to any cell volume variation except those directly related to a transmembrane net current, is a constant representing the volume variation associated with the net charge movement through the cell membrane , is a parameter related to the cell deformation associated with the volume variation and the parameter which takes cell processes inducing volume variations or not but leading to intracellular RI changes by mechanisms other than dilution or concentration of the intracellular content by ions and water fluxes.187 Practically, with and correspond to isotropic volume changes and piston-like cell movements in the direction, i.e., along the optical axis, respectively. Usually, the adhesion of cultured cells on a coverslip facilitates a movement along the -axis resulting in typically. In contrast, the case corresponds to a simple dilution or concentration of the cell content, while reflects modification of intracellular RI by processes mediating the release or cellular internalization of substrates, including protein release mechanisms or cotransport activation involved in the volume regulatory processes. Practically, the parameters , , and can be determined by the decoupling procedure. Consequently, two parameters remains to be determined, namely and , to calculate the current.Experiments with HEK cells have validated Eq. (3) regarding Cl- currents mediated by GABA applications [Fig 2(a1)] with lies within the range of , and have permitted us to construct a phase response as a function of the clamped membrane potential ( curve) allowing the determination of the equilibrium potential for with the same precision as an electrophysiological approach measuring the classical I/V curves [Fig. 2(a2)].187 Practically, has been estimated for a membrane potential clamped at by performing a least-squares fit to adjust the phase current (Pred. Curr.) derived from Eq. (3) with the measured current (electrophysiological recordings in a voltage-clamp mode). Using this determination, Pred. Curr. has been calculated for other values of the membrane potential by using Eq. (3) [Fig. 2(a1)]. Fig. 2(A) HEK cells and GABA applications, (B) neurons in response to glutamate. (a1): (left) Example of three simultaneous traces of current (gray line) and phase shift (black line) recorded with 44 mM of on the same after application of GABA (; 30 s; dot). At , application of GABA triggered an inward current concomitantly to an increase in the phase signal. Conversely, at , the same applications of GABA triggered an outward current accompanied by a decrease of the phase signal. Note that for (close to the resting potential for Cl), the current and the phase shift were very small. (a1) (right) Expansion of traces visualized in a1 (parts defined by rectangles). For each level of membrane potential, the peak of phase shift (indicated by the arrow head) was reached when the was terminated. According to Eq. (3) the phase signal can predict the current (Pred. Curr.: dashed line) superimposed on the recorded current: (a2) The curve (full square and thick line) and the I/V curve (empty circle and thin line) obtained with GABA () indicated an of and , respectively. (a2) inset representative quantitative phase image of patched a Hek cell. (b1): Local application of glutamate (500 μM, 200 ms; arrow head) on a patched neuron induces a strong transient decrease of the phase signal associated to an inward current. Phase is expressed in degrees (b2) application of glutamate triggers three main types of phase shifts, Left, representative quantitative phase image of three cultured cortical neurons visualized in DHM. Ovals in the middle of the cells corresponded to the region of interest for the phase signal (scale bar, 10 μm). Right, application of glutamate (30 μM, 30 s; arrowhead) triggered different types of shapes of optical signals from these three recorded neurons. (b3), averaged traces of the three characteristic optical signals induced by glutamate application (30_M, 30 s, arrowhead) and those recorded from 21–35 DIV neurons. These phase signals are classified into three categories: a biphasic response (Biph.; ), a reversible decrease of the phase signal (RD, ), and an irreversible decrease of the phase signal (ID, ). All these experiments were performed at room temperature.  Subsequently, Eq. (3) has been used to optically monitor neuronal network activity mediated by glutamate application, the main excitatory neurotransmitter in the brain released at 80% of the synapses. Practically, a multimodality microscope, QP-DHM, and electrophysiology setup has been developed to study the early stage of neuronal responses induced by glutamate on primary culture of mouse cortical neurons. This study involving pharmacological experiments revealed that glutamate produces three distinct optical responses, predominantly mediated by NMDA receptors: biphasic (Biph.), reversible decrease (RD), and irreversible decrease (ID) responses [Fig. 2(b3)]. The shape and amplitude of the optical signal were not associated with a particular cellular phenotype, but reflected the physio-pathological status of neurons linked to the degree of NMDA activity. Thus, the “Biph.”, “RD,” and “ID” responses respectively indicated low-, a high-, and “excito-toxic” levels of NMDA activation. For these three distinct responses, a strong inward current associated with the early phase decrease, whose amplitude is proportional to the concentration of glutamate and to the duration of the application, has been measured. This inward current is consistent with glutamate-mediated activation of specific ionotropic receptors including the NMDA, AMPA, and the kainate ionotropic receptors, whose opening induces influxes of and down their electrochemical gradient. Consistently, the phase decrease results from water entrance accompanying the influxes of and for osmotic reasons. Moreover, furosemide and bumetanide, two inhibitors of sodium and/or potassium-coupled chloride movement, strongly modify the phase shift suggesting an involvement of two neuronal co-transporters, Na-K-Cl (NKCC1) and K-Cl (KCC2) in the genesis of the optical signal. In addition, the phase responses can be decomposed into two components, a rapid one accompanying the glutamate-mediated current ()—the phase decrease on Fig. 2(b1), and a slow one generally corresponding to a phase recovery while . The phase recovery, which is much slower than the fast one, is likely to correspond to a nonelectrogenic neuronal volume regulation involving several mechanisms. Interestingly, the time course presented in Fig. 2(b1) shows that the water movements are not significantly delayed—at the tenth of second scale at least—relative to the recorded current. The measurements of as well as the corresponding intracellular RI and neuronal volume changes allowed us to estimate the parameter “” . Practically, the values of lie within the range of equivalent to 340–620 water molecules transported per ion having crossed the membrane. Interestingly, the typical intracellular RI change induced by a glutamate pulse (500 uM 0.2 s) is around 0.002–0.003. The associated neuronal swelling is around 100 femtoliter (fL) for a typical neuronal cell body of 1500 fL corresponding to a 6–7% cell volume variation. However, these orders of magnitude correspond to an exogenous glutamate application during a few tenths of seconds. Physiological release of endogenous glutamate is likely to induce smaller water movements and intracellular RI changes. Finally, it is important to note that, although we do not yet have a comprehensive understanding of the underlying mechanisms inducing these phase responses, these consequent transmembrane movements of water accompanying the neuronal activity are in good agreement with the typical amount of water co-transported by various cotransports including NKCC1.188 Furthermore, information concerning transmembrane current obtained from electrophysiological recordings combined with QP-DHM signal allows us to pave the way for developing a simultaneous multiple sites optical recording of transmembrane currents capable of resolving local neuronal network activity. In addition, appropriate mathematical treatment of the optical signal affords the possibility to quantitatively determine the dynamics of the current triggered by the ionotropic receptor activity, making this technique amenable to use for pharmacological screenings of modulators developed for the management of human pathologies involving dysfunctions of specific ionotropic channel including chloride channels associated with cystic fibrosis.189 4.3.Three-Dimensional Visualization of Dendritic Spine Dynamics with Quantitative Phase Tomographic MicroscopyAs previously mentioned, dendritic spines are the postsynaptic components of most excitatory synapses in the mammalian brain and are the loci of structural and functional plasticity. In past decades, studies have revealed that the number and size of dendritic spines are regulated by a variety of gene products and environmental factors, underscoring the dynamic nature of spines and their importance to brain plasticity. Because dendritic spines are the key elements for information acquisition and retention, understanding how spines are formed and maintained in relation to neuronal network activity will likely provide fundamental insights into how the brain possesses the extraordinary capacity to learn and to remember.190 However, dendritic spines are tiny transparent processes whose visualization and resolution remain a challenge for optical approaches. However, the advent of two-photon (2P) excitation laser scanning microscopy, despite limitations inherent to the use of fluorescence, has greatly contributed to the understanding of dendritic spine function and plasticity.191,192 On the other hand, the diffraction tomography, which is particularly efficient when the wavelength of the irradiating beam is comparable to the dimensions of the diffracting parts of the object, represents a promising approach to dynamically and noninvasively resolve subcellular structures including dendritic spines. Indeed, appealing applications to cell biology have already been obtained and published. Practically, the investigation of the RI 3-D map has been published for pollen grains (Charrière, Marian et al. 2006), amoeba,65 human RBCs parasitized by plasmodium falciparum,193 human influenza virus infected cells, epithelial cheek cells, and granulocytes.194 Images of Hela cells at 0 deg and up to 50 deg illumination incidences have been published195 and DIC has been derived from synthetic aperture phase contrast microscopy. Interestingly, an approach based on the rotation of the sample using a hollow optical fiber as a live-cell imaging chamber has permitted one to measure the RI 3-D maps of cell clusters.196 Recently, Cotte et al. firmly established the benefit of synthetic aperture elevated to quasi by pushing the occupation of the Fourier space up to a diameter equal to the diameter of the Ewald sphere.197 Super-resolution could be obtained and details as small as 100 nm could be observed. Moreover, dynamic images showing the detailed evolution of dendrite spines (Fig. 3) could be obtained. Fig. 3Three-dimensional (3-D) representation of a tomographic image of a neuronal process obtained by synthetic aperture quantitative phase image. The details of protruding dendritic spines can be visualized. Scale is in and the color code represents the difference of refractive index (RI) [from 0.04 (red) to 0.16 (cyan)] compared with the extracellular medium (Yann Cotte). These experiments were performed at room temperature. 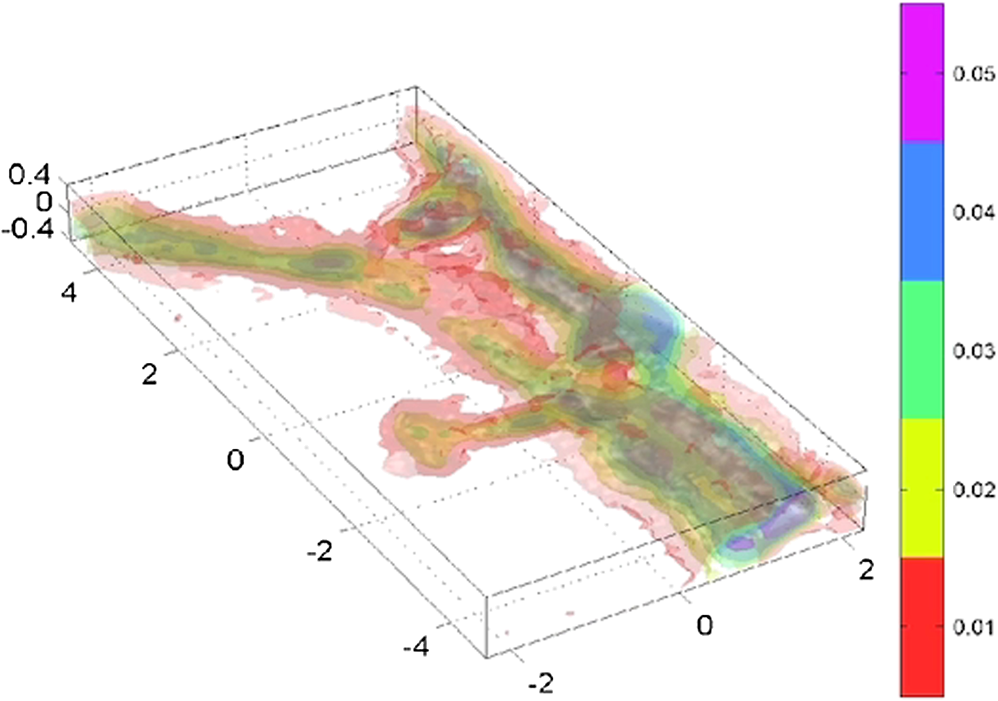 5.Quantitative Phase Digital Holographic Microscopy: Tool to Screen and Identify New Cell Biomarkers of Psychiatric Disorders5.1.BackgroundPsychiatric disorders represent major public health problems and, while significant improvements of the conditions of the patients have been achieved due to the discovery of neuroleptics and antidepressants, the available treatments remain largely insufficient and unsatisfactory. A major paradigm shift is needed to move the field forward. Advances in the field are impaired in large part due to the lack of proper tools to conduct adequate biological measurements that can guide diagnosis and treatment. This is particularly critical in light of growing evidence showing that early treatment of psychiatric disorders, already in their prodromal phase and before the onset of debilitating symptoms, leads to significantly improved clinical outcomes.198 It is therefore important to identify in children of parents affected by the disease, biomarkers or endophenotypes indicating a high risk of developing the disease later in life However, to date there are insufficient data to support any of these biomarkers as vulnerability or diagnostic or prognostic factors, notably regarding bipolar disorders.199 In this field of research, the most relevant investigations are longitudinal studies conducted on cohorts consisting of patients with a specific psychiatric disorder and their children (high-risk children). Indeed, epidemiological studies, particularly in regard to mood disorders,200,201 have clearly shown that children of patients with a psychiatric disorder usually have a significantly higher risk of developing the disease. In addition, psychiatric disorders are frequently comorbid with other mental illnesses as well as endocrine, metabolic (e.g., diabetes mellitus and obesity) and cardiovascular diseases. Thus, they must be considered as a multisystem condition, and as a consequence, their underlying neurobiological bases are complex. Coherently, only studies combining several biomarkers have been successful in separating acute mood states (mania and depression) from controls202 and providing a high accuracy for the diagnosis of major depression.203 Consequently, the determination of high risk developmental trajectories for psychiatric disorders requires to identify and to longitudinally study, in high risk children, various sets of biomarkers very diverse in nature including, e.g., neuropsychological and neuroimaging (structural and functional MRI), as well as peripheral biomarkers or cellular biomarkers. Practically, the study of cell biomarkers can be achieved from somatic cells (fibroblasts) obtained from patients as well as from high-risk children (skin biopsy). However, recent years have seen a renewed interest for the cell biomarkers due to the possibility, through induced pluripotent stem cells, to convert somatic cells (fibroblast) obtained from patients into neurons (grown in culture) with the genetic makeup necessary for the development of certain phenotypes of the disease. Although this approach currently has several limitations,204 it allows one to consider the particularly attractive hypothesis that some phenotypes are already found in vitro at the cell level or in a network of cells collected from patients or their offspring.205 Within this framework, a multimodality imaging approach developed around QP-DHM has the capacity to explore new, original optical cellular biomarkers down at the nanoscale that can then be put in contrast to other more conventional markers as mentioned above. Indeed, QP-DHM provides the unique monitoring of fine cell structure and dynamics due to its ability to yield quantitatively information on a wide variety of cellular parameters including volume, morphology, intracellular protein content, dry weight, nanoscale membrane fluctuations, membrane water permeability, transmembrane water movements, and volume regulation. The value of such an approach can be illustrated by a study we are conducting in a cohort of diabetic patients aimed at correlating energy distribution among vibrational eigenmodes of RBC membranes with the levels of glycosylated hemoglobin (Fig. 4). Fig. 4(a) Quantitative phase image of a red blood cell (RBC) in a perspective color coded representation and projections of three principal component analysis (PCA) modes of the RBC cell membrane fluctuations. (b) Degeneracy free representation of 20 PCA modes, measured experimentally. (c) Each -value (i,j) in the matrix indicates how similar the energy distributions of the PCA modes between subject and subject are. At lower -values, the energy distribution becomes more similar. Healthy (1–8) and diabetic (9–16) samples can be discriminated. 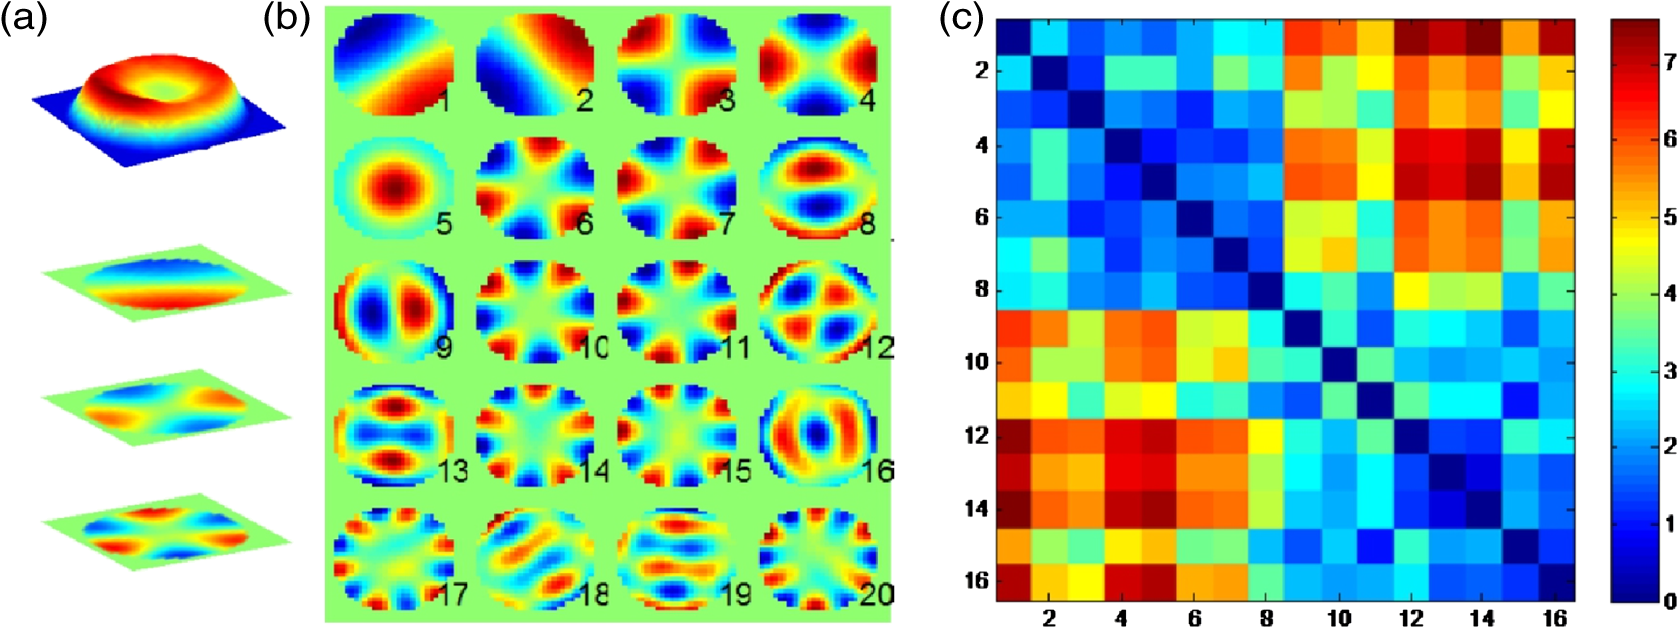 Building on these results, we are conducting a study monitoring the RBC membrane eigenmode energy distribution in a sample of the prodromal phase of first-episode psychosis patients before initial treatment, aimed at identifying specific biomarkers for early detection and intervention. 6.PerspectivesAs illustrated through these different applications, QPM and specifically DH-QPM because of the unique possibilities offered by the numerical reconstruction and propagation of the object wavefront including the extended depth of focus, a posteriori numerical autofocusing, allows one to quantitatively and noninvasively study cell structure and dynamics as well as the content at different scales of time ranging from a few milliseconds to several days. However, although QPS is highly sensitive and contains a wealth of information, its interpretation in terms of specific biological processes remains an issue. Practically, addressing this interpretation issue beyond the well-established calculation of the cell DM, involves the ability to calculate relevant biophysical cell parameters including absolute volume, membrane fluctuations at the nanoscale, biomechanical properties, transmembrane water permeability, current, and so on from the phase signal. Concretely, the derivation of these cell biophysical parameters often requires one to separately obtain cell morphology (thickness) and content (intracellular RI). Within this framework, the development of DHM-based optical diffraction tomography, providing a direct access to the 3-D map of the intracellular RI, could allow us to revisit this difficulty of interpretation. Future developments leading to the real time and high resolution 3-D maps of the intracellular RI could provide, in addition to the possibility of noninvasively resolving both neuronal network activity and dendritic spine dynamics as previously explained, valuable information about cytoachitecture and compartmentalization of cytoplasm, which plays a critical role in several fundamental cell mechanisms including proteins’ synthesis. On the other hand, information about transmembrane water movements measured with DH-QPM allows us to pave the way for studying the activity of specific ionotropic receptors and/or co-transporters including nonelectrogenic ones as well as their modulation by specific pharmacological agents. In addition, QP-DHM and QP-TM in multimodality approaches combining, e.g., fluorescence,206 spectroscopy, coherent anti-Stokes Raman scattering (CARS), second- (SHG) and third-harmonic generation (THG), should allow simultaneous measurements of a large number of relevant and specific parameters yielding an extended cell profiling approach. Specifically, SHG207 and THG208 convey highly relevant information, particularly concerning membrane proteins and intracellular constituents. Due to the highly nonlinear character of these light generating processes, local properties of the cytoskeleton and membrane as well as 3-D cellular arrangements are obtainable by taking advantage of the remarkable penetration power of the SHG or, more particularly, the THG processes. Within this framework, it is worthwhile mentioning one of the first attempts to combine Raman information with quantitative phase information paving thus the way to simultaneously explore the cell’s molecular composition and dynamics.209 Otherwise, used in conjunction with AFM, QP-DHM would provide an image of the local deformations, and, therefore, a more detailed and informative insight of biophysical properties of the cell. In addition, the use of free wandering particles would also precisely provide information on the nature of binding forces and properties of the macromolecules. This detection of multiple biophysical cell parameters could even be scaled into a high-throughput cellular screening assay105 allowing the concurrent monitoring of several cellular processes as well as their modulations as a function of the transcriptome and metabolome of different cell types derived from control patients as well as high-risk subjects. Thus, within the framework of longitudinal studies conducted on cohorts of patients and their children as previously mentioned, such high-throughput multimodality approaches would be highly promising to identify new and original early cell biomarkers or endophenotypes of mental disorders that will become invaluable tools for early diagnosis, improved stratification, a personalized medicine approach, and assessment of disease progression as well as of treatment outcome. AcknowledgmentsThe work presented in this review is the result of a close collaboration between the microvision and microdiagnosis group (SCI/STI/CHD group) of EPFL with Florian Charrière, Jonas Kühn, Nicolas Pavillon, Etienne Shafer, Fatih Toy, Yann Cotte, the Laboratory of Neuroenergetics and Cellular Dynamics, Brain and Mind Institute of EPFL with Benjamin Rappaz, Pascal Jourdain, the Center for Psychiatric neuroscience, CHUV with Daniel Boss, Kaspar Rothefusser and the company Lyncée Tec SA, Lausanne ( http://www.lynceetec.com). We thank the Swiss National Science Foundation (SNSF) Grant No. CR3213_132993 the National Center of competence in research Synapsy ( http://www.nccr-synapsy.ch/) as well as the fondation de Préfargier. ReferencesV. KumarA. K. AbbasJ. Aster, Robbins and Cotran Pathologic Basis of Disease, Elsevier Saunders, Philadelphia, PA
(2014). Google Scholar
S. InouéR. K. Spring, Video Microscopy, The Fundamentals, Plenum, New York and London
(1997). Google Scholar
R. Hanet al.,
“Recent advances in super-resolution fluorescence imaging and its applications in biology,”
J. Genet. Genomics, 40
(12), 583
–595
(2013). http://dx.doi.org/10.1016/j.jgg.2013.11.003 JGGOAB 1673-8527 Google Scholar
A. CorneaP. M. Conn, Fluorescence Microscopy: Super-Resolution and other Novel Techniques, Academic Press, USA
(2014). Google Scholar
F. Zernike,
“Phase contrast, a new method for the microsopic observation of transparent objects,”
Physica, 9 686
–698
(1942). http://dx.doi.org/10.1016/S0031-8914(42)80035-X 0031-8914 Google Scholar
F. H. Smith,
“Microscopic interferometry,”
Research, 8 385
–395
(1955). Google Scholar
G. Nomarski,
“*Dispositif Oculaire a Contraste De phase pour microscope,”
J. De Physique Et Le Radium, 11
(12), S9
–S10
(1950). JPRAAJ 0368-3842 Google Scholar
R. Barer,
“Interference microscopy and mass determination,”
Nature, 169
(4296), 366
–367
(1952). http://dx.doi.org/10.1038/169366b0 NATUAS 0028-0836 Google Scholar
R. Barer,
“Refractometry and interferometry of living cells,”
J. Opt. Soc. Am., 47
(6), 545
–556
(1957). http://dx.doi.org/10.1364/JOSA.47.000545 JOSAAH 0030-3941 Google Scholar
G. A. Dunn,
“Transmitted-light interference microscopy: a technique born before its time,”
Proc. R. Microsc. Soc., 33 189
–196
(1998). Google Scholar
G. A. DunnD. Zicha,
“Cell behaviour: adhesion and motility,”
Symp. Soc. Exp. Biol., 47 91
–106
(1993). SSEBA9 0081-1386 Google Scholar
K. Leeet al.,
“Quantitative phase imaging techniques for the study of cell pathophysiology: from principles to applications,”
Sensors, 13
(4), 4170
–4191
(2013). http://dx.doi.org/10.3390/s130404170 SNSRES 0746-9462 Google Scholar
P. MarquetC. DepeursingeP. J. Magistretti,
“Exploring neural cell dynamics with digital holographic microscopy,”
Annu. Rev. Biomed. Eng., 15 407
–431
(2013). http://dx.doi.org/10.1146/annurev-bioeng-071812-152356 ARBEF7 1523-9829 Google Scholar
D. Gabor,
“A new microscopic principle,”
Nature, 161
(4098), 777
–778
(1948). http://dx.doi.org/10.1038/161777a0 NATUAS 0028-0836 Google Scholar
J. W. GoodmanR. W. Lawrence,
“Digital image formation from electronically detected holograms,”
Appl. Phys. Lett., 11
(3), 77
–79
(1967). http://dx.doi.org/10.1063/1.1755043 APPLAB 0003-6951 Google Scholar
U. SchnarsW. Juptner,
“Direct recording of holograms by a CCD target and numerical reconstruction,”
Appl. Opt., 33
(2), 179
–181
(1994). http://dx.doi.org/10.1364/AO.33.000179 APOPAI 0003-6935 Google Scholar
O. Coquozet al.,
“Performances of endoscopic holography with a multicore optical- fiber,”
Appl. Opt., 34
(31), 7186
–7193
(1995). http://dx.doi.org/10.1364/AO.34.007186 APOPAI 0003-6935 Google Scholar
P. Rastogi, Holographic Interferometry: Principles and Methods, Springer-Verlag, New York
(1994). Google Scholar
T. Kreis, Handbook of Holographic Interferometry: Optical and Digital Methods, Wiley-VCH Verlag GmbH & Co. KGaA, Weinheim, FRG
(2005). Google Scholar
I. YamaguchiT. Zhang,
“Phase-shifting digital holography,”
Opt. Lett., 22
(16), 1268
–1270
(1997). http://dx.doi.org/10.1364/OL.22.001268 OPLEDP 0146-9592 Google Scholar
P. Carré,
“Installation et utilisation du comparateur photoélectrique et interférentiel du Bureau International des Poids et Mesures,”
Metrologia, 2
(1), 13
–33
(1966). http://dx.doi.org/10.1088/0026-1394/2/1/005 MTRGAU 0026-1394 Google Scholar
P. GuoA. J. Devaney,
“Digital microscopy using phase-shifting digital holography with two reference waves,”
Opt. Lett., 29
(8), 857
–859
(2004). http://dx.doi.org/10.1364/OL.29.000857 OPLEDP 0146-9592 Google Scholar
J. P. LiuT. C. Poon,
“Two-step-only quadrature phase-shifting digital holography,”
Opt. Lett., 34
(3), 250
–252
(2009). http://dx.doi.org/10.1364/OL.34.000250 OPLEDP 0146-9592 Google Scholar
Y. AwatsujiM. SasadaT. Kubota,
“Parallel quasi-phase-shifting digital holography,”
Appl. Phys. Lett., 85
(6), 1069
–1071
(2004). http://dx.doi.org/10.1063/1.1777796 APPLAB 0003-6951 Google Scholar
C. S. Guoet al.,
“Phase-shifting error and its elimination in phase-shifting digital holography,”
Opt. Lett., 27
(19), 1687
–1689
(2002). http://dx.doi.org/10.1364/OL.27.001687 OPLEDP 0146-9592 Google Scholar
Z. WangB. Han,
“Advanced iterative algorithm for phase extraction of randomly phase-shifted interferograms,”
Opt. Lett., 29
(14), 1671
–1673
(2004). http://dx.doi.org/10.1364/OL.29.001671 OPLEDP 0146-9592 Google Scholar
X. F. Xuet al.,
“Simple direct extraction of unknown phase shift and wavefront reconstruction in generalized phase-shifting interferometry: algorithm and experiments,”
Opt. Lett., 33
(8), 776
–778
(2008). http://dx.doi.org/10.1364/OL.33.000776 OPLEDP 0146-9592 Google Scholar
W. Choiet al.,
“Tomographic phase microscopy,”
Nat. Methods, 4
(9), 717
–719
(2007). http://dx.doi.org/10.1038/nmeth1078 1548-7091 Google Scholar
Y. IchiokaM. Inuiya,
“Direct phase detecting system,”
Appl. Opt., 11
(7), 1507
–1514
(1972). http://dx.doi.org/10.1364/AO.11.001507 APOPAI 0003-6935 Google Scholar
L. Mertz,
“Real-time fringe-pattern analysis,”
Appl. Opt., 22
(10), 1535
–1539
(1983). http://dx.doi.org/10.1364/AO.22.001535 APOPAI 0003-6935 Google Scholar
D. Carlet al.,
“Parameter-optimized digital holographic microscope for high-resolution living-cell analysis,”
Appl. Opt., 43
(36), 6536
–6544
(2004). http://dx.doi.org/10.1364/AO.43.006536 APOPAI 0003-6935 Google Scholar
M. LieblingT. BluM. Unser,
“Complex-wave retrieval from a single off-axis hologram,”
J. Opt. Soc. Am., 21
(3), 367
–377
(2004). http://dx.doi.org/10.1364/JOSAA.21.000367 JOSAAH 0030-3941 Google Scholar
E. N. LeithJ. Upatniek,
“Reconstructed wavefronts and communication theory,”
J. Opt. Soc. Am., 52
(10), 1123
(1962). http://dx.doi.org/10.1364/JOSA.52.001123 JOSAAH 0030-3941 Google Scholar
M. TakedaH. InaS. Kobayashi,
“Fourier-transform method of fringe-pattern analysis for computer-based topography and interferometry,”
J. Opt. Soc. Am., 72
(1), 156
–160
(1982). http://dx.doi.org/10.1364/JOSA.72.000156 JOSAAH 0030-3941 Google Scholar
T. Kreis,
“Digital holographic interference-phase measurement using the Fourier-transform method,”
J. Opt. Soc. Am. A, 3
(6), 847
–855
(1986). http://dx.doi.org/10.1364/JOSAA.3.000847 JOAOD6 0740-3232 Google Scholar
E. CucheP. MarquetC. Depeursinge,
“Simultaneous amplitude-contrast and quantitative phase-contrast microscopy by numerical reconstruction of Fresnel off-axis holograms,”
Appl. Opt., 38
(34), 6994
–7001
(1999). http://dx.doi.org/10.1364/AO.38.006994 APOPAI 0003-6935 Google Scholar
E. CucheF. BevilacquaC. Depeursinge,
“Digital holography for quantitative phase-contrast imaging,”
Opt. Lett., 24
(5), 291
–293
(1999). http://dx.doi.org/10.1364/OL.24.000291 OPLEDP 0146-9592 Google Scholar
W. S. Haddadet al.,
“Fourier-transform holographic microscope,”
Appl. Opt., 31
(24), 4973
–4978
(1992). http://dx.doi.org/10.1364/AO.31.004973 APOPAI 0003-6935 Google Scholar
Y. TakakiH. KawaiH. Ohzu,
“Hybrid holographic microscopy free of conjugate and zero-order images,”
Appl. Opt., 38
(23), 4990
–4996
(1999). http://dx.doi.org/10.1364/AO.38.004990 APOPAI 0003-6935 Google Scholar
W. B. Xuet al.,
“Digital in-line holography for biological applications,”
Proc. Natl. Acad. Sci. U. S. A., 98
(20), 11301
–11305
(2001). http://dx.doi.org/10.1073/pnas.191361398 PNASA6 0027-8424 Google Scholar
P. Marquetet al.,
“Digital holographic microscopy: a noninvasive contrast imaging technique allowing quantitative visualization of living cells with subwavelength axial accuracy,”
Opt. Lett., 30
(5), 468
–470
(2005). http://dx.doi.org/10.1364/OL.30.000468 OPLEDP 0146-9592 Google Scholar
G. Popescu,
“Quantitative phase imaging of nanoscale cell structure and dynamics,”
Methods Cell Biol., 90 87
–115
(2008). http://dx.doi.org/10.1016/S0091-679X(08)00805-4 MCBLAG 0091-679X Google Scholar
T. Colombet al.,
“Polarization imaging by use of digital holography,”
Appl. Opt., 41
(1), 27
–37
(2002). http://dx.doi.org/10.1364/AO.41.000027 APOPAI 0003-6935 Google Scholar
T. Colombet al.,
“Polarization microscopy by use of digital holography: application to optical fiber birefringence measurements,”
Appl. Opt., 44
(21), 4461
–4469
(2005). http://dx.doi.org/10.1364/AO.44.004461 APOPAI 0003-6935 Google Scholar
J. Kuhnet al.,
“Real-time dual-wavelength digital holographic microscopy with a single hologram acquisition,”
Opt. Express, 15
(12), 7231
–7242
(2007). http://dx.doi.org/10.1364/OE.15.007231 OPEXFF 1094-4087 Google Scholar
E. CucheP. MarquetC. Depeursinge,
“Spatial filtering for zero-order and twin-image elimination in digital off-axis holography,”
Appl. Opt., 39
(23), 4070
–4075
(2000). http://dx.doi.org/10.1364/AO.39.004070 APOPAI 0003-6935 Google Scholar
T. Colombet al.,
“Automatic procedure for aberration compensation in digital holographic microscopy and application to specimen shape compensation,”
Appl. Opt., 45 851
–863
(2006). http://dx.doi.org/10.1364/AO.45.000851 APOPAI 0003-6935 Google Scholar
T. Colombet al.,
“Total aberrations compensation in digital holographic microscopy with a reference conjugated hologram,”
Opt. Express, 14
(10), 4300
–4306
(2006). http://dx.doi.org/10.1364/OE.14.004300 OPEXFF 1094-4087 Google Scholar
J. Kuhnet al.,
“Axial sub-nanometer accuracy in digital holographic microscopy,”
Meas. Sci. Technol., 19
(7), 074007
(2008). http://dx.doi.org/10.1088/0957-0233/19/7/074007 MSTCEP 0957-0233 Google Scholar
B. Kemperet al.,
“Investigation of living pancreas tumor cells by digital holographic microscopy,”
J. Biomed. Opt., 11
(3), 034005
(2006). http://dx.doi.org/10.1117/1.2204609 JBOPFO 1083-3668 Google Scholar
M. K. KimL. YuC. J. Mann,
“Interference techniques in digital holography,”
J. Opt., 8
(7), S518
–S523
(2006). JOOPDB 0150-536X Google Scholar
F. Charriereet al.,
“Shot-noise influence on the reconstructed phase image signal-to-noise ratio in digital holographic microscopy,”
Appl. Opt., 45
(29), 7667
–7673
(2006). http://dx.doi.org/10.1364/AO.45.007667 APOPAI 0003-6935 Google Scholar
F. Charriereet al.,
“Influence of shot noise on phase measurement accuracy in digital holographic microscopy,”
Opt. Express, 15
(14), 8818
–8831
(2007). http://dx.doi.org/10.1364/OE.15.008818 OPEXFF 1094-4087 Google Scholar
M. LieblingM. Unser,
“Autofocus for digital Fresnel holograms by use of a Fresnelet-sparsity criterion,”
J. Opt. Soc. Am., 21
(12), 2424
–2430
(2004). http://dx.doi.org/10.1364/JOSAA.21.002424 JOSAAH 0030-3941 Google Scholar
L. DixonF. C. CheongD. G. Grier,
“Holographic deconvolution microscopy for high-resolution particle tracking,”
Opt. Express, 19
(17), 16410
–16417
(2011). http://dx.doi.org/10.1364/OE.19.016410 OPEXFF 1094-4087 Google Scholar
J. C. MarronK. S. Schroeder,
“Holographic laser-radar,”
Opt. Lett., 18
(5), 385
–387
(1993). http://dx.doi.org/10.1364/OL.18.000385 OPLEDP 0146-9592 Google Scholar
E. AronsD. Dilworth,
“Lensless imaging by spatial Fourier synthesis holography,”
Appl. Opt., 35
(5), 777
–781
(1996). http://dx.doi.org/10.1364/AO.35.000777 APOPAI 0003-6935 Google Scholar
M. K. Kim,
“Wavelength-scanning digital interference holography for optical section imaging,”
Opt. Lett., 24
(23), 1693
–1695
(1999). http://dx.doi.org/10.1364/OL.24.001693 OPLEDP 0146-9592 Google Scholar
F. Montfortet al.,
“Submicrometer optical tomography by multiple-wavelength digital holographic microscopy,”
Appl. Opt., 45
(32), 8209
–8217
(2006). http://dx.doi.org/10.1364/AO.45.008209 APOPAI 0003-6935 Google Scholar
J. Kuhnet al.,
“Submicrometer tomography of cells by multiple-wavelength digital holographic microscopy in reflection,”
Opt. Lett., 34
(5), 653
–655
(2009). http://dx.doi.org/10.1364/OL.34.000653 OPLEDP 0146-9592 Google Scholar
E. CucheP. PoscioC. Depeursinge,
“Optical tomography by means of a numerical low-coherence holographic technique,”
J. Opt., 28
(6), 260
–264
(1997). http://dx.doi.org/10.1088/0150-536X/28/6/005 JOOPDB 0150-536X Google Scholar
P. Massatschet al.,
“Time-domain optical coherence tomography with digital holographic microscopy,”
Appl. Opt., 44
(10), 1806
–1812
(2005). http://dx.doi.org/10.1364/AO.44.001806 APOPAI 0003-6935 Google Scholar
E. Wolf,
“Three dimensional structure determination of semi-transparent object from holographic data,”
Opt. Commun., 1
(4), 153
–156
(1969). http://dx.doi.org/10.1016/0030-4018(69)90052-2 Google Scholar
F. Charriereet al.,
“Cell refractive index tomography by digital holographic microscopy,”
Opt. Lett., 31
(2), 178
–180
(2006). http://dx.doi.org/10.1364/OL.31.000178 OPLEDP 0146-9592 Google Scholar
F. Charriereet al.,
“Living specimen tomography by digital holographic microscopy: morphometry of testate amoeba,”
Opt. Express, 14
(16), 7005
–7013
(2006). http://dx.doi.org/10.1364/OE.14.007005 OPEXFF 1094-4087 Google Scholar
M. Debailleulet al.,
“High-resolution three-dimensional tomographic diffractive microscopy of transparent inorganic and biological samples,”
Opt. Lett., 34
(1), 79
–81
(2009). http://dx.doi.org/10.1364/OL.34.000079 OPLEDP 0146-9592 Google Scholar
Y. J. Sunget al.,
“Optical diffraction tomography for high resolution live cell imaging,”
Opt. Express, 17
(1), 266
–277
(2009). http://dx.doi.org/10.1364/OE.17.000266 OPEXFF 1094-4087 Google Scholar
Y. CotteM. F. ToyC. Depeursinge,
“Beyond the lateral resolution limit by phase imaging,”
J. Biomed. Opt., 16
(10), 106007
(2011). http://dx.doi.org/10.1117/1.3640812 JBOPFO 1083-3668 Google Scholar
M. Kimet al.,
“High-speed synthetic aperture microscopy for live cell imaging,”
Opt. Lett., 36
(2), 148
–150
(2011). http://dx.doi.org/10.1364/OL.36.000148 OPLEDP 0146-9592 Google Scholar
S. S. KouC. J. R. Sheppard,
“Comparison of three dimensional transfer function analysis of alternative phase imaging methods,”
Proc. SPIE, 6443 64430Q
(2007). http://dx.doi.org/10.1117/12.698995 PSISDG 0277-786X Google Scholar
C. J. R. SheppardS. S. Kou,
“3D Imaging with holographic tomography,”
in Proc. Int. Conf. on Advanced Phase Measurement Methods in Optics an Imaging,
65
–69
(2010). Google Scholar
E. Wolf,
“Three-dimensional structure determination of semi-transparent object from holographic data,”
Opt. Commun., 1
(4), 153
–156
(1969). http://dx.doi.org/10.1016/0030-4018(69)90052-2 OPCOB8 0030-4018 Google Scholar
V. Lauer,
“New approach to optical diffraction tomography yielding a vector equation of diffraction tomography and a novel tomographic microscope,”
J. Microsc-Oxford, 205 165
–176
(2002). http://dx.doi.org/10.1046/j.0022-2720.2001.00980.x JMICAR 0022-2720 Google Scholar
A. DevaneyJ. Cheng,
“Optical diffraction tomography in an inhomogeneous background medium,”
Meas. Sci. Technol., 19
(8), 085505
(2008). http://dx.doi.org/10.1088/0957-0233/19/8/085505 MSTCEP 0957-0233 Google Scholar
J. H. MilgramW. C. Li,
“Computational reconstruction of images from holograms,”
Appl. Opt., 41
(5), 853
–864
(2002). http://dx.doi.org/10.1364/AO.41.000853 APOPAI 0003-6935 Google Scholar
A. Molderet al.,
“Non-invasive, label-free cell counting and quantitative analysis of adherent cells using digital holography,”
J. Microsc., 232
(2), 240
–247
(2008). http://dx.doi.org/10.1111/j.1365-2818.2008.02095.x JMICAR 0022-2720 Google Scholar
S. Seoet al.,
“High-throughput lens-free blood analysis on a chip,”
Anal. Chem., 82
(11), 4621
–4627
(2010). http://dx.doi.org/10.1021/ac1007915 ANCHAM 0003-2700 Google Scholar
M. Mihailescuet al.,
“Automated imaging, identification, and counting of similar cells from digital hologram reconstructions,”
Appl. Opt., 50
(20), 3589
–3597
(2011). http://dx.doi.org/10.1364/AO.50.003589 APOPAI 0003-6935 Google Scholar
V. Biancoet al.,
“Imaging through scattering microfluidic channels by digital holography for information recovery in lab on chip,”
Opt. Express, 21
(20), 23985
–23996
(2013). http://dx.doi.org/10.1364/OE.21.023985 OPEXFF 1094-4087 Google Scholar
I. MoonB. Javidi,
“Three-dimensional identification of stem cells by computational holographic imaging,”
J. R. Soc. Interface, 4
(13), 305
–313
(2007). http://dx.doi.org/10.1098/rsif.2006.0175 1742-5689 Google Scholar
M. DaneshPanahet al.,
“3-D holographic imaging and trapping for non-invasive cell identification and tracking,”
J. Disp. Technol., 6
(10), 490
–499
(2010). http://dx.doi.org/10.1109/JDT.2010.2043499 JDTEDS 0193-2691 Google Scholar
B. JavidiM. DaneshpanahI. Moon,
“Three-dimensional holographic imaging for identification of biological micro/nanoorganisms,”
IEEE Photon. J., 2
(2), 256
–259
(2010). http://dx.doi.org/10.1109/JPHOT.2010.2044876 1943-0655 Google Scholar
I. MoonF. YiB. Javidi,
“Automated three-dimensional microbial sensing and recognition using digital holography and statistical sampling,”
Sensors, 10
(9), 8437
–8451
(2010). http://dx.doi.org/10.3390/s100908437 SNSRES 0746-9462 Google Scholar
A. AnandV. K. ChhaniwalB. Javidi,
“Imaging embryonic stem cell dynamics using quantitative 3-D digital holographic microscopy,”
IEEE Photon. J., 3
(3), 546
–554
(2011). http://dx.doi.org/10.1109/JPHOT.2011.2158637 1943-0655 Google Scholar
R. Liuet al.,
“Recognition and classification of red blood cells using digital holographic microscopy and data clustering with discriminant analysis,”
J. Opt. Soc. Am., 28
(6), 1204
–1210
(2011). http://dx.doi.org/10.1364/JOSAA.28.001204 JOSAAH 0030-3941 Google Scholar
P. Memmoloet al.,
“Identification of bovine sperm head for morphometry analysis in quantitative phase-contrast holographic microscopy,”
Opt. Express, 19
(23), 23215
–23226
(2011). http://dx.doi.org/10.1364/OE.19.023215 OPEXFF 1094-4087 Google Scholar
I. Moonet al.,
“Automated statistical quantification of three-dimensional morphology and mean corpuscular hemoglobin of multiple red blood cells,”
Opt. Express, 20
(9), 10295
–10309
(2012). http://dx.doi.org/10.1364/OE.20.010295 OPEXFF 1094-4087 Google Scholar
F. YiC. G. LeeI. K. Moon,
“Statistical analysis of 3D volume of red blood cells with different shapes via digital holographic microscopy,”
J. Opt. Soc. Korea, 16
(2), 115
–120
(2012). http://dx.doi.org/10.3807/JOSK.2012.16.2.115 1226-4776 Google Scholar
F. Yiet al.,
“Automated segmentation of multiple red blood cells with digital holographic microscopy,”
J. Biomed. Opt., 18
(2), 026006
(2013). http://dx.doi.org/10.1117/1.JBO.18.2.026006 JBOPFO 1083-3668 Google Scholar
G. Popescuet al.,
“Erythrocyte structure and dynamics quantified by Hilbert phase microscopy,”
J. Biomed. Opt., 10
(6), 060503
(2005). http://dx.doi.org/10.1117/1.2149847 JBOPFO 1083-3668 Google Scholar
I. Bernhardtet al.,
“Application of digital holographic microscopy to investigate the sedimentation of intact red blood cells and their interaction with artificial surfaces,”
Bioelectrochemistry, 73
(2), 92
–96
(2008). http://dx.doi.org/10.1016/j.bioelechem.2007.12.001 BEBEBP 0302-4598 Google Scholar
B. Rappazet al.,
“Comparative study of human erythrocytes by digital holographic microscopy, confocal microscopy, and impedance volume analyzer,”
Cytometry Part A, 73A
(10), 895
–903
(2008). http://dx.doi.org/10.1002/cyto.a.v73a:10 1552-4922 Google Scholar
M. MirK. TangellaG. Popescu,
“Blood testing at the single cell level using quantitative phase and amplitude microscopy,”
Biomed. Opt. Express, 2
(12), 3259
–3266
(2011). http://dx.doi.org/10.1364/BOE.2.003259 BOEICL 2156-7085 Google Scholar
D. S. MehtaV. Srivastava,
“Quantitative phase imaging of human red blood cells using phase-shifting white light interference microscopy with colour fringe analysis,”
Appl. Phys. Lett., 101
(20), 203701
(2012). APPLAB 0003-6951 Google Scholar
N. T. Shakedet al.,
“Dynamic quantitative microscopy and nanoscopy of red blood cells in sickle cell disease,”
Proc. SPIE, 8227 822711
(2012). http://dx.doi.org/10.1117/12.907659 PSISDG 0277-786X Google Scholar
I. Moonet al.,
“Automated quantitative analysis of 3D morphology and mean corpuscular hemoglobin in human red blood cells stored in different periods,”
Opt. Express, 21
(25), 30947
–30957
(2013). http://dx.doi.org/10.1364/OE.21.030947 OPEXFF 1094-4087 Google Scholar
I. Crhaet al.,
“Digital holographic microscopy in human sperm imaging,”
J. Assist. Reprod. Genet., 28
(8), 725
–729
(2011). http://dx.doi.org/10.1007/s10815-011-9584-y JARGE4 1058-0468 Google Scholar
F. Merolaet al.,
“Digital holography as a method for 3D imaging and estimating the biovolume of motile cells,”
Lab Chip, 13
(23), 4512
–4516
(2013). http://dx.doi.org/10.1039/c3lc50515d LCAHAM 1473-0197 Google Scholar
C. J. Mannet al.,
“High-resolution quantitative phase-contrast microscopy by digital holography,”
Opt. Express, 13
(22), 8693
–8698
(2005). http://dx.doi.org/10.1364/OPEX.13.008693 OPEXFF 1094-4087 Google Scholar
H. JaneckovaP. VeselyR. Chmelik,
“Proving tumour cells by acute nutritional/energy deprivation as a survival threat: a task for microscopy,”
Anticancer Res., 29
(6), 2339
–2345
(2009). ANTRD4 0250-7005 Google Scholar
P. Wanget al.,
“Nanoscale nuclear architecture for cancer diagnosis by spatial-domain low-coherence quantitative phase microscopy,”
Proc. SPIE, 7907 790704
(2011). http://dx.doi.org/10.1117/12.874693 PSISDG 0277-786X Google Scholar
P. Wanget al.,
“Nanoscale nuclear architecture for cancer diagnosis beyond pathology via spatial-domain low-coherence quantitative phase microscopy,”
J. Biomed. Opt., 15
(6), 066028
(2010). http://dx.doi.org/10.1117/1.3523618 JBOPFO 1083-3668 Google Scholar
A. Bauwenset al.,
“Differential cytotoxic actions of Shiga toxin 1 and Shiga toxin 2 on microvascular and macrovascular endothelial cells,”
Thromb. Haemost., 105
(3), 515
–528
(2011). http://dx.doi.org/10.1160/TH10-02-0140 THHADQ 0340-6245 Google Scholar
N. Pavillonet al.,
“Early cell death detection with digital holographic microscopy,”
PLoS One, 7
(1), e30912
(2012). http://dx.doi.org/10.1371/journal.pone.0030912 1932-6203 Google Scholar
J. Kuhnet al.,
“Label-free cytotoxicity screening assay by digital holographic microscopy,”
Assay Drug Dev. Technol., 11
(2), 101
–107
(2013). http://dx.doi.org/10.1089/adt.2012.476 ADDTAR 1540-658X Google Scholar
B. Rappazet al.,
“Digital holographic microscopy: a quantitative label-free microscopy technique for phenotypic screening,”
Comb. Chem. High Throughput Screen, 17
(1), 80
–88
(2014). http://dx.doi.org/10.2174/13862073113166660062 CCHSFU 1386-2073 Google Scholar
J. Garayet al.,
“Crosstalk between PKA and Epac regulates the phenotypic maturation and function of human dendritic cells,”
J. Immunol., 185
(6), 3227
–3238
(2010). http://dx.doi.org/10.4049/jimmunol.0903066 JOIMA3 0022-1767 Google Scholar
A. K. EllerbeeT. L. CreazzoJ. A. Izatt,
“Investigating nanoscale cellular dynamics with cross-sectional spectral domain phase microscopy,”
Opt. Express, 15
(13), 8115
–8124
(2007). http://dx.doi.org/10.1364/OE.15.008115 OPEXFF 1094-4087 Google Scholar
R. Ansariet al.,
“Quantitative analysis of cardiomyocyte dynamics with optical coherence phase microscopy,”
Proc. SPIE, 8213 821338
(2012). http://dx.doi.org/10.1117/12.911781 PSISDG 0277-786X Google Scholar
Y. S. ChoiS. J. Lee,
“Three-dimensional volumetric measurement of red blood cell motion using digital holographic microscopy,”
Appl. Opt., 48
(16), 2983
–2990
(2009). http://dx.doi.org/10.1364/AO.48.002983 APOPAI 0003-6935 Google Scholar
T. KimT. C. Poon,
“Autofocusing in optical scanning holography,”
Appl. Opt., 48
(34), H153
–H159
(2009). http://dx.doi.org/10.1364/AO.48.00H153 APOPAI 0003-6935 Google Scholar
P. Langehanenberget al.,
“Automated three-dimensional tracking of living cells by digital holographic microscopy,”
J. Biomed. Opt., 14
(1), 014018
(2009). http://dx.doi.org/10.1117/1.3080133 JBOPFO 1083-3668 Google Scholar
H. Y. Wanget al.,
“photonics and optoelectronics,”
in SOPO Symposium on Photonics and Optoelectronics,
1
–4
(2009). Google Scholar
J. Zhaoet al.,
“Autofocusing on pure phase object for living cell imaging in lensless Fourier transform digital holography,”
Proc. SPIE, 7790 779017
(2010). http://dx.doi.org/10.1117/12.860527 PSISDG 0277-786X Google Scholar
M. F. Toyet al.,
“Digital holographic microscopy for the cytomorphological imaging of cells under zero gravity,”
Proc. SPIE, 8227 82270S
(2012). http://dx.doi.org/10.1117/12.908413 PSISDG 0277-786X Google Scholar
P. Ferraroet al.,
“3-D imaging with large focus extension by a coherent optical microscope,”
Information Optics, 52
–62 2006). Google Scholar
P. Ferraroet al.,
“Extended focused image in microscopy by digital holography,”
Opt. Express, 13
(18), 6738
–6749
(2005). http://dx.doi.org/10.1364/OPEX.13.006738 OPEXFF 1094-4087 Google Scholar
M. Antkowiaket al.,
“Accurate three-dimensional detection of micro-particles by means of digital holographic microscopy,”
Proc. SPIE, 6995 699514
(2008). http://dx.doi.org/10.1117/12.781210 PSISDG 0277-786X Google Scholar
C. McElhinneyB. HennellyT. Naughton,
“Extended focused imaging for digital holograms of macroscopic three-dimensional objects,”
Appl. Opt., 47
(19), D71
–D79
(2008). http://dx.doi.org/10.1364/AO.47.000D71 APOPAI 0003-6935 Google Scholar
I. Bergoendet al.,
“Depth-of-field extension and 3-D reconstruction in digital holographic microscopy,”
Proc. SPIE, 7390 73901C
(2009). http://dx.doi.org/10.1117/12.827350 PSISDG 0277-786X Google Scholar
T. Colombet al.,
“Extended depth-of-focus by digital holographic microscopy,”
Opt. Lett., 35
(11), 1840
–1842
(2010). http://dx.doi.org/10.1364/OL.35.001840 OPLEDP 0146-9592 Google Scholar
W. Q. Pan,
“Multiplane imaging and depth-of-focus extending in digital holography by a single-shot digital hologram,”
Opt. Commun., 286 117
–122
(2013). http://dx.doi.org/10.1016/j.optcom.2012.09.013 OPCOB8 0030-4018 Google Scholar
C. J. MannL. F. YuM. K. Kim,
“Movies of cellular and sub-cellular motion by digital holographic microscopy,”
Biomed. Eng. Online, 5 21
(2006). http://dx.doi.org/10.1186/1475-925X-5-21 1475-925X Google Scholar
M. DaneshPanahB. Javidi,
“Tracking biological microorganisms in sequence of 3D holographic microscopy images,”
Opt. Express, 15
(17), 10761
–10766
(2007). http://dx.doi.org/10.1364/OE.15.010761 OPEXFF 1094-4087 Google Scholar
H. Y. Sunet al.,
“Visualization of fast-moving cells in vivo using digital holographic video microscopy,”
J. Biomed. Opt., 13
(1), 014007
(2008). http://dx.doi.org/10.1117/1.2841050 JBOPFO 1083-3668 Google Scholar
Y. Baeet al.,
“Three-dimensional single particle tracking using off-axis digital holographic microscopy,”
Proc. SPIE, 7574 757408
(2010). http://dx.doi.org/10.1117/12.842882 PSISDG 0277-786X Google Scholar
B. JavidiI. MoonM. Daneshpanaha,
“Detection, identification and tracking of biological micro/nano organisms by computational 3-D optical imaging,”
Proc. SPIE, 7759 77590R
(2010). http://dx.doi.org/10.1117/12.861490 PSISDG 0277-786X Google Scholar
M. Bohmet al.,
“PACE4, a member of the prohormone convertase family, mediates increased proliferation, migration and invasiveness of melanoma cells in vitro and enhanced subcutaneous tumor growth in vivo,”
J. Invest. Dermatol., 131 S108
–S108
(2011). http://dx.doi.org/10.1038/jid.2010.255 JIDEAE 0022-202X Google Scholar
P. Memmoloet al.,
“On the holographic 3D tracking of in vitro cells characterized by a highly-morphological change,”
Opt. Express, 20
(27), 28485
–28493
(2012). http://dx.doi.org/10.1364/OE.20.028485 OPEXFF 1094-4087 Google Scholar
F. Merolaet al.,
“Simultaneous optical manipulation, 3-D tracking, and imaging of micro-objects by digital holography in microfluidics,”
IEEE Photon. J., 4
(2), 451
–454
(2012). http://dx.doi.org/10.1109/JPHOT.2012.2190980 1943-0655 Google Scholar
L. Miccioet al.,
“Detection and visualization improvement of spermatozoa cells by digital holography,”
Proc. SPIE, 8089 80890C
(2011). http://dx.doi.org/10.1117/12.889972 PSISDG 0277-786X Google Scholar
M. Paturzoet al.,
“Microscopy imaging and quantitative phase contrast mapping in turbid microfluidic channels by digital holography,”
Lab Chip, 12
(17), 3073
–3076
(2012). http://dx.doi.org/10.1039/c2lc40114b LCAHAM 1473-0197 Google Scholar
W. Xuet al.,
“Tracking particles in four dimensions with in-line holographic microscopy,”
Opt. Lett., 28
(3), 164
–166
(2003). http://dx.doi.org/10.1364/OL.28.000164 OPLEDP 0146-9592 Google Scholar
M. Antkowiaket al.,
“Extended focused imaging of a microparticle field with digital holographic microscopy,”
Opt. Lett., 33
(14), 1626
–1628
(2008). http://dx.doi.org/10.1364/OL.33.001626 OPLEDP 0146-9592 Google Scholar
N. Warnasooriyaet al.,
“Imaging gold nanoparticles in living cell environments using heterodyne digital holographic microscopy,”
Opt. Express, 18
(4), 3264
–3273
(2010). http://dx.doi.org/10.1364/OE.18.003264 OPEXFF 1094-4087 Google Scholar
C. L. Hsiehet al.,
“Three-dimensional harmonic holographic microcopy using nanoparticles as probes for cell imaging,”
Opt. Express, 17
(4), 2880
–2891
(2009). http://dx.doi.org/10.1364/OE.17.002880 OPEXFF 1094-4087 Google Scholar
E. ShafferC. Depeursinge,
“Digital holography for second harmonic microscopy: application to 3D-tracking of nanoparticles,”
Proc. SPIE, 7715 771505
(2010). http://dx.doi.org/10.1117/12.854289 PSISDG 0277-786X Google Scholar
D. ZichaG. A. Dunn,
“An image-processing system for cell behavior studies in subconfluent cultures,”
J. Microsc-Oxford, 179 11
–21
(1995). http://dx.doi.org/10.1111/jmi.1995.179.issue-1 JMICAR 0022-2720 Google Scholar
G. Popescuet al.,
“Imaging red blood cell dynamics by quantitative phase microscopy,”
Blood Cells Mol. Dis., 41
(1), 10
–16
(2008). http://dx.doi.org/10.1016/j.bcmd.2008.01.010 1079-9796 Google Scholar
B. Rappazet al.,
“Noninvasive characterization of the fission yeast cell cycle by monitoring dry mass with digital holographic microscopy,”
J. Biomed. Opt., 14
(3), 034049
(2009). http://dx.doi.org/10.1117/1.3147385 JBOPFO 1083-3668 Google Scholar
B. Kemperet al.,
“Label-free quantitative cell division monitoring of endothelial cells by digital holographic microscopy,”
J. Biomed. Opt., 15
(3), 036009
(2010). http://dx.doi.org/10.1117/1.3431712 JBOPFO 1083-3668 Google Scholar
M. Miret al.,
“Optical measurement of cycle-dependent cell growth,”
Proc. Natl. Acad. Sci. U. S. A., 108
(32), 13124
–13129
(2011). http://dx.doi.org/10.1073/pnas.1100506108 PNASA6 0027-8424 Google Scholar
H. Byunet al.,
“Optical measurement of biomechanical properties of individual erythrocytes from a sickle cell patient,”
Acta Biomater., 8
(11), 4130
–4138
(2012). http://dx.doi.org/10.1016/j.actbio.2012.07.011 1742-7061 Google Scholar
A. I. Yusipovichet al.,
“Laser interference microscopy in erythrocyte study,”
J. Appl. Phys., 105
(10), 102037
(2009). http://dx.doi.org/10.1063/1.3116609 JAPIAU 0021-8979 Google Scholar
Y. JangJ. JangY. Park,
“Dynamic spectroscopic phase microscopy for quantifying hemoglobin concentration and dynamic membrane fluctuation in red blood cells,”
Opt. Express, 20
(9), 9673
–9681
(2012). http://dx.doi.org/10.1364/OE.20.009673 OPEXFF 1094-4087 Google Scholar
H. Phamet al.,
“Spectroscopic diffraction phase microscopy,”
Opt. Lett., 37
(16), 3438
–3440
(2012). http://dx.doi.org/10.1364/OL.37.003438 OPLEDP 0146-9592 Google Scholar
M. RinehartY. Z. ZhuA. Wax,
“Quantitative phase spectroscopy,”
Biomed. Opt. Express, 3
(5), 958
–965
(2012). http://dx.doi.org/10.1364/BOE.3.000958 BOEICL 2156-7085 Google Scholar
G. Popescuet al.,
“Optical imaging of cell mass and growth dynamics,”
Am. J. Physiol. Cell Physiol., 295
(2), C538
–C544
(2008). http://dx.doi.org/10.1152/ajpcell.00121.2008 0363-6143 Google Scholar
B. Rappazet al.,
“Spatial analysis of erythrocyte membrane fluctuations by digital holographic microscopy,”
Blood Cells Mol. Dis., 42
(3), 228
–232
(2009). http://dx.doi.org/10.1016/j.bcmd.2009.01.018 1079-9796 Google Scholar
Y. K. Parket al.,
“Metabolic remodeling of the human red blood cell membrane,”
Proc. Natl. Acad. Sci. U. S. A., 107
(4), 1289
–1294
(2010). http://dx.doi.org/10.1073/pnas.0910785107 PNASA6 0027-8424 Google Scholar
S. Leeet al.,
“Detrended fluctuation analysis of membrane flickering in discocyte and spherocyte red blood cells using quantitative phase microscopy,”
J. Biomed. Opt., 16
(7), 076009
(2011). http://dx.doi.org/10.1117/1.3601460 JBOPFO 1083-3668 Google Scholar
Y. Parket al.,
“Measurement of the nonlinear elasticity of red blood cell membranes,”
Phys. Rev. E, 83
(5), 051925
(2011). PLEEE8 1063-651X Google Scholar
D. Bosset al.,
“Spatially-resolved eigenmode decomposition of red blood cells membrane fluctuations questions the role of ATP in flickering,”
PLoS One, 7
(8), e40667
(2012). http://dx.doi.org/10.1371/journal.pone.0040667 1932-6203 Google Scholar
T. Higuchiet al.,
“Three-dimensional positioning of optically trapped nanoparticles,”
Appl. Opt., 50
(34), H183
–H188
(2011). http://dx.doi.org/10.1364/AO.50.00H183 APOPAI 0003-6935 Google Scholar
Y. HayasakiA. Sato,
“Three-dimensional position measurement of a gold nanoparticle trapped in optical tweezers using in-line low-coherence digital holography,”
in Proc. 2012 11th Euro-American Workshop on Information Optics (Wio),
(2012). Google Scholar
J. M. A. Mauritzet al.,
“Biophotonic techniques for the study of malaria-infected red blood cells,”
Med. Biol. Eng. Comput., 48
(10), 1055
–1063
(2010). http://dx.doi.org/10.1007/s11517-010-0668-0 MBECDY 0140-0118 Google Scholar
N. CardenasL. F. YuS. K. Mohanty,
“Probing orientation and rotation of red blood cells in optical tweezers by digital holographic microscopy,”
Proc. SPIE, 7906 790613
(2011). http://dx.doi.org/10.1117/12.876001 PSISDG 0277-786X Google Scholar
N. CardenasL. F. YuS. K. Mohanty,
“Stretching of red blood cells by optical tweezers quantified by digital holographic microscopy,”
Proc. SPIE, 7897 78971J
(2011). http://dx.doi.org/10.1117/12.875981 PSISDG 0277-786X Google Scholar
M. Esselinget al.,
“Multimodal biophotonic workstation for live cell analysis,”
J. Biophotonics, 5
(1), 9
–13
(2012). http://dx.doi.org/10.1002/jbio.v5.1 JBOIBX 1864-063X Google Scholar
B. Kemperet al.,
“Towards 3D modelling and imaging of infection scenarios at the single cell level using holographic optical tweezers and digital holographic microscopy,”
J. Biophotonics, 6
(3), 260
–266
(2013). http://dx.doi.org/10.1002/jbio.v6.3 JBOIBX 1864-063X Google Scholar
B. FriedrichI. MatskevichF. Lang,
“Cell volume regulatory mechanisms,”
Contrib. Nephrol., 152 1
–8
(2006). http://dx.doi.org/10.1159/000096284 CNEPDD 0302-5144 Google Scholar
E. K. HoffmannI. H. LambertS. F. Pedersen,
“Physiology of cell volume regulation in vertebrates,”
Physiol. Rev., 89
(1), 193
–277
(2009). http://dx.doi.org/10.1152/physrev.00037.2007 PHREA7 0031-9333 Google Scholar
H. Pasantes-MoralesS. Cruz-Rangel,
“Brain volume regulation: osmolytes and aquaporin perspectives,”
Neuroscience, 168
(4), 871
–884
(2010). http://dx.doi.org/10.1016/j.neuroscience.2009.11.074 NERSD9 0735-2743 Google Scholar
K. Strange,
“Cellular volume homeostasis,”
Adv. Physiol. Educ., 28
(4), 155
–159
(2004). http://dx.doi.org/10.1152/advan.00034.2004 1043-4046 Google Scholar
D. Bosset al.,
“Measurement of absolute cell volume, osmotic membrane water permeability, and refractive index of transmembrane water and solute flux by digital holographic microscopy,”
J. Biomed. Opt., 18
(3), 036007
(2013). http://dx.doi.org/10.1117/1.JBO.18.3.036007 JBOPFO 1083-3668 Google Scholar
N. Lueet al.,
“Live cell refractometry using microfluidic devices,”
Opt. Lett., 31
(18), 2759
–2761
(2006). http://dx.doi.org/10.1364/OL.31.002759 OPLEDP 0146-9592 Google Scholar
B. Kemperet al.,
“Integral refractive index determination of living suspension cells by multifocus digital holographic phase contrast microscopy,”
J. Biomed. Opt., 12
(5), 054009
(2007). http://dx.doi.org/10.1117/1.2798639 JBOPFO 1083-3668 Google Scholar
Y. Parket al.,
“Spectroscopic phase microscopy for quantifying hemoglobin concentrations in intact red blood cells,”
Opt. Lett., 34
(23), 3668
–3670
(2009). http://dx.doi.org/10.1364/OL.34.003668 OPLEDP 0146-9592 Google Scholar
B. Rappazet al.,
“Measurement of the integral refractive index and dynamic cell morphometry of living cells with digital holographic microscopy,”
Opt. Express, 13
(23), 9361
–9373
(2005). http://dx.doi.org/10.1364/OPEX.13.009361 OPEXFF 1094-4087 Google Scholar
B. Rappazet al.,
“Simultaneous cell morphometry and refractive index measurement with dual-wavelength digital holographic microscopy and dye-enhanced dispersion of perfusion medium,”
Opt. Lett., 33
(7), 744
–746
(2008). http://dx.doi.org/10.1364/OL.33.000744 OPLEDP 0146-9592 Google Scholar
E. Sykovàet al.,
“The relationship between changes in intrinsic optical signals and cell swelling in rat spinal cord slices,”
Neuroimage, 18 214
–230
(2003). Google Scholar
E. A. NagelhusT. M. MathiisenO. P. Ottersen,
“Aquaporin-4 in the central nervous system: cellular and subcellular distribution and coexpression with KIR4.1,”
Neuroscience, 129
(4), 905
–913
(2004). http://dx.doi.org/10.1016/j.neuroscience.2004.08.053 NERSD9 0735-2743 Google Scholar
N. Carlson, Physiology of Behavior, Pearson, Harlow
(2014). Google Scholar
Z. PadamseyN. J. Emptage,
“Imaging synaptic plasticity,”
Mol Brain, 4 36
(2011). http://dx.doi.org/10.1186/1756-6606-4-36 MBORAO 1756-6606 Google Scholar
R. CossartD. AronovR. Yuste,
“Attractor dynamics of network UP states in the neocortex,”
Nature, 423
(6937), 283
–288
(2003). http://dx.doi.org/10.1038/nature01614 NATUAS 0028-0836 Google Scholar
D. S. PeterkaH. TakahashiR. Yuste,
“Imaging voltage in neurons,”
Neuron, 69
(1), 9
–21
(2011). http://dx.doi.org/10.1016/j.neuron.2010.12.010 NERNET 0896-6273 Google Scholar
D. K. HillR. D. Keynes,
“Opacity changes in stimulated nerve,”
J. Physiol., 108
(3), 278
–281
(1949). JPHYA7 0022-3751 Google Scholar
I. Tasakiet al.,
“Changes in fluorescence, turbidity, and birefringence associated with nerve excitation,”
Proc. Natl. Acad. Sci. U. S. A., 61
(3), 883
–888
(1968). http://dx.doi.org/10.1073/pnas.61.3.883 PNASA6 0027-8424 Google Scholar
L. B. Cohen,
“Changes in neuron structure during action potential propagation and synaptic transmission,”
Physiol. Rev., 53
(2), 373
–418
(1973). PHREA7 0031-9333 Google Scholar
K. M. CarterJ. S. GeorgeD. M. Rector,
“Simultaneous birefringence and scattered light measurements reveal anatomical features in isolated crustacean nerve,”
J. Neurosci. Methods, 135
(1–2), 9
–16
(2004). http://dx.doi.org/10.1016/j.jneumeth.2003.11.010 JNMEDT 0165-0270 Google Scholar
R. A. Stepnoskiet al.,
“Noninvasive detection of changes in membrane potential in cultured neurons by light scattering,”
Proc. Natl. Acad. Sci. U. S. A., 88
(21), 9382
–9386
(1991). http://dx.doi.org/10.1073/pnas.88.21.9382 PNASA6 0027-8424 Google Scholar
I. TasakiP. M. Byrne,
“Rapid structural changes in nerve fibers evoked by electric current pulses,”
Biochem. Biophys. Res. Commun., 188
(2), 559
–564
(1992). http://dx.doi.org/10.1016/0006-291X(92)91092-5 BBRCA9 0006-291X Google Scholar
B. A. MacVicarD. Hochman,
“Imaging of synaptically evoked intrinsic optical signals in hippocampal slices,”
J. Neurosci., 11
(5), 1458
–1469
(1991). JNRSDS 0270-6474 Google Scholar
R. D. AndrewJ. R. AdamsT. M. Polischuk,
“Imaging NMDA- and kainate-induced intrinsic optical signals from the hippocampal slice,”
J. Neurophysiol., 76
(4), 2707
–2717
(1996). JONEA4 0022-3077 Google Scholar
K. HolthoffO. W. Witte,
“Intrinsic optical signals in rat neocortical slices measured with near-infrared dark-field microscopy reveal changes in extracellular space,”
J. Neurosci., 16
(8), 2740
–2749
(1996). JNRSDS 0270-6474 Google Scholar
H. G. DaviesM. H. F. Wilkins,
“Interference microscopy and mass determination,”
Nature, 169
(4300), 541
(1952). http://dx.doi.org/10.1038/169541a0 Google Scholar
P. Jourdainet al.,
“Simultaneous optical recording in multiple cells by digital holographic microscopy of chloride current associated to activation of the ligand-gated chloride channel GABA(A) receptor,”
PLoS One, 7
(12), e51041
(2012). http://dx.doi.org/10.1371/journal.pone.0051041 1932-6203 Google Scholar
S. Hamannet al.,
“Water permeability of cotransporters in mammalian epithelial cells,”
J. Physiol., 568
(1), 123
–135
(2005). http://dx.doi.org/10.1113/jphysiol.2005.093526 JPHYA7 0022-3751 Google Scholar
P. Jourdainet al.,
“The human CFTR protein expressed in CHO cells activates aquaporin-3 in a cAMP-dependent pathway: study by digital holographic microscopy,”
J. Cell Sci., 127
(3), 546
–556
(2014). http://dx.doi.org/10.1242/jcs.133629 JNCSAI 0021-9533 Google Scholar
D. H. BhattS. ZhangW. B. Gan,
“Dendritic spine dynamics,”
Annu. Rev. Physiol., 71 261
–282
(2009). http://dx.doi.org/10.1146/annurev.physiol.010908.163140 ARPHAD 0066-4278 Google Scholar
K. SvobodaR. Yasuda,
“Principles of two-photon excitation microscopy and its applications to neuroscience,”
Neuron, 50
(6), 823
–839
(2006). http://dx.doi.org/10.1016/j.neuron.2006.05.019 NERNET 0896-6273 Google Scholar
K. F. C. LeeC. SoaresJ. C. Beique,
“Examining form and function of dendritic spines,”
Neural Plast., 2012 704103
(2012). http://dx.doi.org/10.1155/2012/704103 NEPLFE 0792-8483 Google Scholar
Y. Parket al.,
“Static and dynamic light scattering of healthy and malaria-parasite invaded red blood cells,”
J. Biomed. Opt., 15
(2), 020506
(2010). http://dx.doi.org/10.1117/1.3369966 JBOPFO 1083-3668 Google Scholar
B. Simonet al.,
“High-resolution tomographic diffractive microscopy of biological samples,”
J. Biophotonics, 3
(7), 462
–467
(2010). http://dx.doi.org/10.1002/jbio.200900094 JBOIBX 1864-063X Google Scholar
M. Kimet al.,
“Three-dimensional differential interference contrast microscopy using synthetic aperture imaging,”
J. Biomed. Opt., 17
(2), 026003
(2012). http://dx.doi.org/10.1117/1.JBO.17.2.026003 JBOPFO 1083-3668 Google Scholar
A. Kuset al.,
“Tomographic phase microscopy of living three-dimensional cell cultures,”
J. Biomed. Opt., 19
(4), 046009
(2014). http://dx.doi.org/10.1117/1.JBO.19.4.046009 JBOPFO 1083-3668 Google Scholar
Y. Cotteet al.,
“Marker-free phase nanoscopy (vol 7, pg 113, 2013),”
Nat. Photonics, 7
(5), 418
–418
(2013). http://dx.doi.org/10.1038/nphoton.2013.116 1749-4885 Google Scholar
M. Berket al.,
“From neuroprogression to neuroprotection: implications for clinical care,”
Med. J. Aust., 193
(4 Suppl), S36
–S40
(2010). MJAUAJ 0025-729X Google Scholar
J. L. LubyN. Navsaria,
“Pediatric bipolar disorder: evidence for prodromal states and early markers,”
J. Child Psychol. Psychiatry, 51
(4), 459
–471
(2010). JPPDAI Google Scholar
C. Vandeleuret al.,
“Mental disorders in offspring of parents with bipolar and major depressive disorders,”
Bipolar Disord., 14
(6), 641
–653
(2012). 69OWLE Google Scholar
E. Mesmanet al.,
“The Dutch bipolar offspring study: 12-year follow-up,”
Am. J. Psychiatry, 170
(5), 542
–549
(2013). http://dx.doi.org/10.1176/appi.ajp.2012.12030401 AJPSAO 0002-953X Google Scholar
F. Kapczinskiet al.,
“Peripheral biomarkers and illness activity in bipolar disorder,”
J. Psychiatry Res., 45
(2), 156
–161
(2011). http://dx.doi.org/10.1016/j.jpsychires.2010.05.015 JPYRA3 0022-3956 Google Scholar
G. I. Papakostaset al.,
“Assessment of a multi-assay, serum-based biological diagnostic test for major depressive disorder: a pilot and replication study,”
Mol. Psychiatry, 18
(3), 332
–339
(2013). http://dx.doi.org/10.1038/mp.2011.166 1359-4184 Google Scholar
S. M. WuK. Hochedlinger,
“Harnessing the potential of induced pluripotent stem cells for regenerative medicine (vol 13, pg 497, 2011),”
Nat. Cell Biol., 13
(6), 734
–734
(2011). http://dx.doi.org/10.1038/ncb0611-734b NCBIFN 1465-7392 Google Scholar
K. J. Brennandet al.,
“Modeling psychiatric disorders at the cellular and network levels,”
Mol. Psychiatry, 17
(12), 1239
–1253
(2012). http://dx.doi.org/10.1038/mp.2012.20 MOPSFQ 1359-4184 Google Scholar
N. Pavillonet al.,
“Cell morphology and intracellular ionic homeostasis explored with a multimodal approach combining epifluorescence and digital holographic microscopy,”
J. Biophotonics, 3
(7), 432
–436
(2010). http://dx.doi.org/10.1002/jbio.201000018 JBOIBX 1864-063X Google Scholar
P. Campagnola,
“Second harmonic generation imaging microscopy: applications to diseases diagnostics,”
Anal. Chem., 83
(9), 3224
–3231
(2011). http://dx.doi.org/10.1021/ac1032325 ANCHAM 0003-2700 Google Scholar
K. FujitaN. I. Smith,
“Label-free molecular imaging of living cells,”
Mol. Cells, 26
(6), 530
–535
(2008). MOCEEK 1016-8478 Google Scholar
N. PavillonA. J. HobroN. I. Smith,
“Cell optical density and molecular composition revealed by simultaneous multimodal label-free imaging,”
Biophys. J., 105
(5), 1123
–1132
(2013). http://dx.doi.org/10.1016/j.bpj.2013.07.031 BIOJAU 0006-3495 Google Scholar
BiographyPierre Marquet is an MD-PhD who has obtained his board certification in adult psychiatry. Before his medical studies, he obtained a master’s degree in physics from the Ecole Polytechnique Fédérale de Lausanne. He received a MD-PhD degree (MD-PhD fellowship from the Swiss National Science Foundation) in the field of digital holographic microscopy. He has been active for many years in the development of novel photonics-based techniques dedicated to address issues related to psychiatric neurosciences. |


