
|
|
1.IntroductionEpilepsy is a common neurological disorder in humans and it is known to be related to hyperactivity of neuronal circuits. Pharmacological therapy is efficient in the majority of the epilepsies, but a significant percentage of the patients are resistant to medication.1 In well circumscribed cases of pharmacologically resistant epilepsies, the seizure focus can be identified and the pathological neocortical tissue is neurosurgically removed. Healthy neocortical tissue is also routinely removed due to surgical technical reasons from patients with tumor but without epilepsy, when the pathological mass is localized in the subcortical areas. Comparing the morphology and activity of epileptic and nonepileptic human brain tissues offers an excellent possibility to investigate the normal and impaired neuronal mechanisms at the network, single cell, and subcellular levels. Spontaneous synchronous population activity (SPA) can be observed in vitro during an extracellular electrophysiological recording of local field potentials (LFPs) in epileptic human neocortical slice preparations in a physiological bathing medium (our data).2–4 These synchronous population bursts consist of rhythmically recurring extracellular LFP deflections associated with high frequency oscillations and an increased neuronal firing.2 Both glutamatergic excitatory and GABAergic inhibitory signaling are involved, with pyramidal cells show either depolarizing or hyperpolarizing and even mixed responses during SPA.2 imaging of neurons is widely used to monitor cellular activity in animal slice preparations (for review see Ref. 5); however, we have only limited knowledge of concentration changes in human neurons. Calcium imaging of human neurons was investigated in cells differentiated from induced pluripotent stem cell lines,6 and in cultured neurons of the enteric nervous system.7 Furthermore, a recent study shows spontaneous elevations in human neocortical and hippocampal astrocytes,8 but nothing is known about the intracellular properties of neurons derived from native human tissue of the central nervous system. While a two-photon imaging technique has high spatial resolution (), it can cover only a relatively small area of interest (with a high numeric aperture objective typically up to maximum of ). On the other hand, multiple channel extracellular electrophysiology can cover large cortical areas (3 to 4 mm) at the expense of its low spatial resolution (100 to ). The activity of neurons restricted to one or two cortical layers () can be monitored with two-photon imaging, whereas multiple channel extracellular electrophysiology is needed to record the activity of neurons through the entire depth (3 to 4 mm) of the human neocortex. The temporal resolution of the two techniques is also different: electrophysiological changes reflecting neuronal activity are considerably faster () than changes in intracellular (usually , but can be when using temporal super resolution microscopy9). Combining these two methods has several advantages. First, it helps us to gain more information on the role of different neurons in the emergence of population activity. Recording with the aid of the a linear multielectrode gives information about the fast electrophysiological properties of SPA, detected in all neocortical layers, whereas imaging reveals the activity of a relatively large group of neighboring neurons (tens of bolus loaded cells), and their contribution to the generation of SPA. In addition, two-photon microscopy can detect inactive neurons which are unnoticed in extracellular electrophysiological recordings. Second, the simultaneous use of imaging and whole-cell patch-clamp recording helps us to correlate electrophysiological activity and signals in human neurons. One can simultaneously observe and manipulate the membrane potential fluctuations of neurons with intracellular patch-clamp recordings and relate to changes in their concentrations. Completing these measurements with the detection of extracellular activity, we can relate electrophysiological and signals of neurons active during SPA. In addition to imaging, two-photon uncaging can be used to investigate the neuronal input-output functions and postsynaptic signal integration. Cell filling and anatomical reconstruction at the light and electron microscopic level may add important morphological information about the subcellular, cellular properties of neurons that respond or are silent during human neocortical SPA. Here, we report for the first time the two-photon imaging of human neocortical neurons. We show a method combining multiple channel extracellular electrophysiology, simultaneous intracellular recording, and two-photon imaging and uncaging supplemented by fine scale morphological analysis. We also describe the methodological difficulties we faced during our experiments. We discuss that this complex method is suitable to reveal subcellular, cellular, and network properties of human neocortical neurons engaged in spontaneous population activity. 2.Methods2.1.PatientsIn the present study—investigating human neocortical tissue slices—we included three patients with therapy resistant focal epilepsy (Pts 4, 5, 7, age: 26 to 52 years) and three patients with brain tumor but without epilepsy (Pts 1, 2, 6, age: 64 to 78 years). Additionally, there was one patient who had tumor associated epilepsy (Pt 3, age: 71 years). Tissue samples were derived from the temporal (Pts 2, 4, 5, 6, 7), parietal (Pt 1), and frontal (Pt 3) lobes. The seizure focus was identified by multimodal studies including video-electroencephalography monitoring and magnetic resonance imaging. Brain tumor was diagnosed by computed tomography and/or magnetic resonance imaging. The patients had subcortical tumors. We examined the neocortex above the tumor, which needed to be removed for surgical technical reasons. Patients underwent their surgery in the National Institute of Clinical Neuroscience in Budapest, Hungary. All patients gave written consent approved by the Regional and Institutional Committee of Science and Research Ethics of Scientific Council of Health (ETT TUKEB 20680-4/2012/EKU) in accordance with the Declaration of Helsinki. Neocortical samples were obtained from a total of 21 patients ( epileptic patients, age range: 19 to 71 years, (SD): and tumor patients, age range: 50 to 76 years, : ). We could not achieve satisfactory recordings in several cases ( epileptic and tumor patients), therefore, these patients were excluded from the data analysis. We always followed our standardized protocol (see below) but the tissue quality was unacceptable in these latter cases. Criteria for acceptable tissue quality were the following (1) cellular and/or population activity on the local field potential gradient (LFPg) or LFP recordings, (2) at least 25% of the cells looked healthy on the picture acquired with the transmission infrared mode of the two-photon microscope. 2.2.Tissue PreparationTissue was transported from the operating room to the laboratory in an ice cold solution containing (in mM) 248 D-sucrose, 26 , 1 KCl, 1 , 10 , 10 D-glucose, and 1 phenol red, equilibrated with 5% in 95% . Neocortical slices of thickness were cut with a vibratome (Leica 1000 S). They were transferred into a dual superfusion chamber mounted on a two-photon microscope. In this type of chamber, artificial cerebrospinal fluid (ACSF) is allowed to flow both above and below the slice, resulting in a good oxygen supply, and in more well maintained network oscillations.10–12 Slices were perfused with a warm (36°C) ACSF containing (in mM) 124 NaCl, 26 , 3.5 KCl, 1 , 1 , and 10 D-glucose, equilibrated with 5% in 95% . The high flow rate of the bathing medium was used to maintain the optimal oxygenation level of the tissue.10–13 Bolus loading of 1.75 mM Oregon Green 488 BAPTA-1 AM (OGB-1-AM), sulforhodamine 101 (SR-101), and 20% Pluronic F-127 in dimethyl sulfoxide was applied on the tissue (Invitrogen, Carlsbad, California) to visualize neurons and glial cells, respectively.9,14,15 Bolus loading was usually performed in a depth of about 120 to from the surface. 2.3.Electrophysiology RecordingsIntracellular patch-clamp recordings were made with glass electrodes (5 to ) filled with (in mM) 125 potassium gluconate, 20 KCl, 10 Hepes, 10 di-Tris-salt phosphocreatine, 0.3 Na-GTP, 4 Mg-ATP, 10 NaCl, 0.008 biocytin, and were completed with 0.06 Oregon green BAPTA-1 (OGB-1), and 0.1 Alexa594 (Invitrogen), in a depth of 30 to from the surface of the slice. Electrophysiological recordings were made using a MultiClamp 700B Amplifier (Axon Instruments, Foster City, California). Data acquisition was performed by using pClamp8 (Axon Instruments) and a custom made program written in MATLAB (The MathWorks, Natick, Massachusetts). Cells were held at in current clamp recordings. The extracellular LFPg was recorded with a linear multielectrode array (24 channels, distance between contacts: ,16–19 using a custom made voltage gradient amplifier (passband 0.01 Hz to 10 kHz). Signals were digitized with a 32-channel, 16-bit resolution analog-to-digital converter (National Instruments, Austin, Texas) at a 20 kHz sampling rate, using home written routines for LabView7 (National Instruments). The linear multielectrode was placed on the surface of the neocortical slice, perpendicularly to the pial surface. This way, the whole extent of the examined region was covered by the array so that extracellular recordings were made from each neocortical layer. LFP signals were recorded with an additional glass patch-clamp electrode filled with ACSF on the sites where the largest SPA was detected with the linear multielectrode, usually at a depth of from the surface of the slice. The LFP, LFPg, and whole-cell current clamp recordings were simultaneously registered with imaging (Fig. 1). Fig. 1Combined two-photon and electrophysiological recording of human neocortical neuronal populations. (a) Schematic drawing of the experimental design. Laminar recordings revealed the location of synchronous population activity (SPA) in human neocortical slices (brain slice). Simultaneous two-photon imaging, extracellular and intracellular recordings were made. Subsequently, intracellularly filled cells were anatomically analyzed using light- and electron microscopy, as well as reconstructed in three dimensions. (b) Laminar recordings were made in the human neocortex in vitro. The 24-channel linear multielectrode array was placed perpendicularly to the pial surface and covered the whole width of the neocortex, permitting recordings from each layer. LFPg recordings from 8 channels are shown in this figure. SPA (marked with black triangles) emerged in layers I-III in the neocortex of patient 1. (c) Two-photon image of a human neuronal population loaded with OGB-1-AM dye for population imaging. A pyramidal neuron was patch-clamped and filled with cell impermeable OGB-1 () and Alexa594 () through the recording pipette. The cell was recorded with a loose patch technique (see also d and e). Neuronal somata were scanned with constant speed along the white and colored lines while intermediate sections were jumped over within using a spline interpolated path (multiple line scanning method). Red and green photomultiplier (PMT) channel data are overlaid. (d) Simultaneous LFP, signal (), and loose patch-clamp recording during three successive spontaneous SPA events (black triangles). transients show the responses of eight neurons from the 18 recorded as shown in (c). Different colors of the signals represent different cells (middle traces). Note that three cells were responding to SPAs, but the other cells did not show increased levels. The intracellularly recorded cell (IC) shown in (c) was burst firing during SPA (bottom), which is also reflected in a simultaneous increase in the intracellular level (green line). Note the trial-to-trial variability in relative responses between neurons. (e) LFP signal of a spontaneous SPA event (black triangle) on an enlarged view with the corresponding responses (middle) recorded from the neuronal population shown in (c). Bottom, simultaneously recorded loose-patch signal (IC) from the neuron in (c). Note the large signal during the somatic AP burst associated to the SPA event (green line in the middle). 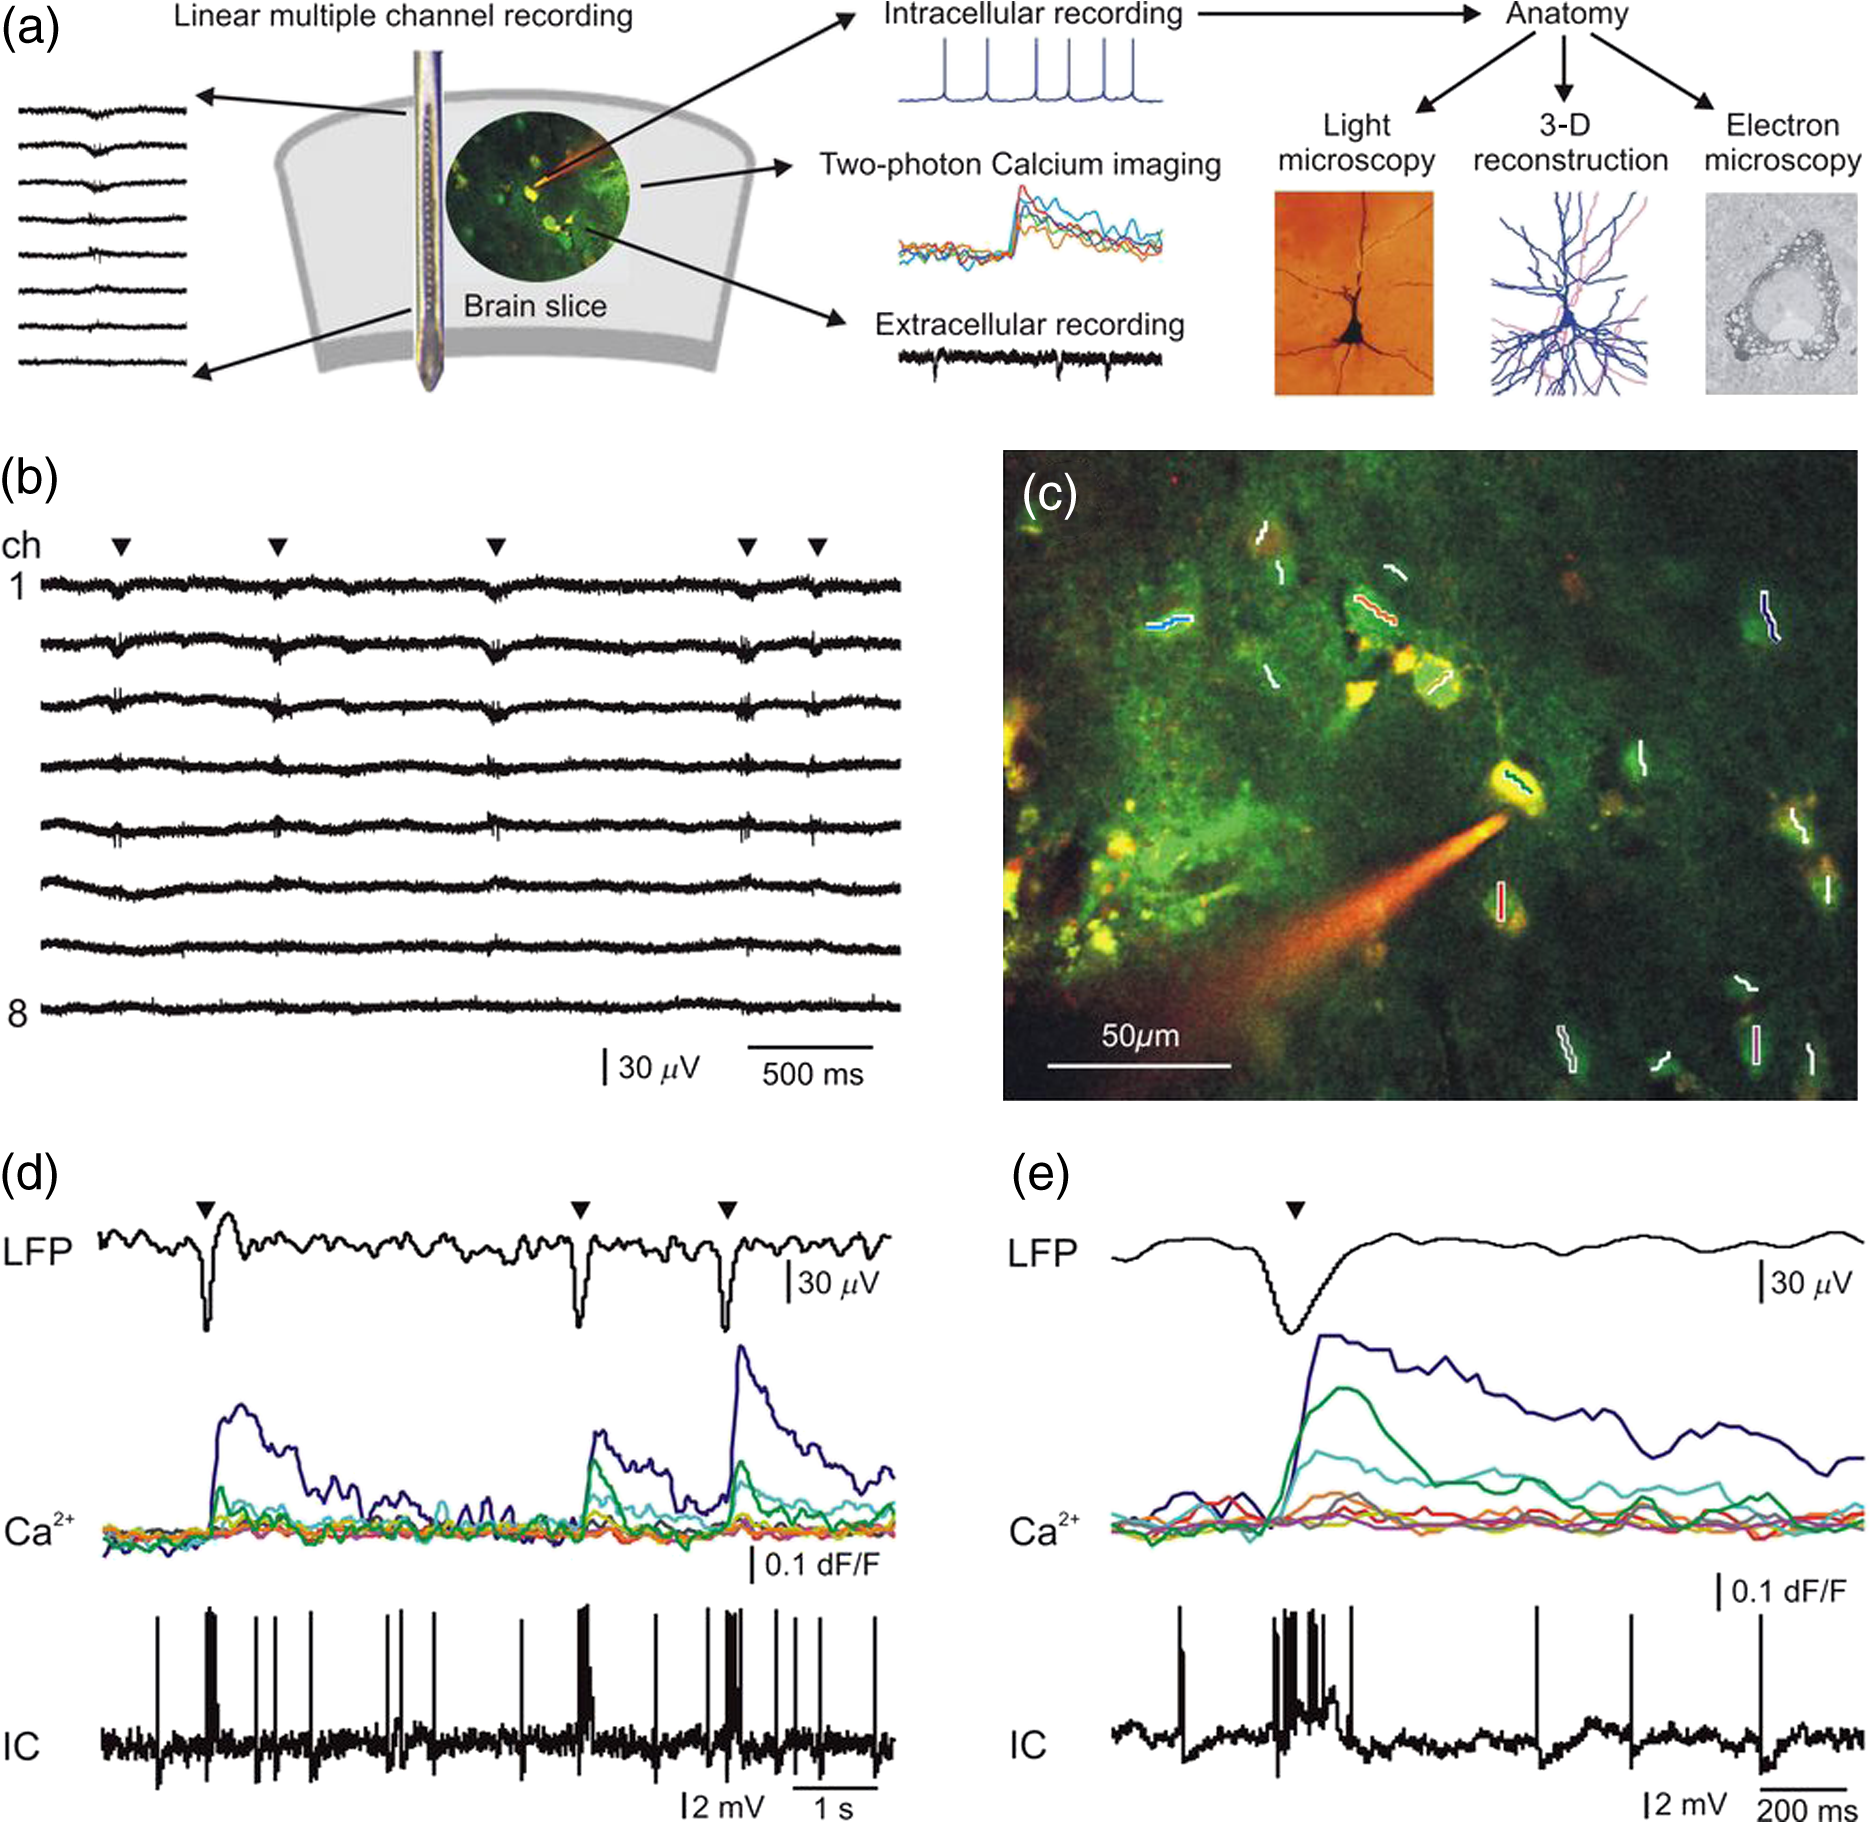 2.4.Multiphoton ImagingTwo-photon imaging was performed using a laser scanning system Femto2D-uncage (Femtonics, Budapest, Hungary). The imaging laser wavelength was set to 830 nm and to 840 nm in the uncaging experiments (Mai Tai HP Deep See, SpectraPhysics, Santa Clara, California or Chameleon, Coherent, Santa Clara, California). The excitation was delivered to the sample, and the fluorescence signal was collected using an lens (Olympus, Tokyo, Japan, , NA 1.0) and then separated using dichroic mirrors (700dcxru, Chroma Technology, Bellows Falls, Vermont) before the two channel detector unit which was sitting on the objective arm. For more technical details about the two-photon imaging system see Refs. 9, 11, and 12. To minimize photodamage, the laser intensity was always kept at the minimum required to attain a sufficient signal-to-noise ratio.13,20 Free line scans were placed following the curvature of long dendritic segments to monitor the backpropagating action potentials (AP) and uncaging induced signals.13 To measure population activity, neuronal somata were scanned with constant speed using lines which slightly extended the somata to decrease scanning-induced noise artifacts, while intermediate sections were jumped over within using a spline interpolated path (multiple line scanning method).21 As all unnecessary background areas were avoided in this way, the method provided an increased signal-to-noise ratio and a higher measurement speed. The scanning time of about 6 ms allowed us to analyze the spatiotemporal properties of compartments along long dendritic segments. Neuronal cell bodies were usually scanned at a depth of 80 to from the surface of the acute slices. For single cell recordings, we used additional OGB-1 (green) and Alexa594 (red) in the patch pipette for three reasons. First, the amount of OGB-1-AM taken by the cells is usually enough to only mark the cell bodies. Therefore, additional, cell impermeable OGB-1 was injected through the patch pipette which was diffused into the dendrites within 20 to 30 min. This allowed us to perform dendritic recordings. Second, the fluorescent mode of the two-photon microscope was used to reach the bolus loaded cells located in deeper regions of the slice. Then whole-cell recordings of some selected neurons were realized by shadow patching using the red signal of Alexa594. Third, in some cases, we increased the signal-to-noise ratio of our recordings by subtracting the red channel signal from the green channel signal. Intracellular recording started at 20 to 30 min after break-in with the patch pipette. At the end of each experiment, -stack images of the area of interest were taken. To monitor recording conditions and the potential photodamage, we repetitively measured responses induced by a burst of five AP (200 to 400 pA, 5 ms, at 35 Hz). We used a Femto2D microscope in a combination with Axon amplifiers (see above). Both the microscope and the electrophysiological equipment were shielded; therefore, no electric artifact was observed during scanning. We used an external shutter to switch on and off the laser which generated a small artifact at the beginning and at the end of the imaging and lines’ scanning. These artifacts could be easily recognized and were removed from the recordings. 2.5.Multiphoton Glutamate UncagingIn uncaging experiments, the bath solution was exchanged with ACSF containing 4-methoxy-7-nitroindolinyl (MNI)-caged L-glutamate trifuoroacetate (MNI-glutamate TFA; 2.5 mM; Femtonics, Budapest, Hungary). Fast photolysis of the caged glutamate was performed with ultrafast, pulsed lasers at 720 nm. Laser intensity was controlled with an electro-optical modulator in the Femto2D-uncage microscope. A motorized beam stabilization unit provided 100-nm radial and 300-nm axial precision in the overlapping of the imaging and uncaging point spread functions. The overlap was monitored by the transmitted infrared detector. Chromatic aberration was compensated for at the focal plane. Free line scanning of the dendritic segments was interleaved with uncaging periods when galvano mirrors jumped to the preselected locations (within 60 to jump time) and then returned to the scanning trajectory. The distance of uncaging locations from the activated dendritic segments was also monitored by measuring the fluorescence artifact and keeping it below a given critical value ( analog-to-digital converter unit at 90% photomultiplier saturation) during photostimulations. The uncaging evoked artifact was relatively small due to the strong infrared filtering before detectors and we also used the motion artifact correction program module of the Femto2D microscope to minimize dendritic excitation during uncaging. With the use of this program module, we were able to correct for the sample drift during measurements as well as to keep the relative distance between dendrite and uncaging locations. Therefore, the overlap between uncaging locations and the dendritic segment was minimal, which decreased the fluorescent artifact during uncaging. For more technical details about uncaging techniques see Refs. 12 and 13. 2.6.Data AnalysisLFPg data analysis was performed with Neuroscan Edit 4.5 program (Compumedics Neuroscan, Charlotte, North Carolina), and LFP and patch-clamp recordings were analyzed using the pClamp 8 program. Home written programs for MATLAB were used to analyze the data of two-photon imaging. The LFP signal was bandpass filtered between 1 and 30 Hz to determine the peak of the SPA. The peak of the SPA was set as time zero for further event related analyses. During intracellular signal detection, the baseline was set for each cell at 120 to 80 ms before the peak of each SPA. The transient was considered to be significantly increased when it passed two times the standard deviation (SD) of the baseline interval. For each cell during each SPA event, we determined whether or not its signal passed this significance level. 2.7.Cell MorphologyBiocytin was passively diffused into the cell through the patch pipette during intracellular recording. After recording, slices were maintained for at least 30 min in the recording chamber, and then fixed overnight in 4% paraformaldehyde with 15% picric acid in 0.1 M phosphate buffer (PB, pH 7.4) at 4°C. The slices were resectioned (Leica 1200 S, Wetzlar, Germany) at and freeze-thawed above liquid in 0.1 M PB containing 30% sucrose. Endogenous peroxidase activity was blocked by 1% in Tris-buffered saline for 10 min. Cells containing biocytin were revealed with the avidin-biotinylated horseradish complex reaction (Vector, 1.5 h, 1:250) using 3,3′-diaminobenzidine-tetrahydrochloride (Sigma, St. Louis, Missouri, 0.05 M in Tris-buffer, pH 7.6) as the chromogen. Sections were osmicated (20 min, 0.5% ), dehydrated in ethanol, and mounted in Durcupan (ACM; Fluka, Buchs, Switzerland). One biocytin-filled neuron was chosen to be digitally reconstructed in three dimensions using the NeuroLucida system (MicroBrightField Inc., Williston, Vermont). A shrinkage correction factor of 1.33 was used in the and -dimensions.22 Shrinkage in the -dimension was measured in 10 randomly chosen points in the section containing the cell body and was averaged. A shrinkage correction factor of 1.41 was applied in the -dimension. 2.8.Electron MicroscopyAfter light microscopic examination (and three-dimensional reconstruction of the chosen filled cell), areas of interest were re-embedded and sectioned for electron microscopy with a Leica ultramicrotome (Leica EM UT7). Ultrathin () serial sections were collected on Formvar-coated single slot grids, stained with lead citrate, and examined with a Hitachi 7100 (Hitachi, Tokyo, Japan) transmission electron microscope. 3.Results3.1.Recording the Spontaneous Network Activity by Simultaneous Ca2+ Imaging and Field-Potential MeasurementsThe LFPg was recorded in 22 human neocortical slices (9 slices from 3 tumor patients, and 13 slices from 4 epileptic patients) using the 24-channel laminar multielectrode. SPA was detected in 10 slices (4 slices from tumor patients, 6 slices from epileptic patients) by using the following procedure. The multielectrode was placed on the surface of the slice perpendicular to the pial surface, allowing electrophysiological recordings from all neocortical layers. The slices were mapped to localize the areas generating SPA by recording every 300 to 400 μm from one end of the slice to the other end [Figs. 1(a) and 1(b)]. After mapping the neocortical slices with the laminar multielectrode, regions where SPA could be detected with LFPg recording were chosen for further two-photon imaging and intracellular patch-clamp recordings. Bolus loading was performed on the sites where SPA had the largest LFPg amplitude, and additional extracellular LFP signals were recorded with a glass patch pipette filled with ACSF at the site of the bolus loaded cells. This way we could effectively record the SPA generation associated signals with two-photon imaging in human neuronal populations. The multielectrode array measured neuronal activity in the entire width of the examined neocortical region near the site of the bolus loading. We simultaneously recorded the LFP signal of the SPAs and the signals of the loaded neurons in 6 slices. In the remaining 4 slices, SPA could not be detected after bolus loading. In the slices with detectable SPA, a frame scan was taken after bolus loading, then cells were selected for fast measurement [Fig. 1(c)] and were measured using the multiple line scanning method.13 The advantage of this method is that it increases the product of the measurement speed and signal collection efficiency23 resulting in a high measurement speed and increased signal-to-noise ratio [Figs. 1(c)–1(e)]. We simultaneously recorded the LFP signal of the SPAs and the somatic signal of 31 neurons in 2 slices from tumor patients and 55 neurons in 4 slices from epileptic patients (Table 1). Table 1Examination of cellular activity during synchronous population activity (SPA) with two-photon Ca2+ imaging in epileptic and nonepileptic tissue.
A relative increase in signal from the baseline larger than SD of the baseline was taken as a significant response. The baseline was measured from to before the peak of every SPA event. Based on their response rate, we divided neurons into four subcategories. Beside silent cells, the neurons showing at least one significant response were taken as responding cells. We defined occasionally responding cells as cells which showed significant signals during of the SPA events. Nonreliably responding cells were defined with their 20% to 40% response rate during the SPA events, whereas reliably responding cells showed responses to of the SPA events. With this method, we identified 22 silent cells (68%), 4 occasionally cells (13%), 1 nonreliably cell (3%), and 5 reliably responding (16%) cells in the tumor tissue. The distribution of the responding cells was considerably different in epileptic tissue: we found 19 silent cells (35%), 20 occasionally cells (36%), 11 nonreliably cells (20%), and 5 reliably (9%) responding cells (Table 1). 3.2.Intracellular RecordingsBased on the responses of the cells within the region of interest, we chose nonreliably or reliably responding neurons for further intracellular recording. Whole-cell ( neurons) or loose patch-clamp ( neurons) recordings were made to reveal the electrophysiological activity of the given cell. We performed simultaneous LFP, somatic membrane potential, and recordings. The responses of the patched neurons and also the neighboring cells were detected [Figs. 1(c)–1(e)]. Based on the morphology revealed by the fluorescent dyes, electrophysiological recording was made from 3 pyramidal cells and 6 interneurons. The firing pattern and intrinsic electrophysiological properties of these neurons showed high similarities to those described in earlier studies (for review see Ref. 24). We examined the somatic and dendritic responses of both interneurons [, Figs. 2(a)–2(e)] and pyramidal cells [, Figs. 3(g)–1(i)], together with their somatic electrophysiological activity. Both the somatic [Figs. 1(d), 1(e), 3(a), and 3(b)] and the dendritic [Figs. 2(b) and 3(i)] signals of human neurons were comparable to those found in animal tissue (for review see Ref. 5). As has been described in animal models,25,26 positive correlation between the number of the somatic AP and the amplitude of the dendritic signal was observed [Figs. 2(b) and 3(i)]. Briefly, bursts of AP generated in pyramidal cells ( cells) and multiple AP detected in interneurons ( cells) resulted in larger dendritic increase than single AP. Only single AP but no bursts or multiple AP were recorded in the remaining one pyramidal cell and two interneurons. A detailed future study is needed to exactly correlate somatic electrophysiological recording with the somatic and dendritic signals of both human pyramidal cells and interneurons. Fig. 2Two-photon measurements of human interneurons. (a) Top, maximum intensity -projection image of a human aspiny neocortical interneuron with a dendritic segment selected for free line scanning (white dashed line). Only the red PMT channel data are shown. Bottom, response measured along the white dashed line plotted as a function of distance along the dendrite and time. Responses were spatially normalized to the background fluorescence level. (b) Top, spatial integral of the dendritic response shown in (a). Bottom, simultaneously recorded somatic membrane potential. Dashed gray lines mark the initiation and termination of short temporal intervals with high AP number and dotted lines mark single APs. Note the synchronous increase in average dendritic response during the periods with multiple APs. (c) Light microscopy image of the interneuron shown in (a). The cell was filled with biocytin and was processed for anatomy following the two-photon experiment. (d) Top, maximum intensity -projection image of a different human neocortical interneuron. Only the red channel data are shown. Middle, dendritic segment with the uncaging locations (white spots). Blue line indicates the scanning path of free line scanning. Bottom, response, recorded along the blue line in the middle, was normalized to the background fluorescence level and plotted as a function of dendritic distance and time. response was evoked by two-photon glutamate uncaging in the white points. Uncaging time is indicated by black arrowhead. (e) Top, spatial average of five responses detected in the dendritic segment shown in (d). Bottom, simultaneously recorded somatic membrane potential. Note that both the uncaging evoked EPSP (black arrowhead) and the somatic current injection induced AP were associated with an increase in dendritic level, but uncaging evoked a much larger response. 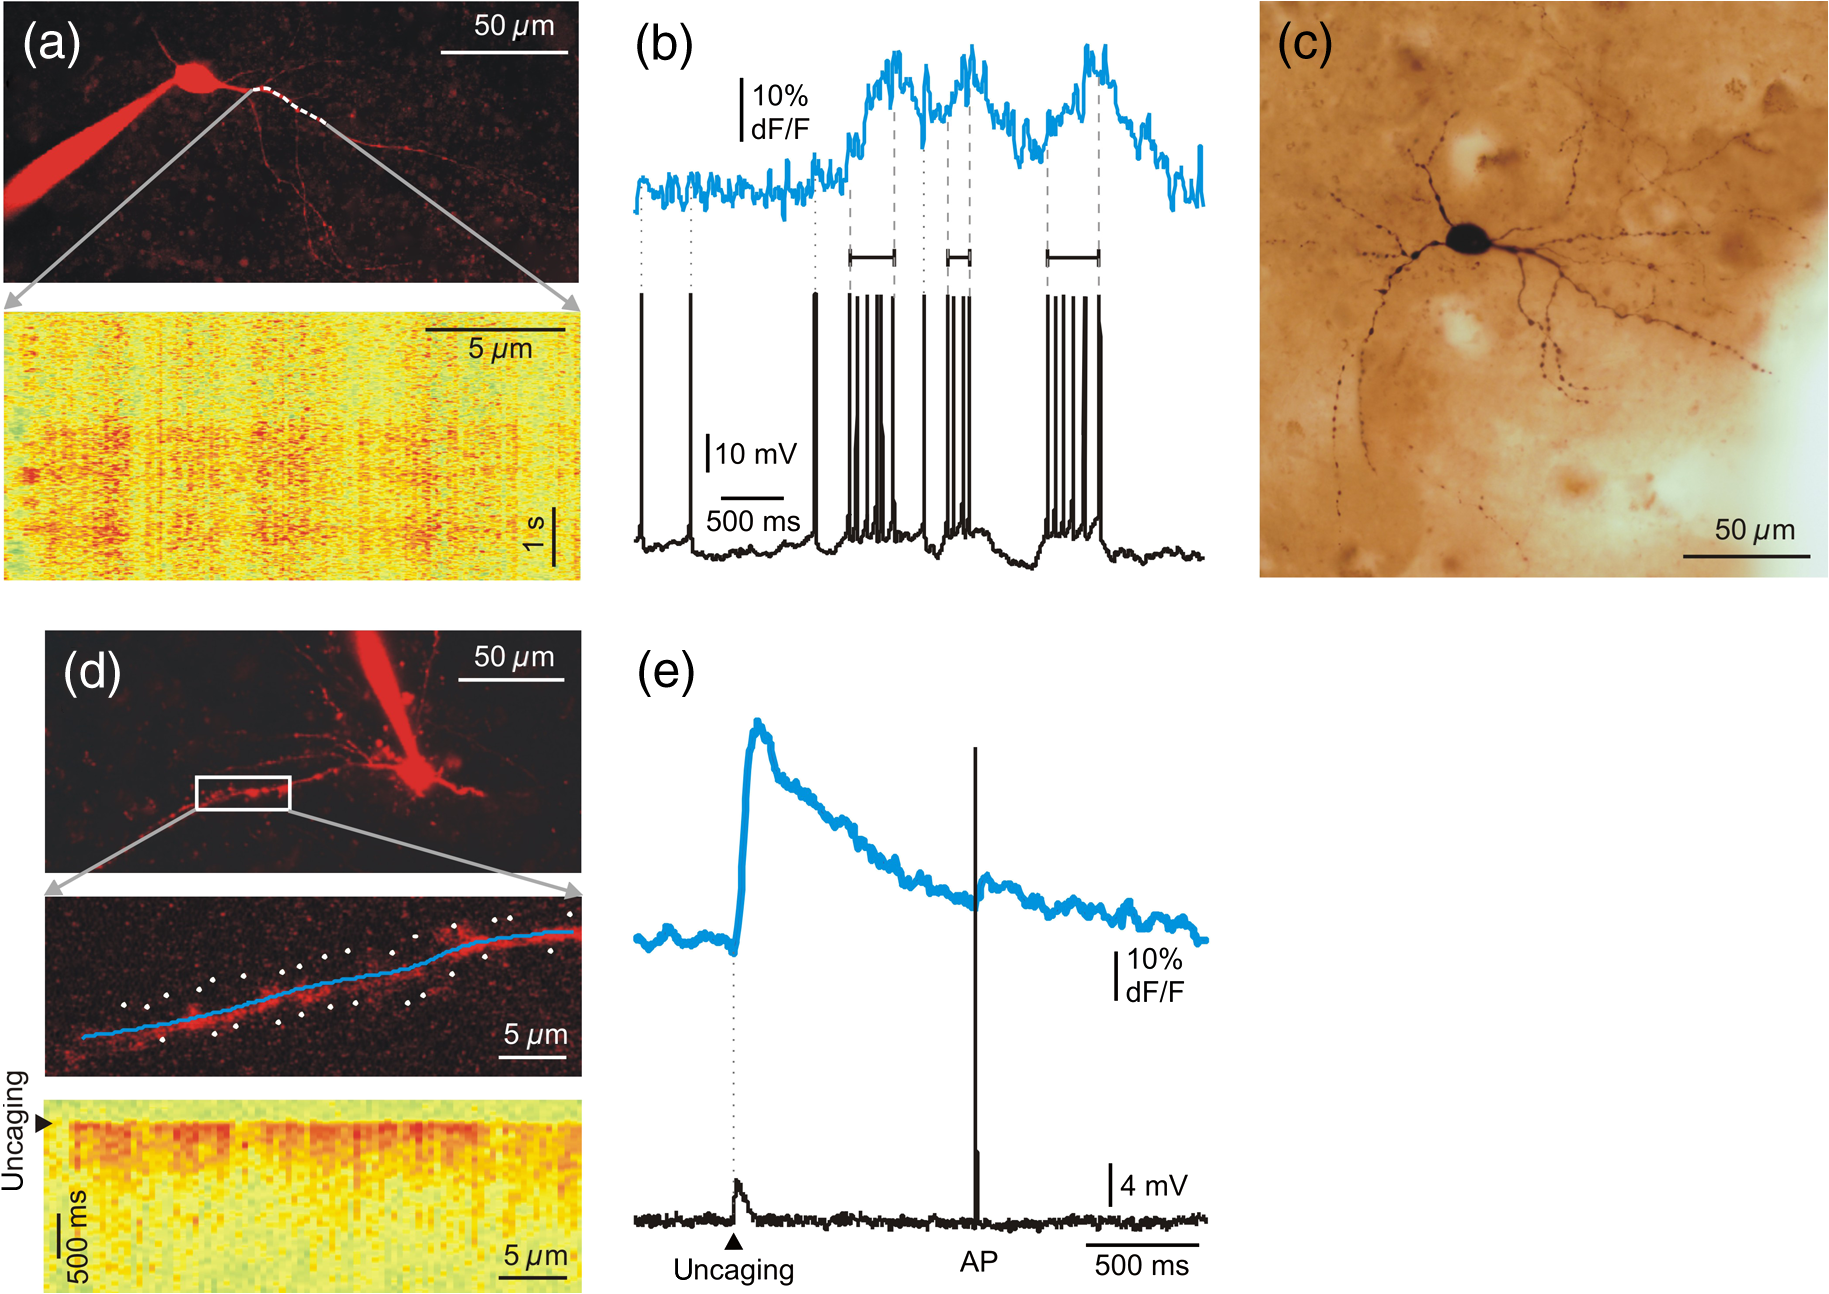 Fig. 3Two-photon measurements of human pyramidal cells. (a) Top, maximum intensity -projection of a neuronal population from a human neocortical slice loaded with OGB-1-AM and SR-101. White lines and numbers indicate regions of interest selected for multiple line scanning, and cover nine neurons. Red and green PMT channel data are overlaid. Bottom, corresponding representative response recorded along the white lines in top panel is plotted as a function of distance along line and time after normalization for the background fluorescence intensity. signal of 9 cells out of the 13 recorded are indicated with numbers and brackets. (b) Top, spatial average of response for cell #6 shown in (a). Bottom, response for cell #6 as in (a), but data were recorded with a higher spatial discretization and were rotated by 90 deg before plotting. (c) Maximum intensity -projection image of a population of human neurons loaded with OGB-1-AM dye. The neuron corresponding to region #6 [same as in (a) and (b)] was loaded through the recording pipette with the cell impermeable green dye, OGB-1, the red Alexa594 and biocytin before whole-cell recording. Red and green PMT channel data are overlaid. White lines and numbers indicate the same regions of interest as in (a). (d) Light micrograph of the cell #6 shown in (c), processed for anatomy. The axon initial segment is marked with arrow. (e) The dendritic (blue) and axonal (pink) arbor of the pyramidal cell #6 in (c) was reconstructed in three dimensions. (f) The electron microscopic investigation of the same cell (#6) showed large empty spaces (vacuoles) in the cell body. The neighboring neuron [identified in (a) as #9] is a healthy pyramidal cell without large somatic vacuoles. (g) Maximum intensity -projection image of a different human neocortical pyramidal cell, red channel data. (h) Enlarged view of the dendritic segment shown in the white box in (d). Blue line indicates free line scan. (i) Top, spatial average of dendritic response recorded along the blue line in (h). Middle, simultaneously recorded somatic membrane potential responses. Bottom, enlarged view of AP bursts. The amplitude of the dendritic signal correlated well with the number of somatic APs. Note that the rising and decay phase of the pyramidal cell dendritic signal is steeper than that of the interneuron shown in Fig. 2. 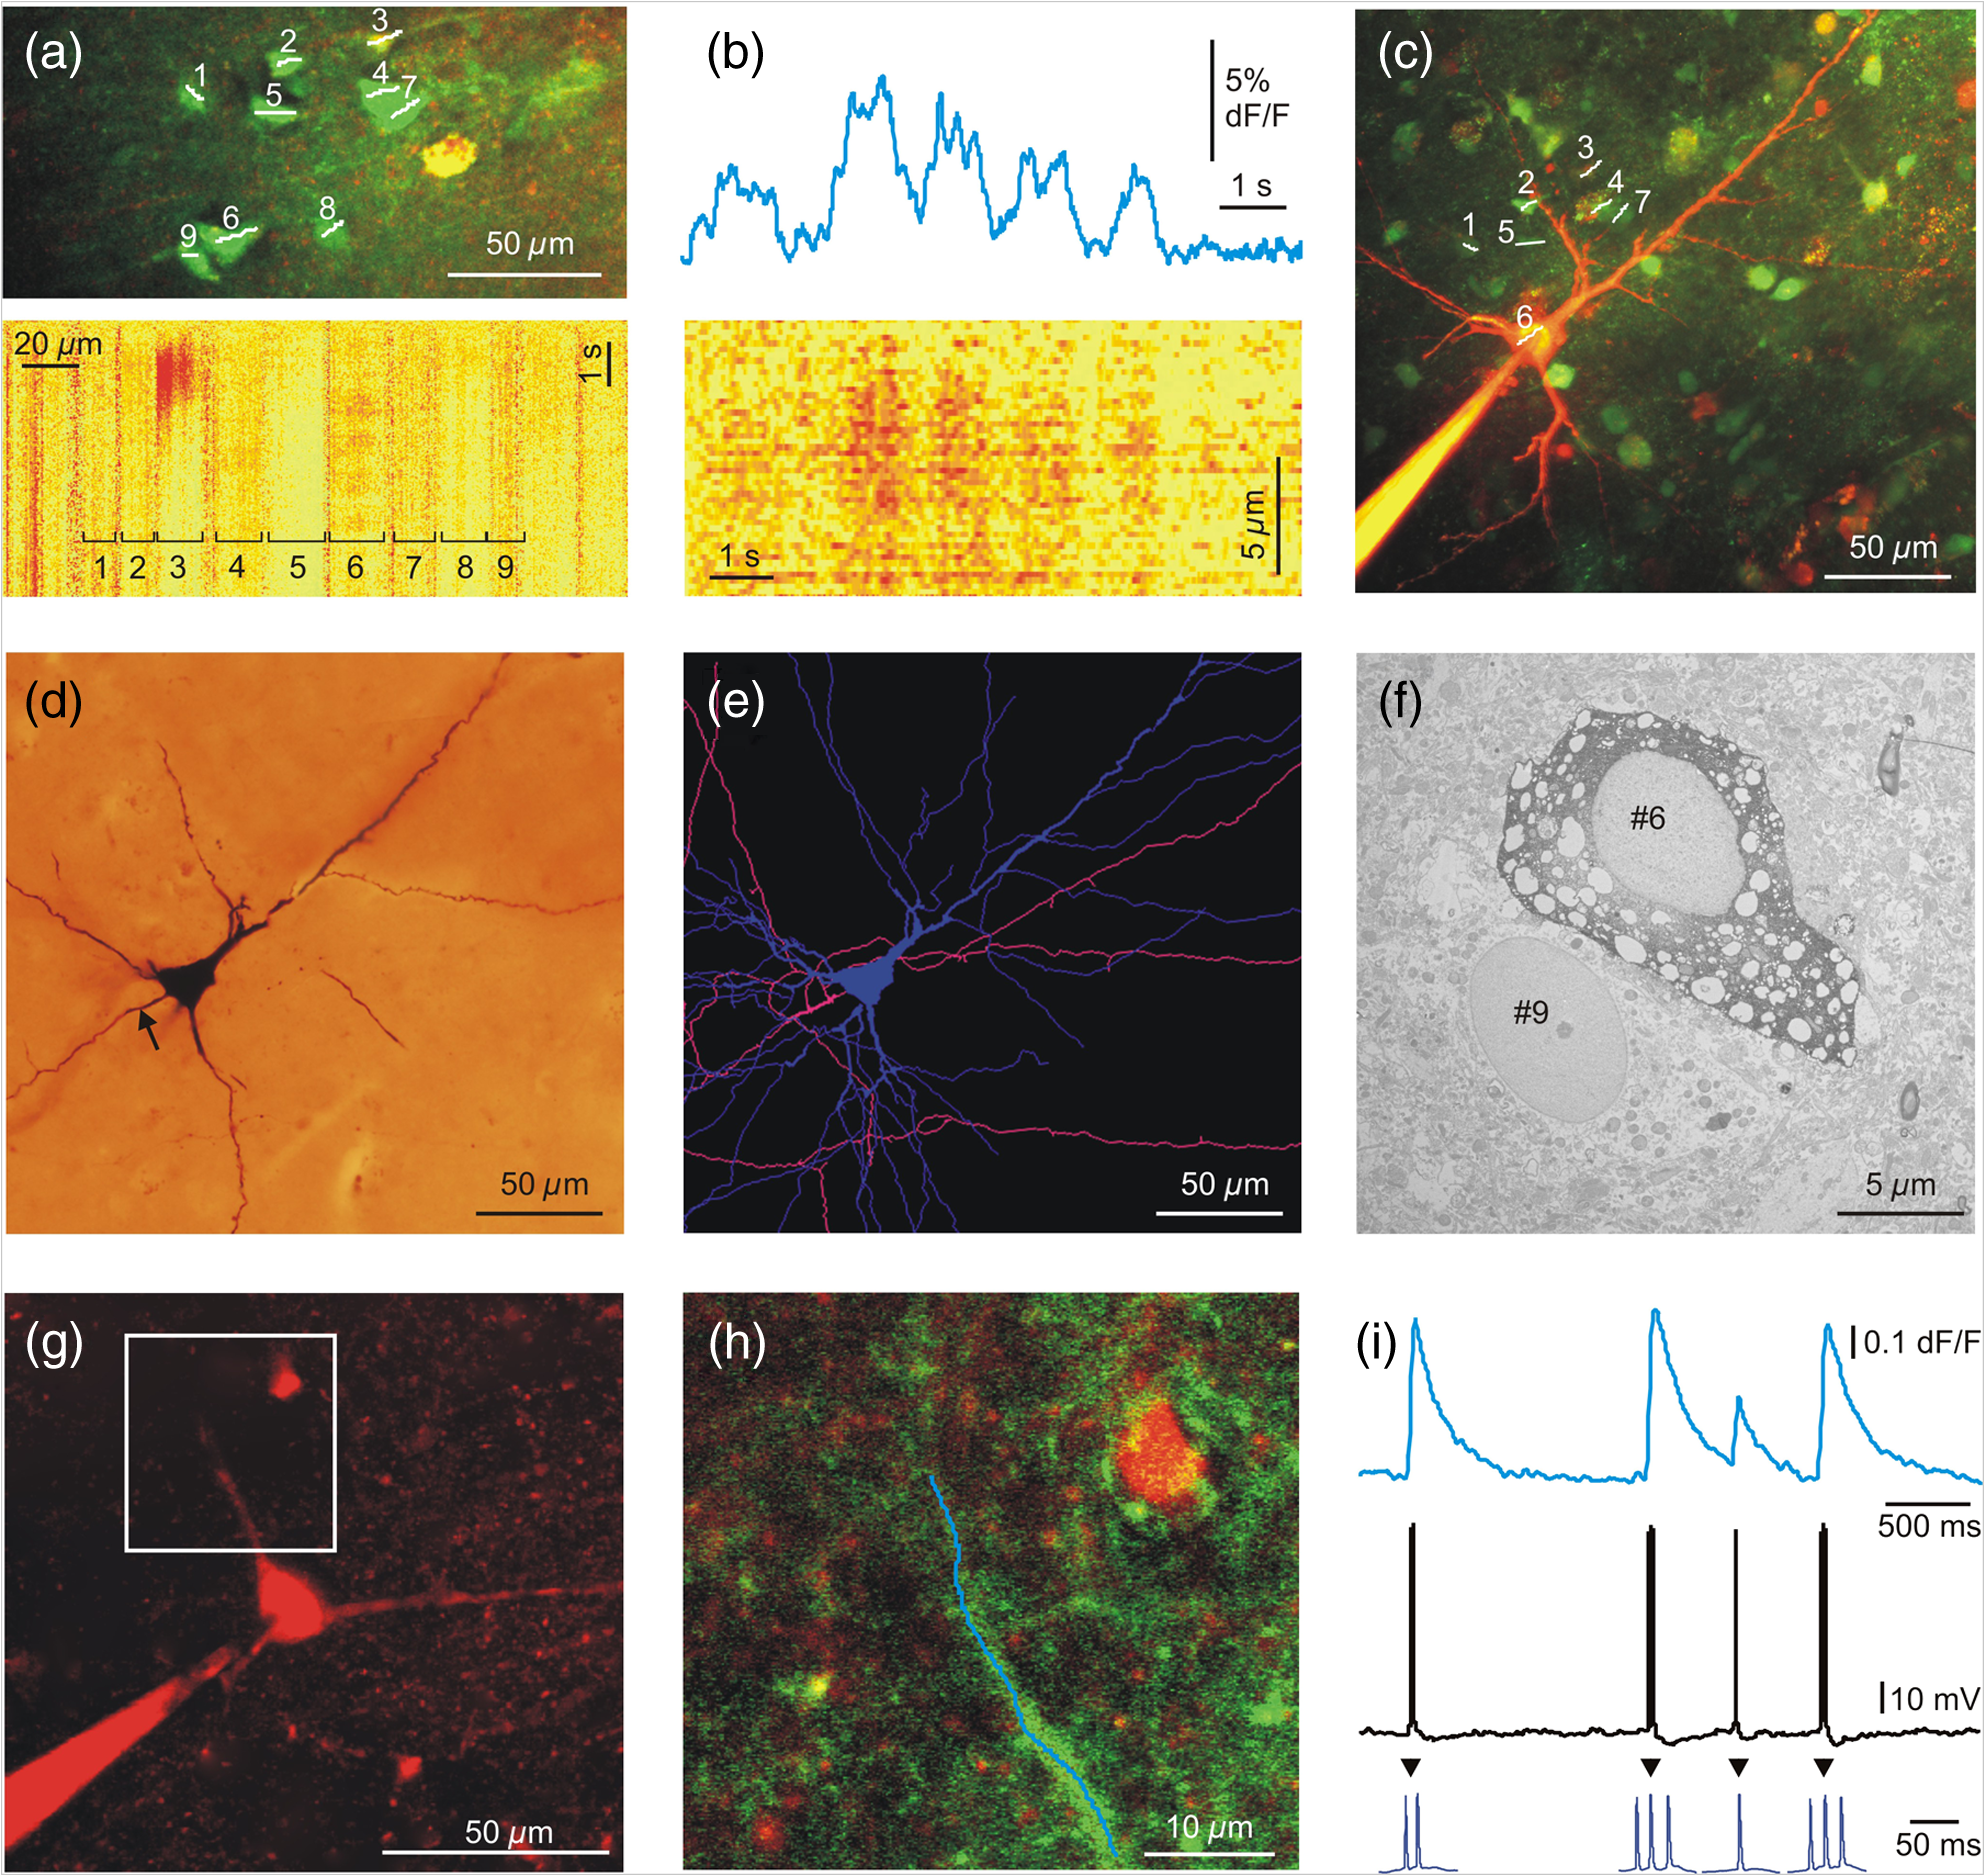 Measurement of input-output functions of cortical pyramidal cells and interneurons is important to understand dendritic integration and neuronal computation.12,13,27–30 As human neurons have more complex dendritic branching compared to animals (see the dendritic length of our reconstructed pyramidal cell and Ref. 31), we expect a more complex human dendritic arithmetic. Two-photon uncaging is widely used to investigate the neuronal input–output functions and postsynaptic signal integration. Similar to experiments performed in rodents,12,13 we were able to induce large postsynaptic membrane potential and dendritic responses with spatially and temporally clustered input patterns which activated short dendritic segments [Figs. 2(d) and 2(e)]. 3.3.AnatomyIntracellularly recorded cells were filled with biocytin () and were processed for anatomy. The successfully filled neurons showed the morphology of either pyramidal cells () or interneurons (). The pyramidal cells displayed a long and thick apical dendrite and numerous thin basal dendrites (Fig. 3), while the interneurons appeared as small multipolar cells with shorter smooth dendrites (Fig. 2). The whole dendritic and axonal arbor of one well-filled neocortical layer III pyramidal cell was chosen to be reconstructed in three dimensions [from Pt 7, Fig. 3(e)]. Out of the four filled cells, this was the only neuron having an apparently complete (and well filled) dendritic arbor, as well as filled axons. Two other cells were not completely filled, i.e., they possessed pale dendritic segments and had no filled axons. The cell body of one neuron was close to the surface of the slice (within ) and part of its dendritic tree was cut during slice preparation. The apical dendrite of the reconstructed cell was long, the sum of the length of its basal dendrites was , and the length of all the axonal segments was . It far exceeds the dendritic length of pyramidal cells in monkey temporal cortex, even though they were labeled in vivo.32 Pyramidal cells of the rodent neocortex also possess considerably shorter dendritic lengths.33–36 3.4.Electron MicroscopyWe examined the filled and reconstructed pyramidal cell at the electron microscopic level. Large vacuoles were found in the cell body and the dendrites of the cell [Fig. 3(f)], while outside these areas mitochondria and other organelles such as endoplasmic reticulum seemed to be intact. We found numerous axon terminals forming either asymmetrical (presumably excitatory) or symmetrical (presumably inhibitory) synapses on the dendrites of the filled cell. We could not find synapses innervating the cell body of this pyramidal cell, but we observed several symmetrical synapses terminating on its axon initial segment. The axon terminals of the filled cell formed asymmetrical synapses with nonstained dendrites and spines. We hypothesized that the presence of vacuoles is the result of our methodological procedure. First, applying OGB-AM and SR-101 for bolus loading may change the structure of the neurons. Second, the long time (several hours) spent in the recording chamber might also affect the survival of the cells. And third, the patch-clamp procedure (mechanical damage caused by the pipette, as well as the intracellular use of a high concentration of the fluorophores Alexa594 and OGB-1) might also trigger changes in cellular ultrastructure. To test these hypotheses, we made further electron microscopic examinations. First, we examined 62 nonfilled cells (45 neurons and 17 glial cells) in the vicinity of the biocytin-filled cell. Based on the low-magnification frame scan taken during the two-photon experiment, these cells were located within the region of bolus loading. We could not see large vacuoles in any of the bolus loaded cells. Next, we checked 61 cells (43 neurons and 18 glial cells) in the same slice in a region, where bolus loading was not performed. Both blocks were re-embedded from neocortical layer 3 of the same slice, with a distance of between them. None of the nonloaded cells displayed similar vacuoles in their somata. We made further experiments to test the hypothesis that several hours of in vitro conditions might induce the formation of somatic vacuoles. We re-embedded one block from Pt 4 from a slice which spent 6 h in the recording chamber and another block from the same tissue sample (from the same part of the gyrus) which was fixed immediately after the cutting procedure. We examined 35 neurons and 22 glial cells from the recorded tissue slice and 43 neurons and 25 glial cells from the immediately fixed tissue sample. Large vacuoles were not observed in these cells. In summary, large vacuoles were seen only in the intracellularly recorded and filled cell, pointing toward the hypothesis that our combined patch-clamp recording and two-photon imaging induced the formation of the somatic vacuoles. 4.DiscussionTwo-photon imaging is widely used to reveal subthreshold and suprathreshold neuronal activity in rodent neocortical and hippocampal slice preparations.5 Somatic, dendritic, and axonal signals were also correlated with somatic electrophysiological and LFP recordings in these animal models,11,37 but very little is known about the intracellular signaling of single human neurons and neuronal populations. The aim of the present technical report is to demonstrate that these fundamental measurements can be achieved in human neurons following similar methodological procedures to those used in animals. Furthermore, we wished to show that combining different electrophysiological and optical methods in human neocortical slice preparations can give valuable information about the cellular and network properties of cortical synchronization processes. Recording in human brain tissue is very valuable in order to gain information about the characteristics of human neurons and relate it to animal models. The present study is the first to show that the dynamics of human neurons are comparable to those found in animals. We demonstrate that the use of appropriate methodological procedures provides high quality data about the somatic and dendritic signals of individual neurons and populations of human neocortical cells. During our experiments, we noticed the high variability of tissue quality, even though we followed our standardized protocol. Several reasons might account for this phenomenon, which is not usually reported in studies using animals. The age of the patients varied from young adults to elderly (19 to 78 years), while research groups working on animal models usually use young animals of the same age group. Furthermore, we cannot exclude the possibility that differences in the pathology and in surgery conditions of our patients might also account for the considerable variance of tissue quality. We concluded that valuable electrophysiological, two-photon imaging, and anatomical results could be obtained if the tissue quality was acceptable. Here, we have adopted and used an improved version of a dual superfusion chamber,10,11 which provided excellent tissue oxygenation to maintain network activity and allowed simultaneous imaging and two-photon uncaging experiments during population activity. The high signal-to-noise ratio obtained in our measurements has not only been enhanced by the high numerical aperture of the water-immersion objectives, but also by the use of our multiple line scanning method. The techniques used in our study are complementary in several ways: two-photon imaging records the activity of large populations of neighboring neurons although at a low temporal scale, whereas multiple channel electrophysiology records the activity of a few cells distributed along the entire width of the cortex and at a high temporal scale. This allows us to examine larger and more complex neuronal populations than any of the mentioned techniques alone. One of the main advantages of our combined method is that it allows simultaneous optical and electrophysiological examination of human neurons and neuronal assemblies with high spatial and temporal resolutions. Subsequent anatomy is a useful tool to reveal differences in the fine structure of the human cortex related to the pathology of the patient, or to the capability of SPA generation. Anatomical examination of intracellularly filled human neurons could reveal possible differences between cells participating versus not participating in the generation of SPA, and between cells located in regions where SPA is present versus regions outside of SPA, as well as between cells derived from epileptic versus tumor patients. Our study reported a technical difficulty associated with the imaging of living cells. Although our intracellularly labeled cells looked healthy in the light microscope (Fig. 3), we observed large autophagic vacuoles in the somatodendritic compartment of the examined neurons at the electron microscopic level (see also supplementary material of Ref. 38). The intracellular recording technique per se was not related to the presence of vacuoles, whether it was performed with sharp electrodes (e.g., see Refs. 39 and 40) or by the patch-clamp technique (for example see Refs. 41 and 42). Our electron microscopic studies also suggest that this phenomenon is attributed to photodamage. Oxygen radicals generated during illumination and photobleaching of intracellular fluorophores43,44 induce ultrastructural changes in the cell, such as inactivation of proteins43,45,46 and formation of autophagic vacuoles.47 This phenomenon is exploited in a developing powerful technique called chromophore-assisted laser inactivation, which is used as a potent cell biology technique and as a therapeutic tool in cancer research (for review see Ref. 46). At the same time, imaging caused photodamage has never been directly addressed in neuronal tissue. We tried to minimize photodamage by using line scans and by keeping the laser intensity at the minimum required to attain a sufficient signal-to-noise ratio. We could not see changes in the physiology of the neurons during recordings or signs of cell degeneration at the light microscope, but photodamage became evident when examined with electron microscopy. We hypothesize that the presence of autophagic vacuoles was in correlation with the use of high concentrations of intracellular fluorophores and laser illumination. High spatial resolution fluorescent image stacks were taken from the intracellularly labeled cell at the end of the experiment, raising the additional possibility that—at least part of—the vacuoles might have been formed after the electrophysiological and optical recordings. The physiological and pathological roles of autophagy have been widely studied,48 but no data are available about the effects of autophagic vacuoles on neuronal electrophysiology and survival. In summary, our results suggest that photodamage induced autophagic vacuoles do not considerably alter neuronal electrophysiology over a short term. Future detailed studies are needed to reveal the long-term effects of autophagy on cellular and network activity in the neocortex. We performed simultaneous correlated somatic whole-cell, LFP and intracellular measurements during conditions when the network of human neurons showed synchronous discharges. Electrophysiological recordings of synchronous population events in the human neocortex were already performed in vitro describing the responses of single neurons.2 Our multimodal approach allows us to record the simultaneous activity of large neuronal populations together with the intracellular response of selected single neurons. In addition, imaging of neuronal populations revealed the relatively high percentage of silent cells (35% of the cells in epileptic and 67% in tumor tissue) which were unnoticeable in electrophysiological recordings. We demonstrated that higher proportions of neurons participate in the generation of SPA in slices from epileptic (65% of the cells) than from tumor (32% of the cells) patients (Table 1). The ratio of cells responding to of the SPA events is also higher in epileptic tissue (29% versus 19% in epileptic versus tumor tissue), even if the proportion of reliably responding cells was lower in epileptic tissue. This suggests that, in the human epileptic neocortex, more neurons are contributing to network synchrony, although with a lower precision. This network phenomenon is similar to the cellular properties observed in epileptic rats,49 where an enhanced synaptic activity and a lower spike-timing reliability have been shown to induce synchronies related to epilepsy (fast ripples). The epilepsies are a serious health problem affecting a large percentage of human populations during their lifetime. Our multimodal and multiscale approach could help to clarify the abnormalities in cellular and network properties that underlie this pathology, providing both a better understanding of the disease and, eventually, contributing to better therapeutic approaches to the treatment of neocortical epilepsies. Future therapeutic strategies that consider data from human neural tissue will better facilitate the development of new, more efficient drugs or other treatments that prevent epileptic seizures and/or alleviate epilepsy caused damage. The detailed analysis of human epileptic tissue is required to promote pharmaceutical research, but is also crucial for the development of new, more realistic animal models. Animal models are necessary to better understand the mechanisms, causes, and consequences of epilepsy. However, results derived from animal models must be compared to and contrasted with human data if they are to provide valuable information about human disease. AcknowledgmentsHungarian-French Grant TÉT_10-1-2011-0389, GOP-1.1.1-08/1-2008-0085, Swiss-Hungarian Grant SH/7/2/8, KTIA (KMR_12-1-2012-0214), Hungarian Grant OTKA PD91151, Bolyai Research Fellowship (to L.W.), KTIA_NAP_13 and TÁMOP 4.2.1.B11/2/KMR2011-0002. TÁMOP 4.2.4.A/1-11-1-2012-0001 Nemzeti Kiválóság Program, FP7-ICT-2011-C 323945 (3x3D imaging). B.R. is founder of Femtonics Ltd. (Budapest, Hungary) and is a member of its scientific board. ReferencesM. J. Morrell,
“Epilepsy: diagnosis and treatment in the 21st century,”
CNS Spectr., 6
(9), 749
(2001). ORVOBF 0030-6045 Google Scholar
R. Kohlinget al.,
“Spontaneous sharp waves in human neocortical slices excised from epileptic patients,”
Brain, 121
(6), 1073
–1087
(1998). http://dx.doi.org/10.1093/brain/121.6.1073 BRAIAK 0006-8950 Google Scholar
P. A. SchwartzkroinW. D. Knowles,
“Intracellular study of human epileptic cortex: in vitro maintenance of epileptiform activity?,”
Science, 223
(4637), 709
–712
(1984). http://dx.doi.org/10.1126/science.6695179 SCIEAS 0036-8075 Google Scholar
A. K. Roopunet al.,
“A nonsynaptic mechanism underlying interictal discharges in human epileptic neocortex,”
Proc. Natl. Acad. Sci. U. S. A., 107
(1), 338
–343
(2010). http://dx.doi.org/10.1073/pnas.0912652107 PNASA6 0027-8424 Google Scholar
C. GrienbergerA. Konnerth,
“Imaging calcium in neurons,”
Neuron, 73
(5), 862
–885
(2012). http://dx.doi.org/10.1016/j.neuron.2012.02.011 NERNET 0896-6273 Google Scholar
G. S. Belinskyet al.,
“Patch-clamp recordings and calcium imaging followed by single-cell PCR reveal the developmental profile of 13 genes in iPSC-derived human neurons,”
Stem Cell Res., 12
(1), 101
–118
(2014). http://dx.doi.org/10.1016/j.scr.2013.09.014 SCRTDJ 1873-5061 Google Scholar
W. Boesmanset al.,
“Imaging neuron-glia interactions in the enteric nervous system,”
Front. Cell. Neurosci., 7 183
(2013). http://dx.doi.org/10.3389/fncel.2013.00183 FCNRAH 1662-5102 Google Scholar
M. Navarreteet al.,
“Astrocyte calcium signal and gliotransmission in human brain tissue,”
Cereb. Cortex, 23
(5), 1240
–1246
(2013). http://dx.doi.org/10.1093/cercor/bhs122 53OPAV 1047-3211 Google Scholar
G. Katonaet al.,
“Fast two-photon in vivo imaging with three-dimensional random-access scanning in large tissue volumes,”
Nat. Methods, 9
(2), 201
–208
(2012). http://dx.doi.org/10.1038/nmeth.1851 1548-7091 Google Scholar
N. Hájoset al.,
“Maintaining network activity in submerged hippocampal slices: importance of oxygen supply,”
Eur. J. Neurosci., 29
(2), 319
–327
(2009). http://dx.doi.org/10.1111/ejn.2009.29.issue-2 EJONEI 0953-816X Google Scholar
B. Chioviniet al.,
“Enhanced dendritic action potential backpropagation in parvalbumin-positive basket cells during sharp wave activity,”
Neurochem. Res., 35
(12), 2086
–2095
(2010). http://dx.doi.org/10.1007/s11064-010-0290-4 NEREDZ 0364-3190 Google Scholar
B. Chioviniet al.,
“Dendritic spikes induce ripples in parvalbumin interneurons during hippocampal sharp waves,”
Neuron, 82
(4), 908
–924
(2014). http://dx.doi.org/10.1016/j.neuron.2014.04.004 NERNET 0896-6273 Google Scholar
G. Katonaet al.,
“Roller coaster scanning reveals spontaneous triggering of dendritic spikes in CA1 interneurons,”
Proc. Natl. Acad. Sci. U. S. A., 108
(5), 2148
–2153
(2011). http://dx.doi.org/10.1073/pnas.1009270108 PNASA6 0027-8424 Google Scholar
J. N. KerrD. GreenbergF. Helmchen,
“Imaging input and output of neocortical networks in vivo,”
Proc. Natl. Acad. Sci. U. S. A., 102
(39), 14063
–14068
(2005). http://dx.doi.org/10.1073/pnas.0506029102 PNASA6 0027-8424 Google Scholar
A. Nimmerjahnet al.,
“Sulforhodamine 101 as a specific marker of astroglia in the neocortex in vivo,”
Nat. Methods, 1
(1), 31
–37
(2004). http://dx.doi.org/10.1038/nmeth706 1548-7091 Google Scholar
D. Fabóet al.,
“Properties of in vivo interictal spike generation in the human subiculum,”
Brain, 131
(2), 485
–499
(2008). http://dx.doi.org/10.1093/brain/awm297 BRAIAK 0006-8950 Google Scholar
I. Ulbertet al.,
“Multiple microelectrode-recording system for human intracortical applications,”
J. Neurosci. Methods, 106
(1), 69
–79
(2001). http://dx.doi.org/10.1016/S0165-0270(01)00330-2 JNMEDT 0165-0270 Google Scholar
I. Ulbertet al.,
“In vivo laminar electrophysiology co-registered with histology in the hippocampus of patients with temporal lobe epilepsy,”
Exp. Neurol., 187
(2), 310
–318
(2004). http://dx.doi.org/10.1016/j.expneurol.2003.12.003 EXNEAC 0014-4886 Google Scholar
L. Wittneret al.,
“The epileptic human hippocampal cornu ammonis 2 region generates spontaneous interictal-like activity in vitro,”
Brain, 132
(11), 3032
–3046
(2009). http://dx.doi.org/10.1093/brain/awp238 BRAIAK 0006-8950 Google Scholar
B. Rózsaet al.,
“Distance-dependent scaling of calcium transients evoked by backpropagating spikes and synaptic activity in dendrites of hippocampal interneurons,”
J. Neurosci., 24
(3), 661
–670
(2004). http://dx.doi.org/10.1523/JNEUROSCI.3906-03.2004 JNRSDS 0270-6474 Google Scholar
A. Lőrinczet al.,
“Differential distribution of NCX1 contributes to spine–dendrite compartmentalization in CA1 pyramidal cells,”
Proc. Natl. Acad. Sci. U. S. A., 104
(3), 1033
–1038
(2007). http://dx.doi.org/10.1073/pnas.0605412104 PNASA6 0027-8424 Google Scholar
L. Wittneret al.,
“Three-dimensional reconstruction of the axon arbor of a CA3 pyramidal cell recorded and filled in vivo,”
Brain Struct. Funct., 212
(1), 75
–83
(2007). http://dx.doi.org/10.1007/s00429-007-0148-y BSFRCD 1863-2653 Google Scholar
B. Rózsaet al.,
“Random access three-dimensional two-photon microscopy,”
Appl. Opt., 46
(10), 1860
–1865
(2007). http://dx.doi.org/10.1364/AO.46.001860 APOPAI 0003-6935 Google Scholar
M. Avoliet al.,
“Cellular and molecular mechanisms of epilepsy in the human brain,”
Prog. Neurobiol., 77
(3), 166
–200
(2005). http://dx.doi.org/10.1016/j.pneurobio.2005.09.006 PGNBA5 0301-0082 Google Scholar
N. L. Rochefortet al.,
“Sparsification of neuronal activity in the visual cortex at eye-opening,”
Proc. Natl. Acad. Sci. U. S. A., 106
(35), 15049
–15054
(2009). http://dx.doi.org/10.1073/pnas.0907660106 PNASA6 0027-8424 Google Scholar
H. Lutckeet al.,
“Optical recording of neuronal activity with a genetically-encoded calcium indicator in anesthetized and freely moving mice,”
Front. Neural Circuits, 4 9
(2010). http://dx.doi.org/10.3389/fncir.2010.00009 FNCRA5 1662-5110 Google Scholar
K. Vervaekeet al.,
“Gap junctions compensate for sublinear dendritic integration in an inhibitory network,”
Science, 335
(6076), 1624
–1628
(2012). http://dx.doi.org/10.1126/science.1215101 SCIEAS 0036-8075 Google Scholar
A. LosonczyJ. C. Magee,
“Integrative properties of radial oblique dendrites in hippocampal CA1 pyramidal neurons,”
Neuron, 50
(2), 291
–307
(2006). http://dx.doi.org/10.1016/j.neuron.2006.03.016 NERNET 0896-6273 Google Scholar
M. E. Larkumet al.,
“Synaptic integration in tuft dendrites of layer 5 pyramidal neurons: a new unifying principle,”
Science, 325
(5941), 756
–760
(2009). http://dx.doi.org/10.1126/science.1171958 SCIEAS 0036-8075 Google Scholar
T. Abrahamssonet al.,
“Thin dendrites of cerebellar interneurons confer sublinear synaptic integration and a gradient of short-term plasticity,”
Neuron, 73
(6), 1159
–1172
(2012). http://dx.doi.org/10.1016/j.neuron.2012.01.027 NERNET 0896-6273 Google Scholar
G. N. Elstonet al.,
“Specializations of the granular prefrontal cortex of primates: implications for cognitive processing,”
Anat. Rec. Part A, 288
(1), 26
–35
(2006). http://dx.doi.org/10.1002/(ISSN)1552-4892 ARPACS 1552-4884 Google Scholar
H. Duanet al.,
“Quantitative analysis of the dendritic morphology of corticocortical projection neurons in the macaque monkey association cortex,”
Neuroscience, 114
(2), 349
–359
(2002). http://dx.doi.org/10.1016/S0306-4522(02)00305-6 0306-4522 Google Scholar
M. MarxD. Feldmeyer,
“Morphology and physiology of excitatory neurons in layer 6b of the somatosensory rat barrel cortex,”
Cereb. Cortex, 23
(12), 2803
–2817
(2013). http://dx.doi.org/10.1093/cercor/bhs254 53OPAV 1047-3211 Google Scholar
T. P. Wonget al.,
“Loss of presynaptic and postsynaptic structures is accompanied by compensatory increase in action potential-dependent synaptic input to layer V neocortical pyramidal neurons in aged rats,”
J. Neurosci., 20
(22), 8596
–8606
(2000). JNRSDS 0270-6474 Google Scholar
G. A. AscoliD. E. DonohueM. Halavi,
“NeuroMorpho.Org: a central resource for neuronal morphologies,”
J. Neurosci., 27
(35), 9247
–9251
(2007). Google Scholar
K. I. van AerdeD. Feldmeyer,
“Morphological and physiological characterization of pyramidal neuron subtypes in rat medial prefrontal cortex,”
Cereb. Cortex,
(2013). http://dx.doi.org/10.1093/cercor/bht278 53OPAV 1047-3211 Google Scholar
H. J. KoesterB. Sakmann,
“Calcium dynamics associated with action potentials in single nerve terminals of pyramidal cells in layer 2/3 of the young rat neocortex,”
J. Physiol., 529
(3), 625
–646
(2000). http://dx.doi.org/10.1111/tjp.2000.529.issue-3 JPHYA7 0022-3751 Google Scholar
N. Holderithet al.,
“Release probability of hippocampal glutamatergic terminals scales with the size of the active zone,”
Nat. Neurosci., 15
(7), 988
–997
(2012). http://dx.doi.org/10.1038/nn.3137 NANEFN 1097-6256 Google Scholar
G. TamásE. H. BuhlP. Somogyi,
“Massive autaptic self-innervation of GABAergic neurons in cat visual cortex,”
J. Neurosci., 17
(16), 6352
–6364
(1997). JNRSDS 0270-6474 Google Scholar
R. Mileset al.,
“Differences between somatic and dendritic inhibition in the hippocampus,”
Neuron, 16
(4), 815
–823
(1996). http://dx.doi.org/10.1016/S0896-6273(00)80101-4 NERNET 0896-6273 Google Scholar
A. A. BíróN. B. HolderithZ. Nusser,
“Release probability-dependent scaling of the postsynaptic responses at single hippocampal GABAergic synapses,”
J. Neurosci., 26
(48), 12487
–12496
(2006). http://dx.doi.org/10.1523/JNEUROSCI.3106-06.2006 JNRSDS 0270-6474 Google Scholar
A. I. Gulyáset al.,
“Parvalbumin-containing fast-spiking basket cells generate the field potential oscillations induced by cholinergic receptor activation in the hippocampus,”
J. Neurosci., 30
(45), 15134
–15145
(2010). http://dx.doi.org/10.1523/JNEUROSCI.4104-10.2010 JNRSDS 0270-6474 Google Scholar
D. G. Jay,
“Selective destruction of protein function by chromophore-assisted laser inactivation,”
Proc. Natl. Acad. Sci. U. S. A., 85
(15), 5454
–5458
(1988). http://dx.doi.org/10.1073/pnas.85.15.5454 PNASA6 0027-8424 Google Scholar
M. Grabenbaueret al.,
“Correlative microscopy and electron tomography of GFP through photooxidation,”
Nat. Methods, 2
(11), 857
–862
(2005). http://dx.doi.org/10.1038/nmeth806 1548-7091 Google Scholar
F. S. WangD. G. Jay,
“Chromophore-assisted laser inactivation (CALI): probing protein function in situ with a high degree of spatial and temporal resolution,”
Trends Cell Biol., 6
(11), 442
–445
(1996). http://dx.doi.org/10.1016/S0962-8924(96)40005-8 TCBIEK 0962-8924 Google Scholar
K. Jacobsonet al.,
“Chromophore-assisted laser inactivation in cell biology,”
Trends Cell Biol., 18
(9), 443
–450
(2008). http://dx.doi.org/10.1016/j.tcb.2008.07.001 TCBIEK 0962-8924 Google Scholar
J. J. Reiners Jr.et al.,
“Assessing autophagy in the context of photodynamic therapy,”
Autophagy, 6
(1), 7
–18
(2010). http://dx.doi.org/10.4161/auto AUTOC9 1554-8627 Google Scholar
G. MarinoC. Lopez-Otin,
“Autophagy: molecular mechanisms, physiological functions and relevance in human pathology,”
Cell. Mol. Life Sci., 61
(12), 1439
–1454
(2004). http://dx.doi.org/10.1007/s00018-004-4012-4 CMLSFI 1420-9071 Google Scholar
G. Foffaniet al.,
“Reduced spike-timing reliability correlates with the emergence of fast ripples in the rat epileptic hippocampus,”
Neuron, 55
(6), 930
–941
(2007). http://dx.doi.org/10.1016/j.neuron.2007.07.040 NERNET 0896-6273 Google Scholar
|


