|
|
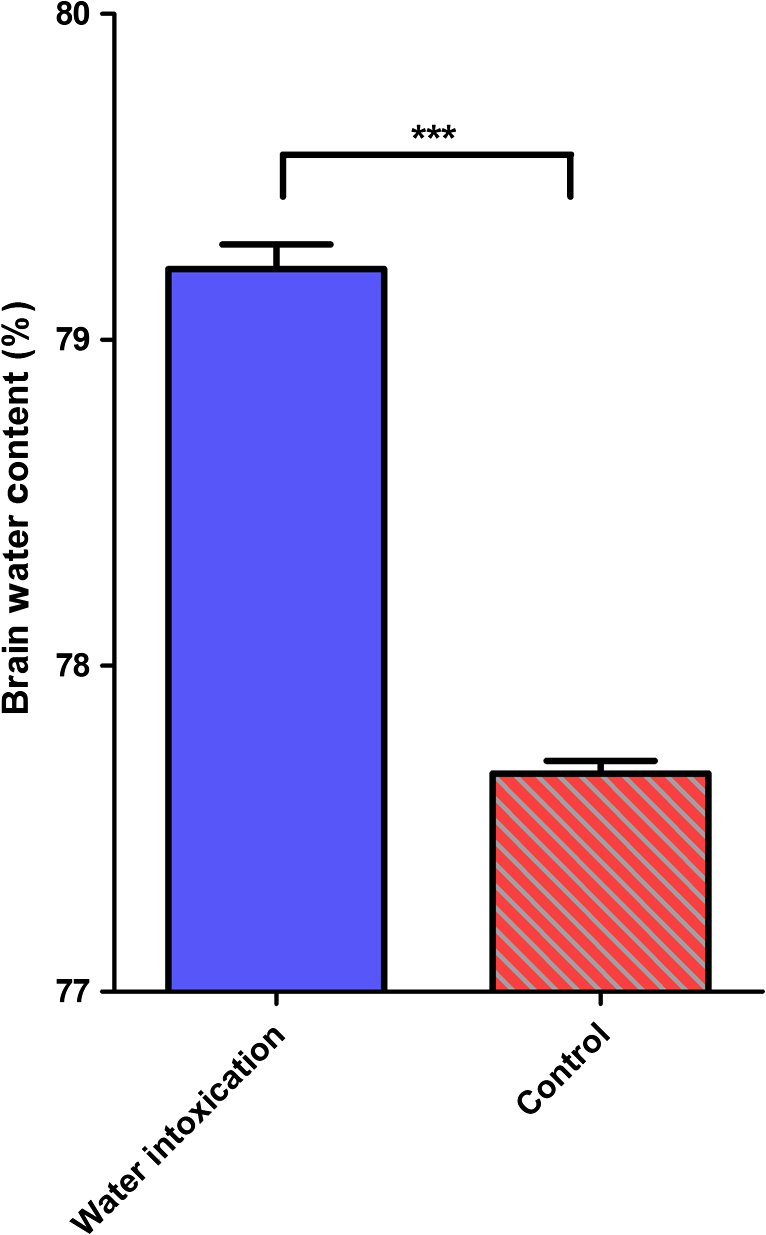
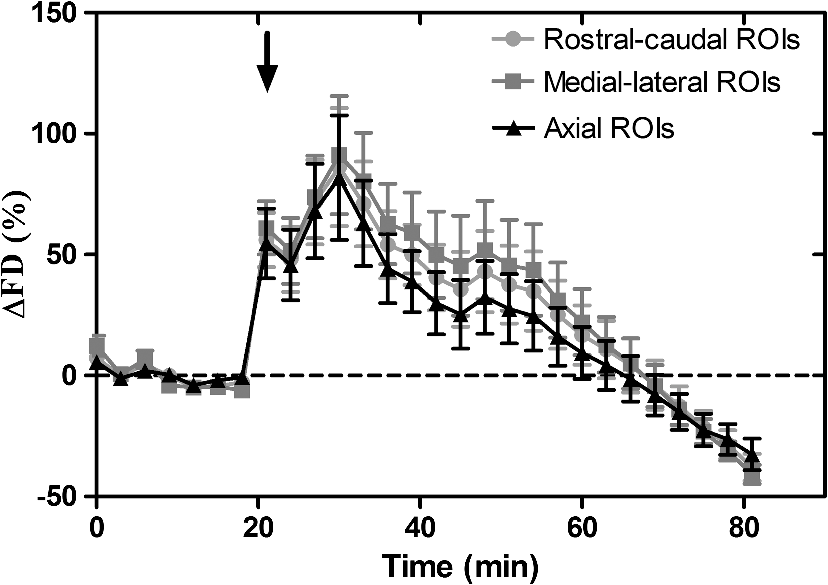
1.IntroductionCerebral edema, an accumulation of excess water in the brain, develops in response to a number of pathological conditions including traumatic brain injury (TBI), stroke, and infection.1,2 Excess water in the brain lead to raised intracranial pressure (ICP), which can cause secondary injuries, such as restriction of cerebral blood flow and brain herniation, and ultimately increases morbidity and mortality. While osmotherapy has achieved some success in the treatment of this condition, new approaches to regulating water influx and accumulation are continually being investigated.3 As new potential treatments are developed and undergo in vivo testing in animal studies, their effectiveness is largely measured by monitoring ICP and/or brain water content (BWC) analysis. ICP detection of edema operates on the principle that as brain volume increases due to excess water, ICP will also increase. However, this method suffers from an inherent delay between the onset of edema and the rise of ICP. Furthermore, it only provides a global measure of ICP and does not provide any spatial information. BWC analysis can be performed to measure the increase in water content. This can be done for each quadrant of the brain, through wet/dry measurements, or locally by performing tissue biopsy and measuring the specific gravity.4 These measurements, however, are extremely invasive and can only provide a measurement at a single time point. Real time, continuous monitoring of cerebral edema progression in vivo with high spatial resolution would be highly beneficial for studying the effects of possible therapeutic solutions. Optical detection of cerebral edema could potentially offer a more direct and less invasive measure of cerebral edema compared to the current detection techniques. The optical scattering of tissue is influenced by tissue composition and, therefore, will change as the water content increases. A recent study has demonstrated an increase in near-infrared (NIR) light transmittance when cerebral edema is present in brain slices in vitro.5 Also, a separate study showed that NIR light reflected from in vivo brain tissue decreased over time with increasing BWC.6 These results clearly indicate a difference in the optical properties of normal versus edematous brain tissue. However, the utility of these methods has been limited by a lack of spatial specificity. Optical coherence tomography (OCT), a nondestructive optical imaging technique, is capable of producing cross-sectional images of biological tissue with micrometer resolution and an imaging depth on the order of millimeters.7,8 The spatial specificity of OCT could be used to monitor the progression of cerebral edema throughout space and time, and to locate edematous regions in the brain relative to known brain structures. Additionally, changes in cerebral blood flow can be detected using Doppler OCT (DOCT), a technique which utilizes phase information contained in the OCT signal to detect flow.9,10 Based on the unique advantages of OCT imaging, we investigated how the optical properties of the edematous tissue changed over time in an in vivo model of cerebral edema. Sequential three-dimensional (3-D) data were acquired and changes in the spatially resolved attenuation coefficient were examined to study the global nature of the water intoxication mouse model. BWC measurements were made to additionally verify the presence of edema. Cerebral blood flow was also analyzed to provide further insight into the evolution of edema and reduction of cerebral blood flow in this model. 2.Experimental Methods2.1.Preparation and Imaging of Animal ModelFemale CD1 WT mice, 6–14 weeks old, were anesthetized with an intraperitoneal (IP) injection of ketamine and xylazine ( xylazine, ketamine) and prepared with a thinned-skull cortical window, approximately wide, centered over the right cerebral cortex. The thinned skull allowed for increased light penetration depth while preserving the natural physiological conditions of the brain.11 The mouse was then secured in a stereotactic frame for stable OCT imaging over a select region of interest within the cortical window. An acute water intoxication model of cytotoxic cerebral edema, in which water is driven from the vascular system into the brain by an osmotic gradient, was used.12,13 Twenty minutes of baseline OCT imaging was performed after which an IP injection of water was given (dosage 40% of the animal’s body weight). OCT imaging continued for 60 min. One OCT volume was collected every 3 min and spanned a volume of . Three water intoxication experiments and three control experiments (including thin-skull preparation without IP injection) were performed. All experimental procedures and protocols were approved by the University of California Riverside Institutional Animal Care and Use Committee (protocol 2010-0018). 2.2.Brain Water Content AnalysisThe presence of cerebral edema was verified by analyzing BWC via the wet-dry methods. After OCT data collection was completed, animals were sacrificed and the brains were dissected out post mortem and cut into four pieces (right-left cerebral hemispheres, right-left cerebellum). Brains were weighed to obtain the wet weight and dried for 48 h to determine the dry weight. The percent of water content was calculated with the following formula: . 2.3.Optical Coherence Tomography Image AcquisitionA spectral-domain OCT system centered at 1300 nm was used to image the in vivo mouse brain [Fig. 1(a)]. The light source consisted of two superluminescent diodes with a combined center wavelength of 1298 nm and a 120-nm full width at half maximum bandwidth. The source light was sent through a fiber optic circulator and an splitter, which divided the light between the sample and reference arms. The light that reflected from a mirror in the reference arm and from the brain tissue in the sample arm was then recombined at the splitter, dispersed by a grating, and detected on the line scan camera. Each spectrum acquired on the camera contained depth information from a single location in the sample (known as an A-line or depth profile). 3-D imaging was achieved by raster scanning the optical beam across the sample using two galvanometer mounted mirrors. The system has an axial imaging range of approximately 2 mm in biological tissue, an axial resolution of , and a lateral resolution of . Fig. 1(a) Schematic of spectral domain optical coherence tomography (OCT) setup. Red arrows depict the optical beam scan pattern for three-dimensional 3-D imaging of sample. m: mirror, gm: galvanometer mounted mirror, gr: grating, lsc: line scan camera. (b) Two-dimensional OCT sagittal image of in vivo mouse brain. S: skull, CTX: cerebral cortex, CC: corpus callosum. . (c) 3-D volume of in vivo mouse brain rendered from OCT volumetric scan. 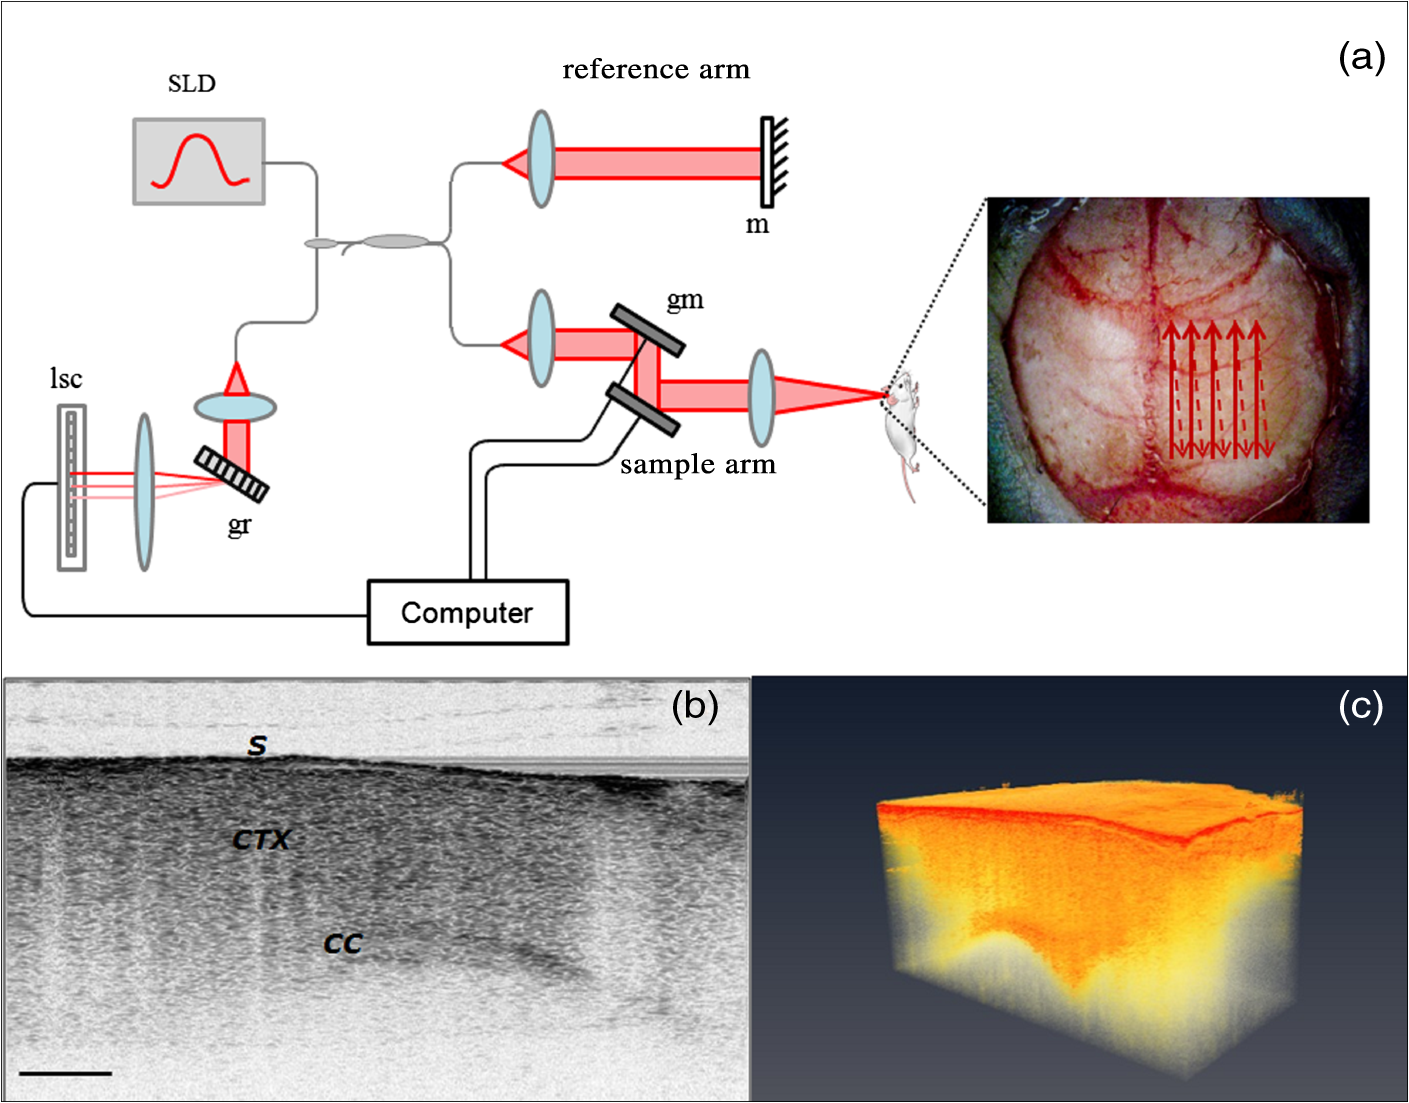 Each image contained 2048 A-lines, acquired at a rate of 15 kHz, and 250 images were used to render a single volume [Figs. 1(b) and 1(c). Real-time visualization of the sample was achieved using in-house developed software, which utilized a graphics processing unit (GPU) to process and display the OCT structure and blood flow images in real time.14 The real-time display of OCT images allowed structural markers within the imaging location to be rapidly identified and ensured that the same region of the brain was consistently imaged during and across all experiments. Depth-resolved structural information was retrieved from each A-line by applying a Fourier transform to the spectrum collected on the camera after linearly remapping to -space. The images were displayed on an inverse log scale [Fig. 1(b)]. Images of the cerebral vascular network were generated by utilizing the phase information contained in the OCT signal, a method known as Doppler OCT (DOCT).9,15,16 This technique enables high resolution imaging of motion within the sample by calculating the Doppler frequency shift caused from reflection off of a moving sample. The depth resolved phase difference between consecutive A-lines was determined and this phase difference is directly proportional to the axial component of the velocity of the scattering particle. Static tissue introduces minimal phase shifts and is represented by a low intensity in DOCT images while blood flow induces a large phase difference, represented by a high intensity. 2.4.Analysis of Attenuation Coefficient and Cerebral Blood FlowThe attenuation coefficient of a sample describes how strongly the sample scatters and absorbs light. In this study, change in the tissue’s average attenuation coefficient was used to quantify the effects of cerebral edema in the cerebral cortex. The attenuation coefficient was determined on a pixel-by-pixel basis, using a recently developed model for depth-resolved attenuation coefficient determination in OCT data.17 This method makes it possible to create an attenuation image, in which contrast is indicated by the local attenuation coefficient from an OCT intensity image with a known pixel size (Fig. 2). The tissue was assumed to have an index of refraction of 1.4. Fig. 2(a) Sagittal optical coherence tomography (OCT) intensity image of in vivo mouse brain and (b) corresponding attenuation image. . 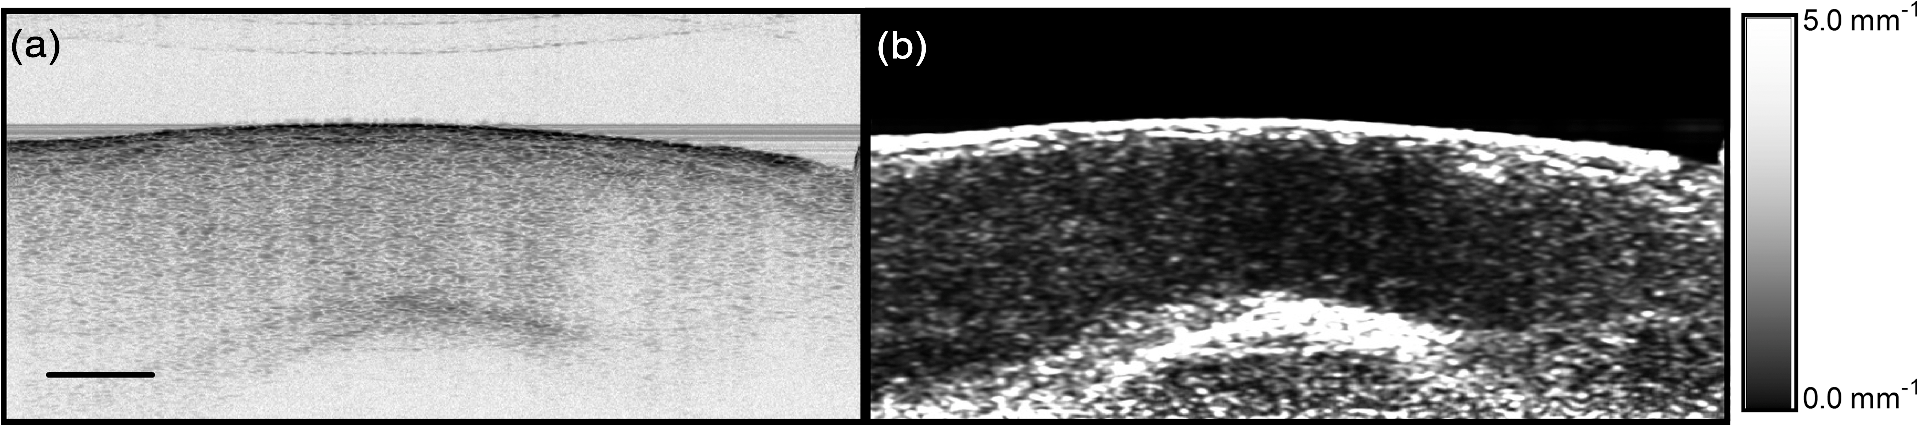 The average attenuation coefficient of the cortex was determined over time as edema progressed in the animal model. All pixels contained in the regions of interest (ROI) and within 0.7 mm of the surface (gray matter region) were included in the average calculation. The average attenuation coefficient during baseline was determined from all data acquired during the first 20 min and the percent change in the average attenuation coefficient was calculated at all points in subsequent volumes. Cerebral blood flow was analyzed by calculating the percent change in flow density using the DOCT image information. A threshold was set to distinguish the pixels that represent flow from background pixels in the DOCT data, within the same ROIs that were used for attenuation analysis. The total DOCT intensity was calculated as the sum of all intensities in pixels identified as flow regions and divided by the number of pixels in the ROI to determine the flow density. The percent change in flow density was then calculated for each time point in order to determine how the cerebral blood flow was changing over time. Maximum intensity projection (MIP) images of the cerebral blood flow were displayed in an en face orientation and filtered using a Gabor filter.18 3.Results3.1.Optical Changes from In Vivo Cerebral Edema ModelThe percent change in attenuation coefficient was determined from the OCT intensity data within a ROI over the cerebral cortex. The areas close to the cortical window boundaries were excluded from the calculation because of uneven bone thicknesses in these regions. The average value of the attenuation coefficient in the cerebral cortex remained steady during baseline and then decreased soon after the IP injection was administered at 20 min (Fig. 3). The decrease continued approximately linearly in time as cerebral edema progressed. A maximum decrease of 8% was observed by the end of the experiment (at which time standard error of the mean was 1.93). Over the same amount of time, the average attenuation coefficient from the control experiments remained relatively constant (Fig. 3). The BWC measurements confirmed that the cerebral edema group exhibited a higher BWC compared to the control group (Fig. 4). Fig. 3Percent change of average attenuation coefficient in the cerebral cortex over time from in vivo cerebral edema mouse model. Arrow indicates IP water injection for water intoxication group. Error bars represent standard error for . 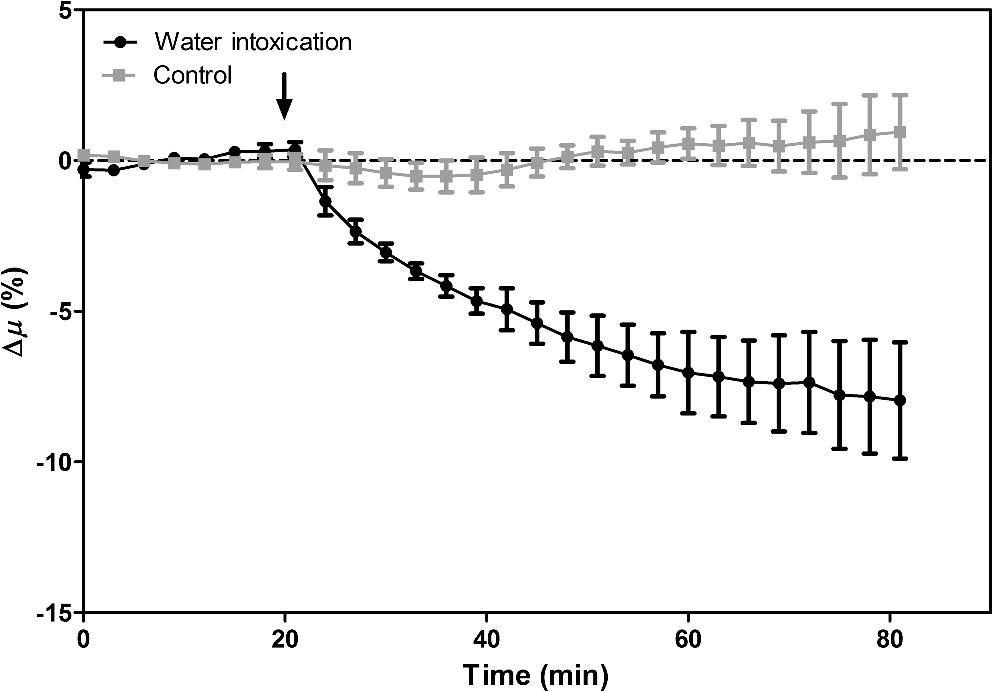 The attenuation coefficient within the cerebral cortex exhibited some variation as a function of depth. As an example, an average depth profile from an area of approximately within the cerebral cortex is shown in Fig. 5. During baseline, the attenuation coefficient had a median value of . After water intoxication, this value decreased to approximately . The percent difference between these two profiles as a function of depth is shown of the right -axis and resulted in an average percent difference of . Fig. 5Attenuation depth profile from a small region of cerebral cortex. The gray line represents the values during baseline and the black line represents the same depth profile after water intoxication. The percent difference between the two profiles is shown by the red dotted line on the right -axis. The average percent difference over the entire depth is . 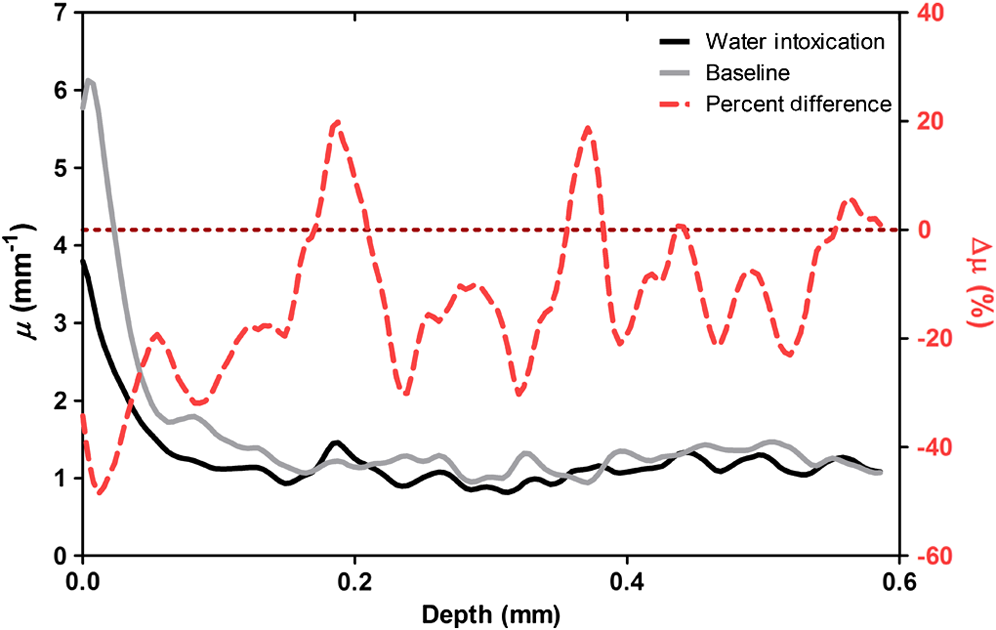 The rate of change of the attenuation coefficient was calculated for the baseline (defined as the first 20 min of the edema experiment) and for edema (postIP injection) by fitting the data using linear regression (Fig. 6). These rates of change were also compared with the control experiments. A -distribution test was performed to compare the rates of change. Statistical analysis identified that the rate of change during edema was statistically significant () from both the control () and the baseline (). As expected, the rate of the change in the attenuation coefficient during the control was not statistically different from baseline. These results indicate that the progression of edema can be identified by measuring a rate of change in the attenuation coefficient. Fig. 6Rate of change in average attenuation coefficient during baseline, edema (postIP injection) and control experiments. Error bars represent the standard error. 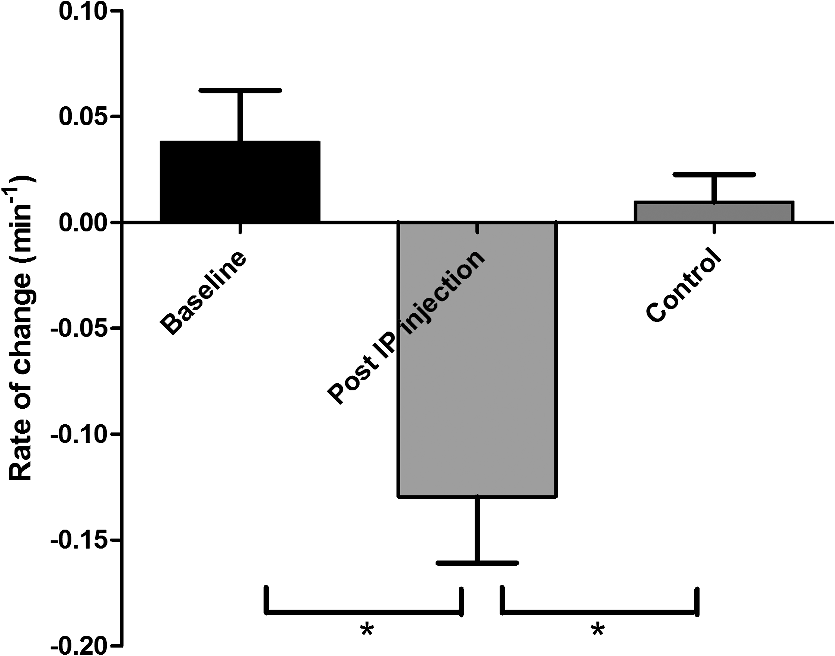 Consistent with previous reports using this mouse model, the severity of cerebral edema monotonically increased over time.6 Analysis of the cerebral blood flow confirmed that flow decreased near the end of the experiment before the animal expired (Fig. 7). The flow initially increased quickly after the IP injection was administered, presumably due to the injection itself increasing circulating blood volume, and small capillaries became increasingly visible. After approximately 45 min postIP injection, the flow began to slow; at the end of the experiment minimal flow was visible in the MIP images (Fig. 7). The decrease in flow is consistent with the Monro-Kellie doctrine, which states that the cerebral blood volume decreases to compensate for an increase in brain volume.19 Using DOCT, we are able to detect when this volume compensation process is occurring. Fig. 7(a) MIP en face images of the cerebral vascular network created from DOCT volumetric data. The orientation is specified by the rostral (R) and midline (M) arrows. Time points (in minutes) are labeled in the bottom left corners. The red arrow indicates an area where capillaries became increasingly visible after IP injection compared to baseline. (b) Percent change in flow density as a function of time for water intoxication and control animals. 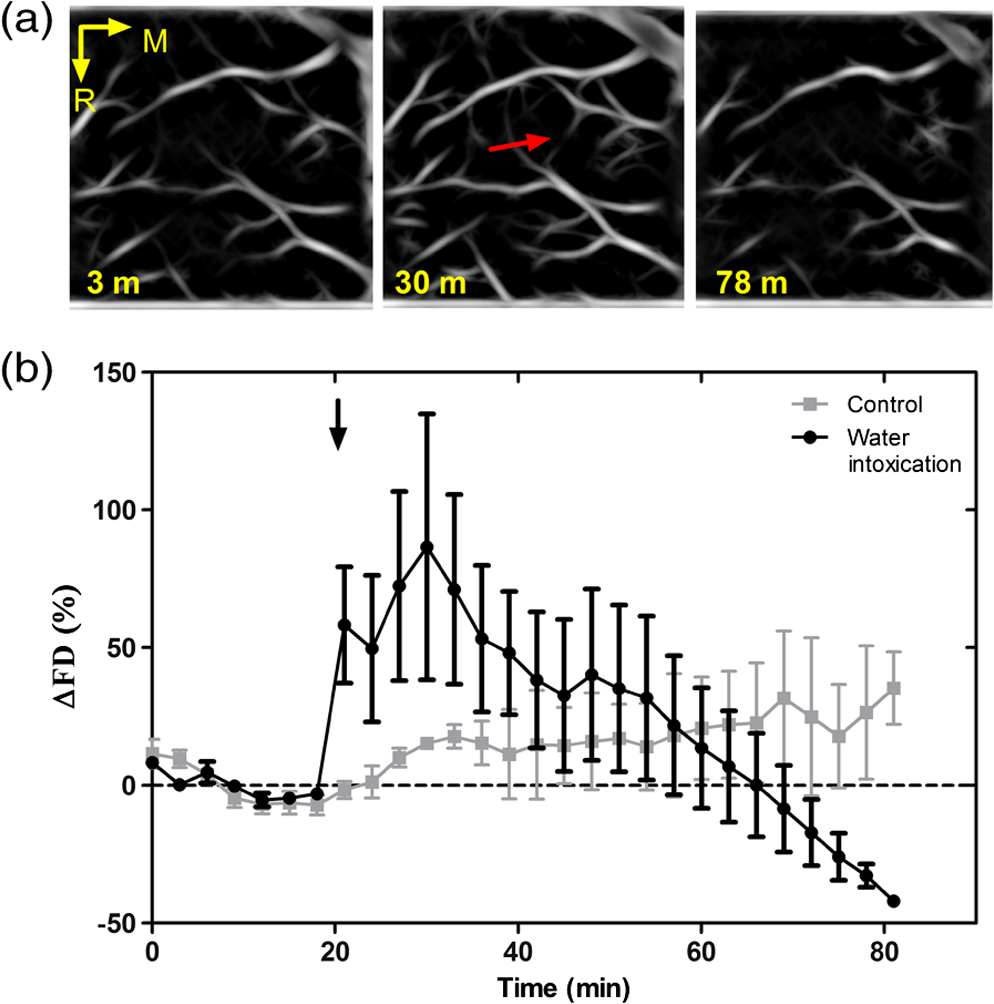 3.2.Local Attenuation Coefficient TrendsThe spatial specificity afforded by volumetric OCT data allowed for the optical properties of local regions to be interrogated. The imaging volume was divided into smaller ROIs to investigate the attenuation coefficient trends as (1) a function of distance from midline, (2) from rostral to caudal and (3) axial location. The water intoxication model used in these experiments is a global model of cerebral edema, causing the entire brain to become edematous. The attenuation trends within these localized regions confirmed the global nature of this model, as each of the ROIs demonstrated the same decrease in attenuation following water intoxication with no statistical difference at various sagittal, coronal, or axial positions (Fig. 8). The ability to interrogate local regions and assess how specific areas within the brain are affected by edema with OCT illustrates the value of optical detection over standard methods of ICP and BWC measurements, which only offer a global assessment. Fig. 8Percent change of average attenuation coefficient in the cerebral cortex from three regions spanning (a) medial-lateral, (b) rostral caudal and (c) axial positions (ROIs shown in inset). Arrow indicates IP injection time point. Error bars represent standard error.  The blood flow in the same local ROIs was analyzed for comparison. The blood flow directly affects the formation of edema because the excess water enters the brain from the vascular network. Throughout all localized ROIs, the blood flow initially increased after the IP injection and then fell below baseline level 1 h after injection (Fig. 9). The similarity in the flow densities as a function of time revealed that blood flow in all areas of the brain changed in the same way and that compression of blood vessels occurred at the same time within the ROIs. 4.DiscussionWe demonstrated the ability of OCT to detect cerebral edema based on changes in light attenuation and cerebral blood flow. During late-stage edema when the cerebral blood flow had considerably slowed due to blood vessel compression, the average attenuation coefficient of the cerebral cortex had decreased by 8%. Furthermore, the attenuation began to decrease within minutes of the IP injection and became significant () from baseline 7 min after injection. It is important to note that ICP measurements do not indicate the presence of cerebral edema until more than 20 min after the IP injection in the same animal model.6 Optical detection of cerebral edema with OCT, therefore, can offer an earlier detection time compared with the current practice of using ICP. The major advantage of OCT detection of cerebral edema is the extremely high spatial resolution it can offer compared to other available techniques. ICP and bulk BWC measurements can only offer a global assessment of edema. Additionally, using diffuse reflectance measurements to detect edema,5,6 which has improved specificity compared to ICP and BWC, has a lower resolution than OCT and lacks any depth discrimination. Therefore, this technique could be used for detection in a global model of edema, but would be much more difficult to apply to focal models of edema since the optical properties would vary heterogeneously throughout the tissue relative to the site of injury. OCT imaging of a focal edema model would be capable of providing measurements of spatially resolved optical properties of the brain and make it possible to build a four-dimensional representation of how the optical properties vary in space and time. Further studies could include OCT-based edema detection in focal models of cerebral edema, such as following controlled cortical impact injury in a model of mild (TBI). In such focal models, not only the spatial but also the temporal resolution of OCT may allow for more precise and early diagnosis of localized brain tissue injury, as well as offer insight into water movement. 5.ConclusionWe have demonstrated the ability of OCT to detect optical changes correlated with cerebral edema in an in vivo water intoxication model. The optical properties of the cerebral cortex were altered as cerebral edema progressed, resulting in a decrease in average attenuation coefficient. DOCT also detected a decrease in cerebral blood flow due to blood vessel compression during severe brain swelling. Localized analysis of attenuation trends determined that detection can be achieved from small regions of brain tissue, highlighting the potential of OCT for three-dimensional spatial monitoring of cerebral edema over time. AcknowledgmentsThe authors would like to thank Christian M. Oh and Michael C. Oliveira at the University of California Riverside for their assistance with the OCT system: this work was supported by NIH Grant No. R00EB007241, UC Discovery Grant No. #213073, and NSF IGERT Video Bioinformatics DGE 0903667. ReferencesA. Marmarou,
“Pathophysiology of traumatic brain edema: current concepts,”
Acta Neurochir. Suppl., 86 7
–10
(2003). http://dx.doi.org/10.1007/978-3-7091-0651-8_2 ANCSBM 0065-1419 Google Scholar
A. A. Rabinstein,
“Treatment of cerebral edema,”
Neurologist, 12
(2), 59
–73
(2006). http://dx.doi.org/10.1097/01.nrl.0000186810.62736.f0 1074-7931 Google Scholar
B. P. WalcottK. T. KahleJ. M. Simard,
“Novel treatment targets for cerebral edema,”
Neurotherapeutics, 9
(1), 65
–72
(2012). http://dx.doi.org/10.1007/s13311-011-0087-4 NEURNV 1878-7479 Google Scholar
A. Marmarouet al.,
“A simple gravimetric technique for measurement of cerebral edema,”
J. Neurosurg., 49
(4), 530
–537
(1978). http://dx.doi.org/10.3171/jns.1978.49.4.0530 JONSAC 0022-3085 Google Scholar
J. R. ThiagarajahM. C. PapadopoulosA. S. Verkman,
“Noninvasive early detection of brain edema in mice by near-infrared light scattering,”
J. Neurosci. Res., 80
(2), 293
–299
(2005). http://dx.doi.org/10.1002/(ISSN)1097-4547 JNREDK 0360-4012 Google Scholar
A. S. Gillet al.,
“Early optical detection of cerebral edema in vivo,”
J. Neurosurg., 114
(2), 470
–477
(2011). http://dx.doi.org/10.3171/2010.2.JNS091017 JONSAC 0022-3085 Google Scholar
J. G. Fujimoto,
“Optical coherence tomography for ultrahigh resolution in vivo imaging,”
Nat. Biotechnol., 21
(11), 1361
–1367
(2003). http://dx.doi.org/10.1038/nbt892 NABIF9 1087-0156 Google Scholar
D. Huanget al.,
“Optical coherence tomography,”
Science, 254
(5035), 1178
–1181
(1991). http://dx.doi.org/10.1126/science.1957169 SCIEAS 0036-8075 Google Scholar
Y. Zhaoet al.,
“Phase-resolved optical coherence tomography and optical Doppler tomography for imaging blood flow in human skin with fast scanning speed and high velocity sensitivity,”
Opt. Lett., 25
(2), 114
–116
(2000). http://dx.doi.org/10.1364/OL.25.000114 OPLEDP 0146-9592 Google Scholar
V. Westphalet al.,
“Real-time, high velocity-resolution color Doppler optical coherence tomography,”
Opt. Lett., 27
(1), 34
–36
(2002). http://dx.doi.org/10.1364/OL.27.000034 OPLEDP 0146-9592 Google Scholar
J. I. Szuet al.,
“Thinned-skull cortical window technique for in vivo optical coherence tomography imaging,”
J. Vis. Exp., 69 e50053
(2012). http://dx.doi.org/10.3791/50053 Google Scholar
J. E. OlsonL. MishlerR. V. Dimlich,
“Brain water content, brain blood volume, blood chemistry, and pathology in a model of cerebral edema,”
Ann. Emerg. Med., 19
(10), 1113
–1121
(1990). http://dx.doi.org/10.1016/S0196-0644(05)81514-8 AEMED3 0196-0644 Google Scholar
L. WeedP. McKibben,
“Experimental alteration of brain bulk,”
Am. J. Physiol., 73
(3), 194
–195
(1919). AJPHAP 0002-9513 Google Scholar
Y. Wanget al.,
“GPU accelerated real-time multi-functional spectral-domain optical coherence tomography system at 1300 nm,”
Opt. Express, 20
(14), 14797
(2012). http://dx.doi.org/10.1364/OE.20.014797 OPEXFF 1094-4087 Google Scholar
Z. Chenet al.,
“Noninvasive imaging of in vivo blood flow velocity using optical Doppler tomography,”
Opt. Lett., 22
(14), 1119
–1121
(1997). http://dx.doi.org/10.1364/OL.22.001119 OPLEDP 0146-9592 Google Scholar
B. R. Whiteet al.,
“In vivo dynamic human retinal blood flow imaging using ultra-high-speed spectral domain optical Doppler tomography,”
Opt. Express, 11
(25), 3490
–3497
(2003). http://dx.doi.org/10.1364/OE.11.003490 OPEXFF 1094-4087 Google Scholar
K. A. Vermeeret al.,
“Depth-resolved model-based reconstruction of attenuation coefficients in optical coherence tomography,”
Biomed. Opt. Express, 5
(1), 322
–337
(2013). http://dx.doi.org/10.1364/BOE.5.000322 BOEICL 2156-7085 Google Scholar
G. Harlowet al.,
“Automated spatial analysis of ARK2: putative link between microtubules and cell polarity,”
in Proc. 2013 IEEE 10th Int. Symp. Biomed. Imaging From Nano to Macro,
910
–913
(2013). Google Scholar
L. C. PadayachyA. A. FigajiM. R. Bullock,
“Intracranial pressure monitoring for traumatic brain injury in the modern era,”
Childs Nerv. Syst., 26
(4), 441
–452
(2010). http://dx.doi.org/10.1007/s00381-009-1034-0 CNSYE9 1433-0350 Google Scholar
BiographyCarissa L. R. Rodriguez is currently a PhD candidate in the Bioengineering Department at the University of California Riverside. She received her BS degree in physics from Wittenberg University. Her research interests include biomedical optics and optical imaging for neurotrauma applications. Jenny I. Szu received her BS degree in biological sciences from the University of California, Irvine, and is a first-year neuroscience PhD graduate student at the University of California, Riverside. Her current research utilizes optical coherence tomography to detect intrinsic optical changes in models of cerebral edema, epilepsy, and mild traumatic brain injury. Additionally, she is exploring the role of aquaporin-4 during astrocytic swelling on neuronal excitability in animal models of chronic epilepsy. Melissa M. Eberle received her BS degree in bioengineering at the University of California, Santa Cruz, in 2005 and is now a PhD candidate at the University of California, Riverside, in the Department of Bioengineering. Her research focuses on spatially and temporally resolving optical changes in cortical tissue to further the understanding of seizure progression with OCT. She is the recipient of the NSF IGERT Fellowship in Video Bioinformatics. Yan Wang is a research fellow at Massachusetts General Hospital, Harvard Medical School. She received her PhD degree in bioengineering from University of California, Riverside, in 2013, and her BS degree in optoelectronic engineering and MS degree in biomedical engineering from Huazhong University of Science and Technology, China, in 2006 and 2008, respectively. Her research interests include biomedical optics, optical imaging, endoscopy, and high performance computation. Mike S. Hsu is the lab manager for the Translational Neuroscience Laboratory at UCR. He received his MS degree in biomedical engineering at UCLA and postgraduate training in neuroscience in the lab of Dr. V.R. Edgerton. In addition to biomedical imaging, currently Mike is working on neurological disorders such as epilepsy, spinal cord injury, and Fragile X. He hopes to reconcile the findings from these projects to produce novel diagnostics and therapeutics. Devin K. Binder attended Harvard University as an undergraduate, where he studied biology, anthropology, and neuroscience. He received his MD and PhD degrees from Duke University in 1999 and subsequently completed a surgical internship and neurosurgery residency at the University of California, San Francisco. In 2010, he joined the Division of Biomedical Sciences at the University of California, Riverside, where he runs the Translational Neuroscience Laboratory. B. Hyle Park received his BS in physics from Caltech in 1996. He began his graduate research at the Beckman Laser Institute at UC Irvine, receiving his MS in 2001 before completing his PhD at the Wellman Center for Photomedicine (Massachusetts General Hospital /Harvard Medical School) in 2005. He continued at Wellman as a postdoctoral fellow and instructor until moving to UC Riverside in 2009. His research focuses on OCT development for neuroscience applications. |