
|
|
1.IntroductionFunctional near-infrared spectroscopy (fNIRS) offers a unique position as a neuroimaging modality for assessing human brain functions. In comparison to functional magnetic resonance imaging (fMRI), one obvious merit of fNIRS in its experimental use is the high degree of flexibility: it requires only a compact instrument installed in an ordinary environment, is less restrictive, and is tolerant of body motion. These merits enable a variety of motor, sensory, and cognitive tasks to be executed using fNIRS.1–3 Moreover, fNIRS allows the acquisition of a wider variety of parameters than does fMRI. While fMRI measures blood oxygen level dependent (BOLD) signals mostly reflecting deoxygenated hemoglobin (deoxy-Hb) concentration changes, fNIRS can utilize both oxygenated (oxy-) and deoxy-Hb signals. In addition, fNIRS enjoys higher temporal resolution than fMRI: while the typical sampling rate of fMRI is on the order of seconds, that of fNIRS is on the order of 100 ms for typical measurements or of 10 ms for highly tuned settings.2 However, there remains debate over how to appropriately extract cortical activation data from Hb timeline signals, and a standardized method has yet to be established. Typically, two methods are utilized in fNIRS studies. In a classical approach, the functional data can be simply assessed by contrasting average data from the peak period against average data from the baseline period. A contrast representing task-related cortical activation may be extracted for a given subject, which is further subjected to group analyses. In a single subject, sets of baseline and task periods are statistically assessed using a paired (or one-sample) t-test. This approach has been adopted for both block and event-related designs.4,5 Alternatively, a general linear model (GLM) approach, which has been established as a standard method for fMRI data analysis, has also been applied to fNIRS studies using both event6 and block-related designs.7 In typical GLM analyses, the functional timeline of data is regressed to a hemodynamic response function (HRF) that mimics the actual hemodynamic response, measured as a BOLD signal in fMRI experiments.8,9 The GLM describes data as a linear combination of an explanatory variable and an error term. In group analyses, the GLM is used to produce a subject-specific contrast from beta-weight in regression to the HRF, which is used for the second-level analyses. When applied to single-subject analyses, the GLM can fully utilize the temporal information for fNIRS Hb signals by increasing the degree of freedom by severalfold to achieve greater statistical power. GLM analyses of the fMRI data have been developed to explain the timeline BOLD signal data observed. The crucial part of the model function of a GLM is the boxcar function, which reflects the temporal structures of the experimental paradigm and is convolved with the canonical hemodynamic response function consisting of the sequential combination of positive and negative gamma functions.9 In addition to the HRF, its first and second derivatives (temporal and dispersion derivatives), baseline and linear trends are usually adopted as regressors in a GLM. In actual data analysis, it is the general practice to use default settings for the temporal parameters such as peak delays of the gamma functions as provided by data analysis tools such as statistical parametric mapping (SPM).8,9 These parameters were first proposed by Boynton et al. to empirically describe the observed BOLD signal in response to the preceding neural activity.8 Although these temporal parameters stand as the fundamental basis of GLM, little consideration has been given to the validity of their selection. Indeed, Boynton himself raised an alarm over the current practice of blindly using default settings for the temporal parameters as provided by analysis tools without considering possible variability of hemodynamic response between brain regions and task species.10 In order to take such variability into consideration, some studies have modified HRF parameters to achieve a better fitting of the model function to the observed data.11,12 Thus, the GLM approach to fNIRS data analysis has essentially borrowed its basic framework from GLM used in typical fMRI analyses. However, several important issues need to be addressed when “localizing” fMRI-GLM to fNIRS data. Among these, the temporal coherence of timeline data has been well treated using a precoloring approach. Also, spatial inhomogeneity within multiple channel measurements has been resolved using a tube formula. Together, these solutions have been released to public domains as user-friendly toolboxes (NIRS-SPM).13 Similarly, the fNIRS GLM analysis tools of HomER14 and fOSA7 have also been released. On the other hand, it has been a common practice for GLM in fNIRS to adopt the temporal parameters for the hemodynamic response functions used in fMRI-GLM, which have been empirically optimized for analyzing BOLD timeline data.6,7,13,15 Since fNIRS deals with hemodynamic responses of both oxy- and deoxy-Hb signals, the temporal parameters for the fMRI BOLD signal may not suitably explain the behaviors of those Hb signals. In fact, canonical HRF being used as a predictor for both Hb signals without accounting for differences in their behaviors and variations among individual subjects has been raised as a concern regarding the GLM approach.16 In recent years, a few pioneering fNIRS studies have started to adjust the temporal parameters of the HRF. Minagawa-Kawai et al. explored the best-fit first peak delay values for both Hb parameters in an auditory infant study and found that the best fit was achieved at 2.8 s for oxy- and 3.4 s for deoxy-Hb parameters, respectively.17 Both were shorter than the typical peak delay in fMRI of 6 s. A functional map was created based on the oxy-Hb parameter, and the relationship between the two parameters has yet to be examined. Similarly, in a simultaneous measurement using fNIRS and EEG, onset and peak delays for Gaussian functions have been adopted for oxy-Hb signal, while deoxy-Hb signal remains to be analyzed.18 Given this, there is still the need to explore model functions suitable for examining the temporal behaviors of oxy- and deoxy-Hb signals. The most practical strategy would be to adopt the tuning of the HRF temporal parameters, as has been done in fMRI analyses, for both oxy- and deoxy-Hb signals. Given the higher temporal resolution of fNIRS (subsecond order) than of fMRI (second order), we would expect that the temporal characteristics of the two hemoglobin signals could be well modeled using the GLM approach. In order to assess the task-induced temporal profiles of oxy- and deoxy-Hb signals in fNIRS measurement, we adopted two different language tasks in block design functional paradigms. One was a verbal fluency task (VFT)19 and the other was a naming task (NMT).20 In a VFT, participants are requested to generate words according to a given rule. Typically, the words are generated within a particular semantic category (e.g., fruits) to form a category fluency task, or with a particular letter (e.g., E-words) to form a letter fluency task. In the NMT, a participant performing a confrontation naming task is presented with a series of pictures of objects one by one and required to name each object presented. These two tasks appear to have similar task structures consisting of a series of events, namely, object naming or word generation. However, these events are executed with different modes of cognitive process. While each event is nearly independent of other events in the NMT, an event in the VFT is cumulatively influenced by former events. When a word is generated, the word is stored in the working memory not to be repeated, the next word search excludes the already generated words not increasing the difficulty. In other words, the cognitive load remains constant during the NMT, whereas it gradually increases during the VFT. We assumed that such differences in task characteristics would be reflected in the temporal profiles of hemodynamic responses for oxy- and deoxy-Hb signals. The high temporal resolution of fNIRS of 10 Hz is expected to be sensitive enough to detect differences in the temporal profiles of Hb species across different tasks in the order of seconds. Thus, we examined the behaviors of oxy- and deoxy-Hb signals during NMT and VFT as measured by the fNIRS using an adaptive HRF fit to the observations. In so doing, we explored which approach best utilizes the full dimensions of fNIRS measurements with multichannel, two-Hb, and high temporal resolution settings. 2.Methods2.1.Experimental ProceduresExperimental data used in this study were obtained from our previous studies19,20 and reanalyzed from different perspectives. Here, we present the experimental procedures briefly. Participants in the present studies were 30 right handed, healthy volunteers (22 males; 8 females; average years; ; range: 22–59 years) for the NMT and 28 right handed, healthy volunteers (21 males, 7 females, average years, , range: 22–59 years) for the VFT. Written informed consent was given by all participants and the study was approved by the Jichi Medical University ethics committee. In the NMT, 53 line drawings were used as target stimuli. The experimental tasks were to overtly name the objects depicted in the line drawings. Each participant was presented with a visual line drawing of an object and was asked to name the object correctly as quickly as possible. The task paradigm was a periodic block design with five alternating conditions of rest (30 s) and experimental task (20 s). In the VFT, participants were requested to overtly generate the examples for five categories. The task paradigm was a periodic block design with five alternating conditions of rest (30 s) and experimental task (20 s). 2.2.Experimental Settings of Functional Near-Infrared SpectroscopyWe used the multichannel fNIRS optical topography system ETG-4000 (Hitachi Medical Corporation, Kashiwa, Japan) using two wavelengths of near-infrared light (695 and 830 nm). We analyzed the optical data based on the modified Beer–Lambert law21 as previously described.22 This method allowed us to calculate Hb signals reflecting the oxy- and deoxy-Hb concentration changes, calculated in arbitrary units (millimolar–millimeter).22 The sampling rate was set at 10 Hz. We used two 3 by 5 multichannel probe holders, each consisting of eight illuminating and seven detecting probes arranged alternately at an interprobe distance of 3 cm, resulting in 44 channels (CH) across both sides of the head. Specific settings were as previously described.20 After the fNIRS measurement, positions of illuminators and detectors were subjected to probabilistic registration of fNIRS channel positions to MNI space, and thereafter labeled for macroanatomy.23 2.3.General Linear ModelIn this study, time series oxy- and deoxy-Hb signal data were analyzed using a GLM according to the following scheme. The GLM model is given by where denotes the design matrices (where is the number of data points during recording period, and is the number of dimensions) and (where is the number of measurement channels) is the corresponding response signal strength for either oxy-Hb or deoxy-Hb parameters at the ’th channel. An example of design matrix X is shown in Fig. 1.Fig. 1An example of a design matrix X. As described in Sec. 2.4, a peak delay was set as . The row number indicates the number of samples. The first, second, third, and fourth columns indicate the canonical HRF , the derivatives, the second derivatives, and the constant, respectively. 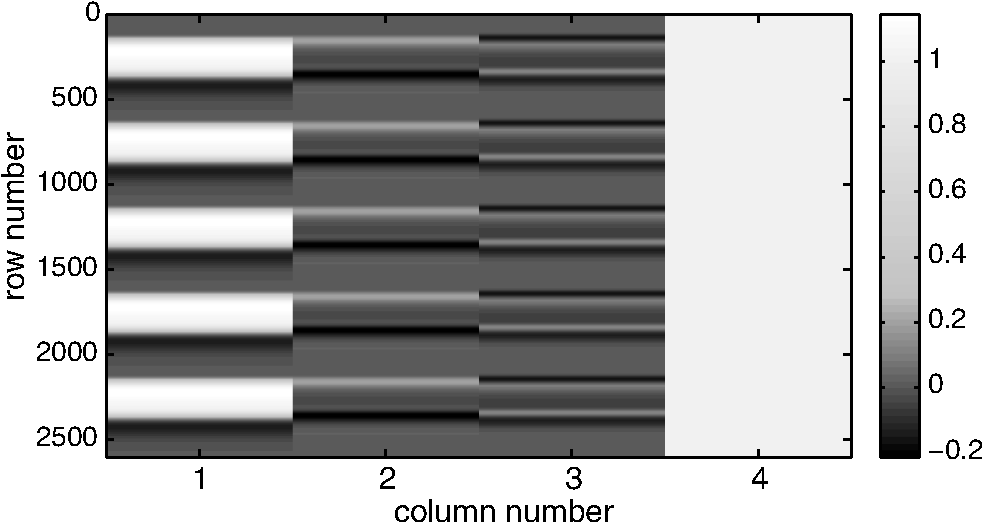 represents the -points time series in channels, and the components of the error matrix, , are independent and normally distributed with mean 0 and variance .24 Then, the least-squares estimation of is given by where is the pseudo-inverse matrix of X and given by .The regression coefficient and the residual error are tested with the one-sample -test. The values are calculated by where is the contrast vector, which determines the array elements of the regression coefficient .The precoloring method adjusted the degree of freedom.25 The degree of freedom is given by the Satterthwaite correction as follows:25 where denotes the intrinsic temporal correlation matrix, and satisfies . is the smoothing matrix. is the residual forming matrix, and it can be derived by .2.4.Hemodynamic Response FunctionIn fMRI studies, the hemodynamic response function is used to model the changes of BOLD signal in response to neural activity.26 Boynton et al.8 suggested that the gamma function with two free parameters could suitably represent hemodynamic responses.8 Accordingly, the SPM software package has adopted HRF based on the convolution of the boxcar function and the sum of two gamma functions as the canonical HRF.12 We basically modified this by adjusting the two gamma functions. For the first level analyses, individual timeline data for the oxy- and deoxy-Hb signals of each channel were analyzed using the GLM with regression to the following HRF, , according to Friston et al.9 where stands for a point in the time series. The double-gamma function is expressed with two components: the first term is the positive gamma function indicating the response and the second term indicates the undershoot. The parameter stands for the first peak delay, which is basically set to 6 s in most fMRI studies, as this is the default setting of the SPM. is the second peak delay which represents the delay of undershoot to response. To avoid complication by adjusting two different parameters, we set to 10 s as in typical fMRI studies. is the amplitude ratio between the first and second peaks and was set to 6 s as in typical fMRI studies.Basis functions were generated by convolving the variable HRF with a boxcar function . This is referred to as canonical HRF (cHRF) In addition, the temporal and dispersion derivatives of the cHRF were included to adjust the onset and dispersion of the model functions to the individual’s hemodynamic response. A bias component was also included. The -values (response amplitudes) and -values of the oxy- and deoxy-Hb signals were estimated for the cHRF predictor. These values were calculated using a least-squares model fitting procedure maximizing model-to-data fitting.27,28 2.5.Data PreprocessingAll the measured individual timeline data were precolored with filters.25 First, channel data containing unvaried periods exceeding 10% or more of the timeline were excluded. Properly measured individual timeline data for the oxy- and deoxy-Hb signals of each channel were preprocessed using the wavelet minimum description length (Wavelet-MDL), detrending to remove global trends due to breathing, cardiac movement, vasomotion and other experimental errors,29 and by temporal smoothing with convolution of the cHRF to the individual timeline data.30 2.6.Adaptive Hemodynamic Response Function ApproachWe tried to identify the optimal HRF that best models the observed signal changes of oxy- and deoxy-Hb signals in different cognitive tasks in a systematic way. The first peak delay, , was set as a variable changing from 2 to 55 s to yield the optimal HRF. To reduce complication, the second peak delay and amplitude ratio were set to the typical values (, ). To examine the effects of , the average -values over 44 channels and 28 or 30 participants were calculated for all ranges. For the deoxy-Hb signal data, in order to detect negative responses, polarities of the canonical HRF functions were reversed. The contrast vector was set as in order to perform a one-sample -test against baseline for the first component (adaptive HRF convolved with boxcar function), whereas temporal, dispersion, and baseline components were regressed out. The value that yielded the maximum average -value was determined as the optimal . 2.7.Group AnalysisFor each signal and each task, group analysis was performed. First, the value of was set to 6 s to represent the canonical HRF typically used in fMRI studies. Second, it was set to the optimal , which was derived as the maximal average -value to represent adaptive HRF. For these two values, the -values of the oxy- and deoxy-Hb signals were estimated for the canonical and adaptive HRF predictors. The obtained -values were subjected to second-level random effects group analyses using one-sample -tests against zero. A -value of less than 0.05 was considered significant. Family wise errors due to multichannel measurement were corrected using the Bonferroni method adopting stringent criteria. The analyzed data were registered to the canonical cortical surface in MNI space.31 Correlation analysis using Pearson’s method was performed on the -values of 44 channels for oxy- and deoxy-Hb signals averaged across subjects. In order to indicate actual correlation, polarities of the canonical HRF functions were not reversed for the deoxy-Hb signal data. 3.ResultsThe observed fNIRS timeline data, grand-averaged across all participants and channels, and the optimized HRF for two signals and two tasks are shown in Fig. 2. The observed oxy-Hb signal (red dashed lines) and deoxy-Hb signal (blue dashed lines) timelines revealed different time responses, with the deoxy-Hb signal being substantially delayed compared to the oxy-Hb signal, and the decreasing of the values lasting beyond the task periods. Fig. 2The observed timeline data for fNIRS and optimized HRF for two signals and for two tasks. The upper two graphs are the data for the NMT (naming task) and the lower two are those for the VFT (verbal fluency task). The red dashed lines indicate the observed timelines for oxy-Hb signal and the blue dashed lines indicate deoxy-Hb signal. The observed timeline data are the grand-average data across all participants and channels. The black solid lines indicate the HRFs, which were calculated using the optimal values for each condition. 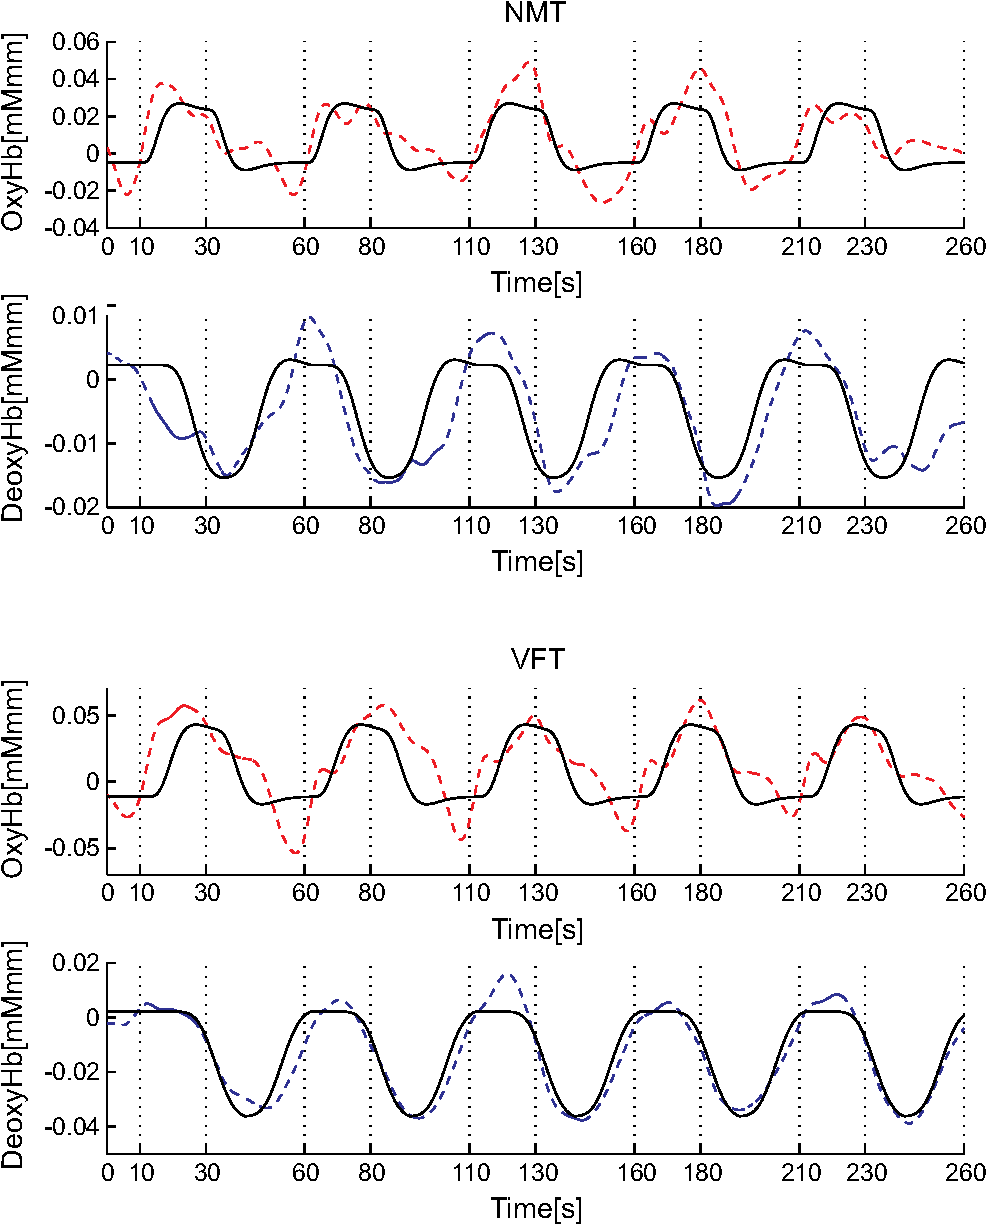 There were differences between the time responses for the NMT and the VTF. In both Hb signals, responses for the VFT were more delayed than those for the NMT. These results indicate that the time responses with fNIRS differ between each signal and each task. In search of the adaptive HRF that best represents the observed oxy- and deoxy-Hb signal changes during NMT and VFT, parameters were varied systematically. Average -values across all participants and all channels were calculated, and various values for each signal and each task are indicated by the color scale in Fig. 3. The -values of oxy-Hb signal were calculated based on the positive response and those of deoxy-Hb signal were calculated based on the negative response, because oxy- and deoxy-Hb signals have reverse polarities of a response waveform. The optimal parameters of that maximized -values were 6 s for the oxy-Hb signal in the NMT, 17 s for the deoxy-Hb signal in the NMT, 10 s for the oxy-Hb signal in the VFT, and 24 s for the deoxy-Hb signal in the VFT. Fig. 3Average -values across all participants and channels calculated for various values for each signal and each task are indicated by the color scale. The optimal value, which gave the maximum -value, was 6 s for the oxy-Hb signal in the NMT (naming task), 17 s for the deoxy-Hb signal in the NMT, 10 s for the oxy-Hb signal in the VFT (verbal fluency task), and 24 s for the deoxy-Hb signal in the VFT.  The results of the group analysis using 6 s as the value are shown in Fig. 4. In the NMT, significant oxy-Hb signal increase was found in several channels on both hemispheres with channels on the Broca area on the left hemisphere showing large -values. No activated channels were found for deoxy-Hb signal. In the VFT, significant oxy-Hb signal increase was found in three channels around the Broca area and one on the posterior part of the temporal lobe, all on the left hemisphere. No activated channels were found for deoxy-Hb signal. Fig. 4The results of the group analysis using 6 s . A -value of less than 0.05 was considered significant, and family wise errors due to multichannel measurement were corrected using the Bonferroni method. Significant -values for MNI-registered channels are indicated by color scale. From top to bottom, the maps respectively indicate analyses of the oxy-Hb signal for the NMT, the deoxy-Hb signal for the NMT, the oxy-Hb signal for the VFT, and the deoxy-Hb signal for the VFT. Significant activations were detected only with oxy-Hb signals for the NMT on both hemispheres and oxy-Hb signals for the VFT on the left hemisphere. 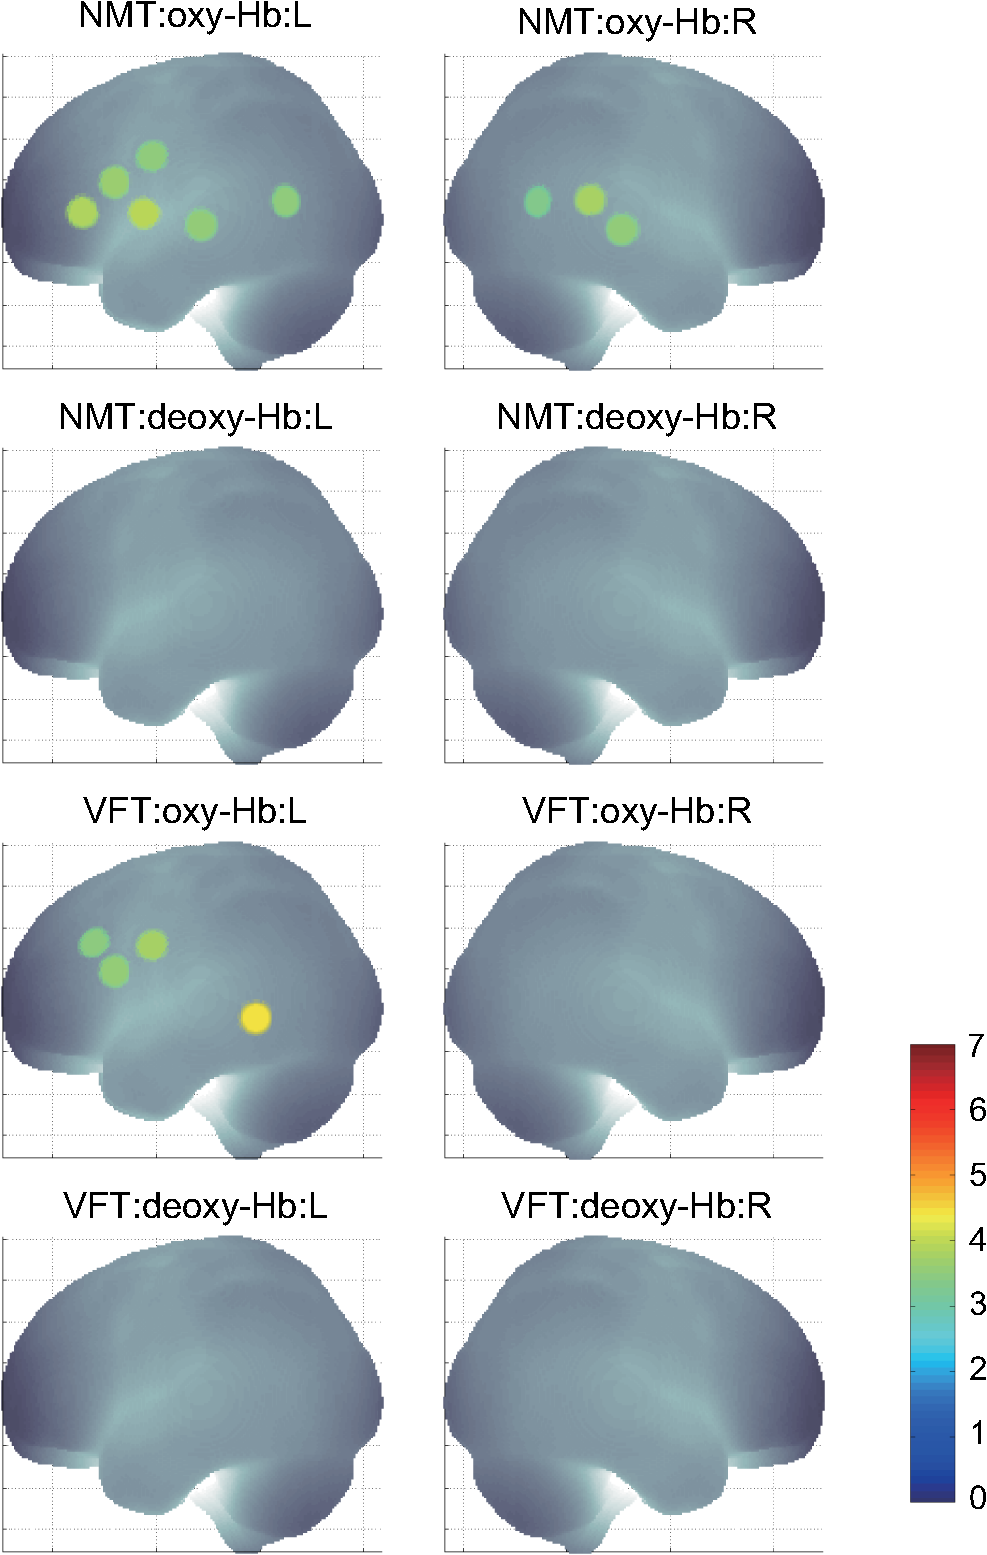 The results of the group analysis using the optimal value are shown in Fig. 5. Note that the optimal value of 6 s for oxy-Hb in the NMT was the same as the conventional value. Peak delay optimization resulted in a substantial increase in the number of activated channels for deoxy-Hb signal in the NMT: five channels on the left hemisphere with strongly activated channels on the Broca area and a weakly activated channel on the right parietal lobe. Oxy-Hb results for the VFT were also greatly affected by the peak delay optimization: the number of significantly activated channels increased from 4 to 8 on the left hemisphere with strongly activated channels being located on the Broca area, and activated channels on the right hemisphere increasing from 0 to 1. Interestingly, the peak delay optimization most affected deoxy-Hb results for the VFT. Although no activated channels were found before the peak delay optimization, the optimization led to a left-dominant bilateral activation pattern with even more activated channels with higher -values than oxy-Hb results. Strongly activated channels were located on the Broca area. Fig. 5The results of the group analysis using the optimized value. The channels with significant -values are presented as described for Fig. 4 (, Bonferroni corrected). From top to bottom, the maps respectively indicate analyses of the oxy-Hb signal for the NMT, the deoxy-Hb signal for the NMT, the oxy-Hb signal for the VFT, and the deoxy-Hb signal for the VFT. Significant activations were detected for all conditions on both hemispheres. 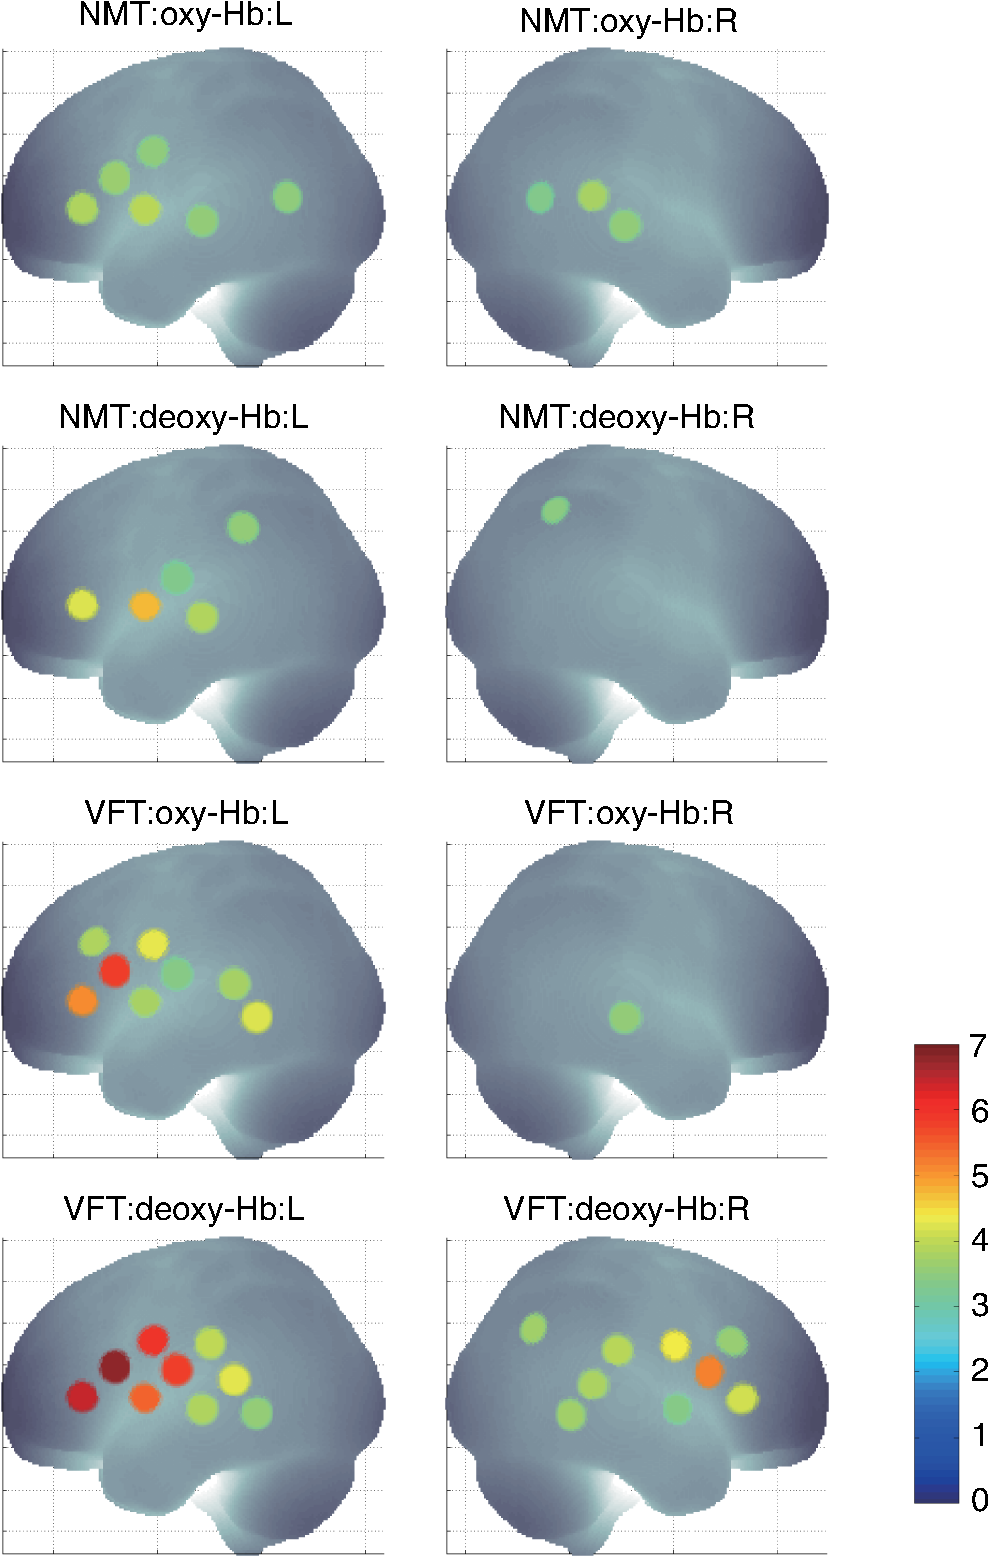 In order to assess the oxy- and deoxy-Hb activation pattern results quantitatively, correlation analyses were performed for -values of all 44 channels for oxy- and deoxy-Hb data (Fig. 6). In the conventional condition (), significant but weak positive correlations were found for oxy- and deoxy-Hb signals for the NMT (, ) and the VFT (, ). Note that these correlations were in opposite directions from those generally expected for oxy- and deoxy-Hb signals.32 On the other hand, in the optimized condition, significant moderate inverse correlations were found for the NMT (, ) and significant strong inverse correlations were found for the VFT (, ). Directions of correlations were consistent with those expected for oxy- and deoxy-Hb signals for typical activation.32 Fig. 6Correlation analyses for -values between oxy-Hb and deoxy-Hb signals among 44 channels. (a) Correlation analysis for the NMT using the peak delay (Oxy · Deoxy: ) for the typical condition. (b) Correlation analysis for the VFT using the peak delay (Oxy · Deoxy: ) for the typical condition. (c) Correlation analysis for the NMT using the optimal peak delay (Oxy: , Deoxy: ). (d) Correlation analysis for the VFT using the optimal peak delay (Oxy: , Deoxy: ). 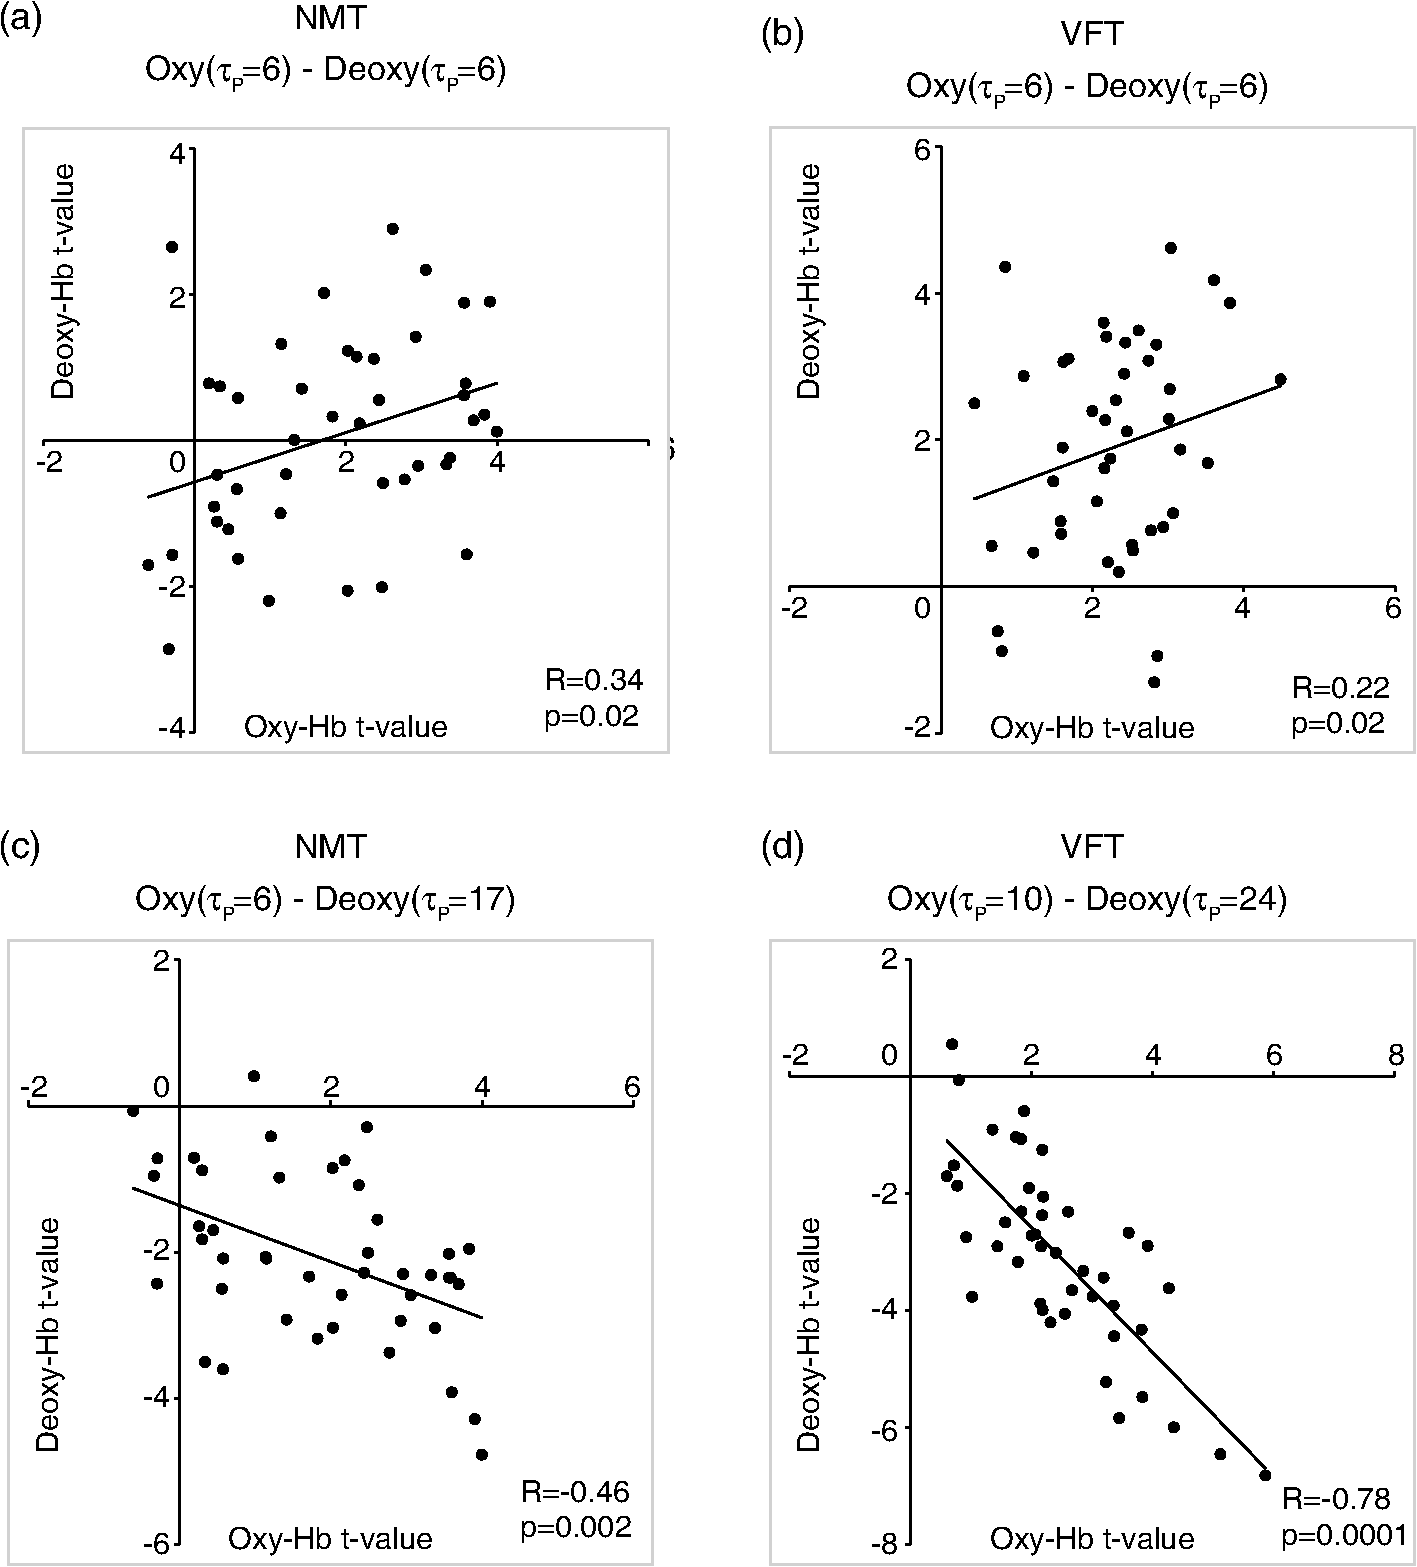 4.Discussion4.1.OverviewIn order to make the best use of the two different hemodynamic parameters available in fNIRS, we assessed their behaviors during two different cognitive tasks, NMT and VFT, which are thought to involve different modes of cognitive process. By applying the GLM with regression to the adaptive HRF, we sought the optimum temporal parameters to best explain the observed time series data. For the NMT, the best fit for oxy-Hb signal was achieved at a peak delay value () of 6 s, which is compatible with in the conventional HRF used with fMRI, whereas that for deoxy-Hb signal was 17 s. Use of an adaptive HRF approach drastically improved deoxy-Hb results to the degree that left-lateralized activation patterns, especially at the Broca area, were clearly visible. Correlations between oxy- and deoxy-Hb signals across channels shifted from positive to significantly negative with a moderate correlation coefficient. On the other hand, for the VFT, the optimum values for oxy- and deoxy-Hb signals were 10 s and 24 s, respectively, with similar spatial activation patterns including the left Broca area. Use of an adaptive HRF approach led to an increase of statistical power for oxy-Hb signal data with left-lateralized activation patterns oriented in the Broca area. Surprisingly, although the conventional HRF approach failed to detect any activation with deoxy-Hb signal, the adaptive HRF approach led to the observation of activation patterns similar to those of oxy-Hb results with even higher sensitivity. Correlations between oxy- and deoxy-Hb signals across channels shifted from positive to significantly inverse with a large correlation coefficient. HRF generated using these peak delay values was fairly consistent with the time series waveform data averaged across subjects (Fig. 6), suggesting that HRF was well adjusted to differences in hemoglobin parameters and task species. While recent studies adjusted the HRF parameters using visual inspection,33 we propose an adaptive HRF approach that systematically searches for optimum peak delays, realizing an objective method free from subjective data interpretation. 4.2.Variability between Oxy-Hb and Deoxy-Hb ParametersTo date, only a few studies have dealt with temporal variability in oxy- and deoxy-Hb parameters. In a previous study, we mentioned that the deoxy-Hb signal exhibited a waveform with substantially delayed peaks compared to oxy-Hb signal in overt and covert naming tasks.20 This observation led us to develop the current approach utilizing an adaptive HRF. In simultaneous fNIRS and fMRI measurements, Huppert et al. demonstrated that the peak latency of the deoxy-Hb signal was delayed compared to that of the oxy-Hb signal,34 while it was fairly consistent with that of the BOLD signal. Considering such variability in hemodynamic responses, Hoshi raised a concern about blindly adapting the GLM approach to fNIRS data and emphasized the necessity of taking hemodynamic variations into account.16 Also, Cohen-Adad et al. argued that the use of a single canonical HRF as a regressor for both hemoglobin parameters is inappropriate.35 Although they are not overtly referred to, the delayed deoxy-Hb signal responses can be clearly detected in several oxy- and deoxy-Hb waveform data published. For example, for a verbal fluency task performed in a block design paradigm, the peak of deoxy-Hb signal was substantially delayed, extending into the rest period and failing to return to the basal level as the oxy-Hb signal (Fig. 7 in Herrmann et al.36). In a letter fluency task lasting for 1 min, oxy-Hb signal peaked at 20 s, while deoxy-Hb signal peaked at around the end of the task period (Fig. 1 in Suto et al.37). In a tower of Hanoi task lasting for 1 min, the deoxy-Hb peak was substantially delayed compared to the oxy-Hb peak [Fig. 1(b) in Ikezawa et al.38]. As was the case in the current study, all of these studies exhibited peak delays for the deoxy-Hb signal, but to a different degree depending on task species and experimental conditions. Fig. 7Examples of HRF values of 6, 10 and 15 s. The black line indicates the boxcar function showing a stimulus. The blue solid, red dashed, and green dotted lines indicate HRFs in the case of , 10, and 15 s, respectively. 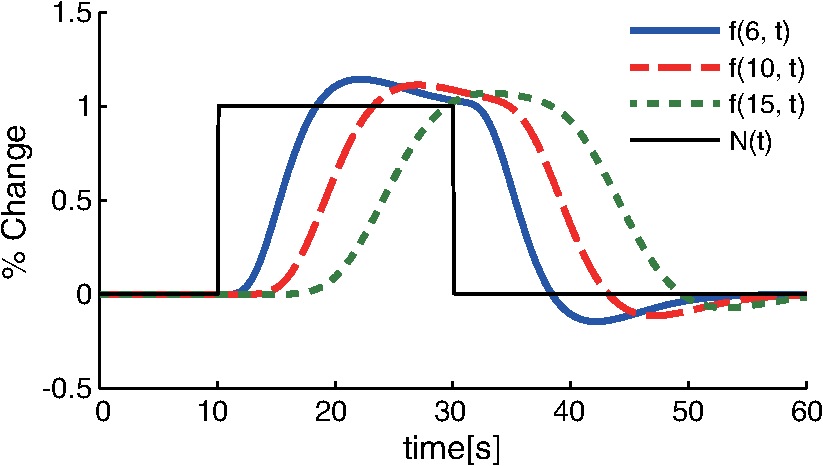 From a different perspective, often it has been reported that the deoxy-Hb signal tends to yield lower statistical power and more localized activation than the oxy-Hb signal. For example, in our former report using overt and covert naming tasks, we focused our analyses on the oxy-Hb signal because the deoxy-Hb signal failed to yield sufficient statistical power. Herrmann et al. reported that a VFT led to bilateral, left-dominant DLPFC activation with increases in oxy-Hb signal and more localized decreases in deoxy-Hb signal.39 Interestingly, when deoxy-Hb data in the current study were assessed using the HRF for the peak delays of oxy-Hb signals, they turned out to exhibit weaker activations in a more localized manner than the oxy-Hb data. On the other hand, when the optimized peak delays were adopted, the deoxy-Hb data yielded comparable activations with similar statistical power and spatial patterns as the oxy-Hb data. These results clearly demonstrate that the use of mal-optimized HRF for the deoxy-Hb data can lead to false negativity. One often finds fNIRS studies exploring both hemoglobin parameters with the same analyses but reporting sole use of oxy-Hb signal due to a failure to detect activation in the deoxy-Hb parameter. However, there is the possibility that such cases may be attributed to insufficient consideration of peak delays in the deoxy-Hb signal. Moreover, a falsely interpreted peak delay for the deoxy-Hb signal affects not only the GLM with regression to HRF, but also averaging data over a certain time period. For example, in averaged waveform data across subjects (Fig. 2), the deoxy-Hb signal peaked during the rest period, and did not reach the basal level even at the end of the rest period. When rest periods are this short, the changes of deoxy-Hb signal from a previous task round are carried over to the next, and, in extreme cases, may result in an apparent deoxy-Hb signal increase during a task period, so that the activation detected may be false activation. The current study explored the optimized peak delays for each hemoglobin parameter. As a result, -values for the deoxy-Hb data in the language-related area were larger than those for oxy-Hb data. Thus, it is possible that when HRF is optimized for peak delay values, the power of deoxy-Hb data can sometimes exceed that of oxy-Hb data. 4.3.Physiology Underlying Variability of Hemoglobin SpeciesA general consensus has yet to be established regarding physiological events underlying different behaviors of oxy- and deoxy-Hb signals. Generally, oxy-Hb is thought to replenish oxygen that has been consumed for regional neuronal activity. Upon a regional increase of neuronal activity, cerebral arteries are elongated due to neurovascular coupling. This leads to an increased blood flow and volume, which washes out deoxy-Hb.40 Consequently, increased oxy-Hb signal and decreased deoxy-Hb signal inversely correlate to one another.32 Since oxy-Hb is diamagnetic, while deoxy-Hb is paramagnetic, the hemodynamic changes triggered by neuronal activity are reflected in changes of BOLD signal in the fMRI.40 Thus, with fMRI, one does not have to deal with two Hb species but solely with the BOLD signal that compositely reflects the changes in Hb signals. Since the sampling rate of the fMRI is on the order of seconds, the temporal structure of the BOLD signal is also simpler than that of fNIRS. However, a high temporal resolution with a general sampling rate on the subsecond order and separability of Hb species inevitably pose, to fNIRS, the issue of different behaviors of Hb species. A study using imaging spectroscopy of the intrinsic signal of a cat cortex revealed that neural activity first evokes a slight increase of the deoxy-Hb component peaking at 2 s. This was followed by a decrease of the deoxy-Hb component peaking at 7 s with an amplitude threefold larger than the initial deoxy-Hb signal increase. On the other hand, the oxy-Hb component was twofold larger than the second deoxy-Hb peak and peaked at 5 s.41 The first deoxy-Hb peak was interpreted as representing increased aerobic metabolism for localized neuronal activity. This observation suggests that a second physiological event immediately compensated for the initial oxy-Hb decrease. Kuschinsky and Paulson suggested that a fast and highly localized blood volume and flow redistribution in the capillaries may account for this cancellation.42 The oxygen consumption was compensated for with a rapid increase of highly localized blood volume and flow in the capillaries, which contributes to the small decrease of deoxy-Hb and small increase of oxy-Hb signals. Finally, a large activity-dependent increase of blood volume and flow to the tissue causes a delayed and global increase of oxy-Hb concentration and decrease of deoxy-Hb concentration.43–45 According to these theories, a more delayed peak of deoxy-Hb than oxy-Hb signals is interpreted as a composite effect of the initial deoxy-Hb signal increase and later decrease. However, this inherently leads to further spatial and temporal variability in degrees of peak delay. First, the initial deoxy-Hb signal increase is localized while the later component is more global; the delay is expected to be longer for activation focus than other areas. Second, the initial deoxy-Hb signal increase is dependent on local capillary distribution, and the ratio of initial increase and later decrease of deoxy-Hb signal is difficult to predict. Further studies are necessary to understand the detailed mechanism of spatial and temporal variability of hemoglobin parameters. Meanwhile, the adaptive HRF method is expected to provide a practical solution for adjusting to physiological variabilities inherent to deoxy-Hb signal. 4.4.Variability among Task SpeciesWe also detected task-related variability of peak delay: for the oxy-Hb signal, was 6 s in the NMT but 10 s in the VFT. Peak delay was further elongated for the deoxy-Hb signal: was 17 s in the NMT and 24 s in the VFT. The optimum peak delay of the oxy-Hb signal with a value of 6 s in the NMT corresponded well to the peak delay value predominantly used in the fMRI studies, which is also the default setting of the SPM.8,9 The NMT involves the presentation of stimuli at a constant interval during the task period, but presented stimuli are independent of one another. Since each stimulus can be regarded as an independent event, the cognitive load should be similar throughout a task period. In other words, the task periods in a block design paradigm can be interpreted as repeated events. Thus, the peak delay with a value of 6 s for the oxy-Hb signal and slight delay by several seconds for the deoxy-Hb signal seems reasonable. On the other hand, peak delay for the VFT was much larger for both Hb species. This seems relevant considering the cognitive nature of a VFT, where a generated word affects the generation of the next word in a cumulative way. During the task periods, participants try to produce words that they have not yet generated. First, to realize this rule, they have to keep a list of generated words in their working memory. Consequently, the working memory load would gradually increase as the task progresses till the end of each task period. Second, for each block, the word search would become increasingly difficult as the task period progresses, and the increased cognitive load may evoke greater activation as the task progresses. As demonstrated above, the adaptive HRF method could explain the behaviors of oxy- and deoxy-Hb signals during a task with an increasing cognitive load, and thus serves as an objective method to fully utilize the temporal structures of fNIRS data for both Hb parameters. 4.5.LimitationsThe large differences in peak delay for task and hemoglobin species cannot be fully explained by the current model. There are many parameters in the basis function, which is made up by convolving a boxcar function and the HRF. Ideally, each parameter should be optimized to reflect the hemodynamic events underlying different cognitive tasks. To avoid complication, we chose to begin by optimizing one parameter, , which represents peak delay. Adjusting the peak delay could lead to good modeling of oxy- and deoxy-Hb data for different cognitive tasks. However, this does not necessarily perfectly reflect the physiological events that actually occur. For example, the second peak delay () and amplitude ratio () may be optimized to better explain different behaviors of Hb parameters. On the other hand, the task differences may be better explained by modifying the boxcar function. The choice of a boxcar function implies that the cognitive load remains unchanged throughout the task period, but this may not reflect the reality of the conditions. Alternative functions, such as a linear or nonlinear increment model, to adjust the boxcar function would be preferable, but such alternative functions should be based on neural or physiological mechanisms underlying the changes in the cognitive load. This could be a future research focus. We also have to note that the current study was performed in a retrospective manner, and thus the experimental design was not optimized to address task differences: VFT and NMT were performed by different groups of subjects. It would be preferable for the same subject group to undergo both VFT and NMT in an alternating manner to exclude any possible factors attributed to group differences. Further investigation employing a within-subject design is necessary to address this issue. 5.ConclusionTo conclude, we proposed a GLM with regression to an adaptive HRF, an objective statistical method to make the best use of the temporal resolution and variety of hemoglobin sources in fNIRS. We revealed that the adaptive HRF approach can increase statistical power by incorporating variability incorporating hemoglobin and task species into the model, while the conventional approach with canonical HRF may lead to low statistical power and false negativity. This is especially effective for tasks with increasing cognitive loads such as a VFT. The adaptive HRF approach increases sensitivity for the detection of deoxy-Hb parameters, and thus facilitates the use of the deoxy-Hb signal in experimental and clinical situations. However, we have to note the importance of further characterizing the physiological mechanisms underlying the different temporal structures of the two Hb signals. Also, generalizability of the use of the adaptive HRF approach should be explored for various tasks. Despite these limitations, the GLM with regression to an adaptive HRF has potential as a useful method to fully utilize the temporal information of oxy- and deoxy-Hb signals, and thus extends the applicability of fNIRS neuroimaging. The adaptive HRF tools described in this study are available through our website ( http://brain-lab.jp). AcknowledgmentsWe appreciate ELCS for English proofreading. This work was supported in part by the Grant-in-Aid for Scientific Research from the Japan Society for Promotion of Science (22242012 and 23650217 to ID, 23390354 to EW, and 25670625 to MU), and Health and Labor Sciences Research Grants, Research on Psychiatric and Neurological Diseases and Mental Health (to ID). ReferencesM. FerrariV. Quaresima,
“A brief review on the history of human functional near-infrared spectroscopy (fNIRS) development and fields of application,”
NeuroImage, 63
(2), 921
–935
(2012). http://dx.doi.org/10.1016/j.neuroimage.2012.03.049 NEIMEF 1053-8119 Google Scholar
F. Scholkmannet al.,
“A review on continuous wave functional near-infrared spectroscopy and imaging instrumentation and methodology,”
NeuroImage, 85
(Pt 1), 6
–27
(2014). http://dx.doi.org/10.1016/j.neuroimage.2013.05.004 NEIMEF 1053-8119 Google Scholar
H. ObrigA. Villringer,
“Beyond the visible--imaging the human brain with light,”
J. Cereb. Blood Flow Metab., 23
(1), 1
–18
(2003). http://dx.doi.org/10.1097/00004647-200301000-00001 JCBMDN 0271-678X Google Scholar
S. Lloyd-FoxA. BlasiC. E. Elwell,
“Illuminating the developing brain: the past, present and future of functional near infrared spectroscopy,”
Neurosci. Biobehav. Rev., 34
(3), 269
–284
(2010). http://dx.doi.org/10.1016/j.neubiorev.2009.07.008 NBREDE 0149-7634 Google Scholar
S. TakJ. C. Ye,
“Statistical analysis of fNIRS data: a comprehensive review,”
NeuroImage, 85
(Pt 1), 72
–91
(2014). http://dx.doi.org/10.1016/j.neuroimage.2013.06.016 NEIMEF 1053-8119 Google Scholar
M. L. Schroeteret al.,
“Towards a standard analysis for functional near-infrared imaging,”
NeuroImage, 21
(1), 283
–290
(2004). http://dx.doi.org/10.1016/j.neuroimage.2003.09.054 NEIMEF 1053-8119 Google Scholar
P. H. Kohet al.,
“Functional optical signal analysis: a software tool for near-infrared spectroscopy data processing incorporating statistical parametric mapping,”
J. Biomed. Opt., 12
(6), 064010
(2007). http://dx.doi.org/10.1117/1.2804092 JBOPFO 1083-3668 Google Scholar
G. M. Boyntonet al.,
“Linear systems analysis of functional magnetic resonance imaging in human V1,”
J. Neurosci., 16
(13), 4207
–4221
(1996). JNRSDS 0270-6474 Google Scholar
K. J. Fristonet al.,
“Event-related fMRI: characterizing differential responses,”
NeuroImage, 7
(1), 30
–40
(1998). http://dx.doi.org/10.1006/nimg.1997.0306 NEIMEF 1053-8119 Google Scholar
G. M. BoyntonS. A. EngelD. J. Heeger,
“Linear systems analysis of the fMRI signal,”
NeuroImage, 62
(2), 975
–984
(2012). http://dx.doi.org/10.1016/j.neuroimage.2012.01.082 NEIMEF 1053-8119 Google Scholar
G. K. AguirreE. ZarahnM. D'Esposito,
“The variability of human, BOLD hemodynamic responses,”
NeuroImage, 8
(4), 360
–369
(1998). http://dx.doi.org/10.1006/nimg.1998.0369 NEIMEF 1053-8119 Google Scholar
D. A. HandwerkerJ. M. OllingerM. D'Esposito,
“Variation of BOLD hemodynamic responses across subjects and brain regions and their effects on statistical analyses,”
NeuroImage, 21
(4), 1639
–1651
(2004). http://dx.doi.org/10.1016/j.neuroimage.2003.11.029 NEIMEF 1053-8119 Google Scholar
J. C. Yeet al.,
“NIRS-SPM: statistical parametric mapping for near-infrared spectroscopy,”
NeuroImage, 44
(2), 428
–447
(2009). http://dx.doi.org/10.1016/j.neuroimage.2008.08.036 NEIMEF 1053-8119 Google Scholar
T. J. Huppertet al.,
“HomER: a review of time-series analysis methods for near-infrared spectroscopy of the brain,”
Appl. Opt., 48
(10), D280
–D298
(2009). http://dx.doi.org/10.1364/AO.48.00D280 APOPAI 0003-6935 Google Scholar
M. M. Plichtaet al.,
“Model-based analysis of rapid event-related functional near-infrared spectroscopy (NIRS) data: a parametric validation study,”
NeuroImage, 35
(2), 625
–634
(2007). http://dx.doi.org/10.1016/j.neuroimage.2006.11.028 NEIMEF 1053-8119 Google Scholar
Y. Hoshi,
“Functional near-infrared spectroscopy: current status and future prospects,”
J. Biomed. Opt., 12
(6), 062106
(2007). http://dx.doi.org/10.1117/1.2804911 JBOPFO 1083-3668 Google Scholar
Y. Minagawa-Kawaiet al.,
“Optical brain imaging reveals general auditory and language-specific processing in early infant development,”
Cereb. Cortex., 21
(2), 254
–261
(2011). http://dx.doi.org/10.1093/cercor/bhq082 53OPAV 1047-3211 Google Scholar
M. Takeuchiet al.,
“Brain cortical mapping by simultaneous recording of functional near infrared spectroscopy and electroencephalograms from the whole brain during right median nerve stimulation,”
Brain. Topogr., 22
(3), 197
–214
(2009). http://dx.doi.org/10.1007/s10548-009-0109-2 BRTOEZ 0896-0267 Google Scholar
H. Danet al.,
“Language-specific cortical activation patterns for verbal fluency tasks in Japanese as assessed by multichannel functional near-infrared spectroscopy,”
Brain. Lang., 126
(2), 208
–216
(2013). http://dx.doi.org/10.1016/j.bandl.2013.05.007 0093-934X Google Scholar
A. Moriai-Izawaet al.,
“Multichannel fNIRS assessment of overt and covert confrontation naming,”
Brain. Lang., 121
(3), 185
–193
(2012). http://dx.doi.org/10.1016/j.bandl.2012.02.001 0093-934X Google Scholar
M. Copeet al.,
“Methods of quantitating cerebral near infrared spectroscopy data,”
Adv. Exp. Med. Biol., 222 183
–189
(1988). http://dx.doi.org/10.1007/978-1-4615-9510-6 AEMBAP 0065-2598 Google Scholar
A. Makiet al.,
“Spatial and temporal analysis of human motor activity using noninvasive NIR topography,”
Med. Phys., 22
(12), 1997
–2005
(1995). http://dx.doi.org/10.1118/1.597496 MPHYA6 0094-2405 Google Scholar
D. TsuzukiI. Dan,
“Spatial registration for functional near-infrared spectroscopy: from channel position on the scalp to cortical location in individual and group analyses,”
NeuroImage, 85
(Pt 1), 92
–103
(2014). http://dx.doi.org/10.1016/j.neuroimage.2013.07.025 NEIMEF 1053-8119 Google Scholar
K. J. Fristonet al.,
“Analysis of fMRI time-series revisited,”
NeuroImage, 2
(1), 45
–53
(1995). http://dx.doi.org/10.1006/nimg.1995.1007 NEIMEF 1053-8119 Google Scholar
K. J. WorsleyK. J. Friston,
“Analysis of fMRI time-series revisited--again,”
NeuroImage, 2
(3), 173
–181
(1995). http://dx.doi.org/10.1006/nimg.1995.1023 NEIMEF 1053-8119 Google Scholar
K. J. FristonP. JezzardR. Turner,
“Analysis of functional MRI time-series,”
Hum. Brain Mapp., 1 153
–171
(1994). http://dx.doi.org/10.1002/hbm.v1:2 HBRME7 1065-9471 Google Scholar
E. Bullmoreet al.,
“Statistical methods of estimation and inference for functional MR image analysis,”
Magn. Reson. Med., 35
(2), 261
–277
(1996). http://dx.doi.org/10.1002/(ISSN)1522-2594 MRMEEN 0740-3194 Google Scholar
E. T. Bullmoreet al.,
“Functional magnetic resonance image analysis of a large-scale neurocognitive network,”
NeuroImage, 4
(1), 16
–33
(1996). http://dx.doi.org/10.1006/nimg.1996.0026 NEIMEF 1053-8119 Google Scholar
K. E. Janget al.,
“Wavelet minimum description length detrending for near-infrared spectroscopy,”
J. Biomed. Opt., 14
(3), 034004
(2009). http://dx.doi.org/10.1117/1.3127204 JBOPFO 1083-3668 Google Scholar
K. J. Fristonet al.,
“To smooth or not to smooth? Bias and efficiency in fMRI time-series analysis,”
NeuroImage, 12
(2), 196
–208
(2000). http://dx.doi.org/10.1006/nimg.2000.0609 NEIMEF 1053-8119 Google Scholar
M. Okamotoet al.,
“Three-dimensional probabilistic anatomical cranio-cerebral correlation via the international 10–20 system oriented for transcranial functional brain mapping,”
NeuroImage, 21
(1), 99
–111
(2004). http://dx.doi.org/10.1016/j.neuroimage.2003.08.026 NEIMEF 1053-8119 Google Scholar
H. Obriget al.,
“Near-infrared spectroscopy: does it function in functional activation studies of the adult brain?,”
Int. J. Psychophysiol., 35
(2–3), 125
–142
(2000). http://dx.doi.org/10.1016/S0167-8760(99)00048-3 IJPSEE 0167-8760 Google Scholar
S. Heinzelet al.,
“Variability of (functional) hemodynamics as measured with simultaneous fNIRS and fMRI during intertemporal choice,”
NeuroImage, 71 125
–134
(2013). http://dx.doi.org/10.1016/j.neuroimage.2012.12.074 NEIMEF 1053-8119 Google Scholar
T. J. Huppertet al.,
“A temporal comparison of BOLD, ASL, and NIRS hemodynamic responses to motor stimuli in adult humans,”
NeuroImage, 29
(2), 368
–382
(2006). http://dx.doi.org/10.1016/j.neuroimage.2005.08.065 NEIMEF 1053-8119 Google Scholar
J. Cohen-Adadet al.,
“Activation detection in diffuse optical imaging by means of the general linear model,”
Med. Image. Anal., 11
(6), 616
–629
(2007). http://dx.doi.org/10.1016/j.media.2007.06.002 MIAECY 1361-8415 Google Scholar
M. J. HerrmannA. C. EhlisA. J. Fallgatter,
“Frontal activation during a verbal-fluency task as measured by near-infrared spectroscopy,”
Brain Res. Bull., 61
(1), 51
–56
(2003). http://dx.doi.org/10.1016/S0361-9230(03)00066-2 BRBUDU 0361-9230 Google Scholar
T. Sutoet al.,
“Multichannel near-infrared spectroscopy in depression and schizophrenia: cognitive brain activation study,”
Biol. Psychiatry., 55
(5), 501
–511
(2004). http://dx.doi.org/10.1016/j.biopsych.2003.09.008 BIPCBF 0006-3223 Google Scholar
K. Ikezawaet al.,
“Impaired regional hemodynamic response in schizophrenia during multiple prefrontal activation tasks: a two-channel near-infrared spectroscopy study,”
Schizophr. Res., 108
(1–3), 93
–103
(2009). http://dx.doi.org/10.1016/j.schres.2008.12.010 SCRSEH 0920-9964 Google Scholar
M. J. Herrmannet al.,
“Cerebral oxygenation changes in the prefrontal cortex: effects of age and gender,”
Neurobiol. Aging., 27
(6), 888
–894
(2006). http://dx.doi.org/10.1016/j.neurobiolaging.2005.04.013 NEAGDO 0197-4580 Google Scholar
S. Ogawaet al.,
“Brain magnetic resonance imaging with contrast dependent on blood oxygenation,”
Proc. Natl. Acad. Sci. U. S. A., 87
(24), 9868
–9872
(1990). http://dx.doi.org/10.1073/pnas.87.24.9868 PNASA6 0027-8424 Google Scholar
D. MalonekA. Grinvald,
“Interactions between electrical activity and cortical microcirculation revealed by imaging spectroscopy: implications for functional brain mapping,”
Science, 272
(5261), 551
–554
(1996). http://dx.doi.org/10.1126/science.272.5261.551 SCIEAS 0036-8075 Google Scholar
W. KuschinskyO. B. Paulson,
“Capillary circulation in the brain,”
Cerebrovasc. Brain. Metab. Rev., 4
(3), 261
–286
(1992). CEMREV 1040-8827 Google Scholar
A. Grinvaldet al.,
“Functional architecture of cortex revealed by optical imaging of intrinsic signals,”
Nature, 324
(6095), 361
–364
(1986). http://dx.doi.org/10.1038/324361a0 NATUAS 0028-0836 Google Scholar
R. D. Frostiget al.,
“Cortical functional architecture and local coupling between neuronal activity and the microcirculation revealed by in vivo high-resolution optical imaging of intrinsic signals,”
Proc. Natl. Acad. Sci. U. S. A., 87
(16), 6082
–6086
(1990). http://dx.doi.org/10.1073/pnas.87.16.6082 PNASA6 0027-8424 Google Scholar
D. Maloneket al.,
“Vascular imprints of neuronal activity: relationships between the dynamics of cortical blood flow, oxygenation, and volume changes following sensory stimulation,”
Proc. Natl. Acad. Sci. U. S. A., 94
(26), 14826
–14831
(1997). http://dx.doi.org/10.1073/pnas.94.26.14826 PNASA6 0027-8424 Google Scholar
BiographyMinako Uga received her BSc and MSc degrees in engineering from Sophia University in 1992 and 1994, and she received her MS and PhD degrees in medical sciences from the University of Tsukuba, in 2005 and 2010. She is a postdoctoral fellow at Jichi Medical University, Japan. Her current research interests include development of fNIRS methodology and adaptation to the brain science research of miniature pigs as laboratory animals. Ippeita Dan graduated from International Christian University (1993) and received his PhD degree from University of Tokyo (2002), Japan. He was a senior research fellow at the National Food Research Institute and an associate professor at Jichi Medical University, Japan. He was appointed as a professor at Chuo University, Tokyo, Japan. He has authored 70 peer-reviewed articles attracting over 2000 citations. His main research missions lie in clinical application of fNIRS, methodological development of fNIRS data analyses, and application of psychometrics for marketing in food-related business. Toshifumi Sano received his BA degree in electrical engineering and MA degree in electrical engineering in 2009 and 2011 from Nagaoka University of Technology, Japan. He is a technical associate (2011 to 2014) at Jichi Medical University, Japan. He is also a visiting research fellow of Research and Development Initiatives at Chuo University, Japan. He is in charge of numerical programming for analyzing fNIRS data. Haruka Dan received her MA degree from International Christian University in 2001 and her PhD degree from Tohoku University, Japan, in 2005. She was a postdoctoral fellow at the National Food Research Institute and Jichi Medical University, Japan. She is now a visiting assistant professor of Research and Development Initiatives at Chuo University, Japan. She has authored 32 peer-reviewed scientific articles, including 20 top-authored contributions over various topics ranging from plant physiology, behavioral food science, and cognitive neuroscience. Eiju Watanabe received his MD and PhD degrees from the University of Tokyo, Japan, in 1976 and 1984. His major career achievements include being assistant professor in the Department of Neurosurgery at the University of Tokyo, research fellow at the University of Erlangen, West Germany, and Chairman of the Department of Neurosurgery at Tokyo Metropolitan Police Hospital. Currently, he is a professor and the chairman of the Department of Neurosurgery at Jichi Medical University, Japan. He is known for his work as an inventor of a neuronavigation system and an initiator of fNIRS imaging known as optical topography. |


