|
|
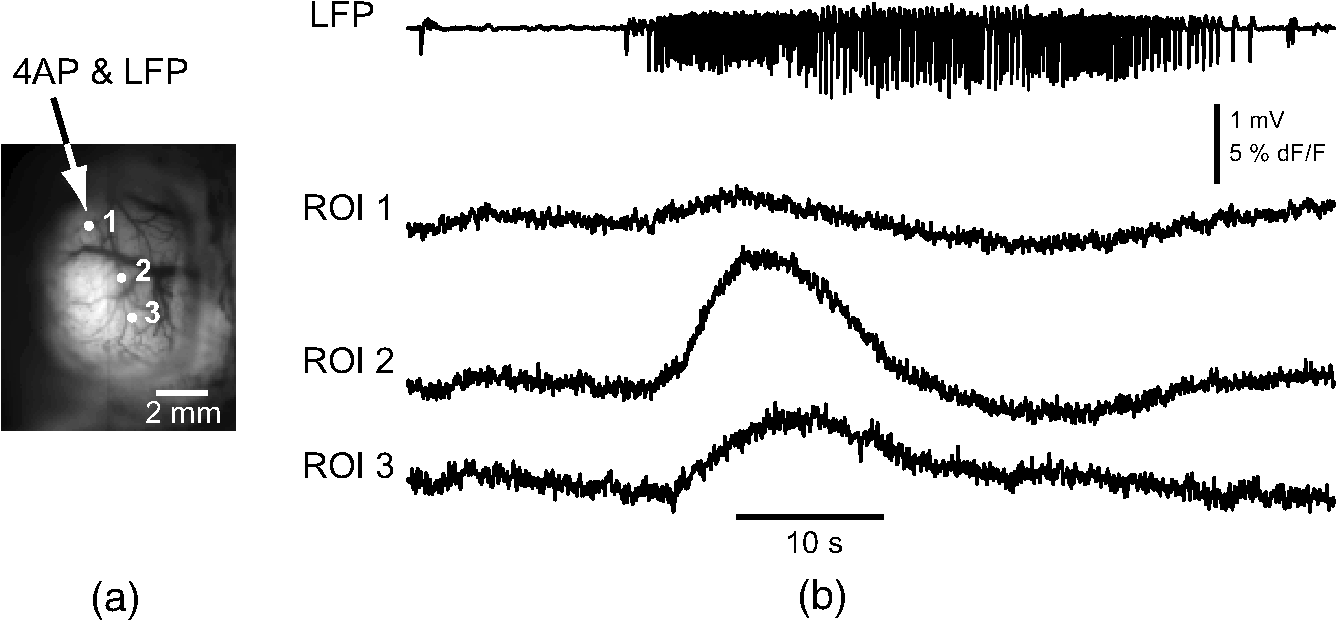
1.IntroductionNeurovascular coupling refers to the relationship between local neural activity and subsequent changes in cerebral blood flow (CBF). Changes in neuronal activity adjust regional blood flow with optimal magnitude and spatial location through a complex sequence of coordinated events involving neurons, glia, and vascular cells.1–4 In the clinic, perfusion-based functional brain imaging techniques, such as functional magnetic resonance imaging (fMRI), rely on this relationship to infer changes in underlying neural activity. An important issue in resultant data interpretation pertains to the spatial and temporal precision of the hemodynamic changes in comparison to the underlying neuronal activity. The study of neurovascular coupling has primarily focused on the role of different cell types (e.g., neurons, astrocytes, and pericytes) and physiological parameters [e.g., lactate, NADH (nicotinamide adenine dinucleotide (NAD) + hydrogen (H)), O2, nitric oxide) on CBF changes.5–11 However, in these studies, neuronal activity is typically recorded from a small group of neurons using a single electrode or a small population of loaded cells or even a single cell, thus leading to a spatial mismatch in the sampling area compared to traditional wide-field imaging techniques used to record hemodynamic changes. Population events and cortical processing that occur at the level of the network, such as somatosensory or epileptic activity, cannot be fully understood at such a fine scale. A method that can simultaneously record neuronal, glial, and hemodynamic changes with the same spatiotemporal resolution over a large area of cortex would be useful to study the spatial and temporal precision of network neurovascular coupling. Our lab has recently established a simultaneous voltage-sensitive dye (VSD) and intrinsic optical signal (IOS) imaging system to study the spatiotemporal precision in neurovascular coupling.12 However, a limitation of this method is that the illumination (600 to 650 nm) and the fluorescence wavelength () of VSD imaging (new blue dye) is overlapped by the popular visible wavelength used in IOS that reflects blood oxygenation (610 to 700 nm), permitting only blood volume to be recorded concurrently with VSD data. Although near-infrared spectroscopy using a longer wavelength can also record oximetry and blood volume changes, it is technically difficult to be recorded concurrently with VSD. Likewise, VSD imaging primarily records subthreshold synaptic activity in the neuropil13–15 but carries little information on glial activity or suprathreshold action potentials in neurons, which could hold important information about neurovascular coupling. Wide-field calcium imaging, on the other hand, measures different components of cortical activity than VSD and may offer a complementary method to record neuronal and glial activity that can be coupled with intrinsic signal imaging to provide more comprehensive data on network neurovascular coupling. Calcium dyes are molecules that can respond to the binding of by changing their fluorescent properties. Calcium imaging can probe various aspects of cortical dynamics in vivo, including not only neuronal input and output activity,16,17 but also glial and metabolic signaling.18 Wide-field, single-photon calcium imaging has also been widely used to measure population neuronal activity.19,20 The calcium signal can also be simultaneously recorded with intrinsic optical imaging, allows measurement of cerebral blood volume (CBV) changes.20 Current in vivo methods use targeted injections, or the multicell bolus technique, to stain small cortical areas with calcium dyes, with repeated injections required to stain more extended cortical regions.21,22 A more efficient and less damaging method to stain with calcium dyes in a smooth continuous fashion over large cortical areas (several millimeters) is not currently available. Convection-enhanced delivery (CED) is a neurosurgical delivery technique, which was developed in 1994, that allows for precise and uniform distribution of an infusate to a brain structure.23 The mechanism of CED relies on a constant source of pressure that drives the substance through the extracellular space and creates a homogeneous concentration up to the outer margin of the progressing wavefront. Beyond this wavefront, only diffusion acts, which creates a significant gradient that convection overcomes. In this study, we developed a CED method to stain a large cortical area with a single injection. We also evaluated the utility of calcium imaging when studying a variety of different neuronal processes, and we demonstrated that calcium can be imaged with CBV and oximetry simultaneously. 2.Method2.1.Animal PreparationAll experimental procedures were approved by the Weill Cornell Medical College Animal Care and Use Committee following NIH guidelines. Adult male Sprague-Dawley rats (220 to 380 g) were anesthetized with isoflurane in , 4% induction, and 1.5 to 2% maintenance. Body temperature was maintained at 37°C with a regulated heating blanket (Harvard Apparatus, Holliston, Massachusetts). The heart rate, pO2, and end tail carbon dioxide (ETCO2) were carefully monitored with a small animal Capnograph (Surgivet, Waukesha, Wisconsin) and were maintained stable throughout the experiment (heart rate: 250 to , pO2 , ETCO2 to 28 mm Hg). The head was fixed in a stereotaxic frame throughout experimentation. 2.2.Dye StainingCalcium dye, Oregon Green 488 BAPTA-1 AM (OGB-1, Life Technology, Grand Island, New York; excitation , emission ), was chosen for this study following the work of Bouchard and colleagues.20 The dye was first dissolved in 5 μl of 20% Pluronic F-127 in dimethylsulfoxide (DMSO) (w/v) and then in 50 μl of artificial cerebrospinal fluid (ACSF) (containing 125 mM NaCl, 5 mM KCl, 10 mM D-glucose, 10 mM HEPES, 2 mM MgSO4, and 2 mM CaCl2) to achieve a final concentration of . CED was employed to stain a large area of the cortex with calcium dye. A glass pipette (outside tip diameter 50 to 100 μm) was filled with the calcium dye solution and inserted into the cortex to a depth of 1 mm from the surface through a small hole created in the skull. The dye was injected with a micropump (UMP-3, World Precision Instruments Inc., Sarasota, Florida) at a speed of for 80 min (8 μl in total). The glass pipette was removed 10 min following the injection allowing the animal to rest for 1 h to permit the dye to load into the cells. In order to evaluate loading efficacy, a subgroup of animals () was similarly labeled and used for histology. For in vivo imaging, after staining, two craniotomy windows were opened over both hemispheres, and the exposed brain was covered with silicon oil (12,500 centistoke) to preserve cortical moisture. For simultaneous VSD and calcium imaging, the VSD (RH-1691; excitation , emission ) was dissolved in OGB-1 solution (). Using the micropump and the same rate, 1 μl of the combined dye was injected into the cortex in order to stain a small region of the cortex. To record the activity of astrocytic glia only (Fig. 7), we employed the staining protocol as described by Ghosh et al.24 In brief, the calcium dye, rhod-2 (rhod-2, AM, Life Technology), was first dissolved in 5 μl of 20% Pluronic F-127 in DMSO (w/v) and then in 50 μl of ACSF (). The dye solution was topically applied to the exposed cortical surface for 90 min and then the brain was washed with dye-free ACSF for 15 min. This technique allows staining of only the glia and real-time imaging of glial activity. 2.3.Optical ImagingFor wide-field calcium imaging, a CCD camera (Dalsa camera in Imager 3001, Optical Imaging, Rehovot, Israel) using a tandem lens () arrangement25 was focused 300–400 μm below the cortical surface. A - or light-emitting diode (LED) was employed as the illumination source for OGB-1 or rhod-2, respectively. The illumination was guided to the cortex with an optical fiber. A 510-nm long-pass or 590-nm long-pass filter was placed before the camera for OGB-1 or rhod-2 imaging, respectively. The setup for simultaneous VSD and calcium imaging (OGB-1) was modified from our previous simultaneous VSD and IOS system26 [Fig. 5(a)]. Two LEDs, and , coupled with a dichroic mirror were employed as illumination sources. The illumination was guided by optical fiber onto the brain surface. The fluorescence from the calcium dye (510 nm) and VSD () were wavelength-separated using a 570-nm dichroic mirror. The VSD images were captured using a MiCAM ULTIMA CMOS camera (SciMedia, Costa Mesa, California). The camera has a temporal resolution of 400 Hz and a spatial resolution of , with each pixel sampling an area of . The calcium image was recorded with a CCD camera, with a temporal resolution of 110 Hz and a spatial resolution of , with each pixel sampling an area of (Dalsa camera in Imager 3001, Optical Imaging, Rehovot, Israel). For simultaneous calcium (OGB-1) and IOS imaging, we upgraded Bouchard et al.’s setup [Fig. 6(a)]. Three LEDs at wavelengths of 470, 530, and 625 nm were employed as the illumination sources for calcium, total hemoglobin (Hbt), and deoxyhemoglobin (Hbr), respectively.27,28 The LEDs were coupled with two dichroic mirrors (490 and 590 nm) and guided to the cortex using optical fibers. A 510-nm long-pass filter was placed before the camera. Since the hemodynamic signal is slower than the calcium signal, the illumination rate of the calcium signal was set at double that of the hemodynamic illumination, providing frame rates of 55 Hz for calcium and 27.5 Hz for IOS. A modified Beer-Lambert law was used to calculate Hbr and Hbt changes from the 570- and 610-nm data using Eq. (1).29,30 where is the attenuation at each wavelength, and are the measured reflectance intensities at baseline and time , respectively, and are the changes in the concentrations of and Hbr, respectively, and and are the molar extinction coefficients. Equation (1) was solved for and using a least-squares approach. The differential path length factor, , accounts for the fact that each wavelength travels a slightly different path length through the tissue due to the wavelength dependence of scattering and absorption in the tissue and was estimated using the approach of Kohl et al.29 through Monte Carlo simulations of light propagation in tissue. The wavelength dependency of the molar extinction coefficients and the path length factors were drawn from the work by Dunn et al.302.4.Confocal Microscope and HistologyA confocal microscope was employed to examine the calcium dye loading at the single-cell level. Sulforhodamine 101 (SR101) was mixed with OGB-1 for injection in order to distinguish neurons and astroglia.31 Transcardiac perfusion fixation with 4% paraformaldehyde was performed following 0.01% sodium nitrite in phosphate buffered saline (pH 7.4) flush. The rat brain was further fixed in 4% paraformaldehyde at room temperature overnight. Coronal slices of 200 μm crossing the dye injection site was prepared. A confocal microscope (Leica TCS SP5, Buffalo Grove, Illinois) was used to image with single-cell resolution. Lasers of 488 and 543 nm were employed as the excitation wavelength for OGB-1 and SR101, respectively. The fluorescence emission was collected through 535-nm (green, for OGB-1) or 645-nm (red, for SR101) filters. Standard hematoxyline-eosine (H&E) staining was employed to exam the potential damage created by the CED protocol. After perfusion, the rat brain was further fixed in 4% paraformaldehyde at room temperature for 48 h. The rat brain was then infiltrated and embedded with paraffin for histology processing. Standard H&E staining was performed on the 7-μm coronal slice crossing the dye injection site. 2.5.Electrophysiology and Triggering of Epileptiform EventsTo record local field activity, a glass microelectrode (2 to 4 MΩ) filled with saline was positioned deep from the surface. The local field potential (LFP) was amplified and band-pass filtered (1 to 500 Hz) using a DAB-S system (World Precision Instruments, Sarasota, Florida) and digitized at 1000 Hz by a CED Power 1401. The LFP data were recorded with a PC running the Spike2 software (Cambridge Electronic Design, Cambridge, United Kingdom). To trigger epileptiform events, seizure-like discharges were induced by injecting 4-Aminopyridine (4-AP, 15 mM, 0.5 μl) 300 to 500 μm into the cortex, through a second glass microelectrode positioned 500 μm away using a Nanoject II injector (Drummond Scientific, Broomall, Pennsylvania). Multifocal interictal-spike (IIS)-like events were triggered with either a topical application of 1-mM bicuculline (Fig. 2) or a focal injection (0.5 μl) 300 to 500 μm deep into the cortex (Fig. 5). 2.6.Somatosensory StimulationTwo stainless-steel electrodes (insulated to within 2 mm of the tip) were placed on the right hind-paw. A 2-s train of electrical pulses (5 Hz, 2 mA intensity, and 0.2 ms pulse width) was delivered in 10 stimulation trials with an intertrial interval of 30 s. The stimulation parameters and delivery were controlled by a stimulation box coupled to Master-9 software and hardware (A.M.P.I, Jerusalem, Israel). Each trial was of 3.5 s duration with stimulation onset at 0.5 s. Spatiotemporal calcium imaging data for all trials, in each animal, were averaged to create a mean trial and were subjected to statistical parametric mapping (SPM), in which each pixel’s time-series was regressed against a design matrix representing a direct current offset and a boxcar function of the same duration as the stimulation. This generated a z-score activation map where high values represented large evoked calcium signal increases due to hind-paw stimulation. Pixels possessing of the maximum z-score were used to define a region of interest (ROI). The time-series from each associated pixel was then averaged. The SPM is a standard approach to identify foci of significant changes in cerebral activity using SPM.32 The SPM approach is not parameterized, but the z-score output is sensitive to the choice of a design matrix. However, in cases such as ours, in which the stimulus onset and offset is well defined, changing design matrix parameters (e.g., using a Gaussian function instead of a boxcar) has qualitatively little effect on the spatial map of activation. 3.Results3.1.Convection-Enhanced Staining of Calcium DyesTraditional multi-injection calcium staining creates inhomogeneous loading with islands of high concentration that decrease with distance from the injection site as the dye diffuses into the surrounding extracellular space [Fig. 1(b)] and multiple injections are employed to stain a large cortical area, which often results in an uneven staining [Fig. 1(b)]. CED, on the other hand, delivers a homogeneous concentration from the injection site all the way out to the advancing wavefront of the solvent as long as the pressure gradient is actively maintained [Fig. 1(a)]. Through a single injection, using our injection parameters, we were able to routinely stain a large cortical area, up to 6 mm from the injection [Fig. 1(c)]. Fig. 1Convection-enhanced delivery and bulk-loading of calcium-sensitive dye. (a) Schematic diagram of convection-enhanced delivery of calcium-sensitive dye. The calcium-sensitive dye is injected into the cortex via the electrode. The dye is driven by the pressure and propagates in spherical space. A large volume of calcium dye is injected into the cortex and a large area of the cortex is stained (up to 6 mm). Examples of (b) the older multiple injection technique for bulk-loading and (c) convection-enhanced delivery (CED) technique stained brain. The images were taken below the surface. Note that the CED technique provides smooth loading to a broad area that slowly decreases with distance from the injection site. 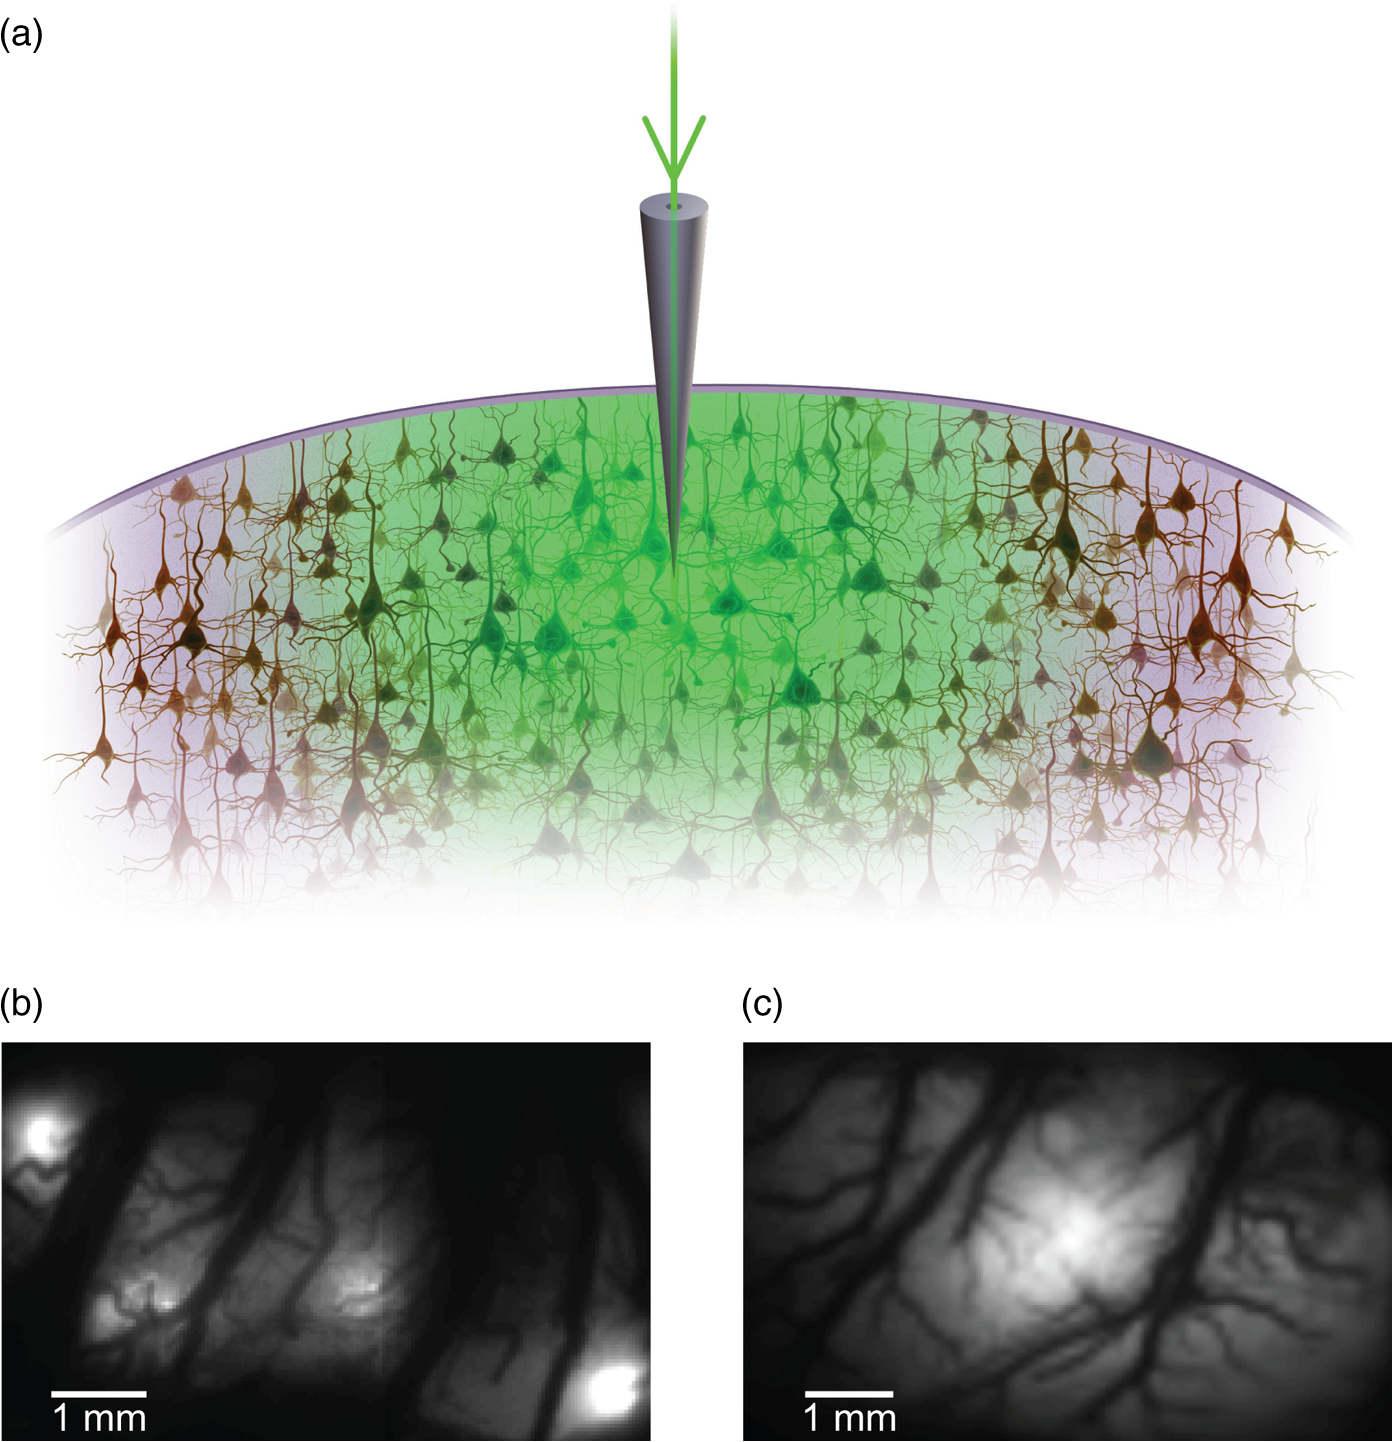 Wide-field fluorescence imaging was employed to investigate the distribution of OGB-1 within the brain. In a coronal slice through the injection site [Fig. 2(b)], calcium fluorescence spread several millimeters past the injection site in all directions with higher concentrations at the injection site itself. At 1 to 2 mm from the injection site, the calcium fluorescence showed a much more even distribution [Figs 2(b), 2(c), and 2(d)]. Vertically, the dye clearly stained all cortical layers [Figs. 2(b), 2(c), and 2(e)]. The total volume of stained neocortical tissue is estimated to be 75 to . We used curve fitting to analyze the fluorescent intensity distribution in Fig. 2(d) and found that the curve follows exponential decay with an equation of where is the normalized fluorescent intensity and (in mm) is the distance to the injection site [ and , Fig. 2(d)]. Our data indicate that the concentration of dye should also follow an exponential decay distribution. where is the dye concentration. and should be determined by the species and the volume of dye injected.Confocal microscopy was employed to verify the staining result at a cellular level. The confocal images were taken at different distances from the injection site, with green fluorescence (from OGB-1) overlaying red fluorescence (from SR101) from the same field of view [Fig. 2(f)]. The neurons were labeled with only OGB-1 (green cells), while astrocytes were co-labeled with both OGB-1 and SR101 [orange cells, Fig. 2(f)]. Close to the injection site (injection site and 1 mm), strong green fluorescence could be recorded from the background, indicating all compartments were heavily stained. The nucleus could be identified as dark areas since the calcium dye was not absorbed by the nucleus. A bright halo (slightly brighter than the background) surrounding the nucleus represents the soma. The glia could be clearly identified as orange cells. Far from the injection site (2, 3, and 4 mm), the background calcium fluorescence was weaker, and both the neurons and glia could be identified. The calcium fluorescence from the superficial neuropil could also be recorded. Clear labeling of neurons, glia, and neuropil indicates that the resulting calcium signal would be a mixture of activation from all three tissue compartments. Standard H&E staining was employed to investigate the potential damage to cortical tissue by the CED protocol [Fig. 2(g)]. The coronal slice, away from the injection site, did not show obvious tissue damage. We further investigated if neuronal activity could be recorded from the entire area of stained cortex. Bicuculline (BMI, 1mM) was topically applied to the whole brain and interictal spikes recorded from the entire extent of the exposed brain [Fig. 2(h), top]. The signal-to-noise ratio (s/n) was in most areas [Fig. 2(h), bottom]. Fig. 2Distribution of calcium dye in the cortex. (a) CED loading with Oregon Green 488 BAPTA-1 AM (OGB-1 AM) injected into one hemisphere (red dot, right panel) creates continuous loading up to the edge of the craniotomy. The entire left hemisphere is shown on the left (530-nm illumination) for spatial comparison. Two green lines indicate the locations of the coronal slice shown in (b) and (c). (b) Note that although the calcium fluorescence is higher immediately around the injection site, there is widespread staining up to away in all directions. (c) In a coronal slice away from the injection site, a 5- to 6-mm area of cortex remains stained in a homogeneous fashion. Also note that staining is continuous from layers 1 to 6 with abrupt cessation at the pial surface and ependyma of the ventricle where resistance is met. (d) The average horizontal distribution of calcium fluorescence in the cortex ( rats). The red line shows an exponential decay fitting of the fluorescence curve. (e) The averaged vertical distribution of calcium fluorescence in the cortex ( rats). (f) Confocal images taken from a coronal slice crossing the injection site. The images were taken at different distances from the injection site. Each image shows the fluorescence from the superficial 300 μm of cortex. The green fluorescence from OGB-1 is overlaid with the red fluorescence from sulforhodamine 101. The neurons are shown in green cell and the astrocytes are orange. The majority of superficial fluorescence comes from the neuropil. However, in the deeper layers, both neurons and glia are equally stained. (g) Standard H&E staining of a coronal slice from the injection site—top: the injection site and bottom: 3 to 6 mm away from the injection site. The black box in the left images indicates the area zoomed-in on the right. (h) An interictal spike induced with topical bath application of 1 mM BMI—top: the spatial distribution of calcium waveform during an interictal spike and bottom: the signal-to-noise ratio of each pixel during the ictal event. The red dot indicates the OGB-1 injection site.  3.2.Calcium Imaging of Spontaneous Brain ActivityWe also wished to evaluate whether the trauma from the CED method might alter normal cortical processing. First, we examined spontaneous brain activity, which also allowed us to measure the magnitude of the resulting signal and its s/n without any averaging-between events. Using LFP measurements of spontaneous synaptic activity, we measured simultaneous wide-field calcium fluctuations. LFP showed population activity of different amplitudes and frequencies during the spontaneous activity. The calcium (OGB-1) waveform from the same location showed similar fast-frequency activity riding on slower-frequency waves, and the fast activity appeared remarkably similar to the LFP signal (Fig. 3). A correlation coefficient between the LFP and calcium power traces from the brain () was significantly higher than those on the bone [, , Fig. 3(c)]. Indeed, the sensitivity of the technique is such that every spontaneous LFP fluctuation, each with its own morphology, also has different spatiotemporal calcium dynamics [Fig. 3(d)]. The sensitivity and reliability of the calcium signal to represent the synaptic activity of the LFP indicates that broad-field calcium imaging could be used as a high-resolution optical electrocorticography. Fig. 3Wide-field calcium imaging of spontaneous activity. (a) The field of view of the calcium imaging. A small green square adjacent to the tip of the local field potential (LFP) electrode on the calcium image indicates a region of interest (ROI) from which the calcium trace is derived. Note that the surrounding bone is not visible as the signal is too attenuated. (b) The simultaneously recorded LFP and calcium traces from two ROIs. The green ROI was adjacent to the LFP electrode and the blue ROI was taken from the adjacent bone. The left shows the raw LFP and calcium signals and the right shows the power of the signals. A black box over the LFP indicates the section zoomed in (d). Note that LFP clearly correlates with the faster activity in the calcium tracing. (c) The pseudo-color image of correlation coefficient between the power traces of LFP and calcium signal from each pixel. A high correlation is seen over the entire calcium labeled cortex whereas there is low correlation from the surrounding bone, indicating that the calcium signal effectively demonstrates synaptic activity throughout the cortex. (d) The spatial propagation of the calcium signal during three spontaneous spikes. Vertical bars over the LFP indicate the time points for the calcium images. Interframe interval: 36 ms. Note that the propagation patterns are different for each LFP event, each of which has its own morphology. 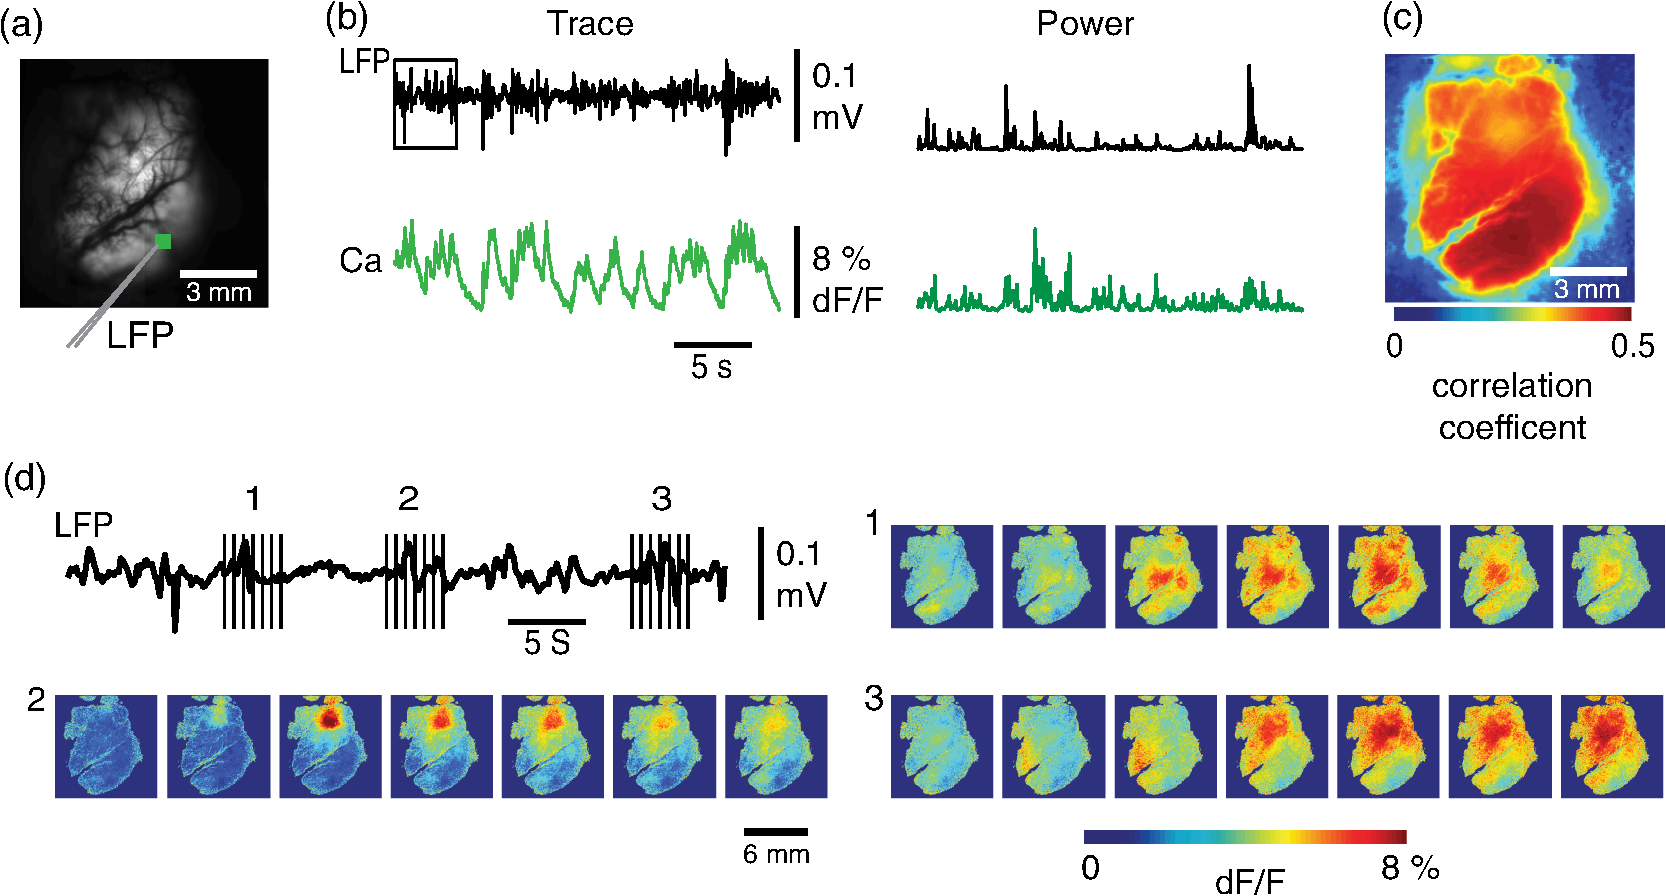 3.3.Application of Wide-Field Calcium Imaging During Sensory StimulationIn order to see if the CED technique produced calcium responses that were consistent with the multiple injection technique and to provide baseline normal calcium dynamics for comparison with pathological activity, we measured wide-field CED-loaded calcium changes (OGB-1) to hind-paw stimulation (2 s, 5 Hz, 0.2 ms) using SPM analysis [Fig. 4(a)]. A discrete area of robust activation was identified with an average maximal peak of a change from baseline. Each stimulation pulse elicited a discernible transient change in the calcium signal amplitude, which underwent adaptation over time [, Fig. 4(c)]. The spatial spread of the stimulation-induced brain activity can also be recorded with calcium imaging [Fig. 4(d)]. These results compare favorably to previous reports of calcium signal changes to somatosensory stimulation using multiple injection bulk-loading of calcium dye, where amplitude of stimulation has been reported at ,19,33 providing further evidence that our single-injection technique is a reliable method by which to record wide-field calcium dynamics in the neocortex. The averaged IOS image (570 nm) 5 to 7 s post-stimulation showed hemodynamic changes in a similar area as the neuronal activity [Fig. 4(e)]. Fig. 4Calcium imaging of somatosensory responses to hind-paw stimulation. (a) Statistical parametric map (SPM) of cortical calcium responses to 2 s hind-paw stimulation in a representative animal (hot colors denote large z-scores associated with robust increases in calcium signal). (b) Digital image of the cortical surface in the same animal as (a) coregistered with SPM-derived ROI (defined as pixels with of maximum z-score, perimeter as white dashed line). Black triangle in (a) and (b) indicates location of single calcium dye injection in this animal. (c) Averaged calcium signal time-series () from SPM-derived ROIs, showing robust increases in response amplitude to stimulation and subsequent adaptation (as percentage change from baseline). Gray dashed line indicates stimulation onset. Error bars are SEM. Ten red bars indicate the time of the peak response to the stimulation and the images are shown in (d). (d) The spatial distribution of the stimulation-induced activity. Note that the first two stimuli induce activity in a broader area than later stimuli. (f) The spatial distribution of 530-nm intrinsic optical signal. The image is an average of the recording 5 to 7 s post the stimulation. The intrinsic signal showed similar spatial distribution as the SPM map. 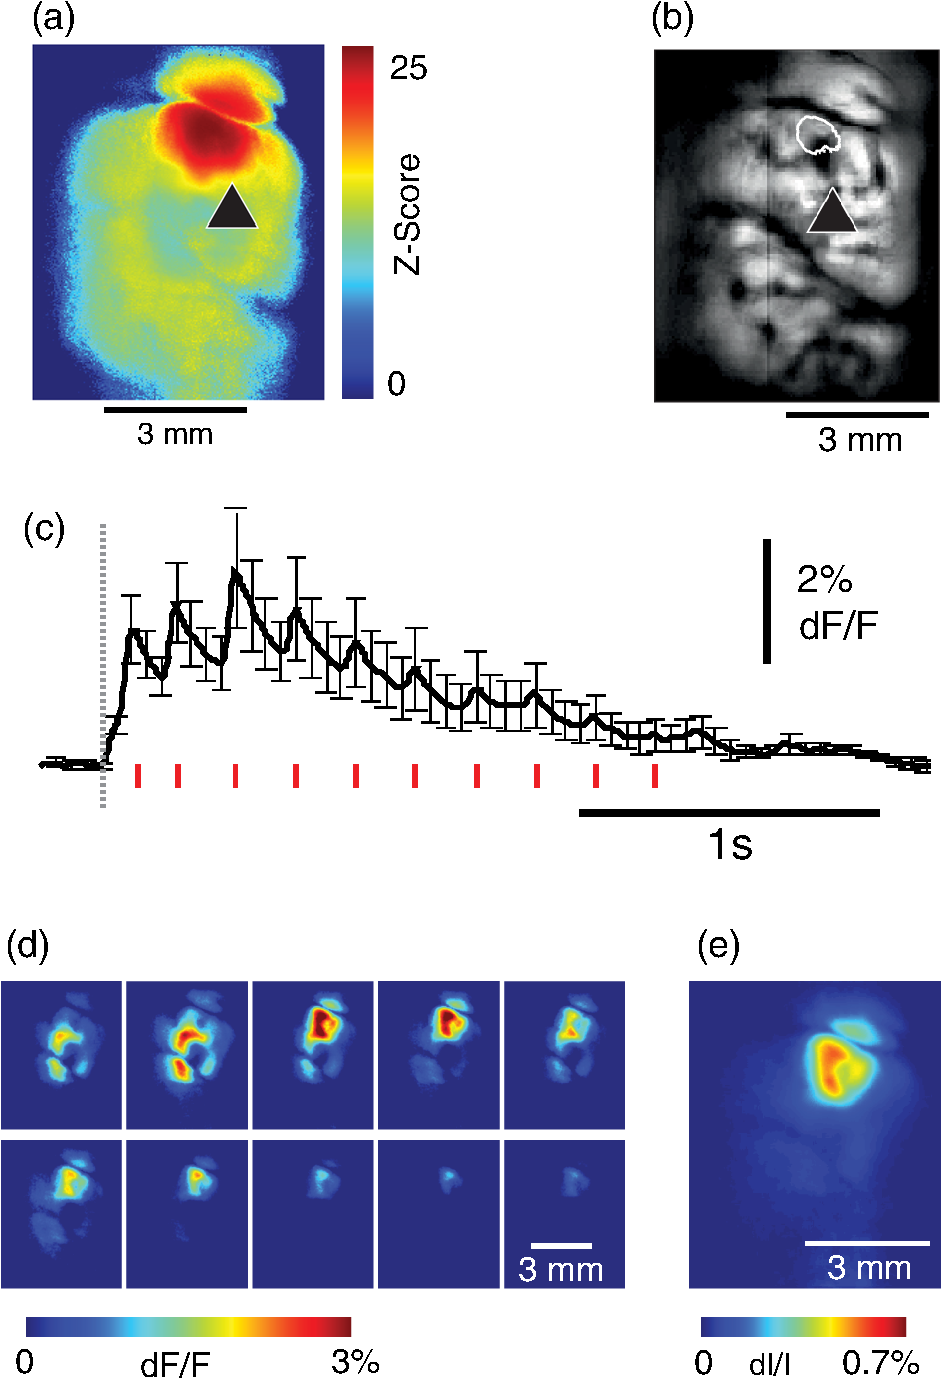 3.4.Wide-Field Calcium Dye and VSD ImagingIn order to investigate the major sources of the calcium signal from this technique, we investigated the degree of overlap between the calcium signal and the VSD signal. The VSD signal is known to represent presynaptic subthreshold activity, predominantly from dendrites.13–15 For this experiment, we performed simultaneous calcium and VSD imaging of epileptiform IIS. As previously described in our laboratory,34,35 IIS were induced with local intracortical bicuculline application. As is apparent (Fig. 5), the waveforms of VSD and calcium signals are qualitatively very similar. Both showed identical onset times and monophasic changes during IIS and were temporally locked to the LFP recorded at the same location [Fig. 5(b), ROI 1). The calcium waveforms were found to be significantly broader () than the VSD waveforms () (, IIS from four rats), indicating longer decay kinetics. We fitted the decay of the fluorescence transient with a single-exponential function, yielding a decay time constant of for calcium () and for VSD (). The normalized fast Fourier transform of LFP, VSD, and calcium signals were also highly comparable, with the exception of low-frequency () power in calcium signals being greater than that of VSD, likely due to greater contributions from slower glial activity in the calcium data [Fig. 5(c)]. Very little low-frequency power was observed in LFP due to the fact that a 1-Hz pass filter was built into the amplifier. In the higher-frequency range (), the LFP spectrum is almost identical to VSD and calcium signals. Cross-correlation between the LFP spectrum () and the VSD/calcium spectra showed strong correlation (LFP versus VSD: , , LFP versus Ca: , ). In the low-frequency range (), there is no correlation between the LFP spectrum and the VSD/calcium spectra (LFP versus VSD: , , LFP versus Ca: , ). The normalized calcium and VSD waveforms became approximately equivalent following the application of a 1-Hz high-pass filter [Fig. 5(d), 1 Hz, first-order Butterworth high-pass filter, using MATLAB®]. The amplitudes of VSD and calcium signal during 30 IISs in four rats are shown in Fig. 5(e). The data points followed a linear distribution, with , indicating that the amplitude of VSD and calcium signals were highly correlated (). Our data suggest that the majority of calcium signals closely reflects subthreshold synaptic activity recorded from the neuropil, which was very similar to the VSD signal but with a higher amplitude and higher s/n as well as a slower component, likely reflecting the slow dynamic of calcium clearance and slower glial waves. We also recorded the VSD and OGB-1 signal from different locations far away from the BMI application site [Fig. 5(b), ROIs 2 and 3]. The amplitude of VSD and calcium signal decreased with the increasing distance. Fig. 5Simultaneous calcium and VSD imaging of an interictal event. (a) Experimental setup for simultaneous VSD and calcium imaging. Two light-emitting diodes (LEDs), and , coupled with a dichroic mirror are employed as illumination sources. The illumination is guided with fiber optics onto the cortex. The fluorescence of OGB-1 AM and RH-1691 are collected with a camera lens and separated with a 570-nm dichroic mirror. A filter is placed in front of the calcium imaging camera and a 665-nm long-pass filter (RG-665) is placed in front of the VSD camera. (b) The field of view imaged with VSD and calcium imaging. Three small white boxes on the image indicate the ROIs in which the VSD and calcium tracings were derived. The simultaneously recorded LFP, VSD, and calcium traces from the ROIs are shown at the bottom. (c) The frequency distributions of LFP, VSD, and calcium signal. The inner panel is a magnification of the low-frequency section. Note that the frequency distributions are largely overlapping and the VSD and calcium signals show highest power in the low-frequency range (0 to 1 Hz), while LFP correlates more strongly in the higher-frequency range. (d) The normalized 1-Hz high-pass filter (first-order Butterworth filter) of the VSD and calcium trace. Note that the VSD and calcium traces are almost identical. (e) Plot of the VSD fluorescence changes versus calcium fluorescence changes. Each dot indicates the peak amplitude of an interictal spike recorded by both imaging methods. A linear fit of the amplitudes was extrapolated. 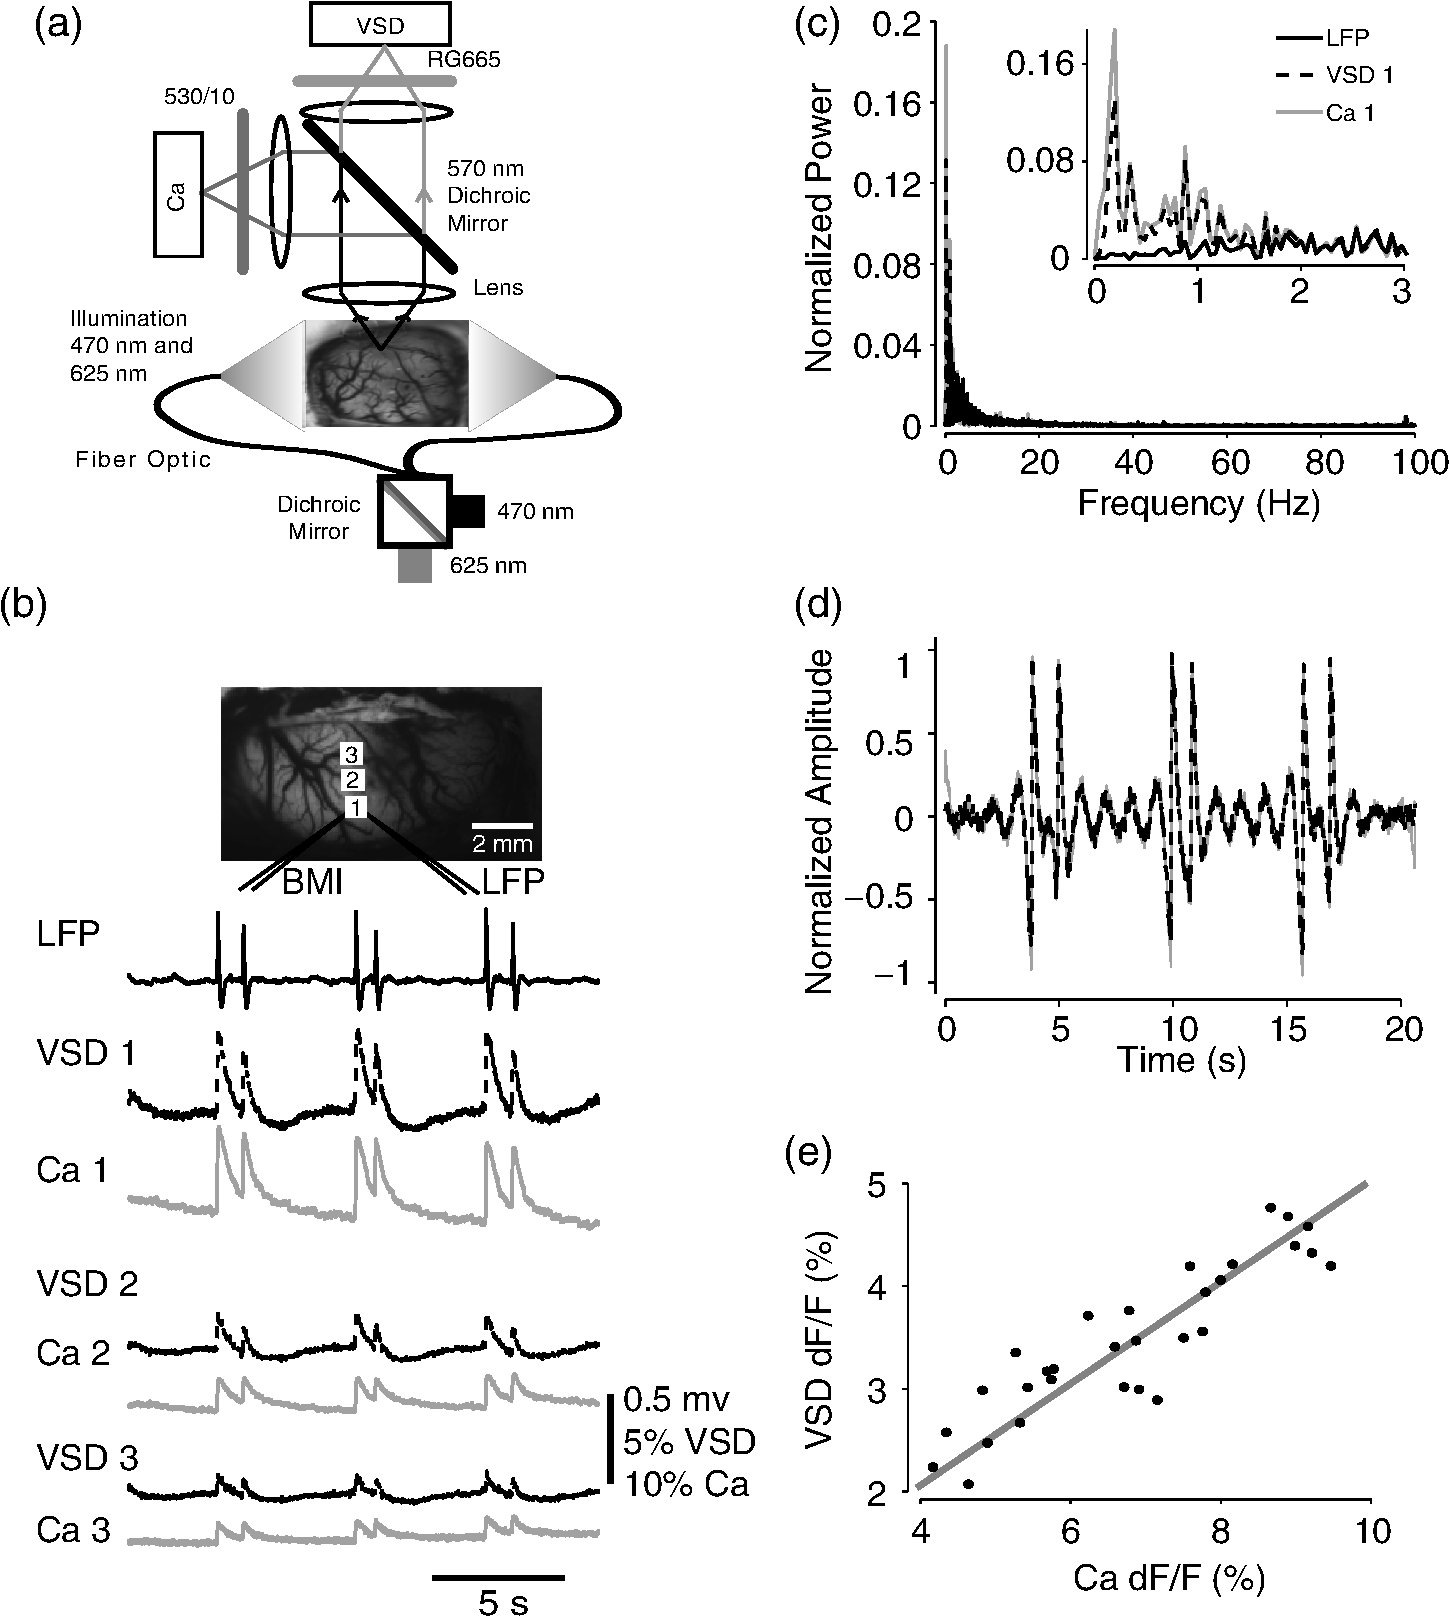 3.5.Simultaneous Calcium and Intrinsic Imaging of Hemodynamics and OxygenationIn order for wide-field calcium imaging to be useful for the investigation of neurovascular coupling at a network level, it needs to be combined with similar wide-field hemodynamic monitoring. Using the propagation of focal neocortical seizures as an example of a pathologic brain state that involves a widespread network and that requires broad-field imaging for effective mapping, we employed focal intracortical injections of 4-AP as previously described by our laboratory.26,36,37 The duration and morphology of the resulting ictal event was recorded with an LFP electrode placed in the 4-AP injection site, which showed the onset, evolution, and termination of the ictal-like events, which usually last to 80 s. The calcium signal (OGB-1) demonstrates fast activity riding on a wave of slower activity. The high-frequency component () closely reflected the LFP waveform, while the low-frequency component () appears to be non-neural in origin, likely reflecting glial activity [Fig. 6(c)]. In order to measure concomitant hemodynamic events, intrinsic optical signals at 530 and 625 nm were measured simultaneously. Using a modified Beer-Lambert law, we calculated the change in total hemoglobin (Hbt), deoxygenated hemoglobin (Hbr), and oxygenated hemoglobin (HbO) for correlation with the calcium signal [Fig. 6(c)]. During an ictal event, an increase in Hbt and HbO was combined with a prolonged decrease in Hbr, consistent with the absence of an epileptic dip and an oversupply of oxygenated hemoglobin, as previously described in a fraction of seizures using this model36,37 [Fig. 6(c)]. Although high-frequency calcium signals (representing predominantly subthreshold neuronal activity) fluctuated with millisecond resolution, the low-frequency calcium signal and hemodynamic changes fluctuated with a temporal resolution of hundreds of milliseconds. With simultaneous low-frequency and high-frequency calcium imaging and multiwavelength intrinsic signal imaging, one can correlate wide-field spatiotemporal alterations in neurovascular coupling between neuronal and glial activity and blood volume and oxygenation changes. [Fig. 6(d)]. In order to better understand the signal source of the low-frequency component recorded by OGB-1, we selectively stained the astrocytic glia with a different calcium dye, rhod-2, AM, following the technique of Ghosh and colleagues.24 The ictal waveform of the astrocytic calcium change appeared as a slowly propagating wavefront. These results indicate that the slowly progressive wave underlying the fast activity we recorded with OGB-1 likely arose from glial activation. Fig. 6Simultaneous calcium and multiwavelength intrinsic optical signal (IOS) of an ictal event. (a) Diagram of the setup for simultaneous calcium-sensitive dye and IOS imaging. 470-, 530, and 625-nm LEDs are coupled with dichroic mirror to serve as an illumination source. These LEDs are set to be alternately triggered by the camera frame indicator to capture calcium images at 55 Hz and IOS at 27.5 Hz. A 510-nm long-pass filter is placed before the camera to filter out the calcium illumination (470 nm). (b) The field of view of the imaged cortex. A small box indicates an ROI, in which the calcium and intrinsic optical imaging traces are derived. The left box is located adjacent to the 4-AP/LFP electrode, which is the source of the epileptic focus. (c) The waveforms of different recording modalities during an ictal event derived from the ROI shown in (b). A red box over the LFP indicates a section zoomed in (d). Note that the calcium trace has two components: the high-frequency component () is closely related with LFP, but the low-frequency component () does not reflect the dynamics of the LFP. (d) The spatiotemporal distribution of the high- and low-frequency calcium signals as well as the hemodynamic components. The vertical bars overlapping the LFP indicate the timing for the calcium imaging frames. Frame interval: 18 ms. The spatial distributions of low-frequency calcium signals and each of the hemodynamic signals are shown at the bottom. 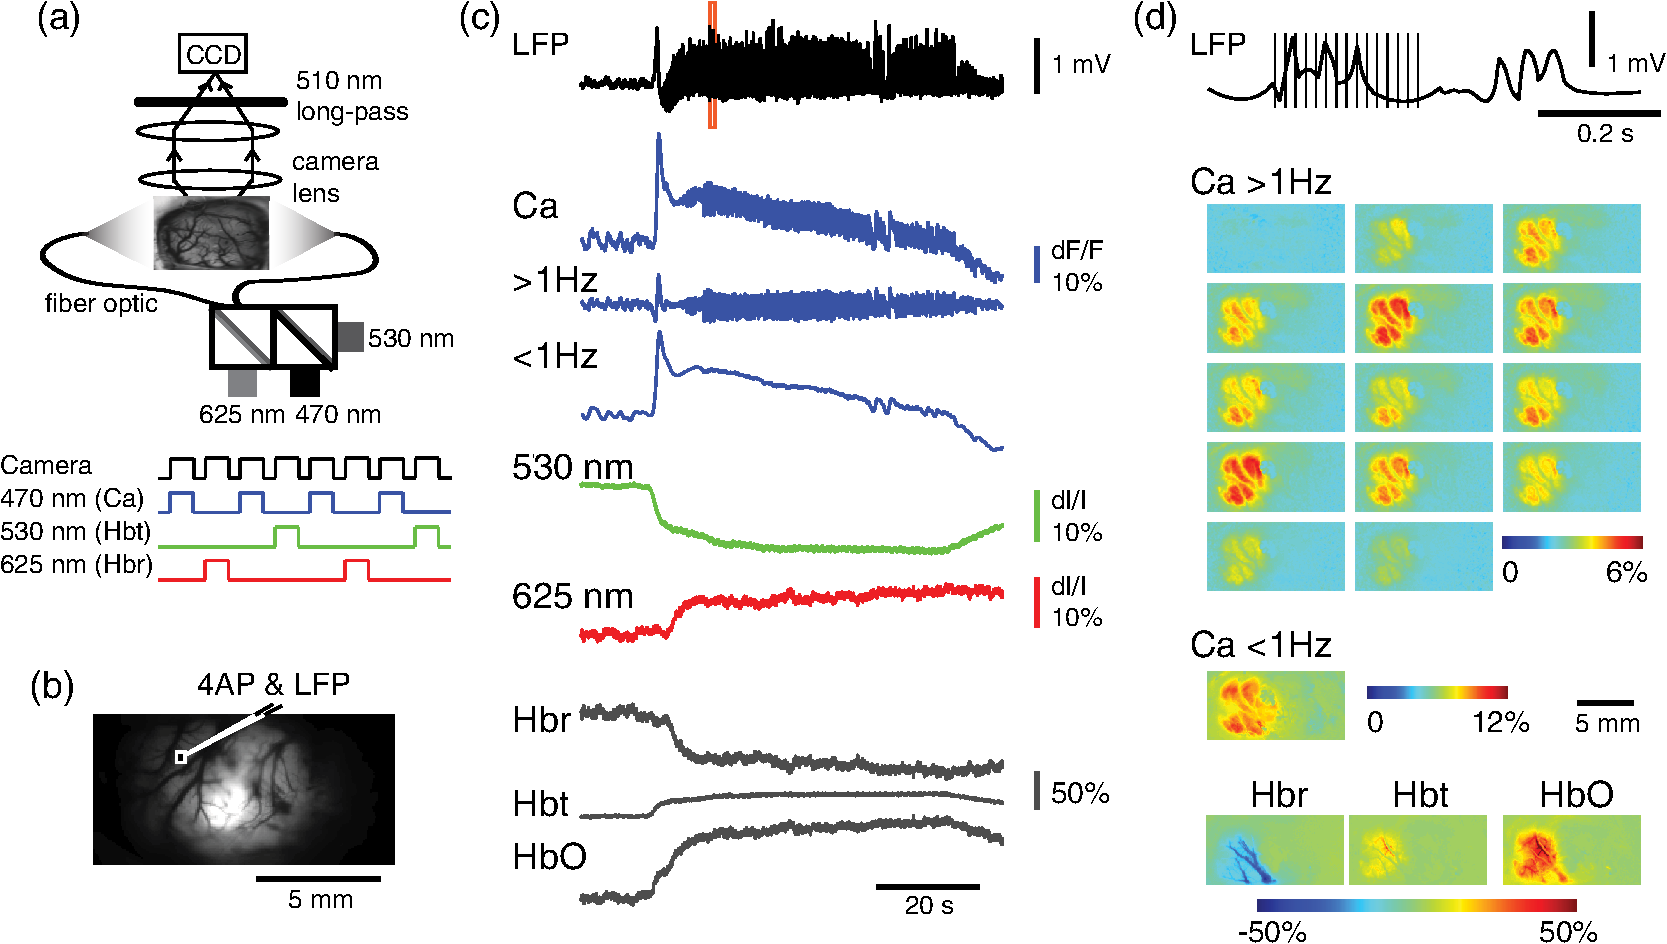 4.DiscussionIn this article, we introduce a method for widespread continuous, smooth loading of the neocortex with calcium dyes based on the principal of CED. This technique leads to more homogeneous loading with less trauma than the multiple-injection technique20,33,38,39 (Fig. 1). We also demonstrate how to couple wide-field calcium imaging with either VSD or IOS to investigate neurovascular coupling at the level of a large distributed neuronal network. 4.1.Convection-Enhanced DeliveryCED was originally developed as a technique to deliver macromolecules, such as chemotherapy, into the brain to treat infiltrative brain diseases, such as malignant tumors, that spread throughout the brain parenchyma.23 In this method, the dissolved drug is driven through the extracellular space by maintaining a pressure gradient that distributes the drug spherically from the site of the injection into the parenchyma, creating a homogeneous drug concentration that does not dissipate as it would using only diffusion. Cerebrospinal fluid is replaced by the injected fluid, and the drug is delivered at a homogeneous dose. In adopting the technique to deliver calcium dyes, a critical component to ensuring reliable delivery has been the placement and depth of the injection electrode. We found delivery to be optimal when the electrode tip was placed below the surface (i.e., middle of the neocortex). This prevented upward dye leakage through the injection track and minimized the possibility of downward penetration into the underlying ventricle. After the electrode was placed in the cortex, we waited for before injecting, so that the tissue could bind to the glass electrode and form a close seal that could withstand the injection pressure. Another key determinant of dye-staining success was the injection speed. Higher injection speeds resulted in higher injection pressures and increased the likelihood of leakage. Conversely, low injection speeds resulted in a limited area of spread, the dye being subject to diffusion and unnecessary prolongation of the experiment. Given the thickness of the neocortex, the injection speed was found to be optimal at . 4.2.Convection-Enhanced Delivery and Targeted Bulk-Loading of Calcium DyeTargeted bulk-loading is a staining approach in which cells are stained by a brief bolus injection of the acetoxymethyl ester of a calcium indicator dye into the extracellular space. The injected dye diffuses into the cells and is hydrolyzed by intracellular esterases.40 This method can be used to stain an area of a few hundred micrometers in diameter and allow two-photon laser-scanning microscopy of calcium transients. This approach has been successfully applied in different species at various developmental stages (mice, rats, cats, and zebrafish16,31,41–44). CED is a significant advancement to focal targeted delivery since a large area (several millimeters in diameter and 75 to in volume) of cortex can be homogeneously stained with minimal trauma to the cortex as opposed to multiple small islands of staining with multiple cortical punctures (Fig. 1). Given minimal trauma, CED also increases the possibility for restaining, which enables long-term study.21 A clear advantage of CED over the targeted bulk-loading method is that the stained area is much larger. For targeted bulk-loading, the dye can only propagate a few hundred micrometers from the injection electrode, meaning that possible damage from the multiple cortical penetrations could affect subsequent recordings. With CED, this possibility is avoided since the dye can propagate several millimeters away from the injection electrode following a single injection. 4.3.Difference between VSD and Calcium-Sensitive DyeA VSD signal represents membrane voltage change in a mixture of all cells stained, including neurons, glia, and blood vessels. However, the contribution of glia and endothelia to the VSD signal is minimal. Although in vivo imaging of a single pixel samples multiple compartments of a population of neurons, including axons, dendrites, and cell bodies, studies have shown that the majority of the signal arises from dendrites, whose membrane area is largest.15 For this reason, the VSD signal waveform mainly reflects the subthreshold synaptic activity in superficial cortical layers and is a summation of activity in area.13,45 In vivo calcium imaging using the multisite injection technique also stains multiple cell compartments, such as cell bodies, dendrites, axons, and glia.41 Although with single-cell resolution or direct intracellular injection, the majority of the signal arises from suprathreshold action potentials triggered by voltage-gated calcium channels,17,22 when imaged at low spatial resolution following bulk-loading, the calcium signal is a mixture of all cell compartments, and a large component arises from the neuropil, predominantly from axons.16 Thus, the signal we recorded mainly reflects strong synaptic activation in the neuropil of the superficial cortical layers.19 Hence, in our experimental preparation, VSD and calcium signals reflect very similar aspects of cortical activity (Fig. 5). However, calcium imaging has a much higher s/n ratio. Although the calcium dye can act as a buffer, the concentration of dye for the bulk-loading technique is lower, which is an advantage over intracellular injections. The other main difference between calcium and VSD imaging is that using calcium dye the slow glial component is much more apparent.18 The contribution of glial activation is quite different when comparing VSD with calcium-sensitive dyes. With VSDs, glial activity does not contribute significantly to the signal14,15,17 because glial responses are weak (depolarized only 1 to 7 mV in response to visual stimulation).46 However, the contribution of glia to the calcium signal is substantial, albeit on a much closer timescale than neuronal activity (Fig. 7). Schulz and colleagues demonstrated that the activation of glia introduces a prolonged low-frequency component to the calcium signal during electrical forepaw stimulation,19 which is similar to our recording. Therefore, under the experimental conditions we employ, calcium-dye-derived data appear to be a combination of high-frequency subthreshold synaptic activity derived from the neuropil and low-frequency glial activity. A high-pass filter (1 Hz) is sufficient to remove the glial component (Fig. 6), suggesting that calcium-sensitive dyes can provide the same two-dimensional activity maps as VSD imaging with significantly higher s/n ratio. Clearly, another main advantage of calcium imaging is the ability to image spiking in individual neurons, but this requires two-photon imaging of single cells, so the signal from the neuropil does not dominate the signal as it does with wide-field imaging. 4.4.Simultaneous Imaging of Neuronal Activity and Hemodynamic ChangesThe study of neurovascular coupling requires, at a minimum, simultaneous recordings from both key components of the neurovascular unit, namely the neuronal as well as the hemodynamic element. Currently, a large number of methods are available to record hemodynamic changes on a wide variety of scales, from the movement of an individual blood cell or a single arteriole dilatation to the whole brain, such as fMRI, single photon emission computed tomography (SEPCT), and near-infrared spectroscopy. There are an equal number of methods available to record the voltage changes or electric currents on a wide variety of scales from single ion channel neuronal activity and intracellular recording to large-scale magnetoencephalography (MEG) and electroencephalography. However, the ability to record from a large area of cortex (several millimeters) with high temporal (1 ms) and spatial (50 micron) resolution can only be done with optical techniques. In this paper, we describe a reliable method to achieve this goal, which will be critical to understand neurovascular coupling for brain processes that involve wide-scale dynamic networks that cannot be easily averaged together to increase signat-to-noise ratio, such as epileptiform events or higher-order cognitive processing. AcknowledgmentsThis project was supported by the National Science Foundation, NSF-1264948 (H. M.), the Citizens United for Research in Epilepsy (H. M.), the Wellcome Trust [093069], (S.H, J.B), Cornell University Ithaca-WCMC seed grant (M. Z.), Dana Foundation Brain Imaging Program (R. M. B.), NINDS R01 NS-069679 (R. M. B.), and NINDS R01 NS-494829 (T. H. S.). We thank Dr. Christopher Schaffer and Dr. Rafael Yuste for helpful comments on the manuscript. ReferencesG. C. PetzoldV. N. Murthy,
“Role of astrocytes in neurovascular coupling,”
Neuron, 71
(5), 782
–797
(2011). http://dx.doi.org/10.1016/j.neuron.2011.08.009 NERNET 0896-6273 Google Scholar
C. IadecolaM. Nedergaard,
“Glial regulation of the cerebral microvasculature,”
Nat. Neurosci., 10
(11), 1369
–1376
(2007). http://dx.doi.org/10.1038/nn2003 NANEFN 1097-6256 Google Scholar
C. LecruxE. Hamel,
“The neurovascular unit in brain function and disease,”
Acta Physiol (Oxf), 203
(1), 47
–59
(2011). http://dx.doi.org/10.1111/apha.2011.203.issue-1 APACAB 0001-6756 Google Scholar
J. J. HarrisC. ReynellD. Attwell,
“The physiology of developmental changes in BOLD functional imaging signals,”
Dev. Cogn. Neurosci., 1
(3), 199
–216
(2011). http://dx.doi.org/10.1016/j.dcn.2011.04.001 18789293 Google Scholar
R. D. Bellet al.,
“Pericytes control key neurovascular functions and neuronal phenotype in the adult brain and during brain aging,”
Neuron, 68
(3), 409
–427
(2010). http://dx.doi.org/10.1016/j.neuron.2010.09.043 NERNET 0896-6273 Google Scholar
U. Lindaueret al.,
“Nitric oxide: a modulator, but not a mediator, of neurovascular coupling in rat somatosensory cortex,”
Am. J. Physiol., 277
(2 Pt 2), H799
–811
(1999). AJPHAP 0002-9513 Google Scholar
J. A. FilosaJ. A. Iddings,
“Astrocyte regulation of cerebral vascular tone,”
Am. J. Physiol. Heart Circ. Physiol., 305
(5), H609
–619
(2013). http://dx.doi.org/10.1152/ajpheart.00359.2013 0363-6135 Google Scholar
G. R. Gordonet al.,
“Brain metabolism dictates the polarity of astrocyte control over arterioles,”
Nature, 456
(7223), 745
–749
(2008). http://dx.doi.org/10.1038/nature07525 NATUAS 0028-0836 Google Scholar
M. A. Mintunet al.,
“Increased lactate/pyruvate ratio augments blood flow in physiologically activated human brain,”
Proc. Natl. Acad. Sci. U S A, 101
(2), 659
–664
(2004). http://dx.doi.org/10.1073/pnas.0307457100 PNASA6 0027-8424 Google Scholar
Y. IdoK. ChangJ. R. Williamson,
“NADH augments blood flow in physiologically activated retina and visual cortex,”
Proc. Natl. Acad. Sci. U S A, 101
(2), 653
–658
(2004). http://dx.doi.org/10.1073/pnas.0307458100 PNASA6 0027-8424 Google Scholar
A. G. Vlassenkoet al.,
“Regulation of blood flow in activated human brain by cytosolic NADH/NAD+ ratio,”
Proc. Natl. Acad. Sci. U S A, 103
(6), 1964
–1969
(2006). http://dx.doi.org/10.1073/pnas.0510632103 PNASA6 0027-8424 Google Scholar
H. MaM. ZhaoT. H. Schwartz,
“Dynamic neurovascular coupling and uncoupling during ictal onset, propagation, and termination revealed by simultaneous in vivo optical imaging of neural activity and local blood volume,”
Cereb. Cortex, 23
(4), 885
–899
(2013). http://dx.doi.org/10.1093/cercor/bhs079 53OPAV 1047-3211 Google Scholar
H. Slovinet al.,
“Long-term voltage-sensitive dye imaging reveals cortical dynamics in behaving monkeys,”
J. Neurophysiol., 88
(6), 3421
–3438
(2002). http://dx.doi.org/10.1152/jn.00194.2002 JONEA4 0022-3077 Google Scholar
S. ChemlaF. Chavane,
“Voltage-sensitive dye imaging: technique review and models,”
J. Physiol. Paris, 104
(1–2), 40
–50
(2010). http://dx.doi.org/10.1016/j.jphysparis.2009.11.009 0022-3751 Google Scholar
A. GrinvaldR. Hildesheim,
“VSDI: a new era in functional imaging of cortical dynamics,”
Nat. Rev. Neurosci., 5
(11), 874
–885
(2004). http://dx.doi.org/10.1038/nrn1536 NRNAAN 1471-0048 Google Scholar
J. N. KerrD. GreenbergF. Helmchen,
“Imaging input and output of neocortical networks in vivo,”
Proc. Natl. Acad. Sci. U S A, 102
(39), 14063
–14068
(2005). http://dx.doi.org/10.1073/pnas.0506029102 PNASA6 0027-8424 Google Scholar
B. F. GreweF. Helmchen,
“Optical probing of neuronal ensemble activity,”
Curr. Opin. Neurobiol., 19
(5), 520
–529
(2009). http://dx.doi.org/10.1016/j.conb.2009.09.003 COPUEN 0959-4388 Google Scholar
M. NedergaardJ. J. RodriguezA. Verkhratsky,
“Glial calcium and diseases of the nervous system,”
Cell Calcium, 47
(2), 140
–149
(2010). http://dx.doi.org/10.1016/j.ceca.2009.11.010 CECADV 0143-4160 Google Scholar
K. Schulzet al.,
“Simultaneous BOLD fMRI and fiber-optic calcium recording in rat neocortex,”
Nat. Methods, 9
(6), 597
–602
(2012). http://dx.doi.org/10.1038/nmeth.2013 1548-7091 Google Scholar
M. B. Bouchardet al.,
“Ultra-fast multispectral optical imaging of cortical oxygenation, blood flow, and intracellular calcium dynamics,”
Opt. Express, 17
(18), 15670
–15678
(2009). http://dx.doi.org/10.1364/OE.17.015670 OPEXFF 1094-4087 Google Scholar
O. GaraschukR. I. MilosA. Konnerth,
“Targeted bulk-loading of fluorescent indicators for two-photon brain imaging in vivo,”
Nat. Protoc., 1
(1), 380
–386
(2006). http://dx.doi.org/10.1038/nprot.2006.58 NPARDW 1754-2189 Google Scholar
W. GobelF. Helmchen,
“In vivo calcium imaging of neural network function,”
Physiology (Bethesda), 22 358
–365
(2007). http://dx.doi.org/10.1152/physiol.00032.2007 PHYSCI 1548-9213 Google Scholar
R. H. Boboet al.,
“Convection-enhanced delivery of macromolecules in the brain,”
Proc. Natl. Acad. Sci. U S A, 91
(6), 2076
–2080
(1994). http://dx.doi.org/10.1073/pnas.91.6.2076 PNASA6 0027-8424 Google Scholar
A. GhoshM. T. WyssB. Weber,
“Somatotopic astrocytic activity in the somatosensory cortex,”
Glia, 61
(4), 601
–610
(2013). http://dx.doi.org/10.1002/glia.22458 GLIAEJ 1098-1136 Google Scholar
E. H. RatzlaffA. Grinvald,
“A tandem-lens epifluorescence macroscope: hundred-fold brightness advantage for wide-field imaging,”
J. Neurosci. Methods, 36
(2–3), 127
–137
(1991). http://dx.doi.org/10.1016/0165-0270(91)90038-2 JNMEDT 0165-0270 Google Scholar
H. MaM. ZhaoT. H. Schwartz,
“Dynamic neurovascular coupling and uncoupling during ictal onset, propagation, and termination revealed by simultaneous in vivo optical imaging of neural activity and local blood volume,”
Cereb. Cortex, 23
(4), 885
–899
(2013). http://dx.doi.org/10.1093/cercor/bhs079 53OPAV 1047-3211 Google Scholar
S. A. Shethet al.,
“Linear and nonlinear relationships between neuronal activity, oxygen metabolism, and hemodynamic responses,”
Neuron, 42
(2), 347
–355
(2004). http://dx.doi.org/10.1016/S0896-6273(04)00221-1 NERNET 0896-6273 Google Scholar
A. J. Kennerleyet al.,
“Concurrent fMRI and optical measures for the investigation of the hemodynamic response function,”
Magn. Reson. Med., 54
(2), 354
–365
(2005). http://dx.doi.org/10.1002/(ISSN)1522-2594 MRMEEN 0740-3194 Google Scholar
M. Kohlet al.,
“Physical model for the spectroscopic analysis of cortical intrinsic optical signals,”
Phys. Med. Biol., 45
(12), 3749
–3764
(2000). http://dx.doi.org/10.1088/0031-9155/45/12/317 PHMBA7 0031-9155 Google Scholar
A. K. Dunnet al.,
“Spatial extent of oxygen metabolism and hemodynamic changes during functional activation of the rat somatosensory cortex,”
Neuroimage, 27
(2), 279
–290
(2005). http://dx.doi.org/10.1016/j.neuroimage.2005.04.024 NEIMEF 1053-8119 Google Scholar
A. Nimmerjahnet al.,
“Sulforhodamine 101 as a specific marker of astroglia in the neocortex in vivo,”
Nat. Methods, 1
(1), 31
–37
(2004). http://dx.doi.org/10.1038/nmeth706 1548-7091 Google Scholar
K. J. Fristonet al.,
“Characterizing evoked hemodynamics with fMRI,”
Neuroimage, 2
(2), 157
–165
(1995). http://dx.doi.org/10.1006/nimg.1995.1018 NEIMEF 1053-8119 Google Scholar
E. M. Hillman,
“Optical brain imaging in vivo: techniques and applications from animal to man,”
J. Biomed. Opt., 12
(5), 051402
(2007). http://dx.doi.org/10.1117/1.2789693 JBOPFO 1083-3668 Google Scholar
H. Maet al.,
“Hemodynamic surrogates for excitatory membrane potential change during interictal epileptiform events in rat neocortex,”
J. Neurophysiol., 101
(5), 2550
–2562
(2009). http://dx.doi.org/10.1152/jn.90694.2008 JONEA4 0022-3077 Google Scholar
A. S. Geneslawet al.,
“Tissue hypoxia correlates with intensity of interictal spikes,”
J. Cereb. Blood Flow Metab., 31
(6), 1394
–1402
(2011). http://dx.doi.org/10.1038/jcbfm.2011.16 JCBMDN 0271-678X Google Scholar
S. Baharet al.,
“Intrinsic optical signal imaging of neocortical seizures: the ‘epileptic dip’,”
Neuroreport, 17
(5), 499
–503
(2006). http://dx.doi.org/10.1097/01.wnr.0000209010.78599.f5 NERPEZ 0959-4965 Google Scholar
M. Zhaoet al.,
“Spatiotemporal dynamics of perfusion and oximetry during ictal discharges in the rat neocortex,”
J. Neurosci., 29
(9), 2814
–2823
(2009). http://dx.doi.org/10.1523/JNEUROSCI.4667-08.2009 JNRSDS 0270-6474 Google Scholar
P. GolshaniC. Portera-Cailliau,
“In vivo 2-photon calcium imaging in layer 2/3 of mice,”
J. Vis. Exp., 13
(2008). JVEOA4 1940-087X Google Scholar
I. R. WinshipT. H. Murphy,
“In vivo calcium imaging reveals functional rewiring of single somatosensory neurons after stroke,”
J. Neurosci., 28
(26), 6592
–6606
(2008). http://dx.doi.org/10.1523/JNEUROSCI.0622-08.2008 JNRSDS 0270-6474 Google Scholar
R. Y. Tsien,
“A non-disruptive technique for loading calcium buffers and indicators into cells,”
Nature, 290
(5806), 527
–528
(1981). http://dx.doi.org/10.1038/290527a0 NATUAS 0028-0836 Google Scholar
C. Stosieket al.,
“In vivo two-photon calcium imaging of neuronal networks,”
Proc. Natl. Acad. Sci. U S A, 100
(12), 7319
–7324
(2003). http://dx.doi.org/10.1073/pnas.1232232100 PNASA6 0027-8424 Google Scholar
K. Ohkiet al.,
“Functional imaging with cellular resolution reveals precise micro-architecture in visual cortex,”
Nature, 433
(7026), 597
–603
(2005). http://dx.doi.org/10.1038/nature03274 NATUAS 0028-0836 Google Scholar
M. R. Sullivanet al.,
“In vivo calcium imaging of circuit activity in cerebellar cortex,”
J. Neurophysiol., 94
(2), 1636
–1644
(2005). http://dx.doi.org/10.1152/jn.01013.2004 JONEA4 0022-3077 Google Scholar
C. M. NiellS. J. Smith,
“Functional imaging reveals rapid development of visual response properties in the zebrafish tectum,”
Neuron, 45
(6), 941
–951
(2005). http://dx.doi.org/10.1016/j.neuron.2005.01.047 NERNET 0896-6273 Google Scholar
Y. ChenC. R. PalmerE. Seidemann,
“The relationship between voltage-sensitive dye imaging signals and spiking activity of neural populations in primate V1,”
J. Neurophysiol., 107
(12), 3281
–3295
(2012). http://dx.doi.org/10.1152/jn.00977.2011 JONEA4 0022-3077 Google Scholar
J. P. KellyD. C. Van Essen,
“Cell structure and function in the visual cortex of the cat,”
J. Physiol., 238
(3), 515
–547
(1974). JPHYA7 0022-3751 Google Scholar
BiographyHongtao Ma is an assistant professor at Weill Cornell Medical College. He received his BS and PhD degrees in neuroscience from Peking University in 1998 and 2004, respectively. His current research interests include optical imaging of neurovascular coupling in physiological and pathological conditions, such as epilepsy, and developing novel brain imaging device that can be used in clinic. Samuel Harris is a postdoctoral research associate on a Wellcome Trust-funded collaborative project between the Department of Psychology at the University of Sheffield and the Department of Neurological Surgery at Weill Cornell Medical College. His research project has focused on the localization, propagation, and coupling of neural and hemodynamic events during epileptiform activity, using electrophysiology and a suite of neuroimaging techniques. Redi Rahmani graduated cum laude from Cornell University with a bachelor’s degree in biological sciences and a concentration in neurobiology. His undergraduate research thesis focused on ion-channel mutations in Drosophila leading to a seizure phenotype. He currently attends Geisel School of Medicine at Dartmouth as a third-year student with a strong interest in neurosurgery. He is involved in population-based neurosurgical outcomes research. He also completed a summer neurosurgery internship at Weill Cornell Medical Center. Clay O. Lacefield is a postdoctoral research scientist in the laboratory of Randy Bruno at Columbia University, New York, NY. He is currently studying higher-order influences on primary cortical sensory processing using two-photon imaging of the mouse barrel cortex during whisker-related behavior. Andy G. S. Daniel is currently a research technician in the Epilepsy Research Laboratory of the Department of Neurological Surgery at Weill Cornell Medical College. He received his BS in biomedical engineering from the Illinois Institute of Technology. His interests include the application of biophotonics to translational neuroscience. Zhiping Zhou is an instructor in the Department of Neurological Surgery of Weill Cornell Medical College. His research is focused on pediatric brain tumors and local drug delivery, with special techniques in ultrastructural studies and advanced magnetic resonance imaging. Jason Berwick is a senior research fellow in the Department of Psychology at the University of Sheffield. He received a BSc in anatomy and cell biology and a PhD in neuroscience in 1995 and 2000, respectively. His current research interest is in the measurement of neurovascular function in health and disease using multimodal imaging and electrophysiological techniques. Theodore H. Schwartz is the David and Ursel Barnes Professor of Minimally Invasive Neurosurgery at Weill Cornell Medical College, New York Presbyterian Hospital. He is the director of epilepsy surgery and epilepsy research. He received his undergraduate and medical degrees from Harvard University, where he graduated magna cum laude. After completing his residency and chief residency in neurosurgery at Columbia-Presbyterian Medical Center he then pursued advanced fellowship training at Yale-New Haven Medical Center and a postdoctoral fellowship at the Max-Planck Institute. His laboratory’s research investigates novel brain imaging techniques and is funded by the NIH, where he also serves on several grant review committees. |