
|
|
1.IntroductionSalvaging the penumbra is central to the concept of neuroprotection from ischemic stroke.1 The penumbra, or peri-infarct region, is the structurally intact but functionally compromised cerebral tissue surrounding the region of infarct,2 which can potentially be protected by interventions delivered in a timely manner.3 Sustained hypoperfusion of the penumbra leads to cellular death through several mechanisms, such as excitotoxicity and free-radical generation.4 Thrombolysis is currently the only approved treatment for stroke. However, its use is limited by the narrow therapeutic window and the side effect of bleeding.5 Theoretically, an intervention that could increase perfusion of the penumbra might provide a neuroprotective effect. It is therefore important to monitor the therapy-induced relative hemodynamic changes in the ischemic penumbra to quantify the extent of reperfusion in an experimental model. During cerebrovascular injury, reperfusion of the penumbra is difficult to predict due to the effects of disrupted neurometabolic coupling and impaired cerebrovascular reactivity, which might trigger disproportionate responses in regional cerebral blood flow (CBF).6 There is, however, sufficient recent evidence that early intervention, whether pharmacological7 or electrophysiological,8 is likely beneficial. Hence, understanding the neurovascular responses during the hyperacute phase of stroke, defined here as the first 3 h after occlusion, is essential for rescuing the penumbra, especially in a time-limited window. Emerging imaging techniques have already provided detailed insights into brain functions.9 Computed tomography perfusion scanning,10 magnetic resonance (MR) perfusion imaging,11 and positron emission tomography (PET)12 are commonly used to study the cerebral hemodynamics. Although they excel in showing a topographic brain map, no single imaging modality can provide a direct and complete understanding of the spatiotemporal evolution of cerebral neural activations.13 Therefore, the application of multimodal imaging systems for the comprehensive assessment of neurophysiological parameters is necessary to accurately reflect injury or recovery. Photoacoustic (PA) imaging is a hybrid nonionizing imaging technology that is based on the intrinsic optical absorption of laser pulses leading to ultrasonic emission due to transient thermoelastic expansion.14,15 PA imaging exploits the combined advantage of weak ultrasonic scattering and high optical contrast.16 By varying the optical wavelength of the excitation laser, PA imaging is able to extract certain physiological parameters for functional imaging.17 The optical absorption in biological tissues can be due to endogenous molecules such as hemoglobin or melanin.18 Recently, PA imaging has been reliably used in breast tumor detection,19 oxygenation monitoring in blood vessels,18 subcutaneous vasculature imaging,20 and neurovascular imaging.21–23 Functional photoacoustic microscopy (fPAM) can offer in vivo, label-free measurements of functional changes in total hemoglobin concentration (HbT), cerebral blood volume (CBV), and hemoglobin oxygen saturation () at a sub-hundred-micrometer resolution.24 The current fPAM system has been used, with multiwavelength functional analysis, to image specific cortical activation changes in the rat brain with a good penetration depth25 and to study cerebral autoregulation without the use of contrast agents.22 This technology has opened up a new avenue to study potential therapeutic interventions (other than thrombolysis) that could further our understanding of the perfusion of the penumbra during the first few hours after stroke onset. Perfusion of the penumbra by itself may not serve as a reliable indicator of outcome due to the possibility of reperfusion injury.26 To address this issue, we therefore integrated electrocorticography (ECoG) recordings into our fPAM system as an indicator of neuronal integrity.27 We believe that the combination of ECoG and fPAM provides a more holistic (but admittedly not complete) assessment of the hemodynamics and neuronal functions.27 The combined system will subsequently be referred to as the ECoG-fPAM system. In this study, a focal photothrombotic ischemic (PTI) stroke was created in a targeted cerebral arteriole located in the primary somatosensory cortex forelimb region (S1FL) in the right hemisphere. Our aim is to understand the effect of forepaw stimulation on the perfusion and neuronal activity within the penumbra with two stimulation intensities (2 or 4 mA) and contrast the effects of unilateral forepaw (contralateral to the lesioned side) versus bilateral forepaw stimulation. 2.Materials and Methods2.1.Electrocorticography-Functional Photoacoustic Microscopy SystemThe integrated ECoG-fPAM system is capable of 1) induction of a PTI stroke at the cortical surface, 2) bilateral forepaw electrical stimulation, 3) ECoG recordings, and 4) functional PA imaging, as shown in Fig. 1(a). Seven stainless steel epidural electrodes (including one reference electrode) were secured on the skull to acquire somatosensory-evoked potential (SSEP) and resting-state ECoG signals, which were preamplified (PZ2-32, Tucker-Davis Technologies, Alachua, Florida) and recorded by a biosignal processor (RZ5D bioamp processor, Tucker-Davis Technologies) simultaneously with the stimulation treatment. MATLAB (MATLAB R12, Mathworks Inc., Natick, Massachusetts) was used for analyzing the related parameters of evoked potentials that corresponded to the forepaw electrical stimulation treatment. Fig. 1Overview of the electrocorticogram-functional photoacoustic microscopy (ECoG-fPAM) system for multimodal imaging of cortical functional changes in rats. (a) Schematic diagram of the ECoG-fPAM system including 1) functional photoacoustic (PA) imaging, 2) PTI stroke model in cortical blood vessels, 3) forepaw electrical stimulation, and 4) ECoG recordings. PA waves were detected by a 50-MHz transducer and processed through the A/D card to the PC for further data analysis. Forepaw electrical stimulation was delivered by a stimulator, driven by a neural signal processor, which also recorded the SSEPs after amplification via a front-end amplifier. For induction of PTI, a CW laser light was also coupled into the dark-field optical path of the fPAM and focused on the targeted arteriole in the selected cortical area. LNA: low noise amplifier. (b) Top view of the rat skull showing bilateral electrode placement for ECoG recordings. Ch1 and Ch2 were located in the bilateral M1 regions, and Ch3 to Ch6 were in the bilateral S1FL regions, respectively. The reference electrode was placed near the lambda landmark. The black box indicates a window for PA imaging across the bilateral S1FL regions centered at the bregma. The window for PTI stroke induction in the right hemisphere (S1FL region) is marked by a red box. The interaural line served as reference for PA imaging. (c) A single SSEP waveform indicating the various components, i.e., P1 amplitude, N1 amplitude, and peak-to-peak amplitude, which were evaluated as measures of neuronal integrity post-PTI stroke.  A custom designed 50-MHz dark-field confocal fPAM system was used to image functional changes in selected cortical blood vessels. Laser pulses of 4 ns were generated at a pulse repetition rate of 10 Hz by an optical parametric oscillator (Surlite OPO Plus, Continuum, San Jose, California), which was pumped by a frequency-tripled Nd:YAG Q-switched laser (Surlite II-10, Continuum). For PA wave excitation, two visible wavelengths of the laser pulses, 560 and 570 nm ( and ), were employed to monitor the relative functional CBV and changes.25 The 50-MHz ultrasonic transducer used in the fPAM system was custom-made by the Acoustic Sensor Co., Ltd, Taiwan. The designed transducer can offer an axial resolution of 32 μm and a lateral resolution of 61 μm with a fractional bandwidth of 57.5%, a focal length of 9 mm, and an active element of 6 mm. A 1-mm multimode fiber was used to deliver the laser energy. The fiber tip was coaxially aligned with a collimation lens, an axicon, a plexiglass mirror, and an ultrasonic transducer on an optical bench, which formed dark-field illumination that was confocal with the focus of the ultrasonic transducer. The transducer was immersed in an acrylic water tank during the imaging process, and the hole at the bottom of the tank was sealed with a piece of 15-μm-thick polyethylene film. A thin layer of ultrasonic gel was applied to the rat’s head, which was then attached to the thin film to ensure good acoustic coupling of the generated PA waves to the tank. The PA signals received by the ultrasonic transducer were preamplified by a low-noise amplifier (AU-3A-0110, USA), cascaded to an ultrasonic receiver (5073 PR, Olympus, Center Valley, Pennsylvania), and then digitized by a computer-based 14-bit analog to digital (A/D) card (CompuScope 14200, GaGe, Lockport, Illinois) at a 200-MHz sampling rate. The incident laser energy density on the sample surface was less than , which is well within the ANSI safety limit of .25,28 Fluctuations in laser energy were monitored by a photodiode (DET36A/M, Thorlabs, Newton, New Jersey). Before any further signal processing, the recorded photodiode signals were applied to compensate for PA signal variations caused by laser-energy instability. The achievable penetration depth of the fPAM is estimated to be 3 mm with signal-to-noise ratio (SNR),25 where SNR is defined as the ratio of the signal peak value to the root-mean-square value of the noise. No signal averaging was performed in order to capture the imaging of the fast hemodynamic responses in the functional imaging analysis.25 2.2.Animal PreparationMale Wistar rats weighing 200 to 250 g (InVivos Pte Ltd., Singapore) were used in this study. A total of 38 rats constituted five groups, including six animals for a control group and eight animals in each of the other four experimental groups. All experimental procedures used in this study were approved by the Institutional Animal Care and Use Committee of the National University of Singapore. The animals were housed at an animal care facility with constant temperature and humidity with free access to food and water. The animals were anesthetized with pentobarbital ( bolus and maintenance, i.p.) throughout the experiments. The anesthetized rats were mounted on a custom-made, acrylic stereotaxic head holder to reduce motion artifacts. The skin over the skull was then incised to expose the bregma landmark. The body temperature was measured via a rectal probe and maintained at by a self-regulating thermal plate (TCAT-2 Temperature Controller, Physitemp Instruments, Inc., Clifton, New Jersey). Resting-state ECoG and SSEP recordings were obtained by securing six stainless steel epidural electrodes in the skull over the bilateral motor cortical regions [M1, , ] and S1FL regions (S1FL and S1FL*, and , ) [Fig. 1(b)]. The reference electrode was positioned 3 mm to the right of the lambda landmark. The electrodes, connected with silver wires, were attached to a ZIF-clip head-stage (Tucker-Davis Technologies, Alchua, Florida), which was interfaced with the data acquisition system (Tucker-Davis Technologies). To facilitate PA imaging and PTI stroke induction, a cranial window [denoted by a black box in Fig. 1(b)] of approximately , centered at bregma, was made with a high-speed drill, while keeping the dura intact. The interaural line [indicated by blue dashed line in Fig. 1(b)] and bregma reference [red solid arrow in Fig. 1(b)] were used to position the rat’s head in the fPAM system in subsequent experiments.25 2.3.Photothrombosis Technique for Focal Ischemic Stroke InductionThe photothrombosis technique was used to induce a focal ischemic stroke in a targeted cerebral arteriole, which was a distal branch of the middle cerebral artery (MCA) (i.e., distinctly identified by their morphology as observed under the surgery microscope)29,30 located in the right hemisphere S1FL cortical region.25,31 The photosensitizer Rose Bengal (Na+ salt, R3877; Sigma-Aldrich, Singapore), which was diluted to in Hepes-buffered saline, was infused over 2 min via tail vein injection at rat body weight. The selected cerebral arteriole for occlusion, which was a distal branch of the MCA in the right hemisphere, was then illuminated with 0.5-mW, 532-nm CW laser light (MGM-20; Beta Electronics, Columbus, Ohio).32,33 The CW laser light was coupled into the designed dark-field optical path of the ECoG-fPAM system, as illustrated in Fig. 1(a), and was focused on the selected arteriole located in the right hemisphere S1FL region for 20 min until a stable clot formed.33 2.4.Forepaw Electrical Stimulation Treatment ProtocolForepaw electrical stimulation was applied to facilitate adequate perfusion in the peri-infarct region.8,25 Electrical stimulation treatment was applied with a stimulator (DS3, Digitimer, UK) via stainless steel bipolar subdermal needle electrodes inserted into the rat’s palmar forepaws (either unilaterally contralateral to the occlusion or bilaterally) separated by a distance of 1 cm. The stimulator’s trigger pulse signal was generated by a multichannel bioamp processor (RZ5D, Tucker-Davis Technologies). A monophasic constant current of 2- or 4-mA intensity with a 0.2-ms pulse width at a frequency of 3 Hz and 1-min stimulation duration was applied for each block, as shown in Fig. 2(a). The experimental protocol was composed of a 15-min treatment block for ECoG recordings and PA imaging, and there were in total eight blocks for each experimental group. Each block consisted of 1 min of stimulation followed by a 3-min resting period to allow sufficient time for the brain to return back to the resting state before subsequent measurements.25 The resting-state ECoG was then recorded for 5 min. Another 5 s of forepaw electrical stimulation (i.e., 2- or 4-mA intensity with a 0.2-ms pulse width at a frequency of 3 Hz) was applied before the 3-min PA imaging to evoke hemodynamic responses. Following PA imaging, the next block of SSEP recordings commenced after a 2-min interval.25 Fig. 2Protocol for electrical forepaw stimulation treatment and for eliciting evoked responses. (a) Schematic of the experimental protocol illustrating the 15-min block including forepaw stimulation, ECoG recording, and PA imaging intervals. The SSEP was recorded simultaneously with the first “Stimulation-ON” phase (St1), which consisted of a constant pulse width of 0.2 ms, a 3-Hz pulse train, and pulse amplitude of 2 or 4 mA. The resting-state ECoG recording (RS) followed after the fourth minute of the block. St2 corresponds to a 5-s stimulation administered to evoke hemodynamic responses for PA imaging. (b) Treatment schema indicating baseline and post-stroke recording blocks. Control group had no stimulation treatment applied during the experiment, and groups 1 to 4 were the experimental groups with stimulation treatment. Groups 1 and 2 had unilateral stimulation of only the left forepaw with 2 or 4 mA, respectively. Groups 3 and 4 had bilateral stimulation with 2 or 4 mA, respectively. Estimation of infarct volume by TTC staining was performed 48 h post-PTI stroke induction.  The PA signals at or were acquired in the block to assess the stimulation-induced hemodynamic changes in the bilateral S1FL regions. The PA B-scan images acquired in the bilateral S1FL regions were used to assess stimulation-induced functional hemodynamic changes. A total of five groups were used in this study, including one control and four experimental groups [Fig. 2(b)]. The control group received the PTI stroke induction but no forepaw electrical stimulation treatment. In the other four experimental groups, forepaw electrical stimulation treatment was applied at different intensities and methods as follows: unilateral (left forepaw) at 2 mA (group 1), unilateral (left forepaw) at 4 mA (group 2), bilateral at 2 mA (group 3), and bilateral at 4 mA (group 4). 2.5.Data Analysis of Measured CBV andTwo optimized wavelengths ( and ) were employed to monitor the functional CBV and changes.25 We assumed that CBV is proportional to the specific cortical region.34 The PA cross-sectional B-scan images in specific cortical region at [i.e., ] were used. Functional CBV changes (i.e., ) were constructed according to the following equation: where was the time in each block, represented the cross-sectional area at a given time in each block, and was the cross-section baseline estimated from the baseline image acquired immediately before the onset of evoked forepaw electrical stimulation in the block.21 was calculated via the total vessel pixel count of a selected cross-sectional area [i.e., ]. The vessel pixel was defined as the pixel that possessed a PA signal that was three times greater than the background signal.21,22,35Functional images of changes at a given time point in each block were assessed according to the following equation: where (i.e., PA image acquired at ) was normalized to on a pixel-by-pixel basis, and was the baseline image at acquired immediately before the onset of forepaw electrical stimulation in each block.25 Note that negative values in [i.e., a positive ] indicate increases in levels and vice versa.25 The mean functional changes [] in a specific cortical region during the stimulation period were probed as follows:From Eqs. (2) and (3), using the fPAM system, an independent probing of the relative changes in CBV and could be achieved in which was used as a marker for CBV and was used as a marker for . Please refer to our previous studies for more details on the data analysis of the functional changes in CBV and in specific regions.21,22 2.6.Data Analysis of Electrophysiological RecordingsNeural activity was evaluated by electrophysiological recordings including SSEPs and resting-state ECoG. The SSEPs, induced by forepaw electrical stimulation, were recorded before and after PTI stroke induction. The recorded SSEPs were sampled at 1 kHz, preamplified through the PZ2-32 preamplifier, and bandpass filtered between 0.3 and 200 Hz via the RZ5D bioamp-processor. The stimulus-onset time stamps of each trigger pulse were recorded simultaneously with the SSEP signals. With 3-Hz stimulation applied in each treatment block for 1 min, 180 corresponding sweeps were extracted to generate an averaged SSEP over a 100-ms epoch poststimulus pulse for evaluating the changes of cortical function. The SSEP components were extracted to verify successful induction of PTI indicated by significantly diminished SSEP after PTI onset and to evaluate the changes of evoked responses induced by forepaw electrical stimulation before and after PTI stroke [Fig. 1(c)]. In order to stabilize the thrombus, the stimulation treatment in the various groups was onset only after an interval, following successful induction of PTI stroke.36,37 The P1 (the first positive peak after forepaw stimulation) amplitude, N1 (the first negative peak directly following P1) amplitude, and peak-to-peak amplitude were extracted from the averaged SSEPs [Fig. 1(c)]. The above-mentioned SSEP parameters of P1, N1, and peak-to-peak amplitudes were all evaluated based on Ch4 because it was located in the ipsilesional S1FL (iS1FL) region which was placed in close proximity to the targeted PTI stroke location. Additionally, we chose the contralateral left-forepaw stimulation as a reference to elicit an evoked response. Additionally, variations in the resting-state ECoG across the lesioned and normal cortical regions were assessed using spectral analysis and interhemispheric coherence analysis.38–40 A multivariate autoregressive model (MVAR) was adapted to carry out these analyses.41 denoted the multichannel ECoG data vector, and denoted the ’th channel of ECoG signal (i.e., , in this study). The ’th-order MVAR model is given by where is the data vector in time , is the coefficient matrix of model coefficients for each time lag , and represents white Gaussian noise.41 The optimal model order was determined by Schwarz’s Bayesian criterion.42Interhemispheric coherence, a measure of the linear relationship of two signals at a specific frequency, was calculated after the raw data were fitted to the MVAR model.43 The coherence was calculated for the delta (0.1 to 4.0 Hz) and alpha (8.0 to 13.0 Hz) frequency bands because they are strong indicators for injury and recovery.44,45 To limit intersubject variability, the coherence analysis was carried out relative to the baseline magnitude and by selecting 20 s of nonoverlapping artifact-free ECoG epochs from every 5 min of recordings. The coherence spectrum function, , for two given signals is as follows: where denotes the frequency, and are the autospectrum powers, and is the cross-spectrum power of the electrode pair . Coherence, , was further defined by the absolute value of the coherence spectrum function, 46:From Eq. (6), we obtain a measure of the correlation between the lesioned and intact hemispheres, which helps us to observe the changes in cortical activation after PTI onset. These coherence calculations were carried out on Ch3 and Ch4, which were closely associated with the corresponding PTI stroke location. Ch1 and Ch2 are in the M1 region, which is not responsive to the administered forepaw stimulation, and are not significantly affected by focal PTI stroke in the chosen location; Ch5 and Ch6 are in the S1FL cortex but border the forelimb and hindlimb region and hence the changes of ECoG are subtler than those of Ch3 and Ch4. The alpha–delta ratio (ADR), an established quantitative electroencephalography (QEEG) measure of cerebral injury and an efficient index of functional outcome postischemia,47 can be utilized to view functional neural changes after a PTI stroke. ADR was calculated as the ratio between the alpha power and delta powers over the specified cortical location.47 Fast Fourier transform analysis was then carried out to measure the mean power at each electrode in the delta and alpha frequency range. The percent change in ADR was calculated with respect to the baseline ADR for each electrode. A lower score indicated a greater degree of ECoG slowing and a worse outcome and vice versa. To assess the recovery/injury at the peri-infarct region, the ADR results were calculated for the electrode Ch4, which was located in the lesioned region. 2.7.Measurement of the Infarct Volume by TTC StainingThe extent of infarction was measured with 2,3,5-triphenyl-tetrazolium chloride (TTC). Forty-eight hours after successful PTI induction, the rats were deeply anesthetized with 10% chloral hydrate, and the brains were rapidly removed, washed in phosphate-buffered saline (PBS) at room temperature, and frozen at for 10 min.48 The brain tissue from an area 4-mm anterior and 6-mm posterior to the bregma was cut into 10 serial 1-mm coronal sections. The sliced brain tissues were stained with 2% TTC (Amresco, Solon, Ohio) for 30 min at 37°C in the dark followed by overnight immersion in 4% paraformaldehyde in 0.1 M PBS, pH 7.4, at 4°C. The infarcted tissue remained unstained (white), whereas the normal tissue was stained red. The extent of ischemic infarction was traced, and the integrated volume was calculated using Image J software (NIH Image). The infarct volume was calculated by adding the infarction areas of all sections and multiplying by slice thickness. To compensate for the effect of brain edema, the corrected infarct volume was calculated as follows: percentage of corrected . 2.8.Statistical AnalysisThe experiment was designed to quantitatively measure PA signals [i.e., ], the corresponding SSEP changes, and the changes in the bilateral S1FL regions following forepaw electrical stimulation for PTI stroke treatment. Statistical significance was assessed with a paired -test, and significance was defined as a probability () value of . Case-to-case differences in averaged PA signals of the studied areas and changes in cross-sectional areas (i.e., relative CBV and changes) were examined using paired -tests (, for groups 1 to 4, for the control group). The significance of the changes observed in the averaged PA signals of the studied areas in response to forepaw electrical stimulation was analyzed using the Wilcoxon matched-pairs signed-rank test (two-tailed, , for groups 1 to 4, for the control group).25 Analysis of variance (ANOVA) was performed to assess the changes of SSEPs and coherences in different brain areas and between cases using a repeated-measures ANOVA with the Fisher’s least significant difference post hoc analysis.49 All statistical analyses were performed with SPSS (version 10.0, IBM, Armonk, New York). The data are presented as the . 3.Results3.1.Relative CBV and Changes with Sensory Stimulation Post-PTI StrokeThe relative positions for PA imaging and the open-skull window of the cortical surface are shown in Figs. 1(b) and 3(a)–3(c), respectively. Figure 3 shows the maximum PAM-measured CBV (i.e., ) changes before PTI [baseline values as shown in Fig. 3(a)] and immediately after PTI stroke onset [Fig. 3(b)] in one stimulation block from the selected cortical section at the bregma location [indicated in Fig. 1(b) by a red solid arrow]. Here in Fig. 3(c), we show the PAM-measured CBV changes at the end of forepaw stimulation treatment in group 3. Cortical blood vessels were observable on the cortical surface pre- and post-PTI stroke onset [open-skull photographs in Figs. 3(a)–3(c)]. The vasculature of the cortex and a selected cerebral arteriole located in the right hemisphere S1FL region were reliably identified in the PA B-scan image at [Figs. 3(a)–3(c)]. Note that all PA images/values were normalized by the maximum change in the image between all groups and share the same color bar of PA signals (Fig. 3). Forepaw electrical stimulation was applied at different conditions as follows: after the onset of stroke: baseline (control group, no stimulation), unilateral (left forepaw) at 2 mA (group 1), unilateral (left forepaw) at 4 mA (group 2), bilateral at 2 mA (group 3), and bilateral at 4 mA (group 4). Significant recovery in the functional CBV (i.e., ) changes was observed in group 3 at the end of treatment with bilateral forepaw stimulation compared to the baseline (), as shown in Fig. 3(c). It is also interesting to notice the enhanced relative CBV changes through the recruitment of collateral circulation, as observed from the open-skull photograph in Fig. 3(c), leading to improved perfusion in the peri-infarct region, at the end of treatment in group 3. The averaged functional CBV (i.e., ) and (i.e., ) changes in the control and experimental groups as a function of time over the bilateral S1FL regions are shown in Figs. 4(a) and 4(b), respectively. In the PTI side (i.e., iS1FL), the relative CBV decreased significantly to 0.38, 0.42, 0.41, and 0.40 compared to the baseline in experimental groups 1 to 4, respectively, at PTI stroke onset timing [Fig. 4(b)]. Relative values also largely decreased to 0.34, 0.36, 0.36, and 0.35 at PTI stroke onset timing compared to the baseline in experimental groups 1 to 4, over the iS1FL region, respectively. After administering forepaw stimulation treatment, the relative CBV and changes in only group 3 (bilateral 2-mA stimulation) showed noteworthy changes and significantly returned to and 0.72 of the baseline () in the ipsilesional side, respectively. Group 1 ( for CBV and 0.62 for changes) and group 2 ( for CBV and 0.48 for changes) also showed significant improvements () in the iS1FL region, but only partially recovered compared to group 3. In the iS1FL region, in contrast, group 4 ( for CBV and 0.39 for changes) only slightly recovered at the end of treatment. Interestingly, in the contralesional S1FL (cS1FL) region, as shown in Fig. 4(a), both the relative CBV and slightly increased post-PTI following treatment in group 2 compared to group 1. Similarly, there was a marginal increase in the relative CBV and post-PTI in group 4 compared to group 3 in the cS1FL region after forepaw stimulation treatment. Fig. 3Graphical representation of cortical sensory activations (in a coronal section at bregma +0 coordinate), corresponding PA B-scan images and open-skull photographs of the targeted arteriole on the cortical surface taken before and after PTI stroke in response to electrical forepaw stimulation. The green arrow in open-skull photograph of Fig. 3(a) points to the targeted arteriole which is a distal branch of MCA. The region of infarct is schematically demarcated by the yellow dashed circle in the open-skull photographs of Figs. 3(b) and 3(c) and denoted correspondingly in the graphic of Figs. 3(b) and 3(c) by a small dense yellow circle. In Figs. 3(a) to 3(c), the window for PA B-scan images is 8 mm wide and 3 mm deep, and the yellow bar in the open-skull photograph of Fig. 3(a) indicates 1 mm. The different arrow thicknesses in the graphic representations of Figs. 3(a) to 3(c) indicate the different activation intensities of various pathways. (a) Baseline (without stroke) images showing selected arteriole from the intact distal branch of the MCA in the right hemisphere (S1FL region) targeted for PTI stroke induction. Normal ipsilateral pathways are weaker than contralateral sensory pathways as indicated in the graphic. (b) PTI stroke induction can be observed by an absence of CBV in the targeted arteriole located in the indicated region of infarct. The relative CBV change is significantly lower than baseline (from PA image indicated by yellow arrow). The graphic in Fig. 3(b) represents not only the strengthened ipsilateral and weakened contralateral pathways but also the transcallosal pathway activation, which is due to transcallosal disinhibition.50 (c) Bilateral stimulation treatment with 2 mA enhances the activations of both of the ipsilateral and contralateral pathways, confirmed by the PA image with a relative increase in CBV compared to Fig. 3(b).  Fig. 4Normalized functional CBV (i.e., ) and (i.e., ) changes from cS1FL (a) and iS1FL (b) regions in different groups as a function of time. We can observe that the iS1FL values of relative CBV and in group 3 significantly increased with bilateral forepaw stimulation at 2 mA. There was partial recovery in groups 1 and 2, but group 4 values improved only slightly, compared to the PTI onset value. On the cS1FL side, the values of relative CBV and slightly increased in group 2 compared to group 1, following stimulation treatment. Similarly, group 4 exhibited higher relative CBV and changes than group 3. Standard deviations are indicated by the error bars.  3.2.Changes in SSEP with Sensory Stimulation Post-PTI StrokeThe SSEP parameters of P1, N1, and peak-to-peak amplitude were used to to verify successful induction of PTI indicated by significantly diminished SSEP at PTI onset and to evaluate the changes of evoked responses induced by forepaw electrical stimulation before and after PTI stroke. The peak amplitude changes of SSEP components at various time points along the treatment duration in the different experimental groups are shown in Fig. 5. The control group involved only PTI stroke induction but no forepaw stimulation treatment.36,37 Hence, plots of SSEP components are included only for the four experimental groups and not for the control group. All the evaluations were based on Ch4 because it is located in the iS1FL hemisphere, in close proximity to the targeted PTI stroke location. The contralateral left-forepaw stimulation was chosen as a reference to elicit an evoked response. The repeated-measures ANOVA indicated that the amplitude of SSEPs differed in the four groups (interaction effect, P1 amplitude: , and N1 amplitude: , ). We then performed a post hoc analysis by comparing the P1 amplitudes at each time point. There was no significant change in the baseline of P1 and N1 amplitudes across groups (). The P1 amplitudes of the four experimental groups decreased approximately 40% at PTI stroke onset compared to baseline, as shown in Fig. 5(a). After treatment, the P1 amplitude significantly increased to of the baseline following unilateral stimulation of the left forepaw at a 2-mA intensity (group 1) and of the baseline after bilateral forepaw stimulation at a 2-mA intensity (group 3) (). Unfortunately, the P1 amplitudes dropped in groups 2 and 4 with forepaw electrical stimulation administered to the animals at 4-mA intensity ( for group 2 and for group 4 of baseline amplitude). The N1 amplitude, similar to the P1 amplitude, decreased at PTI onset to approximately of the baseline in the four groups, as shown in Fig. 5(b). An increase in the N1 amplitude was observed at the end of group 1 treatment ( of baseline), while a more significant recovery (to of baseline) was observed following group 3 treatment (). In group 2, at the end of treatment, there was a slight increase in N1 amplitude values ( of baseline), whereas in contrast, N1 amplitude decreased to in group 4 at the end of treatment. The peak-to-peak amplitude followed the same trend as the P1 and N1 amplitudes. An initial decrease of 40% lower than baseline was observed in the peak-to-peak amplitude in all four experimental groups at PTI onset, as shown in Fig. 5(c). Substantial improvement in peak-to-peak amplitude values to and of baseline was observed in groups 1 and 3, respectively. While there was no significant improvement in values ( of baseline) in group 2, there was a slight decrease in values ( of baseline amplitude) in group 4 at the end of treatment. Fig. 5Experimental results of the three SSEP components including (a) P1 amplitude (b) N1 amplitude, and (c) peak-to-peak amplitude calculated over the iS1FL [Ch4, shown in Fig. 1(b) because it is located close to the region of PTI stroke induction]. In our study, the contralateral left forepaw stimulation was considered a reference for eliciting an evoked response. The percentage change in amplitude of the above-mentioned SSEP components was calculated compared to the baseline values. The red dashed line indicates PTI onset, and the black dot shows the baseline value of amplitude, which is a reference for calculating the percent (%) change in amplitude. As shown, there was a steady increase in P1, N1, and peak-to-peak amplitudes in groups 1 and 3 with forepaw electrical stimulation at 2 mA intensity, indicating significant recovery of neural activity. By contrast, the SSEP component values significantly decreased in both groups 2 and 4 at the end of treatment and indicate that stimulation with 4 mA is not as beneficial for recovery compared to stimulation with 2 mA. 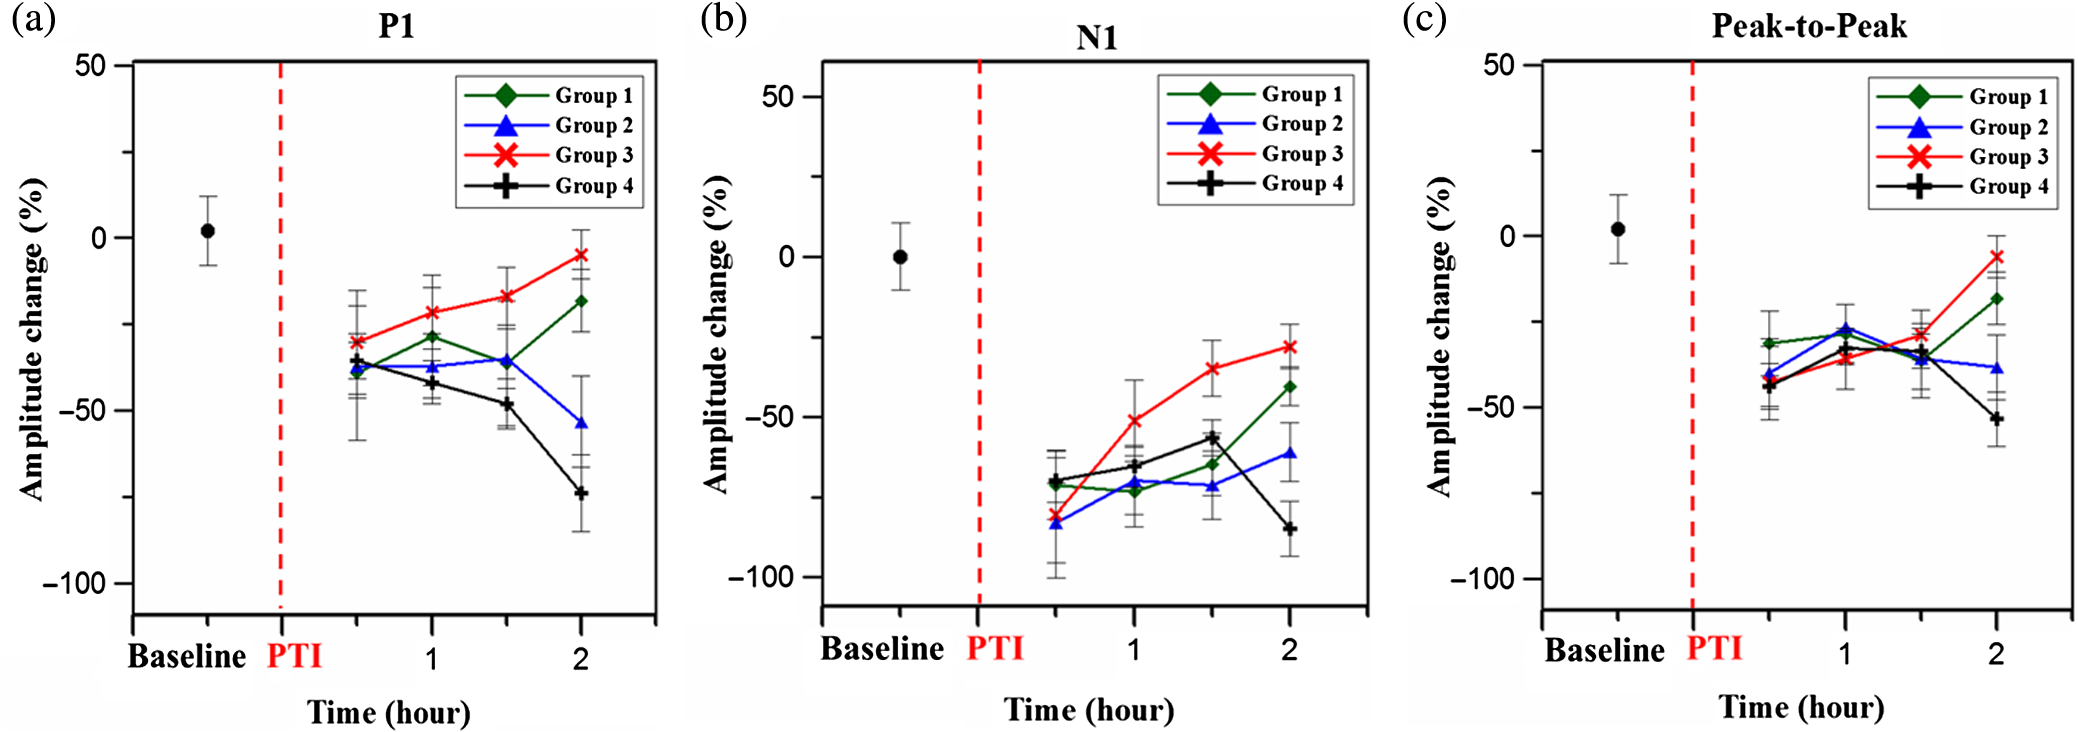 3.3.Changes in Bilateral S1FL Coherence and ADR with Sensory Stimulation Post-PTI StrokeCoherence changes were evaluated across the bilateral S1FL regions (Ch3 and Ch4) to assess the neuroprotective effect of forepaw electrical stimulation pre- and post-PTI induction, as shown in Figs. 6(a) and 6(b). Here, Ch3 and Ch4 were used for coherence calculations because they were closely associated with the corresponding PTI stroke location (right S1FL region). Fig. 6Trend of interhemispheric coherence between bilateral S1FL regions pre- and post-PTI stroke induced in the right hemisphere S1FL region. Here, Figs. 6(a) and 6(b) indicate coherence changes in the bilateral S1FL regions [Ch3 and Ch4 (shown in Fig. 1(b)], and Fig. 6(c) shows ADR changes of Ch4 in iS1FL region. The results were calculated for electrode Ch3 and Ch4, because these were closely associated with the corresponding PTI stroke location. The coherence in the alpha and delta bands was calculated because these frequencies are indicative of injury state.47 The results indicate significant recovery of alpha and delta coherence following bilateral 2-mA stimulation (group 3) (). Also, we can observe that the recovery of coherence values after unilateral stimulation with 2 mA (group 1) was better than 4 mA (group 2). Bilateral 4-mA stimulation was counterproductive and resulted only in decreased coherence values. ADR values followed the same trend as coherence and it should be noted that ADR is a positive recovery indicator for cerebral injury. Recovery of ADR in group 3 was significantly better than any other experimental group at the end of treatment ().  The repeated-measures ANOVA indicated that there was a significant interaction between the frequency band and time point (, ). The interaction among group, time point, and frequency band was also significant (, ). The coherence changes in the bilateral S1FL regions in the alpha band continued to decrease and reached values of after 2 h of PTI onset in the control group, as shown in Fig. 6(a). A significant increase (to of baseline) in the alpha coherence was observed after bilateral forepaw stimulation treatment of 2 mA in group 3. Similarly, in group 1, the alpha coherence values increased to of baseline at the end of stimulation treatment. It is noteworthy that in group 2, the alpha coherence values increased at the beginning of treatment. However, they decreased 1.5 h post-PTI stroke induction (decreased to of baseline). Also, a decrease ( of baseline) in alpha coherence values was observed after the bilateral forepaw stimulation treatment of 4 mA (group 4). The coherence changes in the delta band pre- and post-PTI stroke were similar to the alpha coherence. Delta coherence decreased, among all groups, to at least immediately after PTI stroke onset, as shown in Fig 6(b). We observed notable recovery in the delta coherence values only in groups 1 and 3 ( and of baseline) 2 h after stimulation (, ). Group 2 showed no significant improvement in delta coherence values at the end of treatment ( of baseline). On the other hand, the delta coherences decreased ( and of baseline) in group 4 with 4-mA stimulation applied after PTI onset, whereas the control group attained a delta coherence value of of baseline after 2 h of PTI onset. The ADR results were calculated for electrode Ch4, because it was located in the lesioned hemisphere, i.e., contralateral to the electrical stimulation, and indicated recovery/injury at the peri-infarct region.47 The ADR of the iS1FL (i.e., Ch4) decreased after PTI induction, as shown in Fig. 6(c), compared to baseline. A sustained decrease in the ADR of the iS1FL was observed in the control group, reaching of baseline at 2 h post-PTI onset. While a moderate recovery of ADR (to of baseline) followed group 1 treatment, a significant increase in ADR values at the iS1FL region was observed in group 3 following bilateral forepaw stimulation treatment at 2 mA, which contributed to an overall recovery of (i.e., post-treatment recovery to over 6% of baseline from the of baseline after PTI stroke onset). The ADR values in group 2 recovered well before decreasing after 1.5 h of PTI stroke induction, reaching of baseline at the end of treatment. The ADR of group 4 showed a similar trend as the control group, deteriorating with the onset of bilateral forepaw electrical stimulation treatment at 4-mA intensity post-PTI stroke. 3.4.Quantification of Infarct Volume after Sensory StimulationWe compared the infarct areas in coronal sections for each group by TTC staining [Fig. 7(a)] and expressed the lesion volume as a percentage (%) of the contralateral hemispheric volume [Fig. 7(b)]. The infarcted regions were shown as pale (unstained) regions only involving the S1FL cortex. All treated groups had a significant reduction in the infarct volume (% contralateral hemisphere) compared to the controls (). Group 3, treated with bilateral forepaw stimulation with 2 mA, had the most significantly reduced infarct volumes (by ) relative to the controls and other treated groups (). Additionally, from Fig. 7(b), we can see that the absolute percentage of infarction volume in group 3 was , implying that the bilateral forepaw stimulation treatment at 2 mA enhanced perfusion in the peri-infarct region by . Furthermore, treatment with either unilateral (group 1) or bilateral (group 3) forepaw stimulation with 2 mA resulted in smaller infarcts compared with the 4-mA treatments (group 2 and group 4) () in the right hemisphere S1FL region. Fig. 7Infarct volume detected by TTC staining and analysis of the percent change in infarct volume in the S1FL cortex in each group (). (a) Representative ischemic brain coronal sections of the control group (first row) and experimental groups that received contralateral forepaw electrical stimulation with 2 mA (second row) and 4 mA (third row), bilateral forepaw electrical stimulation with 2 mA (fourth row) and 4 mA (fifth row) post-PTI and treatment, respectively. (b) Bar diagram showing infarct volume (%). A reduction in infarct region was found in all treated groups that involved unilateral or bilateral forepaw electrical stimulation and was significant compared to the controls (). Bilateral 2-mA stimulation in group 3 showed a significant reduction in infarct region than unilateral 2-mA stimulation in group 1 (). Group 4 treatment contributes counter-productively and we can observe this as a spread in infarction to the contralateral hemisphere as well. Data are presented as the , in each group.  4.Discussion4.1.Advantages of ECoG-fPAM Setup for the Study of StrokeThis ECoG-fPAM system allows the simultaneous assessment of two important variables in the pathophysiology of stroke, i.e., changes in regional cerebral perfusion (CBV and )22 and neuronal integrity (SSEP, coherence, and ADR).27 In this PTI stroke rat model, a focal infarct was created in the right hemisphere S1FL region by targeting a distal branch of the MCA. Neuronal integrity was expressed as the extent of diminishment or restoration of SSEP and ADR relative to baseline. The degree of recovery was also assessed by a histological component, infarct volume by TTC staining. The unique merit of fPAM is its ability to study the three-dimensional cerebrovascular dynamics of a small region with relatively high intrinsic resolution.24,25 This is not achievable with traditional methods such as PET or MR perfusion imaging, where the spatial resolution is typically low.11,12 Furthermore, the combination of fPAM and ECoG in our setup allows the relationship between regional cerebral perfusion and neuronal integrity to be studied.27 We considered neuronal integrity as an end-point and regional cerebral perfusion as a variable. The forepaw stimulation was used to alter the regional cerebral perfusion, and we simultaneously studied the changes in neuronal integrity. Interestingly, our results showed that an increase in regional perfusion was not always associated with restoration of neuronal integrity. The details will be explained in the subsequent paragraphs. 4.2.Bilateral Forepaw Stimulation Results in Better Outcome than Unilateral Forepaw StimulationOur previous study demonstrated that stimulation of the forepaw contralateral to the stroke within 2 h resulted in improved peri-infarct perfusion and recovery of SSEP and ADR.27 This could be explained by two theories. First, the excitation of peri-infarct neurons (via stimulation of contralateral forepaw) causes a relative increase in local through metabolic coupling and the recruitment of collateral vessels [observed in our study as enhanced arterioles around the region of infarct in the open-skull photograph shown in Fig. 3(c)]50–52 which restored perfusion to the penumbra.53 The improved perfusion may lead to restoration of neural activity, as indicated by the improvements in SSEP, coherence, and ADR (Figs. 5 and 6). It is unlikely that there will be sprouting in 2 to 3 h. That is, this hypothesis is not entirely validated yet. The above-mentioned forepaw stimulation reaches the ipsilesional somatosensory cortex via the well-understood crossed sensory pathway [purple line indicated in the graphic representation in Fig. 3(c)].54 We explored the question whether the addition of ipsilateral forepaw stimulation (same side as the PTI stroke), i.e., bilateral stimulation (groups 3 and 4), would further enhance the improvement observed during unilateral stimulation of contralateral forepaw (groups 1 and 2). Bilateral stimulation resulted in higher relative CBV and (Fig. 4) changes in the peri-infarct region compared to unilateral stimulation and contributed to a reduced infarct volume (Fig. 7). The extent of recovery of hemodynamics [Figs. 4(a) and 4(b)], SSEP (Fig. 5), and ADR [overall recovery of 82% as shown in Fig. 6(c)] was also significantly better with bilateral stimulation. We hypothesized that stimulation of the forepaw ipsilateral to the side of stroke reached the peri-infarct zone through a less well-known ipsilateral pathway, the existence of which has been shown in several previous studies.55–58 This ipsilateral pathway is normally latent but is unmasked during cerebral injury to compensate for the disrupted contralateral pathways.54 This ipsilateral pathway could be utilized in the presence of stroke to excite more neurons located in the peri-infarct sensory region. In addition to the contralateral and ipsilateral pathways, there is potentially a third pathway promoting excitation in the peri-infarct zone, the transcallosal pathways.59,60 The sensory cortical representations are interhemispherically linked to their homotopic counterparts in the opposite hemisphere via fibers that traverse the corpus callosum.61–63 This pathway is usually inhibited under normal circumstances but could be disinhibited in the presence of a unilateral stroke.64 A previous study indicated that inhibition of the transcallosal pathway is reduced in the event of a unilateral focal stroke.53 Our findings are in agreement and demonstrate an increase in relative CBV and values at the corpus callosum after PTI stroke onset [Fig. 3(c)]. Stimulation of the forepaw on the same side as the stroke activates the contralateral normal sensory cortex through the usual crossed pathway [graphical representation in Fig. 3(c). The neuronal excitation is then propagated to the peri-infarct region through the corpus callosum.65,66 Unfortunately, the question of how much activation is contributed by the ipsilateral pathway versus the transcallosal pathway could not be addressed in our study. 4.3.Unilateral Forepaw Stimulation with 4 mA Resulted in Poorer Outcomes Compared to 2 mAOur results showed that the unilateral forepaw stimulation at 2 mA contralateral to the side of infarct resulted in a 26% increase in relative CBV changes at the peri-infarct region compared to post-PTI onset [Fig. 4(b)]. However, doubling the stimulation intensity to 4 mA only resulted in a further 6% increase in local relative CBV changes [Fig. 4(b)] in the PTI location. Despite the increase in relative CBV changes in unilateral stimulation with 4 mA, the extent of SSEP and ADR recovery was not significantly better than stimulation with 2 mA (Figs. 5 and 6). Our findings suggest that the relatively small increase in local CBV may be offset by the disproportionately larger increase in neuronal energy requirement for the increased stimulation intensity. Furthermore, we observed that increasing the stimulation intensity to 4 mA (group 2) also caused a relative increase in the CBV and in the region of healthy cortex adjacent to the PTI region. This could potentially result in a competitive diversion of CBF away from the peri-infarct region to the adjacent healthy cortex, and this diversion widens the region of infarct (Fig. 7).67 4.4.Bilateral Forepaw Stimulation with 4 mA Resulted in Poorer Outcomes Compared to 2 mASimilar to the observation in unilateral stimulation, we observed that increasing the stimulation intensity from 2 to 4 mA during bilateral forepaw stimulation appeared counter-productive. Despite an improvement in perfusion (i.e., increased relative CBV and ) at the peri-infarct region, SSEP and ADR failed to recover with bilateral forepaw stimulation at 4 mA (Figs. 3–6). We observed a relative increase in both CBV and in the contralateral (normal) sensory cortex when the stimulation intensity was increased from 2 to 4 mA [Fig. 4(a)]. We postulated that bilateral stimulation with 4 mA has similarly created a competitive diversion of CBV from the PTI region to the contralateral normal cortex, consequently enlarging the infarction (Fig. 4).50 Therefore, bilateral forepaw stimulation was optimal at an intensity of 2 mA, which balanced the benefit of increasing perfusion in the peri-infarct region against the unwanted increase in relative changes in the non-PTI cortex. 5.ConclusionThe overall conclusion of our study is that low electrical strength intervention of bilateral electrical forepaw stimulation improved perfusion and restored neuronal integrity of the penumbra and thereby reduced the infarct volume in the hyperacute phase in a PTI stroke model. Using the combined ECoG-fPAM system, we evaluated the relative changes in cerebral hemodynamic functions (CBV and ) and neural activity (SSEP, coherence, and ADR) in response to electrical forepaw stimulation. We also determined the infarct volumes after forepaw stimulation treatment. We observed that bilateral forepaw electrical stimulation at 2 mA produced the best outcome (i.e., recovery of ADR, 95% improved perfusion in the region of penumbra, and 75% reduction in infarct volume compared to controls) when administered in the hyperacute phase of PTI stroke. This could be attributed to increased perfusion from collateral circulation through the excitation of neurons within the penumbra. Further studies will be needed to properly titrate both the stimulus strength and stimulus rate to obtain the most beneficial regime for facilitating stroke recovery. Our study also points to a potentially confounding effect of excess stimulation, which may not improve the outcome and may even risk degradation of recovery due to hyper-excitability. In the future, we will employ this model to investigate the utility of other interventions such as therapeutic hypothermia, hypertension, and hypercarbia for improving perfusion to the penumbra. Our ECoG-fPAM approach will allow observation of perfusion (blood flow and oxygenation) as well as electrophysiological response to these interventions. AcknowledgmentsThe authors thank the National University of Singapore for supporting the Neurovascular Imaging Laboratory (NIL) at the Singapore Institute for Neurotechnology (SiNAPSE) under grant number R-711-000-026-133. ReferencesN. W. Manninget al.,
“Acute ischemic stroke: time, penumbra, and reperfusion,”
Stroke, 45
(2), 640
–644
(2014). http://dx.doi.org/10.1161/STROKEAHA.113.003798 SJCCA7 0039-2499 Google Scholar
J. AstrupB. K. SiesjoL. Symon,
“Thresholds in cerebral ischemia—the ischemic penumbra,”
Stroke, 12
(6), 723
–725
(1981). http://dx.doi.org/10.1161/01.STR.12.6.723 SJCCA7 0039-2499 Google Scholar
P. Ramos-Cabreret al.,
“Targeting the ischemic penumbra,”
Stroke, 42
(1 Suppl), S7
–S11
(2011). http://dx.doi.org/10.1161/STROKEAHA.110.596684 SJCCA7 0039-2499 Google Scholar
M. A. MoskowitzE. H. LoC. Iadecola,
“The science of stroke: mechanisms in search of treatments,”
Neuron, 67
(2), 181
–198
(2010). http://dx.doi.org/10.1016/j.neuron.2010.07.002 NERNET 0896-6273 Google Scholar
“Tissue plasminogen activator for acute ischemic stroke. The National Institute of Neurological Disorders and Stroke rt-PA stroke study group,”
N. Engl. J. Med., 333
(24), 1581
–1587
(1995). http://dx.doi.org/10.1056/NEJM199512143332401 NEJMAG 0028-4793 Google Scholar
M. J. Arieset al.,
“Cerebral autoregulation in stroke: a review of transcranial Doppler studies,”
Stroke, 41
(11), 2697
–2704
(2010). http://dx.doi.org/10.1161/STROKEAHA.110.594168 SJCCA7 0039-2499 Google Scholar
A. D. Barretoet al.,
“The argatroban and tissue-type plasminogen activator stroke study final results of a pilot safety study,”
Stroke, 43
(3), 770
–775
(2012). http://dx.doi.org/10.1161/STROKEAHA.111.625574 SJCCA7 0039-2499 Google Scholar
R. D. FrostigC. C. LayM. F. Davis,
“A rat’s whiskers point the way toward a novel stimulus-dependent, protective stroke therapy,”
Neuroscientist, 19
(3), 313
–328
(2013). http://dx.doi.org/10.1177/1073858412462607 NROSFJ 1073-8584 Google Scholar
B. HeZ. Liu,
“Multimodal functional neuroimaging: integrating functional MRI and EEG/MEG,”
IEEE Rev. Biomed. Eng., 1 23
–40
(2008). http://dx.doi.org/10.1109/RBME.2008.2008233 1937-3333 Google Scholar
B. C. Campbellet al.,
“CT perfusion improves diagnostic accuracy and confidence in acute ischaemic stroke,”
J. Neurol. Neurosurg. Psychiatry, 84
(6), 613
–618
(2013). http://dx.doi.org/10.1136/jnnp-2012-303752 JNNPAU 0022-3050 Google Scholar
S. Junget al.,
“Factors that determine penumbral tissue loss in acute ischaemic stroke,”
Brain, 136
(Pt 12), 3554
–3360
(2013). http://dx.doi.org/10.1093/brain/awt246 BRAIAK 0006-8950 Google Scholar
Y. Suet al.,
“Noninvasive estimation of the arterial input function in positron emission tomography imaging of cerebral blood flow,”
J. Cereb. Blood Flow Metab., 33
(1), 115
–121
(2013). http://dx.doi.org/10.1038/jcbfm.2012.143 JCBMDN 0271-678X Google Scholar
K. H. Herrmannet al.,
“Possibilities and limitations for high resolution small animal MRI on a clinical whole-body 3T scanner,”
Magn. Reson. Mater. Phys. Biol. Med., 25
(3), 233
–244
(2012). http://dx.doi.org/10.1007/s10334-011-0284-5 MRBMEQ 1352-8661 Google Scholar
M. XuL. V. Wang,
“Photoacoustic imaging in biomedicine,”
Rev. Sci. Instrum., 77
(4), 041101
(2006). http://dx.doi.org/10.1063/1.2195024 RSINAK 0034-6748 Google Scholar
V. TsytsarevC. BernardelliK. I. Maslov,
“Living brain optical imaging: technology, methods and applications,”
J. Neurosci. Neuroeng., 1
(2), 180
–192
(2012). http://dx.doi.org/10.1166/jnsne.2012.1020 2168-2011 Google Scholar
X. Wanget al.,
“Noninvasive laser-induced photoacoustic tomography for structural and functional in vivo imaging of the brain,”
Nat. Biotechnol., 21
(7), 803
–806
(2003). http://dx.doi.org/10.1038/nbt839 NABIF9 1087-0156 Google Scholar
L.-D. Liaoet al.,
“Neurovascular coupling: in vivo optical techniques for functional brain imaging,”
Biomed. Eng. Online, 12
(2013). Google Scholar
H. F. Zhanget al.,
“Functional photoacoustic microscopy for high-resolution and noninvasive in vivo imaging,”
Nat. Biotechnol., 24 848
–851
(2006). http://dx.doi.org/10.1038/nbt1220 NABIF9 1087-0156 Google Scholar
S. A. Ermilovet al.,
“Laser optoacoustic imaging system for detection of breast cancer,”
J. Biomed. Opt., 14
(2), 024007
(2009). http://dx.doi.org/10.1117/1.3086616 JBOPFO 1083-3668 Google Scholar
H. F. ZhangK. MaslovL. V. Wang,
“In vivo imaging of subcutaneous structures using functional photoacoustic microscopy,”
Nat. Protocol, 2 797
–804
(2007). http://dx.doi.org/10.1038/nprot.2007.108 NPARDW 1754-2189 Google Scholar
L. D. Liaoet al.,
“Transcranial imaging of functional cerebral hemodynamic changes in single blood vessels using in vivo photoacoustic microscopy,”
J. Cereb. Blood Flow Metab., 32
(6), 938
–951
(2012). http://dx.doi.org/10.1038/jcbfm.2012.42 JCBMDN 0271-678X Google Scholar
L.-D. Liaoet al.,
“Investigation of the cerebral hemodynamic response function in single blood vessels by functional photoacoustic microscopy,”
J. Biomed. Opt., 17
(6), 061210
(2012). http://dx.doi.org/10.1117/1.JBO.17.6.061210 JBOPFO 1083-3668 Google Scholar
S. HuL. V. Wang,
“Neurovascular photoacoustic tomography,”
Front. Neuroenerg., 2 12
(2010). http://dx.doi.org/10.3389/fnene.2010.00010 FNREJG 1662-6427 Google Scholar
L. V. Wang,
“Multiscale photoacoustic microscopy and computed tomography,”
Nat. Photonics, 3 503
–509
(2009). http://dx.doi.org/10.1038/nphoton.2009.157 1749-4885 Google Scholar
L. D. Liaoet al.,
“Imaging brain hemodynamic changes during rat forepaw electrical stimulation using functional photoacoustic microscopy,”
Neuroimage, 52
(2), 562
–570
(2010). http://dx.doi.org/10.1016/j.neuroimage.2010.03.065 NEIMEF 1053-8119 Google Scholar
T. H. Sandersonet al.,
“Molecular mechanisms of ischemia-reperfusion injury in brain: pivotal role of the mitochondrial membrane potential in reactive oxygen species generation,”
Mol. Neurobiol., 47
(1), 9
–23
(2013). http://dx.doi.org/10.1007/s12035-012-8344-z MONBEW 0893-7648 Google Scholar
L. D. Liaoet al.,
“Study of neurovascular coupling functions for transient focal cerebral ischemia in rats using electrocorticography functional photoacoustic microscopy (ECoG-fPAM),”
in Conf. Proc. IEEE Engineering in Medicine & Biology Society,
1799
–802
(2013). Google Scholar
L. D. Liaoet al.,
“Imaging of temperature dependent hemodynamics in the rat sciatic nerve by functional photoacoustic microscopy,”
Biomed. Eng. Online, 12 120
(2013). http://dx.doi.org/10.1186/1475-925X-12-120 1475-925X Google Scholar
C. G. Markgrafet al.,
“Comparative histopathologic consequences of photothrombotic occlusion of the distal middle cerebral artery in Sprague-Dawley and Wistar rats,”
Stroke, 24
(2), 286
–292
(1993). http://dx.doi.org/10.1161/01.STR.24.2.286 SJCCA7 0039-2499 Google Scholar
A. SiglerA. GoroshkovT. H. Murphy,
“Hardware and methodology for targeting single brain arterioles for photothrombotic stroke on an upright microscope,”
J. Neurosci. Methods, 170
(1), 35
–44
(2008). http://dx.doi.org/10.1016/j.jneumeth.2007.12.015 JNMEDT 0165-0270 Google Scholar
G. PaxinosC. Watson, The Rat Brain in Stereotaxic Coordinates, Academic Press, San Diego
(2007). Google Scholar
H. Nakaseet al,
“Use of local cerebral blood flow monitoring to predict brain damage after disturbance to the venous circulation: cortical vein occlusion model by photochemical dye,”
Neurosurgery, 37
(2), 280
–285
(1995). http://dx.doi.org/10.1227/00006123-199508000-00013 0148-396X Google Scholar
B. D. Watsonet al.,
“Induction of reproducible brain infarction by photochemically initiated thrombosis,”
Ann. Neurol., 17
(5), 497
–504
(1985). http://dx.doi.org/10.1002/(ISSN)1531-8249 ANNED3 0364-5134 Google Scholar
S. Roston,
“The blood flow of the brain,”
Bull. Math. Biophys., 29
(3), 541
–548
(1967). http://dx.doi.org/10.1007/BF02476591 BMBIAO 0007-4985 Google Scholar
L. Liet al.,
“Photoacoustic imaging of lacZ gene expression in vivo,”
J. Biomed. Opt., 12
(2), 020504
(2007). http://dx.doi.org/10.1117/1.2717531 JBOPFO 1083-3668 Google Scholar
C. C. Layet al.,
“Mild sensory stimulation completely protects the adult rodent cortex from ischemic stroke,”
PLoS One, 5
(6), e11270
(2010). http://dx.doi.org/10.1371/journal.pone.0011270 1932-6203 Google Scholar
C. B. Schafferet al.,
“All-optical thrombotic stroke model for near-surface blood vessels in rat: focal illumination of exogeneous photosensitizers combined with real-time two-photon imaging,”
High-Power Lasers Appl., 222
–231
(2003). https://doi.org/http//dx.doi.org/10.1117/12.484208 Google Scholar
D. KanekoN. NakamuraT. Ogawa,
“Cerebral infarction in rats using homologous blood emboli: development of a new experimental model,”
Stroke, 16
(1), 76
–84
(1985). http://dx.doi.org/10.1161/01.STR.16.1.76 SJCCA7 0039-2499 Google Scholar
S.-J. Zhanget al.,
“EEG patterns from acute to chronic stroke phases in focal cerebral ischemic rats: correlations with functional recovery,”
Physiol. Meas., 34
(4), 423
–435
(2013). http://dx.doi.org/10.1088/0967-3334/34/4/423 PMEAE3 0967-3334 Google Scholar
S. FinniganM. J. A. M. van Putten,
“EEG in ischaemic stroke: quantitative EEG can uniquely inform (sub-)acute prognoses and clinical management,”
Clin. Neurophysiol., 124
(1), 10
–19
(2013). http://dx.doi.org/10.1016/j.clinph.2012.07.003 CNEUFU 1388-2457 Google Scholar
A. Schlögl,
“A comparison of multivariate autoregressive estimators,”
Signal Process., 86
(9), 2426
–2429
(2006). http://dx.doi.org/10.1016/j.sigpro.2005.11.007 SPRODR 0165-1684 Google Scholar
G. Schwarz,
“Estimating dimension of a model,”
Ann. Statist., 6
(2), 461
–464
(1978). http://dx.doi.org/10.1214/aos/1176344136 ASTSC7 0090-5364 Google Scholar
A. SchlöglG. Supp,
“Analyzing event-related EEG data with multivariate autoregressive parameters,”
Prog. Brain Res., 159 135
–147
(2006). http://dx.doi.org/10.1016/S0079-6123(06)59009-0 PBRRA4 0079-6123 Google Scholar
M. R. NuwerS. E. JordanS. S. Ahn,
“Evaluation of stroke using EEG frequency analysis and topographic mapping,”
Neurology, 37
(7), 1153
–1159
(1987). http://dx.doi.org/10.1212/WNL.37.7.1153 NEURAI 0028-3878 Google Scholar
K. Sainioet al.,
“Visual and spectral EEG analysis in the evaluation of the outcome in patients with ischemic brain infarction,”
Electroencephalogr. Clin. Neurophysiol., 56
(2), 117
–124
(1983). http://dx.doi.org/10.1016/0013-4694(83)90066-4 ECNEAZ 0013-4694 Google Scholar
G. Nolteet al.,
“Identifying true brain interaction from EEG data using the imaginary part of coherency,”
Clin. Neurophysiol., 115
(10), 2292
–2307
(2004). http://dx.doi.org/10.1016/j.clinph.2004.04.029 CNEUFU 1388-2457 Google Scholar
J. Claassenet al.,
“Quantitative continuous EEG for detecting delayed cerebral ischemia in patients with poor-grade subarachnoid hemorrhage,”
Clin. Neurophysiol., 115
(12), 2699
–2710
(2004). http://dx.doi.org/10.1016/j.clinph.2004.06.017 CNEUFU 1388-2457 Google Scholar
L.-D. Liaoet al.,
“Reversibility of cortical functions during acute ischemic stroke via sensorimotor stimulation,”
in IEEE Life Sciences Grand Challenges Conference,
(2013). Google Scholar
H. Y. Laiet al.,
“Design, simulation and experimental validation of a novel flexible neural probe for deep brain stimulation and multichannel recording,”
J. Neural Eng., 9
(3), 036001
(2012). http://dx.doi.org/10.1088/1741-2560/9/3/036001 1741-2560 Google Scholar
W. B. Bakeret al.,
“Neurovascular coupling varies with level of global cerebral ischemia in a rat model,”
J. Cereb. Blood Flow Metab., 33
(1), 97
–105
(2013). http://dx.doi.org/10.1038/jcbfm.2012.137 JCBMDN 0271-678X Google Scholar
W. Luoet al.,
“Tracing collateral circulation after ischemia in rat cortex by laser speckle imaging,”
J. Innovative Opt. Health Sci., 1
(02), 217
–226
(2008). http://dx.doi.org/10.1142/S1793545808000121 1793-5458 Google Scholar
A. Shuaibet al.,
“Collateral blood vessels in acute ischaemic stroke: a potential therapeutic target,”
Lancet Neurol., 10
(10), 909
–921
(2011). http://dx.doi.org/10.1016/S1474-4422(11)70195-8 LNAEAM 1474-4422 Google Scholar
M. H. MohajeraniK. AminoltejariT. H. Murphy,
“Targeted mini-strokes produce changes in interhemispheric sensory signal processing that are indicative of disinhibition within minutes,”
Proc. Natl Acad. Sci. USA, 108
(22), E183
–E1891
(2011). http://dx.doi.org/10.1073/pnas.1101914108 PNASA6 0027-8424 Google Scholar
T. H. MurphyD. Corbett,
“Plasticity during stroke recovery: from synapse to behaviour,”
Nat. Rev. Neurosci., 10
(12), 861
–872
(2009). http://dx.doi.org/10.1038/nrn2735 NRNAAN 1471-0048 Google Scholar
J. ArmandH. G. Kuypers,
“Cells of origin of crossed and uncrossed corticospinal fibers in the cat: a quantitative horseradish peroxidase study,”
Exp. Brain Res., 40
(1), 23
–34
(1980). http://dx.doi.org/10.1007/BF00236659 EXBRAP 0014-4819 Google Scholar
R. D. JonesI. M. DonaldsonP. J. Parkin,
“Impairment and recovery of ipsilateral sensory-motor function following unilateral cerebral infarction,”
Brain, 112
(1), 113
–132
(1989). http://dx.doi.org/10.1093/brain/112.1.113 BRAIAK 0006-8950 Google Scholar
C. L. Gonzalezet al.,
“Evidence for bilateral control of skilled movements: ipsilateral skilled forelimb reaching deficits and functional recovery in rats follow motor cortex and lateral frontal cortex lesions,”
Eur. J. Neurosci., 20
(12), 3442
–3452
(2004). http://dx.doi.org/10.1111/j.1460-9568.2004.03751.x EJONEI 0953-816X Google Scholar
T. H. Murphyet al.,
“Two-photon imaging of stroke onset in vivo reveals that NMDA-receptor independent ischemic depolarization is the major cause of rapid reversible damage to dendrites and spines,”
J. Neurosci., 28
(7), 1756
–1772
(2008). http://dx.doi.org/10.1523/JNEUROSCI.5128-07.2008 JNRSDS 0270-6474 Google Scholar
E. Smitset al.,
“Synaptic potentials evoked by convergent somatosensory and corticocortical inputs in raccoon somatosensory cortex: substrates for plasticity,”
J. Neurophysiol., 66
(3), 688
–695
(1991). JONEA4 0022-3077 Google Scholar
V. L. EzrokhinL. S. Grechushnikova,
“Elementary transcallosal connections of the rabbit sensomotor cortex,”
Zh Vyssh Nerv Deiat Im I P Pavlova, 29
(5), 1042
–1051
(1979). Google Scholar
P. BarbaresiA. MinelliT. Manzoni,
“Topographical relations between ipsilateral cortical afferents and callosal neurons in the second somatic sensory area of cats,”
J. Comp. Neurol., 343
(4), 582
–596
(1994). http://dx.doi.org/10.1002/cne.903430408 JCNEAM 0021-9967 Google Scholar
T. Manzoni,
“The callosal connections of the hierarchically organized somatosensory areas of primates,”
J. Neurosurg. Sci., 41
(1), 1
–22
(1997). http://dx.doi.org/10.1097/00006123-199707000-00004 0390-5616 Google Scholar
M. Fabriet al.,
“Role of the corpus callosum in the somatosensory activation of the ipsilateral cerebral cortex: an fMRI study of callosotomized patients,”
Euro. J. Neurosci., 11
(11), 3983
–3994
(1999). http://dx.doi.org/10.1046/j.1460-9568.1999.00829.x EJONEI 0953-816X Google Scholar
B. U. MeyerS. RorichtC. Woiciechowsky,
“Topography of fibers in the human corpus callosum mediating interhemispheric inhibition between the motor cortices,”
Ann. Neurol., 43
(3), 360
–369
(1998). http://dx.doi.org/10.1002/(ISSN)1531-8249 ANNED3 0364-5134 Google Scholar
D. Centonzeet al.,
“Synaptic plasticity during recovery from permanent occlusion of the middle cerebral artery,”
Neurobiol. Dis., 27
(1), 44
–53
(2007). http://dx.doi.org/10.1016/j.nbd.2007.03.012 NUDIEM 0969-9961 Google Scholar
K. Schieneet al.,
“Neuronal hyperexcitability and reduction of GABAA-receptor expression in the surround of cerebral photothrombosis,”
J. Cereb. Blood Flow Metab., 16
(5), 906
–914
(1996). http://dx.doi.org/10.1097/00004647-199609000-00014 JCBMDN 0271-678X Google Scholar
R. M. Dijkhuizenet al.,
“Correlation between brain reorganization, ischemic damage, and neurologic status after transient focal cerebral ischemia in rats: a functional magnetic resonance imaging study,”
J. Neurosci., 23
(2), 510
–517
(2003). JNRSDS 0270-6474 Google Scholar
BiographyLun-De Liao received his PhD degree in electrical engineering from National Chiao Tung University (NCTU), Taiwan, in February of 2012. He was a postdoctoral researcher at the Brain Research Center (BRC) in NCTU. He is currently a senior research scientist and head of the Neurovascular Imaging Laboratory in Singapore Institute for Neurotechnology (SINAPSE) at National University of Singapore. He has published over 45 peer-reviewed SCI journal papers and 12 issued patents. He currently serves as editor-in-chief of the Journal of Neuroscience and Neuroengineering. His research interests include neuroimaging, cerebral neuroscience and experimental neuroscience. Aishwarya Bandla is a graduate student at the National University of Singapore, pursuing her Master of Engineering (by research) in biomedical engineering. She received her BE degree (first class honors) in electrical and electronics engineering (2009) from Anna University, Chennai, India. Her research interests include neural signal processing, electrophysiology, neurovascular coupling studies, and neuroengineering. Ji Min Ling is a registrar from the Department of Neurosurgery, National Neuroscience Institute, Singapore. He graduated with MBChB from Dundee University in Scotland in 2005. His research is focused on advancing neurosurgery with medical technology. His previous works involved telemedicine in neurosurgery, intraoperative computed tomography (ICT), and intraoperatively magnetic resonance imaging (MRI). He is now an adjunct fellow in SINAPSE, working closely with researchers in SINAPSE to investigate the utility of photoacoustic imaging in neurosurgery. Yu-Hang Liu is currently pursuing a PhD degree in electrical and computer engineering at National University of Singapore. He received his BS degree from National Central University, Taiwan, in electrical engineering (2008) and MS degree from National Chiao Tung University, Taiwan, in biomedical engineering (2010). Neurovascular function, brain optical imaging, neural signal processing, and embedded system design of biomedical application are his main research interests. Li-Wei Kuo received his PhD degree in electrical engineering from National Taiwan University, Taiwan, in 2008. He conducted his postdoctoral research in the Center for Optoelectronic Biomedicine at National Taiwan University College of Medicine and the advanced MRI section at the Laboratory of Functional and Molecular Imaging in National Institute of Neurological Disorders and Stroke at NIH in 2009 and 2010, respectively. Since 2011, he has joined the Division of Medical Engineering Research at National Health Research Institutes in Taiwan as an assistant investigator and led the MR NeuroImaging Lab. His research interests include MR neuroimaging techniques, brain connectivity analysis, and development of fast imaging sequence and system hardware. You-Yin Chen is an associate professor of the Department of Biomedical Engineering at National Yang Ming University. He has developed new implanted microelectronics for neural signal analysis and processing techniques for studying the unknown aspects of neural coding and functional neurophysiology. He directs his lab for brain−machine interface and deep brain stimulation in animals studying the activity of single neurons, local field potentials, and electrocorticogram in the cerebral cortex and from deep brain structures. Nicolas KK King is an associate consultant at the National Neuroscience Institute, Singapore. He graduated with a bachelor of medicine and surgery from the University of Sheffield, UK, and obtained his PhD from Imperial College London, UK, where he investigated the modulation of cortical plasticity. He was awarded his specialist degree in neurosurgery (FRCS) after completing his neurosurgical training at the National Neuroscience Institute, Singapore. Hsin-Yi Lai received her PhD degree in electrical control engineering from National Chiao Tung University, Taiwan, in 2011. She is currently the postdoctoral research fellow of Chang Gung University and Chang Gung Memorial Hospital, Taiwan. His research interests include neural implant, neural information processing system, animal functional neuroimage, and neural coding in the somatosensory system. Her long-term goal is to adopt engineering principles for the understanding and treatment of neurological diseases. Yan-Ren Lin is an attending physician and senior consultant in the emergency department of Changhua Christian Hospital (CCH) (2500-bed medical center in Taiwan). At CCH, he leads the Laboratory of Emergency Medicine and researches many basic/clinical projects. He is an official committee member of Taiwan Society of Emergency Medicine and also an editor for the Journal of Acute Medicine, World Journal of Critical Care Medicine, and Journal of Neuroscience and Neuroengineering. Nitish V. Thakor is a professor of biomedical engineering at Johns Hopkins and also the director of the Singapore Institute for Neurotechnology (SINAPSE) at the National University of Singapore. His expertise is in the field of neurotechnology and medical instrumentation. He is a fellow of the American Institute of Medical, Biological Engineering, IEEE, a founding fellow of BMES, and a fellow of the International Federation of Medical, Biological Engineering, and editor in chief of Medical and Biological Engineering and Computing. |


