
|
|
1.IntroductionAttention deficit hyperactivity disorder (ADHD) is one of the most common psychiatric disorders of childhood, with a prevalence rate of 3 to 7%.1 The behavioral phenotype of ADHD is characterized by inattention, impulsivity, and hyperactivity. These primary symptoms can usually be identified in ADHD children during early elementary school years.2 ADHD is not limited to childhood, and one third to one half of cases are estimated to extend into adolescence and adulthood.3 Furthermore, ADHD children often develop comorbidities, including antisocial behavior, substance abuse, and a variety of problems associated with conduct and learning later in life.4,5 Therefore, early identification and appropriate treatment is important in order to increase the present and future quality of life of ADHD school-aged children.6 Treatment with medication as well as behavioral therapy are recommended in all ADHD clinical guidelines for ADHD children.7–9 In addition, the multimodal treatment of ADHD (MTA) study funded by the National Institutes of Health (1999) and the American Academy of Pediatrics (AAP) reported that medication treatment was superior to behavioral therapy for school-aged children.10 According to considerable evidence for medication treatment over several decades, the administration of psychostimulants, such as methylphenidate (MPH),11 has been recommended to improve ADHD symptoms.12 In order to confirm the effectiveness of medication treatment, a pharmacological biomarker would be of great use. However, current evaluation methods for ADHD treatment depend on assessment of the degrees of the symptoms listed in the diagnostic criteria. Interview-based measurement requires rating by the parents or teachers of the children and, thus, often entails subjective evaluation. Due to such technical limitations, the more objective approach of using a biological marker to verify effectiveness is desirable in order to supplement the current interview-based evaluation method.5,13 One promising approach to establishing biomarkers for ADHD symptoms is noninvasive functional neuroimaging. A growing body of neuroimaging research has started to explore the neural substrates associated with ADHD. Former functional magnetic resonance imaging (fMRI) studies successfully elucidated neural substrates for ADHD using motor response inhibition tasks, including go/no-go, stop signal, and Stroop tasks. These studies have revealed less prefrontal brain activation before medication compared with control groups, and that this reduced activation is normalized in ADHD subjects after taking MPH.14–18 Functional near-infrared spectroscopy (fNIRS) offers robust advantages, such as its compactness (useful in confined experimental settings), affordable price, tolerance to body motion, and accessibility, which have made it applicable for clinical assessment of ADHD children.19–23 Making the best use of the merits of fNIRS, we first reported the clinical feasibility of fNIRS-based assessment on the effects of MPH medication in young ADHD children.24 In a subsequent study, we reported the pharmacological effects of MPH in a randomized, double-blind, placebo-controlled, crossover design using fNIRS methods. In accordance with former fMRI studies, MPH modulated hemodynamic responses in the right prefrontal cortex during a go/no-go task, while a placebo did not.25 While our former studies focused on the effects of inhibitory functions reflected in go/no-go task performance, inhibition alone is insufficient for explaining the overall mechanism of ADHD for the following reasons. First, currently, several groups have reported that children with ADHD may not always develop hyperactive and frenetic behavior; rather, some are more characterized with hypoactivity, sluggishness, and slow response.26 Second, inattention is considered to represent a distinct neurofunctional impairment in ADHD. Several neuroimaging studies have suggested that ADHD patients who mainly suffer from inattention tend to exhibit dysfunction of the frontal-parietal network, which has been implicated as one of the main neuronetworks for attention (e.g., Refs. 2728. to 29). However, ADHD patients with both inhibition and attention deficit would exhibit dysfunction of the dopamine system in the prefrontal cortex innervating from the ventral tegmentum (mesocortical pathway) (e.g., Refs. 3031. to 32). Thus, more neurocognitive and pharmacological data for attention function is necessary in order to clarify the pathophysiology of ADHD as well as to set neuropharmacological biomarkers. To date, only two fMRI studies have performed neuropharmacological assessments of ADHD children during attention tasks, both utilizing a double-blind, placebo-controlled design.33,34 They investigated the neural correlates for the effects of MPH associated with selective and divided attention for 15 adolescents with ADHD (ages 14 to 17) and 14 healthy comparison subjects (ages 12 to 20) without MPH administration. The divided attention task evoked significantly less activation in the left ventral basal ganglia and the middle temporal gyrus in unmedicated ADHD subjects than in the healthy comparison subjects. Administration of MPH to ADHD subjects normalized activation of the left ventral basal ganglia, while no effect was observed for the middle temporal gyrus. Rubia et al. examined the effects of MPH on medication-naïve children with ADHD during a continuous performance task enrolling 13 right-handed male adolescent boys (10 to 15 years).34 Under the placebo condition, ADHD children exhibited reduced activation and functional interconnectivity in the bilateral fronto-striato-parieto-cerebellar networks, which were normalized upon medication with MPH. However, the participants of these fMRI studies have been limited to adolescents years. To establish early diagnosis for elementary-school-aged children, introduction of fNIRS diagnosis focusing on attentional function would be beneficial. Thus, to explore the neural substrate for MPH effects on attentional control in school-aged ADHD children, we conducted the current fNIRS study enrolling 22 school-aged ADHD children (mean age 9.5 years, SD 2.0, range 6 to 14 years) and age- and sex-matched control subjects (mean age 9.8 years, SD 2.0, range 6 to 13 years). Particularly, we focused on the roles of the prefrontal and inferior parietal cortices in the fronto-striato-parieto-cerebellar attention networks. We first explored the neural substrates for attention associated with ADHD across fNIRS data of ADHD and healthy control subjects. Subsequently, utilizing a within-subject, double-blind, placebo design, we examined the pharmacological effects of MPH on the cortical hemodynamics of ADHD children during an oddball task, which is expected to reflect attentional control. The main aim of the current study was to test the following three research questions. First, is there less activation in the prefrontal and inferior parietal cortices in ADHD children than in control subjects? Second, if so, can this be normalized with MPH? Third, as an extension of the second question, is such normalization symmetric between the two regions or asymmetric, normalizing just one component? Considering these questions together, we explore the feasibility of introducing a wider spectrum of fNIRS-based diagnosis of the effects of MPH administration on ADHD children. 2.Methods2.1.SubjectsTwenty-two clinically referred, right-handed Japanese children with a mean age of 9.5 years (SD 2.0, range 6 to 14 years) who met the Diagnostic and Statistical Manual of Mental Disorders-IV criteria for ADHD participated in the study (Table 1). The Wechsler Intelligence Scale of Children-third edition full intelligence quotient (IQ) scores of subjects were all (mean 94.4, SD 11.7, range 75 to 121). Demographic and clinical characteristics of the patients are described in Table 1. The subjects had been taking MPH (18 to ) for between 1 week and 5 years. Doses of the drug were adjusted depending on symptomatic responses. Table 1Demographic and clinical profiles for attention deficit hyperactivity disorder (ADHD) subjects.
Note: MPH, methylphenidate; WISC-III, Wechsler Intelligence Scale of Children-third edition; IQ, intelligence quotient; SD, standard deviation; ASD, autism spectrum disorders. Twenty-two right-handed control subjects were matched with the ADHD subjects according to age (mean 9.8 years, SD 2.0, range 6 to 13 years) and gender (15 boys and 7 girls). IQs of control subjects (mean 108.0, SD 11.4, range 90 to 128) were significantly (, ) higher than those of ADHD subjects. Written consent was obtained from the parents of all subjects. The study was approved by the Ethics Committees of Jichi Medical University Hospital and the International University of Health and Welfare. The study was in accordance with the latest version of the Declaration of Helsinki. This study was registered to the University Hospital Medical Information Network Clinical Trials Registry (UMIN-CTR; UMIN000008831) as “Neurophysiological analysis of ADHD: an exploratory neuroimaging study using functional near-infrared spectroscopy (fNIRS).” 2.2.Experimental DesignA visual-based oddball task was adopted to represent measures of attention. The task includes detection and response to infrequent (oddball) target events included in a series of repetitive events. This type of task has also been referred to as a response selection task.35 The effects of MPH while the subjects performed oddball tasks were examined in a randomized, double-blind, placebo-controlled, crossover study. Experimental procedure is summarized in Fig. 1. Fig. 1Experimental design. A schematic showing the flow of pre- and postmedication administration sessions for attention deficit hyperactivity disorder (ADHD) subjects. Functional near-infrared spectroscopy (fNIRS) measurements. Brain activity was measured while ADHD and control subjects performed the oddball task. 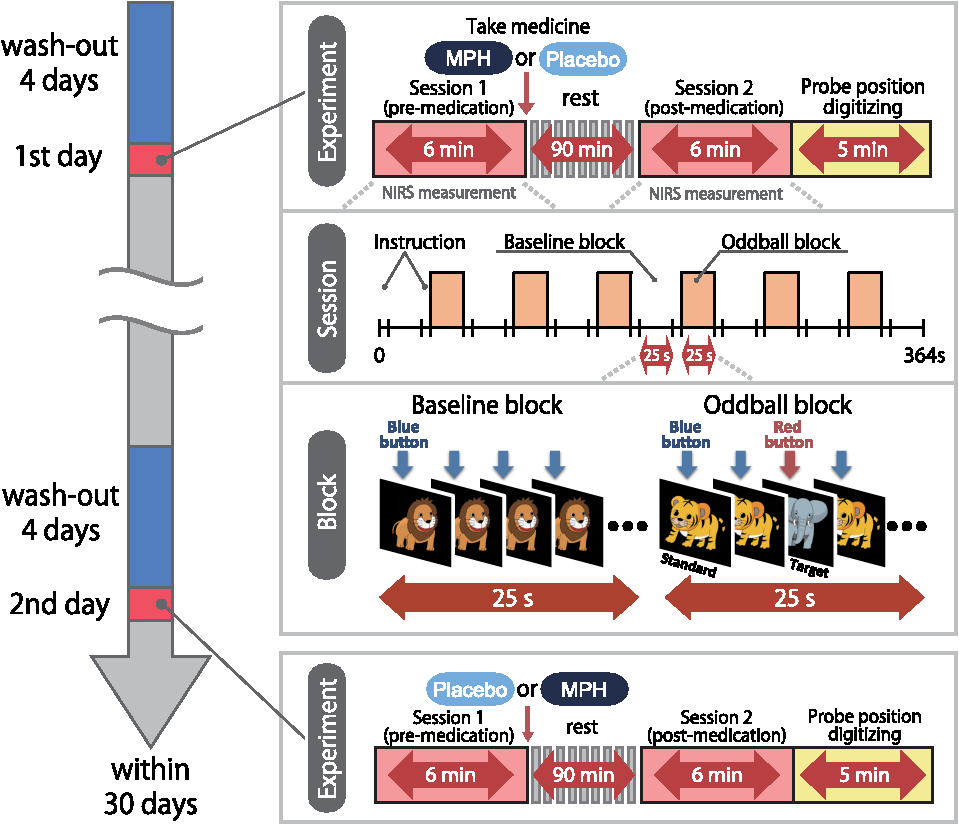 ADHD subjects were examined twice (the times of day for both measurements were scheduled to be as close as possible), at least 4 days apart, but within 30 days. On each examination day, ADHD subjects underwent two sessions, one before drug (MPH or placebo) administration and the other at 1.5 h after drug administration. Subjects were allowed to take off the probe during the waiting period between the first and second measurements. After ADHD subjects performed the first session, either MPH [Osmotic release oral system-MPH (OROS-MPH) commercially available as Concerta] or a placebo was administered orally. Specific acute doses were the same as the patient’s daily dose as described in Table 1. MPH has proved to have a predictable rapid onset (1 to 2 h) and a long efficacy (10 to 12 h) after a single administration.36 A minimum waiting period of 1 h has been adopted in former neuroimaging examinations of acute MPH effects.37,38 On the other hand, a sufficient waiting period of 2 h is technically desirable, but its clinical implementation is often difficult. To balance these factors, we set the waiting period to 1.5 h as in our former reports.24,25 Control subjects only underwent a premedication session. During the session, subjects viewed a series of pictures once every second and responded with a key press to every picture. In the baseline block, subjects were presented one picture and asked to press a blue button on a response box for that picture. Following the baseline block, tiger (standard stimulus, 80% of trials) or elephant (target stimulus, 20% of trials) pictures were presented sequentially for 200 ms with an interstimulus interval of 800 ms. The total number of trials was 325, which were presented in a single run. Participants were instructed to respond to the standard stimuli (tiger) by pressing a blue button on the response box and to target stimuli (elephant) by pressing a red button, located next to the blue button, on the response box. Specifically, the instructions read (in Japanese), “for this task, the computer will show you tigers and elephants. Your job is to press blue for tiger or press red for elephant, as quickly as you can. Remember you want to be prompt but also accurate, so do not go too fast.” Participants responded using the forefinger of their right hand. At the beginning of each block, instructions (e.g., “press blue button” for the baseline task and “press blue button for tiger and red button for elephant” for the oddball task) appeared for 3 s to inform the subject of the new block. Each subject performed a practice block before all measurements to ensure their understanding of the instructions. Each session consisted of six block sets, each containing alternating baseline and oddball blocks. Each block lasted 25 s and was preceded by instructions displayed for 3 s, giving an overall block-set time of 56 s and a total session time of 6.0 min. To diminish habituation, four versions with different picture and button combinations were made: red button in baseline blocks and elephant-red button/tiger-blue button (target stimulus/standard stimulus) in oddball blocks (version 1), red button in baseline blocks and tiger-red button/elephant-blue button (target stimulus/standard stimulus) in oddball blocks (version 2), blue button in baseline blocks and elephant-red button/tiger-blue button (target stimulus/standard stimulus) in oddball blocks (version 3), and blue button in baseline blocks and tiger-red button/elephant-blue button (target stimulus/standard stimulus) in oddball blocks (version 4). These four versions were randomly assigned for MPH and placebo conditions. A target versus standard ratio of was selected so as to maintain consistency with former neuroimaging studies.39–51 Stimuli were generated, and responses were collected by E-Prime 2.0 (Psychology Software Tools). Stimuli were presented to the subject on a 17-in. desktop computer screen. The distance between the subject’s eyes and the screen was . 2.3.Behavioral Data AnalysisThe average reaction times (RTs), coefficients of variation (CVs) for accuracy rates of correct trials, omission error rates and commission error rates, and their standard deviations (SDs), were computed for target and standard trials, respectively, in the oddball block for control and ADHD subjects. Mean RT for each participant was calculated by averaging RTs for correct target and standard trials, respectively. Standard deviation of RT (RT-SD) was derived by calculating the SD of each individual’s RTs for correct target and standard trials, respectively. CV for each subject was computed by dividing the RT-SD by the mean RT for target and standard trials, respectively. Commission error rates were computed by dividing the number of commission errors (i.e., subjects pushed the incorrect button) by the total number of target and standard trials, respectively. Omission error rates were computed by dividing the number of omission errors (i.e., subjects failed to push any button) by the total number of target and standard trials, respectively. Accuracy rates were computed by dividing the number of correct trials (i.e., subjects pushed the correct button) by the number of total target and standard trials, respectively. Statistical threshold was set at with the Bonferroni method for multiple-comparison error correction (i.e., significant was ). 2.4.fNIRS MeasurementsWe used the multichannel fNIRS system ETG-4000 (Hitachi Medical Corporation, Kashiwa, Japan), using two wavelengths of near-infrared light (695 and 830 nm). We analyzed the optical data based on the modified Beer-Lambert law52 as previously described.53 This method allowed us to calculate signals reflecting the oxygenated hemoglobin (oxy-Hb), deoxygenated hemoglobin (deoxy-Hb), and total hemoglobin signal changes, calculated in units of millimolar-millimeters.53 We set the fNIRS probes to cover the lateral prefrontal cortices and inferior parietal lobe in reference to previous studies.54–58 Specifically, we used two sets of multichannel probe holders, consisting of eight illuminating and seven detecting probes arranged alternately at an interprobe distance of 3 cm, resulting in 22 channels (CH) per set (Fig. 2). Fig. 2Spatial profiles of fNIRS channels. Left and right side views [(a) and (b)] of the probe arrangements are exhibited with fNIRS channel orientation. Detectors are indicated with blue circles, illuminators with red circles, and channels with white squares. Corresponding channel numbers are shown in black. Channel locations on the brain are exhibited for both left and right side views [(c) and (d)]. Probabilistically estimated fNIRS channel locations (centers of blue circles) for control and ADHD subjects, and their spatial variability (standard deviations, radii of the blue circles) associated with the estimation are depicted in Montreal Neurological Institute (MNI) space. 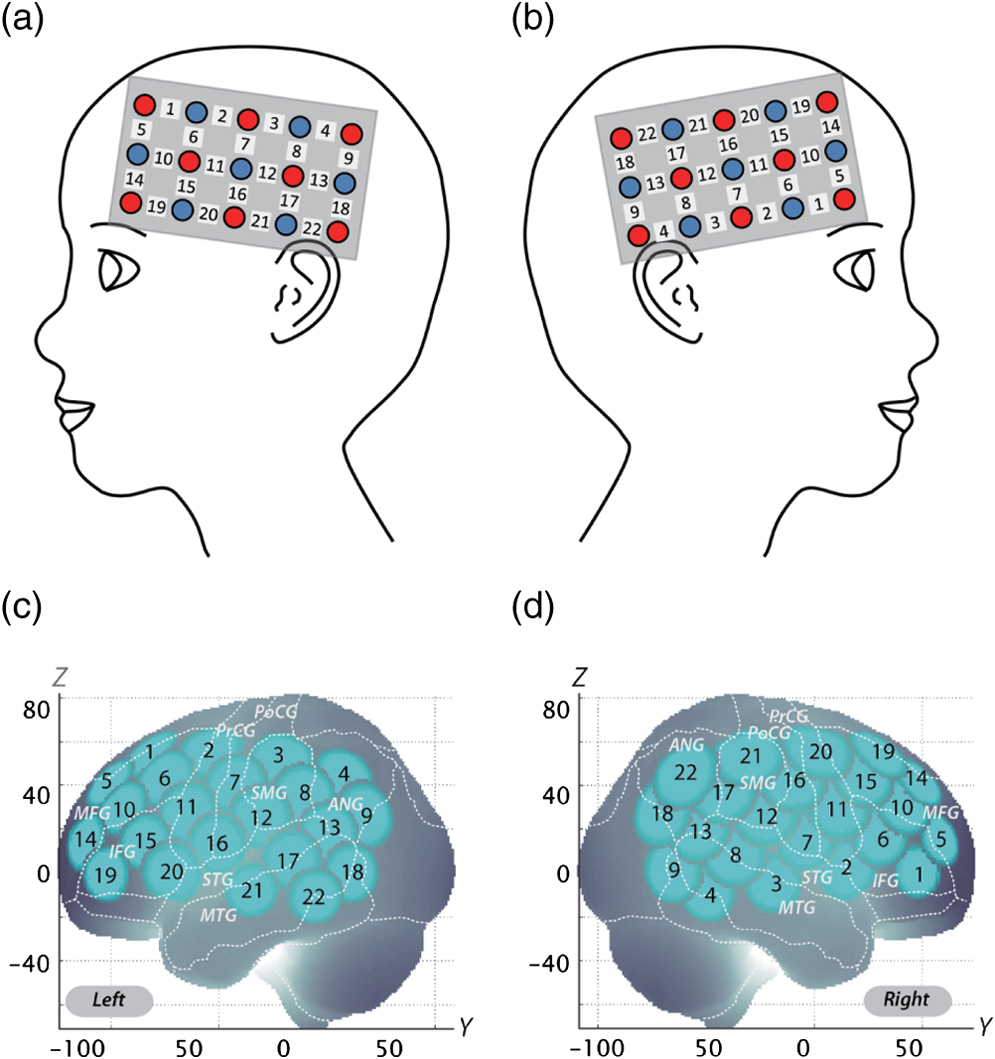 The midpoint of a pair of illuminating and detecting probes was defined as a channel location. The bilateral probe holders were attached in the following manner: (1) their upper anterior corners, where the left and right probe holders were connected by a belt, were symmetrically placed across the sagittal midline; (2) the lower anterior corners of the probe holder were placed over the supraorbital prominence;59 the lower edges of the probe holders were attached at the upper part of the auricles (Fig. 2). For spatial profiling of fNIRS data, we employed virtual registration60,61 to register fNIRS data to Montreal Neurological Institute (MNI) standard brain space.62 Briefly, this method allows us to place a virtual probe holder on the scalp by simulating the holder’s deformation and by registering probes and channels onto reference brains in an MRI database.63,64 Specifically, the positions for channels and reference points, which consisted of the Nz (nasion), Cz, and left and right preauricular points, are measured using a three-dimensional digitizer in real-world (RW) space. Each RW reference point is affine-transformed to the corresponding MRI-database reference point and converted to MNI space. Adopting the same transformation parameters, we obtained the MNI coordinate values for the fNIRS channels to obtain the most likely estimate of the location of given channels for the group of subjects and the spatial variability associated with the estimation65 (Table 2). Finally, we anatomically labeled the estimated locations using a MATLAB® function that reads anatomical labeling information coded in a macroanatomical brain atlas (LBPA4066 and Brodmann67). Table 2Spatial profiles of the channels screened for involvement with oddball tasks.
Data for CH 10 and CH 22 of the right hemisphere. For MNI coordinates, the most likely values are presented with standard deviation (SD) in units of mm. Macroanatomical estimation is based on LBPA40.66 Brodmann area estimation is based on MRIcro.67 SD, standard deviation; Prob, probability. 2.5.Analysis of NIRS DataIndividual timeline data for the oxy-Hb and deoxy-Hb signals of each channel were preprocessed with a first-degree polynomial fitting and high-pass filter using cutoff frequencies of 0.01 Hz to remove baseline drift, and a 0.8-Hz low-pass filter to remove heartbeat pulsations. Hb signals analyzed in the current study do not directly represent cortical Hb concentration changes, but contain an unknown optical path length that cannot be measured. Since optical path length is known to vary among cortical regions,68 direct comparison of Hb signals among different channels and regions should be avoided. Therefore, we performed channel-wise statistical analyses. For the six oddball blocks, we monitored the motion of the subjects and removed the blocks with sudden, obvious, discontinuous noise. From the preprocessed time series data, we obtained channel-wise and subject-wise contrasts by calculating the intertrial mean of differences between the peak Hb signals (4 to 25 s after trial onset) and baseline (0 to 10 s before trial onset) periods. The contrasts obtained were subjected to second-level random effects group analyses. 2.6.Statistical AnalysesWe performed channel-wise statistical analyses on oxy-Hb signals. Specifically, for control subjects who were examined only once, the oddball versus baseline contrast of the session was generated. For ADHD subjects, the following contrasts were generated: (1) premedication contrasts: oddball versus baseline contrast of the premedication conditions (either placebo or MPH administration) for the first day exclusively; (2) postmedication contrasts: oddball versus baseline contrast of the postplacebo and post-MPH conditions; (3) intramedication contrasts: difference between post- and premedication contrasts for each medication (i.e., intraplacebo and intra-MPH contrasts); and (4) intermedication contrast: difference between intra-MPH and intraplacebo contrasts. To screen the channels involved in oddball tasks for control and ADHD contrasts (pre-/postplacebo and pre-/post-MPH conditions), oddball versus baseline contrasts were subjected to paired t-test (two-tails). Statistical threshold was set at 0.05 with the Bonferroni method for family-wise error correction. For thus-screened channels, comparisons between control and ADHD were performed for the following two ADHD contrasts: (1) postplacebo and (2) post-MPH. They were subjected to independent two-sample t-tests (two-tails) with a statistical threshold of . For examining medication effects on ADHD subjects, comparison between intra-MPH and intraplacebo (i.e., intermedication contrast) for thus-screened channels was subjected to paired t-test (two-tails) with a statistical threshold of . All statistical analyses were performed with PASW statistics (version 18 for Windows) (SPSS Inc., Chicago) software. 3.Results3.1.Behavioral PerformanceThe averages of accuracy rates, RTs, CVs for correct trials, omission error rates, and commission error rates for target and standard trials in the oddball block for control and ADHD subjects and ADHD intermedication (placebo versus MPH) comparison are summarized in Tables 3 and 4. Table 3Oddball task performance and functional data for control and ADHD subjects.
Performance data (RT for correct trials, CV for correct trials, commission error, omission error, accuracy) are presented for target and standard trial data from oddball blocks. Oxy-Hb data includes right CH 10. For ADHD subjects, data for postmedication of placebo and MPH are shown. t values, p values, and statistical significance were the results of t tests between control and each ADHD condition. SD, standard deviation; t, t value; p, p value. Statistical significances are presented as follows: *p<0.05 Bonferroni-corrected; **p<0.01 Bonferroni-corrected; and ns, not significant. Table 4ADHD intermedication (MPHpost-pre versus PLApost-pre) comparison.
Performance data (RT for correct trials, CV for correct trials, commission error, omission error, accuracy) are presented for target and standard trial data from oddball blocks. Data for intermedication comparison (i.e., MPHpost-pre versus PLApost-pre) are shown for ADHD subjects. Mean values were calculated by first subtracting the values of MPHpost-pre from those of PLApost-pre for each subject and then averaging the resulting values across subjects. SD was calculated similarly. t value and p value and statistical significance were the results of two-sample t-tests between MPHpost-pre and PLApost-pre. MPHpost-pre, difference between post- and pre-MPH; PLApost-pre, difference between post- and pre-placebo; SD, standard deviation; t, t value; p, p value. Statistical significances are presented as follows: *p<0.05; **p<0.01; and ns, not significant. No differences in accuracy rates for target trials were found between control and post-MPH ADHD subjects (Table 3). For within-ADHD-subject analysis, the intermedication contrast comparing the effect of MPH against the placebo revealed significant differences in CV and commission error rates for target trials (Table 4). 3.2.fNIRS AnalysesWe screened for any fNIRS channels involved in the oddball task in control and ADHD contrasts (pre-/postplacebo and pre-/post-MPH conditions; Fig. 3). Significant oxy-Hb increase was found in the right CH 10 (mean 0.059, SD 0.060, , Bonferroni-corrected Cohen’s ) and the right CH 22 (mean 0.056, SD 0.055, , Bonferroni-corrected Cohen’s ) in control subjects. Conversely, in ADHD conditions, only post-MPH showed significant oxy-Hb increase in the right CH 10 (mean 0.047, SD 0.053, , Bonferroni-corrected Cohen’s ). No significant oxy-Hb increase was found in the right CH 22 (mean 0.014, SD 0.104, , Bonferroni-corrected Cohen’s ) in ADHD subjects. Thus, we set the right CH 10 as a region of interest for the rest of the study. Fig. 3The channel location and waveforms of oxy-Hb (red line) and deoxy-Hb (blue line) signals for right CH 10 and right CH 22. The green area indicates the oddball task period. Significant (paired t test, ) conditions are indicated with asterisks. (a) On-brain channel locations (right hemisphere) are statistically estimated for the group of subjects and exhibited in MNI space. CH 10 and CH 22 are indicated in red. (b) Grand averages for control subjects. Standard deviations among the 22 subjects are exhibited as pale red (oxy-Hb) and blue dotted (deoxy-Hb) areas. Each timeline is adjusted to the average value for a baseline period of zero. Oxy-Hb and deoxy-Hb signals are shown in units of mM·mm. (c) Grand averages for ADHD subjects for pre-/post-placebo/methylphenidate (MPH) conditions are illustrated. (d) Graphs for ADHD individuals for pre-/post-placebo/MPH conditions. Subject 8 is a 6-year-old boy and subject 22 is a 7-year-old boy (corresponding to Table 1). 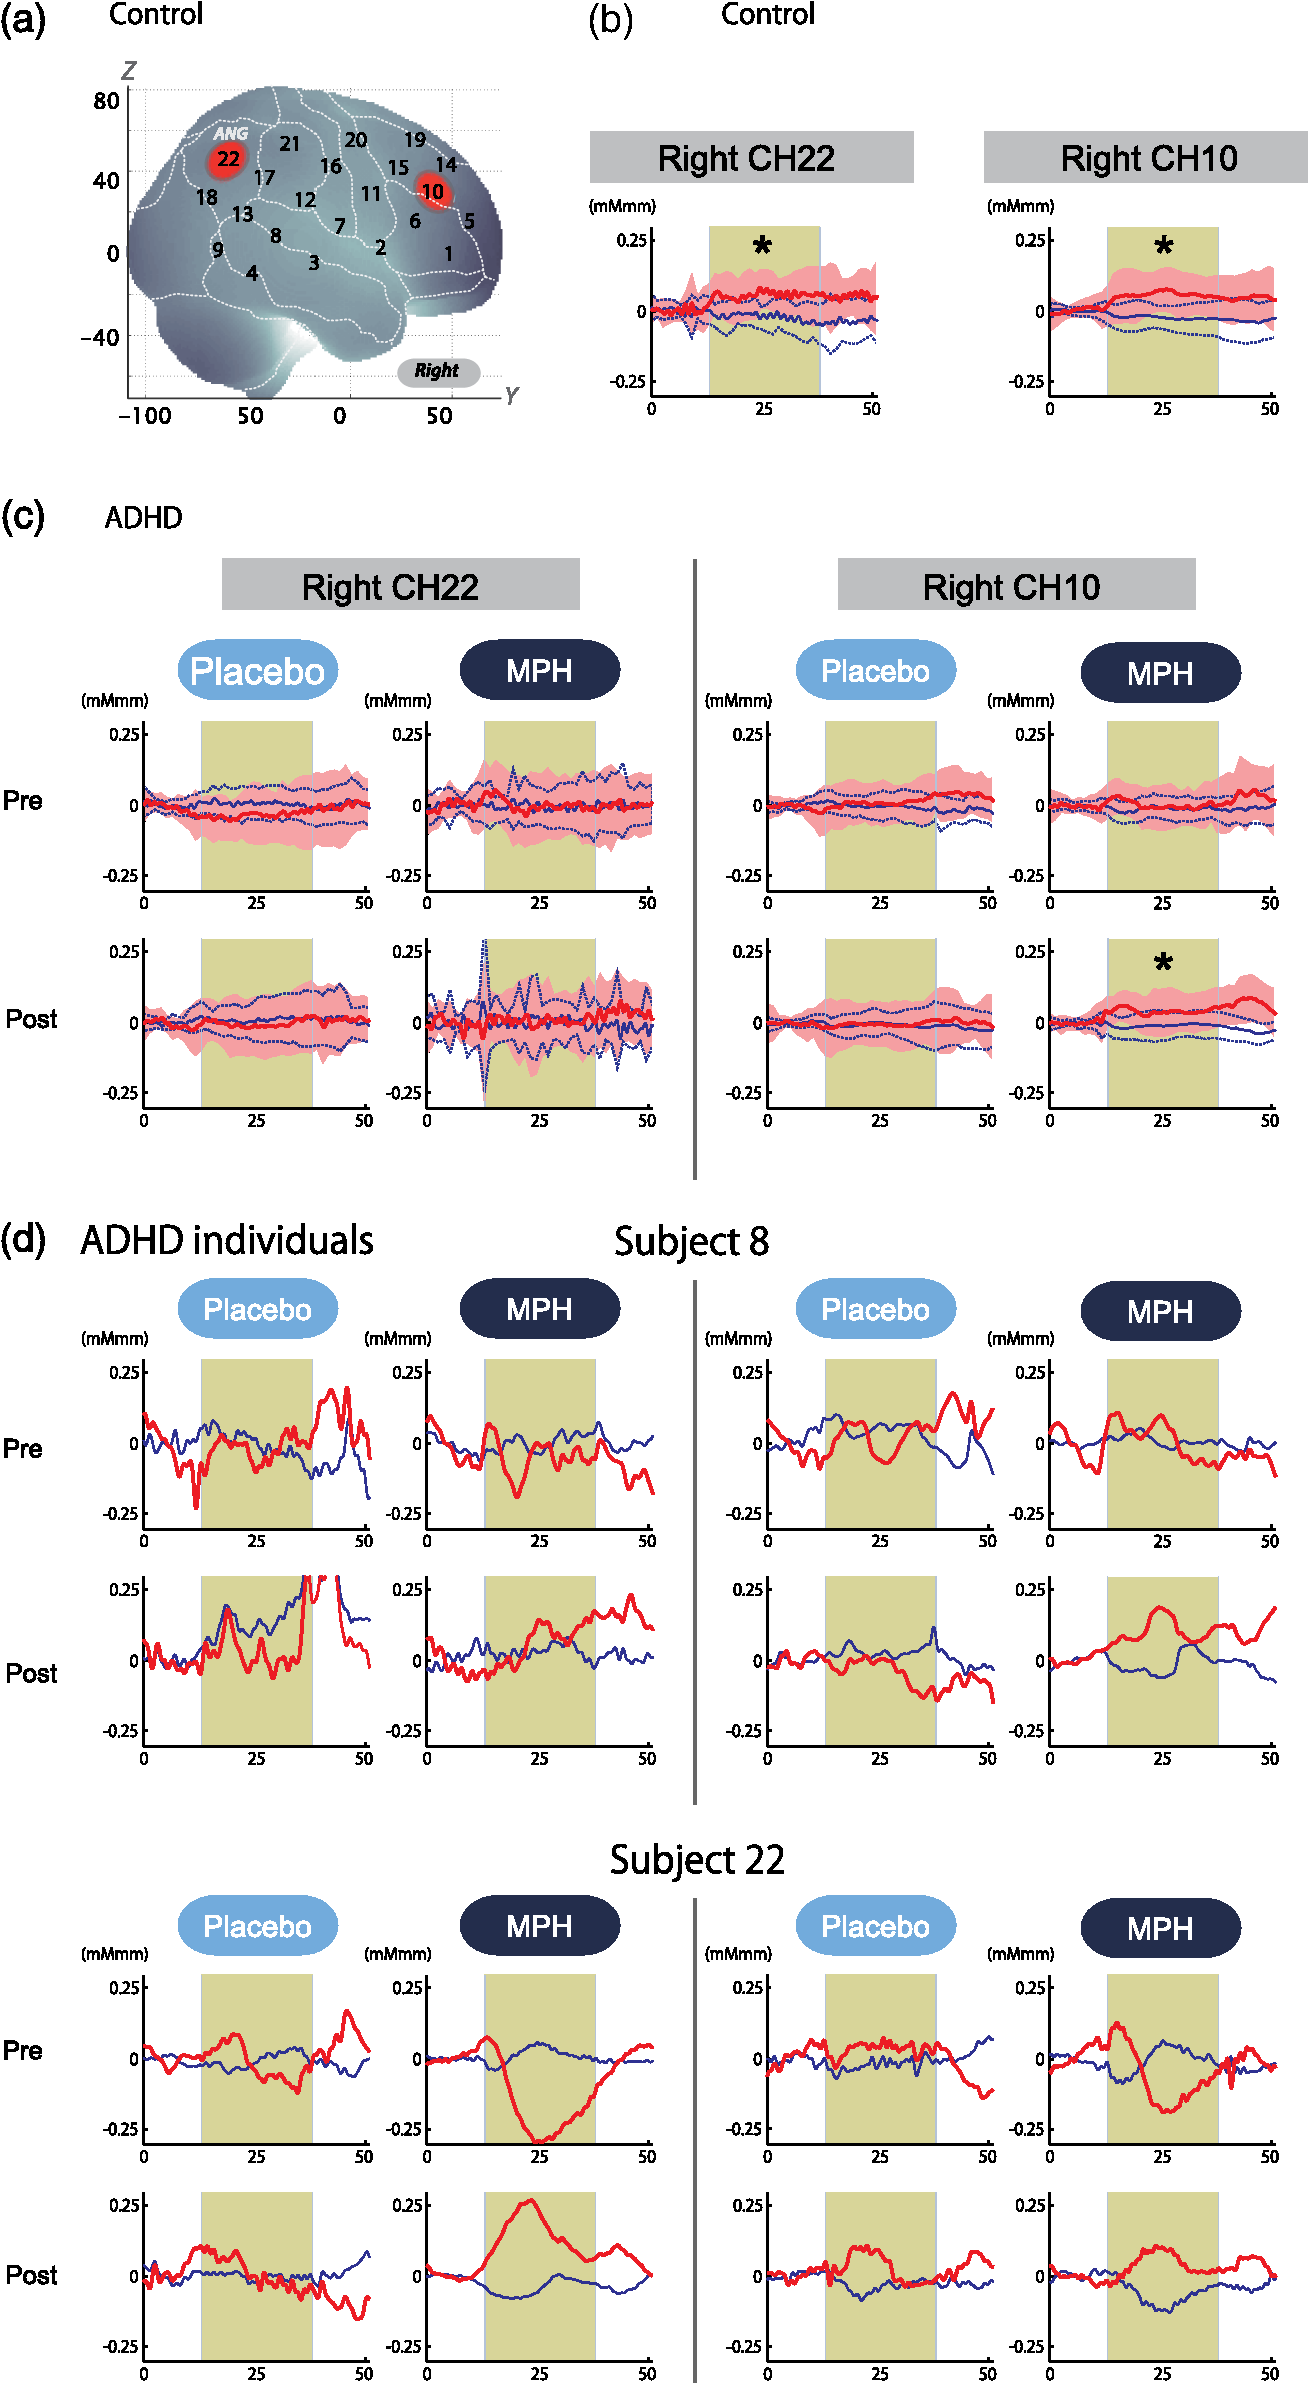 These channels were located in the border region between the right middle frontal gyrus (MFG) and inferior frontal gyrus (IFG) [MNI coordinates , , (SD): 48,41,30 (15), MFG 69.5%, IFG 30.5%; Table 2) and the right angular gyrus and the right supramarginal gyrus (MNI coordinates , , (SD): 56, , 45 (18), angular gyrus 98.8%, supramarginal gyrus 1.2%; Table 2) with reference to macroanatomical brain atlases.67,69 Effects of medications were examined between control and postplacebo ADHD subjects, and between control and post-MPH ADHD subjects (independent two-sample t-test, thresholded at , Cohen’s ; Table 3). Oxy-Hb signal in control subjects was significantly higher than in postplacebo ADHD subjects, whereas no significant difference was found for those in control and post-MPH ADHD subjects (Table 3). This suggests that the impaired right prefrontal activation was normalized by the MPH administration. Finally, we tested whether there was an MPH-induced, but not placebo-induced, right prefrontal activation in ADHD subjects. In the intermedication contrast, the right CH 10 was found to have a significant difference in activation (paired t-test, , Cohen’s ; Table 4). These results indicate that an oxy-Hb signal increase during oddball tasks was induced by MPH but not by the placebo. 3.3.Oxy-Hb Timeline DataFigure 3 illustrates the grand average waveforms of all 22 control subjects and 22 ADHD subjects. For ADHD, oxy-Hb and deoxy-Hb signals are presented for pre-/postplacebo and pre-/post-MPH conditions for CH 10 and CH 22 of the right hemisphere. We observed more stable task-related oxy-Hb signals than deoxy-Hb signals, suggesting the robustness of oxy-Hb signals for our experimental conditions. An oxy-Hb increase in the right CH 10 was clearly observed for control subjects and for post-MPH administration condition of ADHD subjects, whereas oxy-Hb increase in CH 22 was only observed for control subjects in the grand average waveform. Waveforms for individual subjects (subject 8: 7-year-old ADHD boy and subject 22: 6-year-old ADHD boy) are also illustrated. Although the individual data resulted in somewhat noisy waveforms, the oxy-Hb activation in the post-MPH session is clearly presented even in the data of the 6-year-old ADHD subject. 3.4.Examination of the Effects of IQSince we did not match the IQ of the ADHD and normal healthy control subjects, we performed additional analyses to determine any possible effects of IQ. We examined the correlation between IQ and activation in the right CH 10 for ADHD subjects (ADHD postplacebo contrast) and control subjects, respectively. In ADHD subjects, Pearson’s correlation coefficient was 0.043 (), while that in control subjects was (). Neither analysis yielded any significant correlation with a meaningful effect size. In addition, we compared the two correlation coefficients, but did not find any significant difference (Fisher’s , ). Thus, we concluded that there was no correlation between IQ and the activation in the right CH 10 in either group. To further eliminate the possible effects of IQ, we performed separate analyses with IQ-matching. This resulted in the following demographic characteristics: 15 right-handed ADHD patients (14 boys and 1 girl) with a mean age of 9.3 years (SD 2.2, range 6 to 14 years) and a mean IQ score of 100.9 (SD 7.8, range 90 to 121), and 15 right-handed control subjects matched with the ADHD subjects according to age (mean 9.7 years, SD 2.1, range 6 to 13 years, , ), gender (11 boys and 3 girls, , ), and IQ (mean 104.4, SD 8.6, range 90 to 119, , ). We screened for any fNIRS channels involved in the oddball task in control and ADHD contrasts (pre-/postplacebo and pre-/post-MPH conditions). Significant oxy-Hb increase was found in the right CH 10 (mean 0.066, SD 0.061, paired t-test, , , Bonferroni-corrected Cohen’s ) and the right CH 22 (mean 0.064, SD 0.058, paired t-test, , , Bonferroni-corrected Cohen’s ) in control subjects as in the non-IQ-matched control group. Conversely, in ADHD conditions, only post-MPH showed significant oxy-Hb increase in the right CH 10 (mean 0.061, SD 0.052, paired t-test, , , Bonferroni-corrected Cohen’s ). No significant oxy-Hb increase was found in the right CH 22 (mean 0.022, SD 0.097, paired t-test, , , Bonferroni-corrected Cohen’s ) in ADHD subjects. These results were the same as those for the non-IQ-matched ADHD group. Effects of medications were examined between control and postplacebo IQ-matched ADHD subjects, and between control and post-MPH ADHD subjects. Oxy-Hb signal in control subjects was significantly higher than in postplacebo ADHD subjects (independent two-sample t-test, , , Cohen’s ), whereas no significant difference was found for those in control and post-MPH ADHD subjects (independent two-sample t-test, , , Cohen’s ). This suggests that the impaired right prefrontal activation was normalized with MPH administration when IQs were matched. 4.DiscussionThe current study aimed to explore the neural substrate for MPH effects on attentional control in school-aged ADHD children using fNIRS, which is applicable to a wider range of ADHD children than are conventional neuroimaging modalities. First, exploration of fNIRS cortical activation data reflecting attentional function in ADHD and healthy control subjects performing oddball tasks revealed the association of the right IFG/MFG as a neural substrate of MPH effects in ADHD children. Second, the reduced right IFG/MFG activation was acutely normalized after MPH administration in ADHD children. This normalized activation was further validated in the intermedication comparison. Finally, we revealed that the mode of normalization was asymmetrical in the fronto-parietal attention network. MPH-induced normalization was significant in the right prefrontal cortex. On the other hand, while the inferior parietal lobule (IPL) was recruited during oddball tasks in control subjects, such IPL activation was not observed in any conditions with ADHD children. These results suggest that the normalized right IFG and MFG activation induced by MPH administration during an oddball attention task may serve as a neurobiological marker for fNIRS assessment to determine the effectiveness of MPH on ADHD children. 4.1.Behavioral Performance for Oddball TasksFor detecting the ability to control attention, one of the most commonly used experimental procedures is an oddball paradigm, in which subjects are generally required to detect an infrequently presented target (oddball) in a sequence of frequently presented standard stimuli.70,71 Oddball tasks are considered to entail not only top-down attention regulated toward standard stimuli but also additional selective attention toward deviant events that can interfere with ongoing focused attention. However, after transient disengagement, the top-down attention to the ongoing stimuli should be retrieved after evaluation of the deviant event. Due to the comprehensiveness with which it can be used to evaluate the attentional system, the oddball paradigm has been widely adopted for fMRI, electroencephalography, and event-related potential studies.72 The oddball paradigm allows the evaluation of detailed aspects of attentional controls reflected in various parameters.73–77 Omission errors, or failure to respond to the target, as well as accuracy rates, are generally interpreted as measures of inattention; CV or the standard deviation of the response times for correct responses to the target is considered to provide another measure of inattention; commission errors, or failure to respond appropriately to the nontarget, as well as RT for go responses, are commonly interpreted as measures of impulsivity. In the current study, we detected normalization of the accuracy rates for target trials in comparison between control and post-MPH ADHD subjects. Also, the CV and commission error rates for target trials in the post-MPH condition were significantly lower than those in the pre-MPH condition, showing upregulation by MPH administration. In related past studies, Shafritz et al., employing an oddball paradigm, reported that MPH had no effect on task performance.33 However, Rubia et al., employing the continuous performance test, focused on the examination of omission and commission errors and suggested that the MPH effects were more pronounced for inattention problems (reflected in omission errors) than impulsivity (reflected in commission errors).34 There is inconsistency among the results of the three studies, showing the difficulty in interpreting behavioral parameters. Within the current study, MPH normalized the performance deficits in accuracy rates (representing improved attention) and upregulated the CV (representing improved attention) and commission error rates (representing improved impulsivity). The results of normalization were not consistent with those of upregulation. Although behavioral parameters may often well reflect specific cognitive aspects of ADHD symptoms or the effect that MPH has on them, the current study and previous studies could not coherently confirm an effect of MPH on behavioral parameters. Neuroimaging data would preferably be interpreted in support of behavioral data, but in reality, inconsistency of behavioral data renders neuroimaging studies necessary in order to provide alternative physiological measures. In this sense, a neuroimaging examination would be expected to compensate for the insufficiency of conventional behavioral measurement in order to facilitate robust clinical diagnoses. 4.2.fNIRS Examination of Oddball Tasks and MPH EffectsMany studies have explored the neural correlates of attentional control using oddball tasks.72 It is known that an oddball task recruits several brain regions, including the bilateral superior, inferior, and dorsolateral prefrontal cortices, the supplementary motor area, the anterior cingulate gyrus, the parietal and temporal lobes, the caudate nucleus, and the amygdala (e.g., Refs. 78 and 79). Among these regions, the current study covered the prefrontal and parietal cortices. Indeed, in the control subjects, we observed cortical activations during oddball tasks on the border of the right MFG/IFG, and in the angular gyri. The MFG/IFG together with the angular gyrus are the components of the attentional system, having extensive reciprocal connections.80 These networks are thought to play an important role in the executive control needed to guide goal-directed and stimulus-driven attention.81 Moreover, recent fMRI and event-related brain potential studies on healthy adults have provided experimental evidence for involvement of the prefrontal and parietal networks using oddball tasks.70,72,79,82–88 Thus, it is relevant that our current fNIRS-based study successfully detected concurrent activations in the attentional network between prefrontal and inferior parietal cortices in the control subjects. As was expected, activations in the right prefrontal and inferior parietal cortices were not observed in premedicated ADHD children. Our observations are consistent with the results of an fMRI study by Rubia et al. showing reduced activation and functional interconnectivity in bilateral fronto-striato-parieto-cerebellar networks during continuous performance tasks under a placebo condition for children with ADHD.34 Thus, our results provide further experimental evidence for dysfunction of the attention-associated regions in ADHD children. Interestingly, MPH administration significantly normalized reduced activation in the right MFG/IFG but not in the angular gyri. Activation in the right MFG/IFG after MPH administration was also confirmed in comparison with placebo administration. Thus, the current results suggest that functional normalization of attentional control in ADHD children by MPH administration is associated solely with right prefrontal activation, but does not extend to the inferior parietal cortex to activate wider components of the attention network. This result is slightly different from former fMRI findings by Rubia et al. reporting MPH-mediated normalization of fronto-striato-cerebellar and parieto-temporal activations and fronto-striatal and fronto-cerebellar connectivity.34 However, failure to observe activation in the inferior parietal and neighboring regions, including the temporoparietal junction and the caudal part of the temporal lobe, is not limited to the current study. Shafritz et al. reported that the reduced middle-temporal activation in ADHD adolescents compared with control subjects was not normalized with MPH administration.33 Given the limited number of experimental studies performed thus far, it is difficult to identify factors that lead to the presence or absence of MPH-induced activation in the inferior parietal region at this stage. Further studies with more variety in subjects and experimental conditions are necessary. However, the MPH-induced normalization in the right prefrontal cortex appears relevant when considering pharmacological effects of MPH. MPH has been known to affect the noradrenergic (NA),89 dopaminergic (DA),90 and serotonergic (5-HT) systems.91 However, the affinity of MPH to these catecholamine receptors is different: dissociation constant values, or , of MPH to NA, DA, and 5-HT receptors are 339, 34, and , respectively.92 Thus, MPH is considered to have by far larger effects on the DA system. Given the predominant distribution of the DA system in the prefrontal cortex innervating from the ventral tegmentum (mesocortical pathway),93 it is cogent that MPH-induced normalization of cortical activation in ADHD children occurs solely in the right prefrontal cortex. In addition, the inferior parietal cortex is more associated with the locus coeruleus NA system.94 Thus, given the lower affinity of MPH to the NA receptor, it would also be understandable that normalization of cortical activation in ADHD children may fail to occur in the inferior parietal cortex. In order to elucidate the precise neuropharmacological mechanism underlying asymmetric functional normalization of the attention network components, further investigations are necessary. 4.3.Effects of IQIt is important to explore the effects of IQ; however, in the ADHD and control subjects enrolled in the current study, there was no effect of IQ in our major findings. As described in the Results section, we examined the correlation between IQ and activation in the right CH 10 for ADHD subjects (ADHD postplacebo contrast) and control subjects, respectively. There was no correlation between IQ and activation in the right CH 10. We further performed preliminary fNIRS analyses by extracting data for IQ-matched ADHD and control subjects from the original subject pool, but our major findings remained unchanged. Based on these results, we conclude that the effect of IQ is negligible in the current study. In dealing with IQ, we must note that low IQ is co-occurring with ADHD. Several studies have reported that the IQs of ADHD children are often lower than those of normal healthy children.95,96 This is supported by an extensive epidemiological study reporting that a low IQ co-occurs with ADHD.96 Based on these observations, some authors have considered it inappropriate to apply IQ as a covariant of analysis of covariance.97,98 Based on these studies, we refrained from IQ-matching in the original analysis and did not adopt IQ as a covariant. If such analyses had been performed, any differences of cortical activation in ADHD and normal healthy control children would have been overcorrected because a low IQ is part of the ADHD phenotype. 4.4.Clinical Utility of fNIRS-Based Examination of ADHD ChildrenWith respect to clinical considerations, the applicability of the current experimental design for examining young ADHD children can be well appreciated given the considerably low postscan data exclusion rate. All data for the 22 ADHD children as well as the 22 healthy control children who participated in the current experiment were available for the current analysis. The examination of children with ADHD often entails a high exclusion rate. For example, one study enrolling a relatively young sample of children (6 years and older) rejected 50% of ADHD subjects and 30% of normal control subjects.16 In addition, Yerys et al. reported a high exclusion rate for ADHD patient populations in fMRI studies mainly due to motion and lack of compliance.99 The fNIRS examination used in the current study can be considered ADHD patient friendly as assessed subjectively from the data exclusion rate. Another problem with ADHD patient examination is lengthy test administration times, which often lead to inflated performance variability due to increased fatigue and/or decreased participant compliance especially when task duration extends beyond 20 min.100 The oddball task for the current experiment took 6 min, and total measurement time was (including probe setup and position digitizing). Thus, the current experimental design using fNIRS and an oddball task is suitable for examining young ADHD children. One merit of using the alternative task paradigm is that baseline blocks can be used as a motor control for oddball blocks. Since the physical motions associated with the oddball task are the same as those for the baseline task, we can equalize the motor loads of baseline and oddball periods. Hence, we can expect an oddball-baseline contrast to rule out motion artifacts. Schecklmann et al. alternated a weekday recitation task and word fluency task and used the weekday recitation task as a baseline to which fNIRS signals during the word fluency task were compared. By using a control condition with a similar motor output, movement and muscle artifacts during a task condition are expected to be cancelled out.69 Similarly, we utilized a baseline task as the baseline period. In our current study, this paradigm was implemented primarily because it is extremely difficult for ADHD patients to remain still without performing a task: it may lead to unexpected movements or behaviors. Secondarily, we were able to save time by omitting rest blocks: a prolonged experiment time may bore ADHD subjects. Combining these considerations with the desirability of cross-modality comparison, the choice of experimental paradigm in the current study is appropriate. Another merit of using the oddball paradigm is that it robustly evokes lateralized activation in the right prefrontal inferior parietal cortices in control subjects as shown in the current study. The MPH-induced normalization in the prefrontal cortex (PFC) of ADHD subjects was also lateralized to the right. Lateralization is important if a certain activation pattern is to serve as a biomarker because lateralized activation is expected to be less influenced by scalp hemodynamics and systemic effects,101,102 which are expected to exhibit little lateralization. Given that the reduction of exracranial signal contamination is still being developed for fNIRS using continuous wave (e.g., Ref. 103), the use of a task that results in clear lateralization is beneficial. 4.5.LimitationsAs discussed above, the current fNIRS-based study has demonstrated the effect of MPH on attention in ADHD children at elementary school ages. However, several issues need to be addressed before establishing its clinical utility. First, studies of acute dosage provide only a unique probe of brief changes possibly associated with catecholamine modulation that can generate insights into the effects of these brief changes on underlying brain function. The findings of this study, therefore, cannot be transferred to the elucidation of the underlying mechanisms of long-term clinical treatment and are, hence, limited in their applicability to clinical reality. We did not explore the comparison between naïve and medicated patients because these groups were not matched in age. However, the next step is to perform a long-term longitudinal evaluation of the same ADHD patients in order to differentiate brain function between drug-naïve and medicated patients. Second, the experimental paradigm of a block design used in the current study may not yield optimum specificity and sensitivity for the attention function expected to increase upon MPH treatment with ADHD children. Since the oddball block consisted of 80% standard stimuli and 20% oddball stimuli, the cortical activation does not fully reflect inhibitory control. In order to purify cortical activation exclusively for inhibitory control, an event-related design should be explored in future studies. Third, we confined our analyses to the oxy-Hb parameter since we failed to find any significantly activated channels with the deoxy-Hb parameter during the screening process performed on control subjects. This is reminiscent of our previous studies employing similar experimental designs.24,25 Many fNIRS studies have solely adopted the results of the oxy-Hb parameter, including a previous ADHD study by Negoro et al.104 While there is a tendency for oxy-Hb to be more sensitive than deoxy-Hb (e.g., Refs. 105106. to 107), the reason for the decreased sensitivity of deoxy-Hb remains unknown. Phenomenologically, Ehlis et al.105 reported that the behavior of deoxy-Hb was different between ADHD and normal subjects, with deoxy-Hb decreases being larger in ADHD subjects than in normal subjects. Also, even when an increase in the oxy-Hb parameter was detected, the deoxy-Hb parameter either increased, stayed unchanged, or decreased depending on factors including task, region, and age.105,108 This suggests difficulty in treating the deoxy-Hb parameter. Further studies are necessary to understand the role and applicability of the deoxy-Hb parameter in analyzing data for ADHD children. Fourth, while MPH-elicited activation in the right prefrontal cortex was robustly detected in this group study, activation cannot always be detected in such a small region in individual subjects. Rather, activation often expands to a wider region of the right or bilateral PFC. Nevertheless, MPH-elicited right prefrontal activation was consistently detected among ADHD children in the current study, suggesting its potential use as biomarker in individual analysis. Hence, further exploration is necessary to quantify the MPH-elicited activation at an individual level for future clinical application. 5.ConclusionIn the current study examining the effects of MPH administration on attentional control of ADHD children using a double-blind, placebo-controlled, crossover design, we presented the following findings. First, between two activation foci involved in attention networks activated in control subjects performing an oddball task, the right prefrontal, but not inferior parietal, region was considered to be associated with MPH effects in ADHD children. Second, we found acute normalization after MPH administration in ADHD children as reflected in the upregulated right IFG/MFG activation. Finally, MPH effects in ADHD children were limited to the prefrontal cortex: while the IPL was recruited during the oddball task in control subjects, such IPL activation was not observed in any conditions for ADHD children. These experimental results are consistent with the neuropharmacological effects of MPH to upregulate the DA system in the fronto-striatal pathway, but not the locus coeruleus NA system associated with attentional function in the inferior parietal cortex. These findings led us to conclude that the activation in the right inferior and middle frontal gyri could serve as an objective neurofunctional biomarker to indicate the effectiveness of MPH on ADHD children for attentional control. The low exclusion rate of 0% for school-aged (6 to 14 years) ADHD children indicates that fNIRS-based examination is patient friendly to ADHD children. This promising technique will contribute to the enhancement of early clinical diagnosis and treatment of ADHD children, especially those with an inattention phenotype. AppendicesAppendixFigure 4 demonstrates the cortical activation pattern of control subjects and ADHD subjects. Table 5 shows the spatial profiles of the channels screened for involvement with oddball tasks. Fig. 4The cortical activation pattern of (a) control subjects and (b) ADHD subjects shown as t-maps of oxy-Hb signal with significant t-values (paired t-test, p < 0.05, uncorrected) being shown according to the color bar. 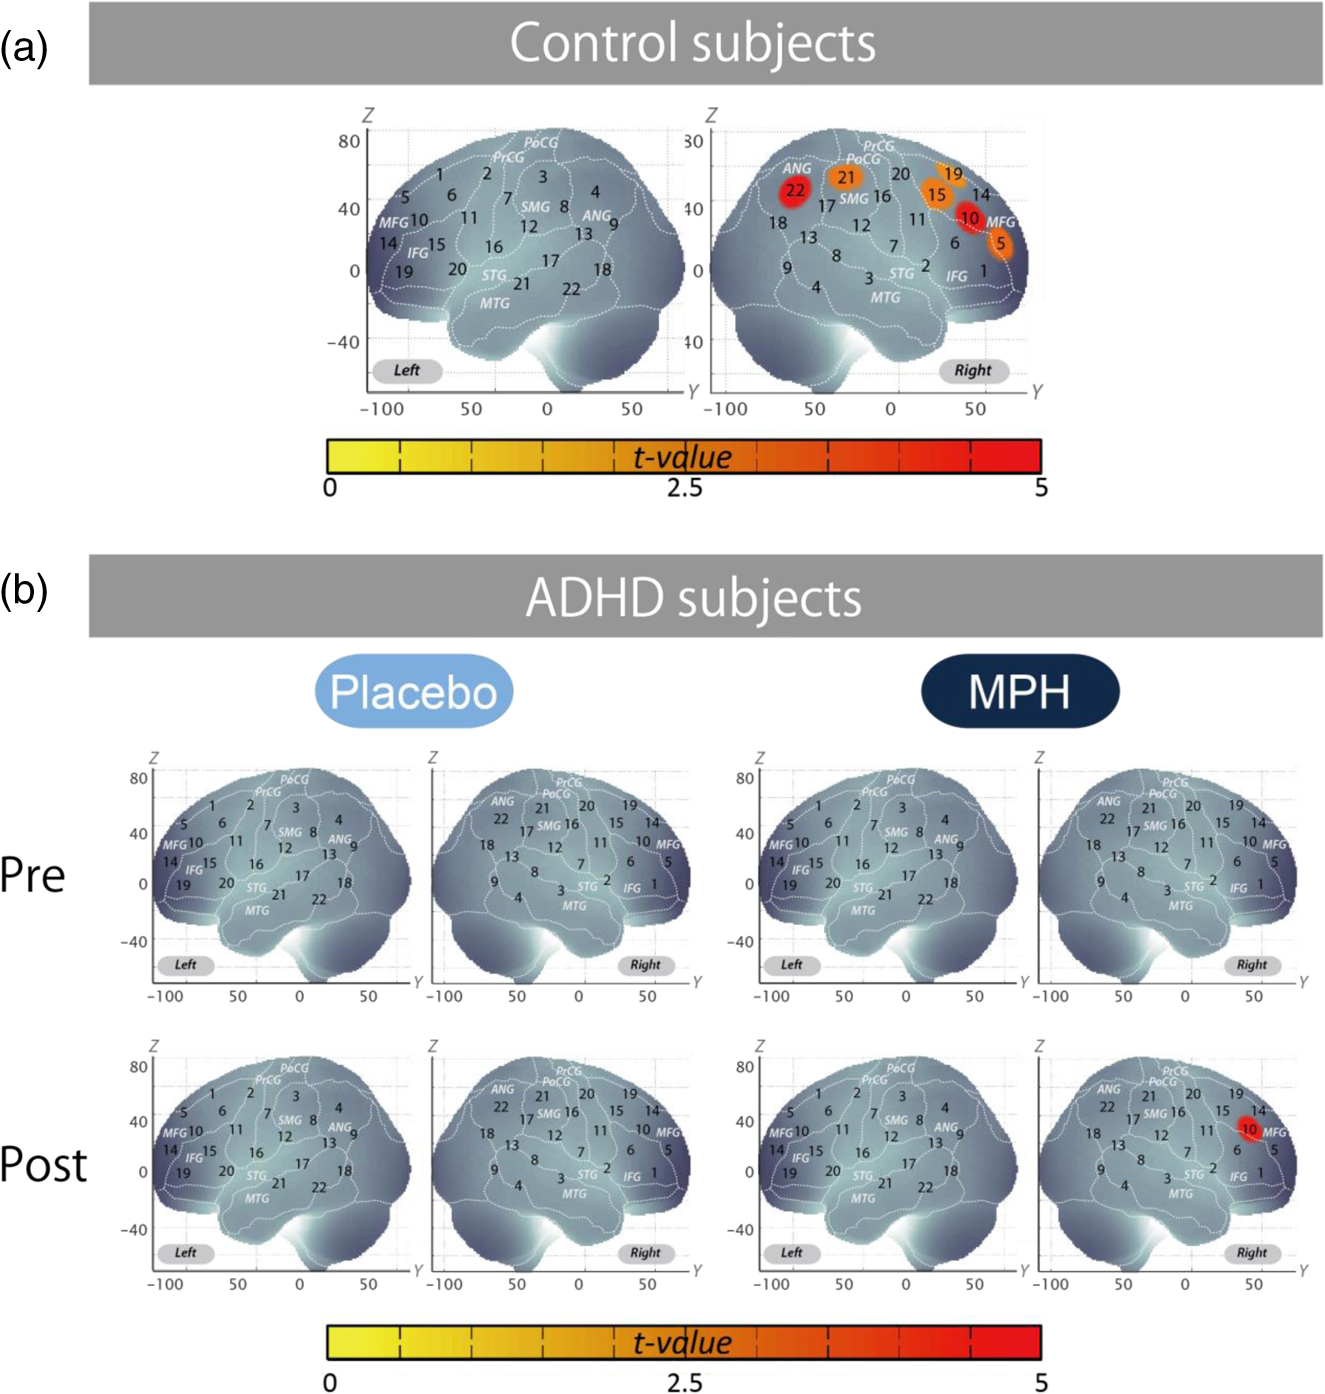 Table 5Spatial profiles of the channels screened for involvement with oddball tasks (uncorrected)
Note: Data for CH 5, 10, 15, 19, 21, and 22 of the right hemisphere. For MNI coordinates, the most likely values are presented with standard deviation (SD) in units of mm. Macroanatomical estimation is based on LBPA40.66 Brodmann area estimation is based on MRIcro.67 Abbreviations are as follows: SD, standard deviation and Prob, Probability. AcknowledgmentsWe appreciate ELCS for English proofreading. We thank Illpop ( http://illpop.com/animal_top01.htm) for kindly providing source pictures for experimental materials. This work was supported in part by the Grant-in-Aid for Scientific Research from the Japan Society for Promotion of Science (24300105 and 25282243 to I. D., 23390354 to E. W., 23700885 to H. D., 80382951 to Y. M., and 70438662 to M. N.), and Health and Labor Sciences Research Grants, Research on Psychiatric and Neurological Diseases and Mental Health (to I. D.). ReferencesR. W. Dittmannet al.,
“Atomoxetine treatment and ADHD-related difficulties as assessed by adolescent patients, their parents and physicians,”
Child Adolesc. Psychiatry Ment. Health, 3
(1), 21
(2009). http://dx.doi.org/10.1186/1753-2000-3-21 1753-2000 Google Scholar
R. Drechsleret al.,
“The course of neuropsychological functions in children with attention deficit hyperactivity disorder from late childhood to early adolescence,”
J. Child Psychol. Psychiatry, 46
(8), 824
–836
(2005). http://dx.doi.org/10.1111/jcpp.2005.46.issue-8 0021-9630 Google Scholar
E. Tayloret al.,
“Hyperactivity and conduct problems as risk factors for adolescent development,”
J. Am. Acad. Child Adolesc. Psychiatry, 35
(9), 1213
–1226
(1996). http://dx.doi.org/10.1097/00004583-199609000-00019 JAAPEE 0890-8567 Google Scholar
A. F. KlassenA. MillerS. Fine,
“Health-related quality of life in children and adolescents who have a diagnosis of attention-deficit/hyperactivity disorder,”
Pediatrics, 114
(5), e541
–547
(2004). http://dx.doi.org/10.1542/peds.2004-0844 PEDIAU 0031-4005 Google Scholar
P. M. WehmeierA. SchachtR. A. Barkley,
“Social and emotional impairment in children and adolescents with ADHD and the impact on quality of life,”
J. Adolesc. Health, 46
(3), 209
–217
(2010). http://dx.doi.org/10.1016/j.jadohealth.2009.09.009 1054-139X Google Scholar
T. J. PowerE. S. ShapiroG. J. DuPaul,
“Preparing psychologists to link systems of care in managing and preventing children’s health problems,”
J. Pediatr. Psychol., 28
(2), 147
–155
(2003). http://dx.doi.org/10.1093/jpepsy/28.2.147 JPPSDW 0146-8693 Google Scholar
M. Wolraichet al.,
“ADHD: clinical practice guideline for the diagnosis, evaluation, and treatment of attention-deficit/hyperactivity disorder in children and adolescents,”
Pediatrics, 128
(5), 1007
–1022
(2011). http://dx.doi.org/10.1542/peds.2011-2654 PEDIAU 0031-4005 Google Scholar
S. Pliszka,
“Practice parameter for the assessment and treatment of children and adolescents with attention-deficit/hyperactivity disorder,”
J. Am. Acad. Child Adolesc. Psychiatry, 46
(7), 894
–921
(2007). http://dx.doi.org/10.1097/chi.0b013e318054e724 JAAPEE 0890-8567 Google Scholar
E. Tayloret al.,
“European clinical guidelines for hyperkinetic disorder—first upgrade,”
Eur. Child Adolesc. Psychiatry, 13
(Suppl 1), 17
–30
(2004). EAPSE9 1435-165X Google Scholar
P. Hodgkinset al.,
“Amfetamine and methylphenidate medications for attention-deficit/hyperactivity disorder: complementary treatment options,”
Eur. Child Adolesc. Psychiatry, 21
(9), 477
–492
(2012). http://dx.doi.org/10.1007/s00787-012-0286-5 EAPSE9 1435-165X Google Scholar
T. Banaschewskiet al.,
“Long-acting medications for the hyperkinetic disorders. A systematic review and European treatment guideline,”
Eur. Child Adolesc. Psychiatry, 15
(8), 476
–495
(2006). http://dx.doi.org/10.1093/arclin/acp030 0887-6177 Google Scholar
T. J. Spencer,
“ADHD treatment across the life cycle,”
J. Clin. Psychiatry, 65
(Suppl 3), 22
–26
(2004). JCLPDE 0160-6689 Google Scholar
C. Z. Zhuet al.,
“Fisher discriminative analysis of resting-state brain function for attention-deficit/hyperactivity disorder,”
NeuroImage, 40
(1), 110
–120
(2008). http://dx.doi.org/10.1016/j.neuroimage.2007.11.029 NEIMEF 1053-8119 Google Scholar
W. Dilloet al.,
“Neuronal correlates of ADHD in adults with evidence for compensation strategies—a functional MRI study with a Go/No-Go paradigm,”
Ger. Med. Sci., 8 1
–8
(2010). 1612-3174 Google Scholar
G. Bushet al.,
“Anterior cingulate cortex dysfunction in attention-deficit/hyperactivity disorder revealed by fMRI and the Counting Stroop,”
Biol. Psychiatry, 45
(12), 1542
–1552
(1999). http://dx.doi.org/10.1016/S0006-3223(99)00083-9 BIPCBF 0006-3223 Google Scholar
S. Durstonet al.,
“Differential patterns of striatal activation in young children with and without ADHD,”
Biol. Psychiatry, 53
(10), 871
–878
(2003). http://dx.doi.org/10.1016/S0006-3223(02)01904-2 BIPCBF 0006-3223 Google Scholar
C. J. Vaidyaet al.,
“Selective effects of methylphenidate in attention deficit hyperactivity disorder: a functional magnetic resonance study,”
Proc. Natl. Acad. Sci. U. S. A., 95
(24), 14494
–14499
(1998). http://dx.doi.org/10.1073/pnas.95.24.14494 PNASA6 0027-8424 Google Scholar
K. Rubiaet al.,
“Hypofrontality in attention deficit hyperactivity disorder during higher-order motor control: a study with functional MRI,”
Am. J. Psychiatry, 156
(6), 891
–896
(1999). AJPSAO 0002-953X Google Scholar
H. ObrigA. Villringer,
“Beyond the visible-imaging the human brain with light,”
J. Cereb. Blood Flow Metab., 23
(1), 1
–18
(2003). http://dx.doi.org/10.1097/00004647-200301000-00001 JCBMDN 0271-678X Google Scholar
G. StrangmanD. A. BoasJ. P. Sutton,
“Non-invasive neuroimaging using near-infrared light,”
Biol. Psychiatry, 52
(7), 679
–693
(2002). http://dx.doi.org/10.1016/S0006-3223(02)01550-0 BIPCBF 0006-3223 Google Scholar
M. FerrariV. Quaresima,
“A brief review on the history of human functional near-infrared spectroscopy (fNIRS) development and fields of application,”
NeuroImage, 63
(2), 921
–935
(2012). http://dx.doi.org/10.1016/j.neuroimage.2012.03.049 NEIMEF 1053-8119 Google Scholar
Y. Minagawa-Kawaiet al.,
“Optical imaging of infants’ neurocognitive development: recent advances and perspectives,”
Dev. Neurobiol., 68
(6), 712
–728
(2008). http://dx.doi.org/10.1002/(ISSN)1932-846X DNEEAM 1932-8451 Google Scholar
S. Lloyd-FoxA. BlasiC. E. Elwell,
“Illuminating the developing brain: the past, present and future of functional near infrared spectroscopy,”
Neurosci. Biobehav. Rev., 34
(3), 269
–284
(2010). http://dx.doi.org/10.1016/j.neubiorev.2009.07.008 NBREDE 0149-7634 Google Scholar
Y. Mondenet al.,
“Clinically-oriented monitoring of acute effects of methylphenidate on cerebral hemodynamics in ADHD children using fNIRS,”
Clin. Neurophysiol., 123
(6), 1147
–1157
(2012). http://dx.doi.org/10.1016/j.clinph.2011.10.006 CNEUFU 1388-2457 Google Scholar
Y. Mondenet al.,
“Right prefrontal activation as a neuro-functional biomarker for monitoring acute effects of methylphenidate in ADHD children: an fNIRS study,”
NeuroImage Clin., 1
(1), 131
–140
(2012). Google Scholar
J. W. MaedgenC. L. Carlson,
“Social functioning and emotional regulation in the attention deficit hyperactivity disorder subtypes,”
J. Clin. Child Psychol., 29
(1), 30
–42
(2000). http://dx.doi.org/10.1207/S15374424jccp2901_4 JCCPD3 0047-228X Google Scholar
F. Chochonet al.,
“Differential contributions of the left and right inferior parietal lobules to number processing,”
J. Cogn. Neurosci., 11
(6), 617
–630
(1999). http://dx.doi.org/10.1162/089892999563689 JCONEO 0898-929X Google Scholar
P. V. Peerset al.,
“Attentional functions of parietal and frontal cortex,”
Cereb. Cortex, 15
(10), 1469
–1484
(2005). http://dx.doi.org/10.1093/cercor/bhi029 53OPAV 1047-3211 Google Scholar
S. M. Riveraet al.,
“Developmental changes in mental arithmetic: evidence for increased functional specialization in the left inferior parietal cortex,”
Cereb. Cortex, 15
(11), 1779
–1790
(2005). http://dx.doi.org/10.1093/cercor/bhi055 53OPAV 1047-3211 Google Scholar
B. J. Caseyet al.,
“Implication of right frontostriatal circuitry in response inhibition and attention-deficit/hyperactivity disorder,”
J. Am. Acad. Child Adolesc. Psychiatry, 36
(3), 374
–383
(1997). http://dx.doi.org/10.1097/00004583-199703000-00016 JAAPEE 0890-8567 Google Scholar
F. X. Castellanos,
“Toward a pathophysiology of attention-deficit/hyperactivity disorder,”
Clin. Pediatr., 36
(7), 381
–393
(1997). http://dx.doi.org/10.1177/000992289703600702 CLPEEM 0883-7198 Google Scholar
T. S. HaleA. R. HaririJ. T. McCracken,
“Attention-deficit/hyperactivity disorder: perspectives from neuroimaging,”
Ment. Retard. Dev. Disabil. Res. Rev., 6
(3), 214
–219
(2000). Google Scholar
K. M. Shafritzet al.,
“The effects of methylphenidate on neural systems of attention in attention deficit hyperactivity disorder,”
Am. J. Psychiatry, 161
(11), 1990
–1997
(2004). http://dx.doi.org/10.1176/appi.ajp.161.11.1990 AJPSAO 0002-953X Google Scholar
K. Rubiaet al.,
“Methylphenidate normalises activation and functional connectivity deficits in attention and motivation networks in medication-naive children with ADHD during a rewarded continuous performance task,”
Neuropharmacology, 57
(7–8), 640
–652
(2009). http://dx.doi.org/10.1016/j.neuropharm.2009.08.013 NEPHBW 0028-3908 Google Scholar
T. S. Braveret al.,
“Anterior cingulate cortex and response conflict: effects of frequency, inhibition and errors,”
Cereb. Cortex, 11
(9), 825
–836
(2001). http://dx.doi.org/10.1093/cercor/11.9.825 53OPAV 1047-3211 Google Scholar
J. M. Swansonet al.,
“Efficacy of a new pattern of delivery of methylphenidate for the treatment of ADHD: effects on activity level in the classroom and on the playground,”
J. Am. Acad. Child Adolesc. Psychiatry, 41
(11), 1306
–1314
(2002). http://dx.doi.org/10.1097/00004583-200211000-00011 JAAPEE 0890-8567 Google Scholar
P. WeberJ. LütschgH. Fahnenstich,
“Methylphenidate-induced changes in cerebral hemodynamics measured by functional near-infrared spectroscopy,”
J. Child Neurol., 22
(7), 812
–817
(2007). http://dx.doi.org/10.1177/0883073807304197 JOCNEE 0883-0738 Google Scholar
K. Rubiaet al.,
“Methylphenidate normalizes fronto-striatal underactivation during interference inhibition in medication-naive boys with attention-deficit hyperactivity disorder,”
Neuropsychopharmacology, 36
(8), 1575
–1586
(2011). http://dx.doi.org/10.1038/npp.2011.30 NEROEW 0893-133X Google Scholar
R. J. Barryet al.,
“Event-related potentials in adults with attention-deficit/hyperactivity disorder: an investigation using an inter-modal auditory/visual oddball task,”
Int. J. Psychophysiol., 71
(2), 124
–131
(2009). http://dx.doi.org/10.1016/j.ijpsycho.2008.09.009 IJPSEE 0167-8760 Google Scholar
E. BernatH. ShevrinM. Snodgrass,
“Subliminal visual oddball stimuli evoke a P300 component,”
Clin. Neurophysiol., 112
(1), 159
–171
(2001). http://dx.doi.org/10.1016/S1388-2457(00)00445-4 CNEUFU 1388-2457 Google Scholar
G. E. Bruderet al.,
“Event-related potentials in schizophrenia during tonal and phonetic oddball tasks: relations to diagnostic subtype, symptom features and verbal memory,”
Biol. Psychiatry, 50
(6), 447
–452
(2001). http://dx.doi.org/10.1016/S0006-3223(01)01168-4 BIPCBF 0006-3223 Google Scholar
B. GüntekinE. SaatçiG. Yener,
“Decrease of evoked delta, theta and alpha coherences in Alzheimer patients during a visual oddball paradigm,”
Brain Res., 1235 109
–116
(2008). http://dx.doi.org/10.1016/j.brainres.2008.06.028 BRREAP 1385-299X Google Scholar
M. E. HoulihanW. S. PritchardJ. H. Robinson,
“Faster P300 latency after smoking in visual but not auditory oddball tasks,”
Psychopharmacology, 123
(3), 231
–238
(1996). http://dx.doi.org/10.1007/BF02246577 PSPHDI 0161-0139 Google Scholar
J. KayserC. E. TenkeG. E. Bruder,
“Dissociation of brain ERP topographies for tonal and phonetic oddball tasks,”
Psychophysiology, 35
(5), 576
–590
(1998). http://dx.doi.org/10.1017/S0048577298970214 PSPHAF 0048-5772 Google Scholar
B. KotchoubeyS. Lang,
“Event-related potentials in an auditory semantic oddball task in humans,”
Neurosci. Lett., 310
(2), 93
–96
(2001). http://dx.doi.org/10.1016/S0304-3940(01)02057-2 NELED5 0304-3940 Google Scholar
J. LorenzK. KunzeB. Bromm,
“Differentiation of conversive sensory loss and malingering by P300 in a modified oddball task,”
Neuroreport, 9
(2), 187
–191
(1998). http://dx.doi.org/10.1097/00001756-199801260-00003 NERPEZ 0959-4965 Google Scholar
K. A. Palleret al.,
“Potentials evoked in human and monkey medial temporal lobe during auditory and visual oddball paradigms,”
Electroencephalogr. Clin. Neurophysiol., 84
(3), 269
–279
(1992). http://dx.doi.org/10.1016/0168-5597(92)90008-Y ECNEAZ 0013-4694 Google Scholar
J. PanT. TakeshitaK. Morimoto,
“P300 habituation from auditory single-stimulus and oddball paradigms,”
Int. J. Psychophysiol., 37
(2), 149
–153
(2000). http://dx.doi.org/10.1016/S0167-8760(00)00086-6 IJPSEE 0167-8760 Google Scholar
D. StrüberJ. Polich,
“P300 and slow wave from oddball and single-stimulus visual tasks: inter-stimulus interval effects,”
Int. J. Psychophysiol., 45
(3), 187
–196
(2002). http://dx.doi.org/10.1016/S0167-8760(02)00071-5 IJPSEE 0167-8760 Google Scholar
C. Tenkeet al.,
“Response-and stimulus-related ERP asymmetries in a tonal oddball task: a Laplacian analysis,”
Brain Topogr., 10
(3), 201
–210
(1998). http://dx.doi.org/10.1023/A:1022261226370 BRTOEZ 0896-0267 Google Scholar
W. WangJ. SchoenenM. Timsit-Berthier,
“Cognitive functions in migraine without aura between attacks: a psychophysiological approach using the ‘oddball’ paradigm,”
Neurophysiol. Clin., 25
(1), 3
–11
(1995). http://dx.doi.org/10.1016/0987-7053(96)81029-X NCLIE4 0987-7053 Google Scholar
M. Copeet al.,
“Methods of quantitating cerebral near infrared spectroscopy data,”
Adv. Exp. Med. Biol., 222 183
–189
(1988). http://dx.doi.org/10.1007/978-1-4615-9510-6 AEMBAP 0065-2598 Google Scholar
A. Makiet al.,
“Spatial and temporal analysis of human motor activity using noninvasive NIR topography,”
Med. Phys., 22
(12), 1997
–2005
(1995). http://dx.doi.org/10.1118/1.597496 MPHYA6 0094-2405 Google Scholar
H. GaravanT. RossE. Stein,
“Right hemispheric dominance of inhibitory control: an event-related functional MRI study,”
Proc. Natl. Acad. Sci., 96
(14), 8301
–8306
(1999). http://dx.doi.org/10.1073/pnas.96.14.8301 PMASAX 0096-9206 Google Scholar
M. J. Herrmannet al.,
“Optical topography during a Go-NoGo task assessed with multi-channel near-infrared spectroscopy,”
Behav. Brain Res., 160
(1), 135
–140
(2005). http://dx.doi.org/10.1016/j.bbr.2004.11.032 BBREDI 0166-4328 Google Scholar
M. HerrmannA.-C. EhlisA. Fallgatter,
“Bilaterally reduced frontal activation during a verbal fluency task in depressed patients as measured by near-infrared spectroscopy,”
J. Neuropsychiatry Clin. Neurosci., 16
(2), 170
–175
(2004). http://dx.doi.org/10.1176/appi.neuropsych.16.2.170 JNCNE7 0895-0172 Google Scholar
P. F. LiddleK. A. KiehlA. M. Smith,
“Event-related fMRI study of response inhibition,”
Hum. Brain Mapp., 12
(2), 100
–109
(2001). http://dx.doi.org/10.1002/(ISSN)1097-0193 HBRME7 1065-9471 Google Scholar
K. Rubiaet al.,
“Right inferior prefrontal cortex mediates response inhibition while mesial prefrontal cortex is responsible for error detection,”
NeuroImage, 20
(1), 351
–358
(2003). http://dx.doi.org/10.1016/S1053-8119(03)00275-1 NEIMEF 1053-8119 Google Scholar
M. YoonH. J. Clewell IIIM. E. Andersen,
“Deriving an explicit hepatic clearance equation accounting for plasma protein binding and hepatocellular uptake,”
Toxicol. In Vitro, 27
(1), 11
–15
(2013). http://dx.doi.org/10.1016/j.tiv.2012.10.003 TIVIEQ 0887-2333 Google Scholar
D. Tsuzukiet al.,
“Virtual spatial registration of stand-alone fNIRS data to MNI space,”
NeuroImage, 34
(4), 1506
–1518
(2007). http://dx.doi.org/10.1016/j.neuroimage.2006.10.043 NEIMEF 1053-8119 Google Scholar
D. TsuzukiI. Dan,
“Spatial registration for functional near-infrared spectroscopy: from channel position on the scalp to cortical location in individual and group analyses,”
NeuroImage, 85
(Pt 1), 92
–103
(2014). http://dx.doi.org/10.1016/j.neuroimage.2013.07.025 NEIMEF 1053-8119 Google Scholar
M. BrettI. S. JohnsrudeA. M. Owen,
“The problem of functional localization in the human brain,”
Nat. Rev. Neurosci., 3
(3), 243
–249
(2002). http://dx.doi.org/10.1038/nrn756 NRNAAN 1471-0048 Google Scholar
M. OkamotoI. Dan,
“Automated cortical projection of head-surface locations for transcranial functional brain mapping,”
NeuroImage, 26
(1), 18
–28
(2005). http://dx.doi.org/10.1016/j.neuroimage.2005.01.018 NEIMEF 1053-8119 Google Scholar
M. Okamotoet al.,
“Three-dimensional probabilistic anatomical cranio-cerebral correlation via the international 10–20 system oriented for transcranial functional brain mapping,”
NeuroImage, 21
(1), 99
–111
(2004). http://dx.doi.org/10.1016/j.neuroimage.2003.08.026 NEIMEF 1053-8119 Google Scholar
A. K. SinghI. Dan,
“Exploring the false discovery rate in multichannel NIRS,”
NeuroImage, 33
(2), 542
–549
(2006). http://dx.doi.org/10.1016/j.neuroimage.2006.06.047 NEIMEF 1053-8119 Google Scholar
D. W. Shattucket al.,
“Construction of a 3D probabilistic atlas of human cortical structures,”
NeuroImage, 39
(3), 1064
–1080
(2008). http://dx.doi.org/10.1016/j.neuroimage.2007.09.031 NEIMEF 1053-8119 Google Scholar
C. RordenM. Brett,
“Stereotaxic display of brain lesions,”
Behav. Neurol., 12
(4), 191
–200
(2000). http://dx.doi.org/10.1155/2000/421719 BNEUEI 0953-4180 Google Scholar
A. Katagiriet al.,
“Mapping of optical pathlength of human adult head at multi-wavelengths in near infrared spectroscopy,”
Adv. Exp. Med. Biol., 662 205
–212
(2010). http://dx.doi.org/10.1007/978-1-4419-1241-1 AEMBAP 0065-2598 Google Scholar
M. Schecklmannet al.,
“Diminished prefrontal oxygenation with normal and above-average verbal fluency performance in adult ADHD,”
J. Psychiatr. Res., 43
(2), 98
–106
(2008). http://dx.doi.org/10.1016/j.jpsychires.2008.02.005 JPYRA3 0022-3956 Google Scholar
C. Bledowskiet al.,
“Attentional systems in target and distractor processing: a combined ERP and fMRI study,”
NeuroImage, 22
(2), 530
–540
(2004). http://dx.doi.org/10.1016/j.neuroimage.2003.12.034 NEIMEF 1053-8119 Google Scholar
H. Kim,
“Involvement of the dorsal and ventral attention networks in oddball stimulus processing: a meta-analysis,”
Hum. Brain Mapp., 35
(5), 2265
–2284
(2014). http://dx.doi.org/10.1002/hbm.22326 HBRME7 1065-9471 Google Scholar
G. McCarthyet al.,
“Infrequent events transiently activate human prefrontal and parietal cortex as measured by functional MRI,”
J. Neurophysiol., 77
(3), 1630
–1634
(1997). JONEA4 0022-3077 Google Scholar
J. N. Epsteinet al.,
“Relations between continuous performance test performance measures and ADHD behaviors,”
J. Abnorm. Child Psychol., 31
(5), 543
–554
(2003). http://dx.doi.org/10.1023/A:1025405216339 JABCAA 0091-0627 Google Scholar
S. L. NicholsD. A. Waschbusch,
“A review of the validity of laboratory cognitive tasks used to assess symptoms of ADHD,”
Child Psychiatry Hum. Dev., 34
(4), 297
–315
(2004). http://dx.doi.org/10.1023/B:CHUD.0000020681.06865.97 0009-398X Google Scholar
D. R. Coghillet al.,
“Effects of methylphenidate on cognitive functions in children and adolescents with attention-deficit/hyperactivity disorder: evidence from a systematic review and a meta-analysis,”
Biol. Psychiatry,
(2013). BIPCBF 0006-3223 Google Scholar
C. A. Riccioet al.,
“The continuous performance test: a window on the neural substrates for attention?,”
Arch. Clin. Neuropsychol., 17
(3), 235
–272
(2002). http://dx.doi.org/10.1016/S0887-6177(01)00111-1 0887-6177 Google Scholar
C. A. Riccioet al.,
“Effects of stimulants on the continuous performance test (CPT) implications for CPT use and interpretation,”
J. Neuropsychiatry Clin. Neurosci., 13
(3), 326
–335
(2001). http://dx.doi.org/10.1176/appi.neuropsych.13.3.326 JNCNE7 0895-0172 Google Scholar
D. WeissmanG. MangunM. Woldorff,
“A role for top-down attentional orienting during interference between global and local aspects of hierarchical stimuli,”
NeuroImage, 17
(3), 1266
–1276
(2002). http://dx.doi.org/10.1006/nimg.2002.1284 NEIMEF 1053-8119 Google Scholar
K. A. Kiehlet al.,
“An adaptive reflexive processing model of neurocognitive function: supporting evidence from a large scale () fMRI study of an auditory oddball task,”
NeuroImage, 25
(3), 899
–915
(2005). http://dx.doi.org/10.1016/j.neuroimage.2004.12.035 NEIMEF 1053-8119 Google Scholar
M. PetridesD. N. Pandya,
“Projections to the frontal cortex from the posterior parietal region in the rhesus monkey,”
J. Comp. Neurol., 228
(1), 105
–116
(1984). http://dx.doi.org/10.1002/(ISSN)1096-9861 JCNEAM 0021-9967 Google Scholar
M. CorbettaG. L. Shulman,
“Control of goal-directed and stimulus-driven attention in the brain,”
Nat. Rev. Neurosci., 3
(3), 201
–215
(2002). http://dx.doi.org/10.1038/nrn755 NRNAAN 1471-0048 Google Scholar
C. M. Adleret al.,
“Changes in neuronal activation with increasing attention demand in healthy volunteers: an fMRI study,”
Synapse, 42
(4), 266
–272
(2001). http://dx.doi.org/10.1002/(ISSN)1098-2396 SYNAET 1098-2396 Google Scholar
B. A. Ardekaniet al.,
“Functional magnetic resonance imaging of brain activity in the visual oddball task,”
Cogn. Brain Res., 14
(3), 347
–356
(2002). http://dx.doi.org/10.1016/S0926-6410(02)00137-4 CBRREZ 0926-6410 Google Scholar
V. P. Clarket al.,
“Responses to rare visual target and distractor stimuli using event-related fMRI,”
J. Neurophysiol., 83
(5), 3133
–3139
(2000). JONEA4 0022-3077 Google Scholar
R. C. Guret al.,
“Hemodynamic responses in neural circuitries for detection of visual target and novelty: an event-related fMRI study,”
Hum. Brain Mapp., 28
(4), 263
–274
(2007). http://dx.doi.org/10.1002/(ISSN)1097-0193 HBRME7 1065-9471 Google Scholar
K. A. Kiehlet al.,
“An event-related fMRI study of visual and auditory oddball tasks,”
J. Psychophysiol., 15
(4), 221
–240
(2001). http://dx.doi.org/10.1027//0269-8803.15.4.221 0269-8803 Google Scholar
K. A. Kiehlet al.,
“Neural sources involved in auditory target detection and novelty processing: an event-related fMRI study,”
Psychophysiology, 38
(1), 133
–142
(2001). http://dx.doi.org/10.1111/psyp.2001.38.issue-1 PSPHAF 0048-5772 Google Scholar
A. A. Stevenset al.,
“Event-related fMRI of auditory and visual oddball tasks,”
Magn. Reson. Imaging, 18
(5), 495
–502
(2000). http://dx.doi.org/10.1016/S0730-725X(00)00128-4 MRIMDQ 0730-725X Google Scholar
A. F. Arnsten,
“Stimulants: therapeutic actions in ADHD,”
Neuropsychopharmacology, 31
(11), 2376
–2383
(2006). http://dx.doi.org/10.1038/sj.npp.1301164 NEROEW 0893-133X Google Scholar
N. D. Volkowet al.,
“Activation of orbital and medial prefrontal cortex by methylphenidate in cocaine-addicted subjects but not in controls: relevance to addiction,”
J. Neurosci., 25
(15), 3932
–3939
(2005). http://dx.doi.org/10.1523/JNEUROSCI.0433-05.2005 JNRSDS 0270-6474 Google Scholar
A. R. AronR. A. Poldrack,
“The cognitive neuroscience of response inhibition: relevance for genetic research in attention-deficit/hyperactivity disorder,”
Biol. Psychiatry, 57
(11), 1285
–1292
(2005). http://dx.doi.org/10.1016/j.biopsych.2004.10.026 BIPCBF 0006-3223 Google Scholar
F. P. Bymasteret al.,
“Atomoxetine increases extracellular levels of norepinephrine and dopamine in prefrontal cortex of rat: a potential mechanism for efficacy in attention deficit/hyperactivity disorder,”
Neuropsychopharmacology, 27
(5), 699
–711
(2002). http://dx.doi.org/10.1016/S0893-133X(02)00346-9 NEROEW 0893-133X Google Scholar
S. V. FaraoneJ. Biederman,
“Neurobiology of attention-deficit hyperactivity disorder,”
Biol. Psychiatry, 44
(10), 951
–958
(1998). http://dx.doi.org/10.1016/S0006-3223(98)00240-6 BIPCBF 0006-3223 Google Scholar
V. Singh-CurryM. Husain,
“The functional role of the inferior parietal lobe in the dorsal and ventral stream dichotomy,”
Neuropsychologia, 47
(6), 1434
–1448
(2009). http://dx.doi.org/10.1016/j.neuropsychologia.2008.11.033 NUPSA6 0028-3932 Google Scholar
T. W. FrazierH. A. DemareeE. A. Youngstrom,
“Meta-analysis of intellectual and neuropsychological test performance in attention-deficit/hyperactivity disorder,”
Neuropsychology, 18
(3), 543
–555
(2004). http://dx.doi.org/10.1037/0894-4105.18.3.543 NEUPEG 0894-4105 Google Scholar
J. Kuntsiet al.,
“Co-occurrence of ADHD and low IQ has genetic origins,”
Am. J. Med. Genet. B Neuropsychiatr. Genet., 124B
(1), 41
–47
(2004). http://dx.doi.org/10.1002/(ISSN)1096-8628 1552-4841 Google Scholar
M. Denniset al.,
“Why IQ is not a covariate in cognitive studies of neurodevelopmental disorders,”
J. Int. Neuropsychol. Soc., 15
(3), 331
–343
(2009). http://dx.doi.org/10.1017/S1355617709090481 JCENE8 1355-6177 Google Scholar
P. de Zeeuwet al.,
“Differential brain development with low and high IQ in attention-deficit/hyperactivity disorder,”
PLoS One, 7
(4), e35770
(2012). http://dx.doi.org/10.1371/journal.pone.0035770 1932-6203 Google Scholar
B. E. Yeryset al.,
“The fMRI success rate of children and adolescents: typical development, epilepsy, attention deficit/hyperactivity disorder, and autism spectrum disorders,”
Hum. Brain Mapp., 30
(10), 3426
–3435
(2009). http://dx.doi.org/10.1002/hbm.v30:10 HBRME7 1065-9471 Google Scholar
J. van der MeereB. GunningN. Stemerdink,
“The effect of methylphenidate and clonidine on response inhibition and state regulation in children with ADHD,”
J. Child Psychol. Psychiatry, 40
(2), 291
–298
(1999). http://dx.doi.org/10.1111/jcpp.1999.40.issue-2 0021-9630 Google Scholar
T. J. Germonet al.,
“Sensitivity of near infrared spectroscopy to cerebral and extra-cerebral oxygenation changes is determined by emitter-detector separation,”
J. Clin. Monit. Comput., 14
(5), 353
–360
(1998). http://dx.doi.org/10.1023/A:1009957032554 1387-1307 Google Scholar
P. Smielewskiet al.,
“Clinical evaluation of near-infrared spectroscopy for testing cerebrovascular reactivity in patients with carotid artery disease,”
Stroke, 28
(2), 331
–338
(1997). http://dx.doi.org/10.1161/01.STR.28.2.331 SJCCA7 0039-2499 Google Scholar
T. Funaneet al.,
“Quantitative evaluation of deep and shallow tissue layers’ contribution to fNIRS signal using multi-distance optodes and independent component analysis,”
NeuroImage, 85
(Pt 1), 150
–165
(2014). http://dx.doi.org/10.1016/j.neuroimage.2013.02.026 NEIMEF 1053-8119 Google Scholar
H. Negoroet al.,
“Prefrontal dysfunction in attention-deficit/hyperactivity disorder as measured by near-infrared spectroscopy,”
Child Psychiatry Hum. Dev., 41
(2), 193
–203
(2010). http://dx.doi.org/10.1007/s10578-009-0160-y 0009-398X Google Scholar
A. C. Ehliset al.,
“Reduced lateral prefrontal activation in adult patients with attention-deficit/hyperactivity disorder (ADHD) during a working memory task: a functional near-infrared spectroscopy (fNIRS) study,”
J. Psychiatr. Res., 42
(13), 1060
–1067
(2008). http://dx.doi.org/10.1016/j.jpsychires.2007.11.011 JPYRA3 0022-3956 Google Scholar
Y. Inoueet al.,
“Reduced prefrontal hemodynamic response in children with ADHD during the Go/NoGo task: a NIRS study,”
Neuroreport, 23
(2), 55
–60
(2012). http://dx.doi.org/10.1097/WNR.0b013e32834e664c NERPEZ 0959-4965 Google Scholar
P. WeberJ. LutschgH. Fahnenstich,
“Cerebral hemodynamic changes in response to an executive function task in children with attention-deficit hyperactivity disorder measured by near-infrared spectroscopy,”
J. Dev. Behav. Pediatr., 26
(2), 105
–111
(2005). http://dx.doi.org/10.1097/00004703-200504000-00005 JDBPD5 0196-206X Google Scholar
K. Sakataniet al.,
“Effects of aging on language-activated cerebral blood oxygenation changes of the left prefrontal cortex: near infrared spectroscopy study,”
J. Stroke Cerebrovasc. Dis., 8
(6), 398
–403
(1999). http://dx.doi.org/10.1016/S1052-3057(99)80047-0 1052-3057 Google Scholar
BiographyMasako Nagashima received her medical degree from Japan in 2004. She was a resident from 2004 to 2009 and has been a research associate since 2009 in the Department of Pediatrics, Jichi Medical University in Tochigi, Japan. Also, she was a chief of inpatient medicine at the International University of Health and Welfare, Japan, from 2012 to 2013. Her research focuses on neuroimaging studies of neurodevelopmental disorders. Yukifumi Monden received his medical degree from Japan in 2002 and his PhD from Jichi Medical University, Japan, in 2013. His major professional achievements include being the chief intern at the U.S. Naval Hospital, Okinawa, Japan, from 2006 to 2007 and a clinical associate from 2009 to 2012. He is currently an assistant professor in the Department of Pediatrics, Jichi Medical University in Tochigi, Japan. His research focuses on neuroimaging studies of neurodevelopmental disorders. Ippeita Dan received his PhD from the University of Tokyo in 2002. He was a senior research fellow at the National Food Research Institute and an associate professor at Jichi Medical University. He was appointed as a professor at Chuo University, Tokyo, Japan. He has authored 70 peer-reviewed articles attracting over 2000 citations. His research missions lie in clinical application of functional near-infrared spectroscopy (fNIRS), methodological development of fNIRS data analyses, and application of psychometrics for marketing in food-related business. Haruka Dan received her MA in 2001 from International Christian University and PhD in 2005 from Tohoku University, Japan. She was a postdoctoral fellow at the National Food Research Institute and Jichi Medical University, Japan. She is now a visiting assistant professor of Research and Development Initiatives at Chuo University, Japan. She has authored 32 peer-reviewed scientific articles, including 20 top-authored contributions over various topics ranging plant physiology, behavioral food science, and cognitive neuroscience. Daisuke Tsuzuki received his BA in 2000 and MA in 2002 from Nihon University, and PhD in 2012 from the University of Tsukuba, Japan. He was a research resident from 2011 to 2012 and a postdoctoral fellow from 2012 to 2013 at Jichi Medical University, Japan. He is currently an assistant professor in Research and Development Initiatives, Chuo University in Tokyo, Japan. His research interests include studies on computer science, information visualization, and spatial analysis of brain function. Tsutomu Mizutani received his BA in psychology from Rissho University in 2006, MA in education from Ibaraki University in 2008, and PhD in psychology from Rissho University, Japan, in 2012. He is a postdoctoral fellow from 2012 until the present at Jichi Medical University, Japan. He is currently involved in studies of fNIRS-based examination of children with neurodevelopmental disorders, and patients with epilepsy, as well as presurgical functional examination of various brain disorders. Yasushi Kyutoku received his BA in 2001 from the University of Texas at San Antonio, and MSc and PhD in 2007 and 2008, respectively, from the University of Texas at Arlington. He was a postdoctoral fellow in Japan at the National Food Research Institute from 2009 to 2010 and at Jichi Medical University from 2010 to 2012. Currently, he is an associate professor at Research and Development Initiative, Chuo University, Japan. His research focuses on psychometrics and their applications. Yuji Gunji received his medical degree from Japan in 1985 and his PhD from Jichi Medical University, Japan, in 1992. He was an assistant professor from 1994 to 2006, and is currently an associate professor in the Department of Pediatrics, Jichi Medical University (since 2006). He is also a professor at the International University of Health and Welfare, Japan (since 2008). His research interests include studies on the role of angiogenesis in the pathogenesis of cancer. Mariko Y. Momoi received her medical degree from Japan in 1973 and her PhD from Tokyo University, Japan, in 1982. Her professional achievements include being research associate in the Department of Neurology, Mayo Clinic, from 1980 to 1982 and professor in the Department of Pediatrics, Jichi Medical University, from 1994 to 2013. She is currently vice president of the International University of Health and Welfare, Japan, and her research interest is the molecular neuroscience of autism spectrum disorder. Eiju Watanabe received his MD in 1976 and PhD in 1984 from the University of Tokyo, Japan. His major career achievements include being research fellow at the University of Erlangen, Germany, and chairman of the Department of Neurosurgery at Tokyo Metropolitan Police Hospital. He is currently a professor and the chairman of the Department of Neurosurgery at Jichi Medical University, Japan. He is known for his work as an initiator of fNIRS imaging known as optical topography. Takanori Yamagata received his medical degree from Japan in 1986 and his PhD from Jichi Medical University, Japan, in 1993. He was a research associate in the Department of Molecular and Human Genetics, Baylor College of Medicine, from 1997 to 2000. He is currently a professor in the Department of Pediatrics, Jichi Medical University, Japan (since 2011). His research interests include studies on the molecular pathogenesis of autism spectrum disorder, a neurodevelopmental disorder. |
|||||||||||||||||||||||||||||||||||||||||||||||||||||||||||||||||||||||||||||||||||||||||||||||||||||||||||||||||||||||||||||||||||||||||||||||||||||||||||||||||||||||||||||||||||||||||||||||||||||||||||||||||||||||||||||||||||||||||||||||||||||||||||||||||||||||||||||||||||||||||||||||||||||||||||||||||||||||||||||||||||||||||||||||||||||||||||||||||||||||||||||||||||||||||||||||||||||||||||||||||||||||||||||||||||||||||||||||||||||||||||||||||||||||||||||||||||||||||||||||||||||||||||||||||||||||||||||||||||||||||||||||||||||||||||||||||||||||||||||||||||||||||||||||||||||||||||||||||||||||||||||||||||||||||||||||||||||||||||||||||||||||||||||||||||||||||||||||||||||


